
More Related Content
Similar to Calculating the subjective value of information: A formula
Similar to Calculating the subjective value of information: A formula (20)
Recently uploaded
Recently uploaded (20)
Calculating the subjective value of information: A formula
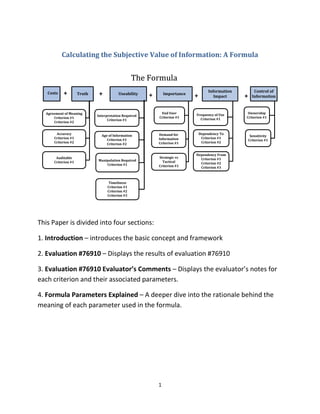
- 1. 1 Calculating the Subjective Value of Information: A Formula + + ++ The Formula Useability Age of Information Criterion #1 Criterion #2 Interpretation Required Criterion #1 Manipulation Required Criterion #1 Timeliness Criterion #1 Criterion #2 Criterion #3 Importance Strategic vs Tactical Criterion #1 End User Criterion #1 Demand for Information Criterion #1 Dependency From Criterion #1 Criterion #2 Criterion #3 Information Impact Frequency of Use Criterion #1 Dependency To Criterion #1 Criterion #2 Control of Information Ownership Criterion #1 Truth Agreement of Meaning Criterion #1 Criterion #2 Accuracy Criterion #1 Criterion #2 Auditable Criterion #1 CostsCosts Sensitivity Criterion #1 + + + ++ The Formula Useability Age of Information Criterion #1 Criterion #2 Interpretation Required Criterion #1 Manipulation Required Criterion #1 Timeliness Criterion #1 Criterion #2 Criterion #3 Importance Strategic vs Tactical Criterion #1 End User Criterion #1 Demand for Information Criterion #1 Dependency From Criterion #1 Criterion #2 Criterion #3 Information Impact Frequency of Use Criterion #1 Dependency To Criterion #1 Criterion #2 Control of Information Ownership Criterion #1 Truth Agreement of Meaning Criterion #1 Criterion #2 Accuracy Criterion #1 Criterion #2 Auditable Criterion #1 Costs Sensitivity Criterion #1 + This Paper is divided into four sections: 1. Introduction – introduces the basic concept and framework 2. Evaluation #76910 – Displays the results of evaluation #76910 3. Evaluation #76910 Evaluator’s Comments – Displays the evaluator’s notes for each criterion and their associated parameters. 4. Formula Parameters Explained – A deeper dive into the rationale behind the meaning of each parameter used in the formula.
- 2. 2 1. SECTION 1 - Introduction How does the Surfer value the next Wave? About 100 yards off the beach a surfer surveys the ocean and its continuing waves. The surfer is evaluating the waves for the one that will provide the best ride. This is a tricky exercise. The waves are not fully formed and are ever changing. The entire setting of this water environment has to be taken into consideration. The strength, height, and direction of the oncoming wave are all parameters in the surfer’s calculations. This assessment becomes even more complex when the experiences of past waves is added to the mix of evaluation criteria. While sitting on their board the surfer can ignore or pass on many waves before trying to ride one. This can be a frustrating exercise as waves that were determined to be insignificant became high riders. The missed excitement can sometimes cloud the decision of evaluating the next series of waves. To keep these missed opportunities to a lesser number, the surfer must have some type of discipline in her determination of the wave’s potential. This is a routine of assigning a value to each aspect of the wave into some form of a calculation. However, there are other characteristics to consider beside the wave’s potential. The strength and direction of the wind, other surfers in the neighborhood, and the surfer’s self-evaluation of her own skill level will weigh on the decision to paddle or pass on the approaching wave. A beginner may easily know which wave to pass on but the intermediate surfer will have the greatest challenge in determining success and disaster. All of these conditions and experiences are considered by the surfer while the oncoming waves are increasing in strength and speed to a decision point. What the surfer is assessing is information. This information comes in various forms as the surfer remembers the results of past waves, the measurement of future waves, and the general environmental factors. All of this information is placed in a framework of perspective. This framework is made up of the expectations or purpose of the coming wave in terms of the surfer. The waves may have different meanings or purposes to other surfers in the area. This framing of parameters in the surfer’s calculation is the scope of the perceptive. Each of these factors are used to assign a combined value to the wave in the
- 3. 3 context of the surfer’s expectation or scope of perspective. The valuation process will continue until the surfer choses the wave to ride. There is no difference whether you are a surfer assessing wave information or a business person assessing the value of their information. Each person or project must place a value on each piece of information in order to arrive at a usable determination. Whether the surfer passes on a great wave or the business person ignores the alerts buried in the reports, the process is the same. What is Information? One important requirement that the surfer has for her information is usability. For example, while the depth of the ocean could be a factor in the determinations, the temperature of the ocean is probably not a consideration factor. There is a vast amount of data that is available to a business person; however, much of this data is a distraction. The main point for the business person to remember is that data is not information. Information is composed of data but data is not information. A single number or character is not information. So, what is Data? Data cannot be touched nor smelled. It can be seen. Data can be created. It can be destroyed and changed once it is created. Data can be used as a means of exchange and it can be sold. 14 This is data but not information. If I state that it is actually a number and not just a character, then it may seem more like information but it is still data. If the “14” as a number or character is placed in one cell of an otherwise empty spreadsheet, then it is still a single element of data. When a column label is added to the column the cell resides in, then the column label and the cell value became information. If the cell’s associated row label were added then the three elements (Row label, Column label, and cell value) would provide a more specific example of information. This process has then created a very simple example
- 4. 4 of information. If we placed “14” on a blank canvas which is then displayed in a gallery, then we could also state that the image is information and perhaps abstract art. Can Information Really Have a Subjective Value? Then in the business world, one asks the question, what is the value of the Information? How many times have you heard the phrase “Information or Data is an Asset”? The Enterprise stores information, hires employees to use information, has processes that create information, cleanse information, analyze information, communicate information, and turns data into information. It seems that Information can be considered an asset just as a building is an asset. Why does an Enterprise not have a formal process to establish the value of information? Perhaps the Enterprise does. From an Information Technology perspective, there are financial costs in terms of programs, hardware, and networks that support the availability and use of information across the enterprise. It is these financial costs that are used to assign a value to the information. From a Business perspective, there may even be some cases where the option of creating revenue from information exists. The sale amount would provide the retail value of the information. However, the usual value of information comes from its use and need within the company. The report that goes to the CEO has a value in that the information is significant to the CEO. The same report to a mid-tier manager may be of less importance. Regardless of the whether the report goes to the CEO or the mid-tier manager, if the report is not available when needed, then its value is lowered. Perhaps a worse situation is when the information is available but it is “old”. The term “Yesterday’s News” implies that the news concerning an event occurring yesterday has less value when presented today. The company should be careful in evaluating the information’s value based solely on its current use in this report. Sometimes past events or past news stories are used to enhance or emphasize current information. This is often the case in media’s anniversary edition issues and congressional hearings. The age of the information is just one subjective area of valuation concerning information. Today decisions are usually based on information. More importantly information has the ability to focus attention from individuals, businesses, schools, governments, etc. Focus attention is subjective in its very nature. By assigning values to the subjective aspects of information, the value can be used to establish a basis for calculations. For example, one
- 5. 5 could calculate the value of information in terms of how many people or processes use or touch a specific piece of information. Therefore, information that is requested or received often has more value than abandoned information which is rarely used. Calculating the subjective value of information is different than its cash value. The cost of information in terms of its storage cost, the computer time that is required to access the information, and others can be calculated in monetary terms. Likewise, the revenue from the sale of the information is also in monetary terms. The subjective values of information are just as important or more important than the information’s monetary cost and revenue. It can be argued that the cost of information would be zero if there did not exist a highly subjective value requirement from the business. If information has a low or zero subject value to the business, then there would be no reason to absorb the cost for information creation or maintenance. If calculating the value of information involves the subjective valuation as well as regular monetary valuation, then how do we bring all of these components together for a specific estimate? This is very much akin to the combining apples and oranges in some recipe. Do the apples equal, lessen, or enhance the value of this bunch of oranges? It requires some type of common denominator measurement to be established. This component must be able to equate the apples (currency) with the oranges (subjective). It is the equalization of components which will allow the business to assign a more precise value. The solution is Token Credits. How Star Trek Helps US When Captain Kirk or a crew member from the Enterprise orders a drink in a galaxy bar, they pay for the drink in terms of credits or tokens. This object represents a common exchange currency without actually being a currency. The currency being exchanged for credits before the request for a drink is made. Therefore, the bar tender establishes a value of the cocktail regardless of the drinker’s home currency. All the other buyers of the same drink know that they paid the same amount for the drink even if they lost money in the currency exchange. The company can use this same technique to establish a common value in determining the value of information while incorporating its monetary and subjective aspects. The subjective value of information can equate to a number of credits. The monetary value of the information can be established by using a simple exchange ratio between one currency unit and one credit. An example could be one currency unit = 2 credits. This would be
- 6. 6 determined at the beginning of a valuation exercise and not changed during the entire exercise. Determining Subjective Information Valuations There is only one situation where Information loses its total value. When it is concluded that not one process will ever use the information, then the information has zero value (Information supports Processes and Processes validate Information). If we are unable to confirm this state of nonuse, then the information will always have some value. Assigning a value to information based solely on its use could easily miss the complex makeup of the information’s value. The makeup of the information’s subjective value in truth, usability, importance, impact, and control is what this formula addresses. For example, if information is classified as “current” such as a daily or morning report and the individual elements within this report are not updated daily, then the information in general could be depicted as not accurate or at worst erroneous. The information, such as a report, is then devalued and perhaps discarded. If the report is refreshed with current data for all of its information components, then it is assumed that the report will have achieved its normal value for that point in time. However, that may not be the case. The trust in the report has been diminished and may never be returned to that original value level. Trust is one the subjective parameter that assigns a value to information whether it is an individual component or the information as a whole. If the report was discarded, did the subjective value drop to zero? Were the information elements assembled in the rejected report now also considered to have zero value? Did the fact that the report actually arrived at the CEO’s desk, assign some level of value to the report? Can the individual components be measured without consideration of the report’s overall value? Logically these types of interactions are very hard to represent in a predicable format. This is why the formula uses a framework of parameters to represent the major subjective factors in subjective value evaluation. To assist the calculation of the information’s subjective value, the formula divides the major factors into parameters. Each evaluator team must create one of more criterion for each parameter. Based on the evaluator team’s judgement, each of the candidate information objects are awarded a number of credits for each criterion. All of these evaluations are dependent on the established Scope of Perspective. In the document, Evaluation #76910, the results of the formula against three company information objects.
- 7. 7
- 8. 8 SECTION 2 - Evaluation #76910 The Subjective Value of the following Information Objects: Dashboard for 2000 Division Store Managers – this information provides a review of ongoing changes in the inventory (coming in and being sold) and the margin of sales on a part of the day update. This report is sourced from one transactional system and the account system. Corporate Office Operating Report – this information is focused on weekly results of sales, product costs, labor costs, finance cost, and various other subject areas that are of interest to the COO. This report is extracted from many different sources and aggregated at the weekly level. Big Data Distribution Pattern – this information would reveal distribution trouble spots. The scope of the data would involve resources (raw material) and their development through the manufacturing process and further to the selling and receipt of the finished products. The data would be generated from sensors embedded in all production process and customer/ vendor feedback through available media such as email, voice response, and various social media platforms. The Results: Information Objects Dashboard COO Production Analysis Parameter Group Parameter Parameter' s Criteria MAX VALUE (Credits) COSTS (converted to Credits) 200 150 700 TRUTH Agreement of Meaning 100 common terms 50 50 50 5 different versions 50 45 50 50 Accuracy 100 actual matches expected 100 80 90 10 Auditable 100 direct sourcing 40 40 15 40
- 9. 9 transformation traceable 40 40 35 40 zero missing connections 20 20 10 20 Total TRUTH Credit 300 275 250 165 USEABILITY Interpretation Required 100 Understandable Language 50 50 50 5 Understandable Acronyms 25 10 25 5 Can the Information be viewed 25 20 25 25 Age of the Information 100 Is all the information current 70 70 60 70 Does the information have long time value 30 15 15 25 Manipulation Required 100 Are further actions on the information required to achieve its understanding 100 75 35 5 Timeliness 100 Is the Information available when it is expected 100 90 80 100 Total USABILITY Credit 400 330 290 235 IMPORTANCE End User 100 Is information designed for a specific position 50 50 50 15 Is the number of End Users large 50 50 10 50
- 10. 10 Demand for Information 200 Is the Information requested 75 75 75 75 Is support funding available (does somebody want to pay for it) 50 50 50 25 Does the Information exist 75 75 50 75 Strategic vs. Tactical 100 Does the Information directly support a Tactical Goal 40 40 40 10 Does the Information directly support a Strategic Goal 40 0 10 40 Does the Informaiton indirectly support a Tactical or Strategic Goal 20 20 20 20 Total IMPORTANCE Credit 400 360 305 310 INFORMAITON IMPACT Frequency of Use 200 How many times is the Information touched (read, copied, etc.) 100 100 25 25 Is the touching group not part of the primary group/ person 25 25 25 5 Is the access frequency consistent 75 75 30 10 Dependency To 200 Is the critical dependency percentage high 80 10 10 60
- 11. 11 How many other information objects are dependent (non- critical) on this information 80 10 10 40 Are there processes that depend on this information 40 40 5 40 Dependency From (could be Negative) 150 What is percentage of dependency from other information objects 75 0 50 0 Is the dependency critical to the information's value 50 0 30 0 Does the dependency enhance the information's value 25 25 0 25 Total INFORMATION IMPACT Credit 550 285 185 205 CONTROL OF INFORMAITON Ownership 100 Does the information object create and maintain the information 75 0 0 0 Is the information shared 25 25 0 25 Sensitivity 100 Can the information be shared outside the enterprise 50 50 50 50 Can the information be shared outside the perspective scope 50 35 0 0 Total CONTROL OF 200 110 50 75
- 12. 12 INFORMATION Credit TOTAL VALUE CREDITS WITHOUT COST 1850 1360 1080 990 TOTAL VALUE CREDITS WITH COST 0 1560 1230 1690
- 13. 13 SECTION 3 - #76910 – Evaluator’s Comments Objects Evaluated: 1. Dashboard for 2000 Division Store Managers 2. Corporate Office Operating Report 3. Big Data Distribution Pattern Scope of Perspective: The Scope of Perspective during this evaluation was set at the enterprise level. All of the evaluated objects have been built, installed, and operational for the last six months. Findings: 1. Parameter – Agreement of Meaning Criterion - Common Terms – Both the Dashboard and the COO Report utilized common company terms in representing their information. Production Analysis’s (Big Data) terms were mostly unfamiliar or were used in collaboration with common terms such that the information was not easily understood. Therefore, both the Dashboard and the COO Report were awarded the maximum credits for this criterion, whereas the Production Analysis was awarded the bare minimum. Criterion - Different Version – The COO report and the Production Analysis were represented with only one version. The Dashboard has two versions currently in use as the current version of the information object had not been installed to all locations. The Dashboard was lightly penalized as the difference between the two versions was minor. 2. Parameter – Accuracy Criterion - Actual Versus Expected – Both the Dashboard and the COO Report information differed from the test results which were compiled manually from the source information. The Dashboard had less accuracy than the COO Report do to some unavailable data from one of its source system. This absence of data resulted in one piece of the Dashboard information to be blank in their presentation screen. The Production Analysis object by its very nature and purpose did not lend itself to having any expected results, therefore, it received a minimum number of credits. 3. Parameter - Auditable
- 14. 14 Criterion – Direct Sourcing – Both the Dashboard and the Production Analysis have direct feeds from their various information sources with zero to very little integration activities. The COO Report has considerable integration activities, as well as, some complex aggregation processes. Criterion – Transformation Traceable – The Dashboard’s acquisition of the source information is straightforward and easily traceable. The COO Report has some minor gaps in the transformation logic that at times leads to inaccurate results. The Production Analysis basically has zero transformation processes with the exception of some data type switches. It should be noted that the Production Analysis pattern recognition process is untraceable except for the data scientist that develop the pattern algorithms. Criterion – Zero Missing Connections – The comments made in the Transformation Traceable criterion apply exactly to this criterion. 4. Parameter – Interpretation Required Criterion – Understandable Language – The Dashboard, the COO Report, and the Production Analysis all use the English language which is the most common language with the Scope of Perspective. Therefore, full credit amounts were awarded to each of the information objects. Criterion – Understandable Acronyms – The COO Report has no acronyms and it received full credit amounts. Many of the Dashboard’s acronyms are unfamiliar to the community within the Scope of Perspectives. This may have been a trade off to the limited space available on the Dashboard’s one display page. The Production Analysis’s acronyms were mostly not understood by the common user and would require translation. Criterion – Can the Information be Viewed – Both the COO report and the Production Analysis object readily display all their information. In a few cases the Dashboard has provided the result of two fields being combined without displaying the fields individually. 5. Parameter – Age of the Information Criterion – Is All the Information Current – Both the Dashboard and the Production Analysis report acquire their data from current information sources. Due to its integration and aggregation processes, not all of the COO Report information is current. Criterion – Does the Information Have Long Time Value – By their very nature the Dashboard and the COO report have very little if any long-time value. The COO report may have some value if a series of past reports are compared. The Production Analysis has some significant value in that its pattern results could establish a benchmark comparison for future results. 6. Parameter – Manipulation Required Criterion - Are further actions on the information required to achieve its understanding – Being as the Scope of Perspective is the enterprise, the Dashboard has the greatest ability to represent its information across the enterprise with no manipulation required. Certain labels and concepts
- 15. 15 are manager specific and so the Dashboard did not receive all available credits. The COO Report was specifically designed for the COO position, therefore, most of the information in the object would not be readily understood by most of the enterprise. Basically, the Production Analysis would be required to convert the information object’s findings into some form that most of the enterprise would understand. 7. Parameter – Timeliness Criterion – Is the Information available when it is expected – Latency in the Dashboard’s processing reflects a less than maximum valuation score. Some information in the COO Report’s integration and aggregation processes cause some delays in the final output of the information’s object. Since there seems to be no SLA for the Production Analysis, it received the maximum number of credits. 8. Parameter – End User Criterion – Is the Information Designed for a Specific Position – Both the Dashboard (for managers) and the COO Report (for the COO) have been created directly for specific positions. With exception of the Data Scientist position, The Production Analysis does not relate to a specific position. Criterion – Is the number of End Users large – In this evaluation the concept of large will approximate any number of End Users that exceed 100. Given this condition, only the COO Report failed to receive the maximum credits available. 9. Parameter – Demand for Information Criterion – Is the information requested – On a consistent basis all of the information object (Dashboard, COO Report, and Production Analysis) are requested. Criterion – Is support funding available – Since all of the information objects are operational, it is assumed that funding was available. The evaluation team extended this criterion to include the prospect of funding for future development or enhancements. Both Dashboard and the COO Report will receive further funding, however, funding for the Production Analysis is not certain. Criterion – Does the information Exist – Both the Dashboard and the Production Analysis acquire data that is presently available. Questions about the arrangement of this information can expose the nonexistence a of desired frameworks but the support information sources are consistent and stable. The COO Report has some areas lacking information because the actual source does not exist in the computing systems. 10. Parameter – Strategic vs. Tactical Criterion – Does the information directly support a Tactical Goal – Both the Dashboard and the COO Report information support Tactical Goals. While it could be argued that the pattern results
- 16. 16 from the Production Analysis information will benefit many Tactical Goal endeavors, its basic design does not support any specific Tactical Goal. Criterion - Does the information directly support a Strategic Goal – The Dashboard information is entirely focused on the tactical aspects. The COO Report information in a limited way supports some Strategic Goals. The Production Analysis information owes its existence to the support of Strategic Goals. Criterion – Does the information indirectly support a Tactical or Strategic Goal – All of the information objects support both tactical and strategic goals. 11. Parameter - Frequency of Use Criterion – How many times is the information touched (read, copied, etc.) – The Dashboard information is accessed almost constantly. The COO Report information is accessed at least once per week and occasionally more times during the week. The Production Analysis is accessed a small number of times. Criterion – Is the touching group not part of the primary group/ person – The Dashboard information and the COO Report information were created for the use of a very specific group and one person. It appears that this information is not shared outside of the designed audience. The Production Analysis is accessed by a very small set of users and is definitely not shared with other groups. In all these cases the information is not shared outside their internal circle, therefore, the valuations are low. Criterion – Is the access frequency consistent – The Dashboard information is accessed constantly. The COO Report is accessed consistently but only a few times per week. The Production Analysis is accessed frequently after its creation but is dormant much of the time afterward. 12. Parameter - Dependency To Criterion – Is the critical dependency percentage high – Other information for the most part are not critically dependent on the Dashboard information. There is even less critical dependency on the COO Report. There are many other information objects that are dependent on the Production Analysis’s information. Most of these dependencies are of a critical nature. Criterion - How many other information objects are dependent (non-critical) on this information – Both the Dashboard information and the COO Report information have a small
- 17. 17 count of other information objects dependent on them. The Production Analysis has many other information objects that rely on its information. Criterion – Are there processes that depend on this information – Both the Dashboard information and the Production Analysis information have several processes that are dependent on their information. The COO Report has one process that depends on its information. 13. Parameter – Dependency From Criterion – What is percentage of dependency from other information objects – Both the Dashboard information and the Production Analysis information rely heavily on other information objects. The COO Report has some dependencies but they have a somewhat muted importance by its integration and aggregation process. Criterion – Is the dependency critical to the information’s value – the other information object dependencies that are associated with the Dashboard information and the Production Analysis information are almost all critical. Only a few of the dependencies associated with the COO Report are critical. Criterion – Does the dependency enhance the information’s value – The value of the COO Report information and the Production Analysis information do not receive any extra value from the information objects that they dependent on. The Dashboard information does receive extra value from some of its source information objects, especially those sources that provide real time metrics from the production line. 14. Parameter – Ownership Criterion – Does the information object create and maintain the information – None of the information objects being evaluated either creates or maintains their source data. Criterion – Is the information shared – Both the Dashboard information and the Production Analysis information is shared. It should be noted that at this early stage of its operational history the Production Analysis information has a lesser broadcast population than the Dashboard information. The COO Report is not shared. 15. Parameter – Sensitivity Criterion – Can the information be shared outside the enterprise – All of the information objects are prevented from sharing their information outside the enterprise. It has been determined
- 18. 18 that all the information objects are in compliance with this company requirement. Therefore, all the information objects were awarded maximum credits. Criterion – Can the information be shared outside the Scope of Perspective – Group restrictions prevent the COO Report information and the Production Analysis information from sharing any information outside of their specific organizational areas. However, the Dashboard is available to some organizations outside of the Scope of Perspective. The evaluators have stated this ability is considered a positive value and appropriate credits were awarded.
- 19. 19 SECTION 4 – Formula Parameters Explained Parameter: Agreement in Meaning In the valuation formula Truth is a group of parameters. This group breaks down into three parameters all of which are subjective in nature. The initial parameter is Agreement in Meaning. The End Users should have a basic understanding of what the data from the information object means. An example where this agreement in meaning comes into play; can be as simple as an input field (box) on an application screen. The input field may have a label such as “Cost”. If the person entering data into this field is not aware of the common meaning or calculation of what cost is, then the information may not be truthful. A business colleague invites you to an art gallery opening. She knows that you are collector of art. The invite is sent through an email (Information) with the name of the gallery and time of the opening. What the invite or attached information does not mention is that this show is very focused on abstract art. Being highly interested in newly discovered art, you show up at the gallery and leave promptly. The cause of this sudden departure was that the only style that you consider “art” is representational. If the email would have mentioned the style of the art, then the email (information) would have been more useful and truthful. As it is, the email is a disagreement in the meaning of Art. Besides Art and emails about art, agreement in meaning can be recognized in terms of reports. When presented with information in the form of a report, the receiver might very well ask what the purpose of the report is. The answer will determine the level of agreement in meaning and subsequently have an effect on the truth of the information that the report represents. Of course, agreeing on the meaning is just the first step in determining the truth of the information. The accuracy of the information may also play a role in the truth of the information. Parameter: Accuracy
- 20. 20 Accuracy is a subjective parameter but it has the ability to be more objective than Agreement in Meaning Parameter. A definition of Accuracy could be the ability to be precise and without errors. So the information in whatever form (report, picture, audio recording, etc.) could be considered accurate, if it is precise and without errors. This assumption is acceptable for an academic environment but in the messy world of business, there is often the need or ability to be accurate within a range. This introduces us into the framework of accuracy as being a match between expects results versus actual results in the form of information. A group of farmers in the states of Minnesota, Iowa, and North Dakota had made predictions about the tonnage of corn that would be harvested that year. This was based on a report coming from various sources. The information will be the basis of the farm group’s commodity future buying as a hedge against a reduction in crop production or price. The actual harvest that year was 15 % less that the predicted amount. Since accuracy is supposed to be precise based on our definition, it would seem that the farm group would discount the report as being inaccurate and not trust worthy (truthful). However, the farm group’s past experience weighed in on the value of the results. Their experience informed them that the margin of difference was “accurate enough”. Therefore, this group had determined the report was truthful and could be trusted. Information in the form of reports is not the only form that information is presented. An image can be a conveyer of information in the form of a photograph, a painting, a blueprint, etc. Just as a report is qualified in terms of its truth in numbers, an image such as a photograph can be assessed to its level of accuracy. A photograph in raw may not be as acceptable as one that gone through a Photoshop process. Photoshop may enhance the final product, but there is an element of deception in this process. The group valuating the information will need to remember the Scope of Perspective when evaluating the deception problem. For example, “touching up” a photograph is performed so frequently in the Fashion and Entertainment environments that it is generally assumed some air brushing has always been applied. This assumption allows the group to not lower the subjective value of the information or image. Other evaluations may reduce the image’s value, if this Photoshop process is used. Photo journalism is high vulnerable if their image is change in some way other than its original form. If the users of this information believe that the photo image in a newspaper has been doctored, then the trust in that specific image can be deemed as untrustworthy and of less value. The lower limit of value may actually be lowered to zero. In addition, images that may be published later may suffer the same valuation level simply by association with the publisher. Many information can be measured and compared against existing results or expected results. All of these activities culminate in the information being validated. The validation may lend itself to the information being considered as accurate. However, accuracy is often in the
- 21. 21 opinion of someone whose criteria for accuracy is not based on measurements or comparisons. The actual users of the information are the final determining factor in declaring information as accurate. The users of the information may be relatively confident that the information is accurate but to be certain the information may have to presented in a certain way. For example, a user given the same information that is used every day may declare the information to be deficient when the information is presented in a different report format. Even though the data is considered accurate, the “information” is perceived as inaccurate. The perception of information being accurate is just as important as the comparison results from the replaced information. Of course, this type of situation is not as frequent in discipline application such as scientific endeavors. There are countless examples of scientific studies presenting their empirical data only to receive remarks from colleagues that their method is faulty and therefore their conclusions are faulty. All this means that their data in not valued because it was under suspicion. If the data has been accurately compiled but the conclusions from the data are considered wrong, then the world does not “believe” in the information. This condition renders the data as not accurate by its association with the presentation. Comparing information from a new system with data from older system is a major way of the business community to determine if the information is accurate or another way of saying that it is validated. However, there may still be doubts especially when it comes to certifying that the information is correct. Another way of determining the accuracy is auditing the data and the process which creates the information. Parameter: Auditable Another parameter that focuses on Truth is Auditability. Nothing establishes the TRUTH of information - more than its ability to have unequivocal references back to Information which has a high degree of accuracy acceptance. Although the context of President Reagan’s philosophy of “Trust But Verify” had a very serious and critical implication, the concept in the valuing of information is very appropriate. If a report has the ability to track its results or conclusions back to a source which stands in high regard, then the report and its information could in the eyes of its users have high credibility. Of course, this coupling can have an unintended effect on the information’s value. If its source loses its value, then the report may also lose a significant portion of its value by association. Auditable information is information that can reveal all the processes and touch points in those processes that are involved in the final result set of data. One major key point in determining a
- 22. 22 score of the Auditable Parameter is reflected in the creation process’s repeatability. This aspect has more to do with an outside observer’s ability to determine if the process has missed a step or short circuited the process. Another major point of auditing is to show how the data got from here to there. It needs to focus on the business rules, assumptions, etc. that are used in the movement or transformation of the data along the process path. Their business rules should be easily available and understandable. The business rules should be in business terms and refer or reference business understanding. If need be the information should have the ability to reflect how, where, and under what conditions the business rules are applied. The end result should keep in focus that information is created and maintained because of a business requirement. If there is not a business requirement, then why is the data created and maintained? In some cases, the tracing can be straight forwarded. A photograph could be traced back to its original SD card which contains the various metrics of the photograph at the exact time of the shoot. So the exposure settings, time, date, etc. can all be verified. The time difference alone could provide enough confidence in terms of a photo running in a newspaper just after the image was captured. Other photo images may have a different burden of proof in their auditability verification. Many times, if information can be traced back to its creator all subsequent auditability questions will become unneeded and perhaps irrelevant. This back testing of the information’s value can sometimes become very complex even if the yellow brick road finally leads to the Oz wizard. If a report or pieces of a report’s information is based from other reports which are not the creator of its information, then in the mind of the evaluator a manipulation process may be involved which can tarnish the information’s value. To be certain of authenticity of the information, an examination of each step or process touching the information’s formation would require a review. That type of extensive tracing would normally require a justification of effort. If the information value is important enough, the auditability effort may indeed be justified. A high score on an audit ability parameter implies that there are no “black box processes”. Those are type of processes that data goes into and somehow magically is formed inside the process and produced as an output of the process. Sometimes this is identified as propriety intellectual property which means that the inside process is not available for inspection. In other situations, the process is available but not understandable. For example, a spreadsheet may be the source of information. Data is either entered into or imported into the spreadsheet. The spreadsheet has a series of macros which combine, manipulate, etc. the data into a series of data points which are visible. This information may seem accurate but not auditable if an observer cannot understand the macro formula. This by no means is meant to infer that spreadsheets as a source are incorrect.
- 23. 23 Many times, the person that compiles information is a recognized subject matter expert. The reputation that follows this person’s information is an enhancement to its validity. Regardless, if the transformation of the data is not understood, then the information cannot be classified as totally auditable. This particular parameter is one of the more difficult parameter to score as it may take a considerable effort to determine its level of compliance. Parameter: Interpretation Required Part of assigning a value of the usability of information is if it is understandable in its current form. If information is packaged, formatted, and presented in a form that every user (Scope of Perspective) can understand the information, then there is no need for interpretation. An extreme example of confusion would be a Power Point presentation that is composed in the Russian language but the intended audience’s native language is Spanish. Except for the “pretty pictures” in the slides, the value of the information would be determined to be of low value. Another example which is less dramatic, would be the use of abbreviations. Chart presentations use abbreviations frequently as they are quite useful. In days of old, legends use to be a standard part of these presentations. Today – not so much. If the audience does not have a reference legend, they have to guess or interpret the meaning of the abbreviations. These cases, is the value of the Chart diminished? It depends on the makeup of the audience or the “Scope of Perspective”. A presentation of Economic Information to a gathering of economist would not have to explain the abbreviation “GDP”. However, the same Chart might not have the same reaction when it is presented to an assembly of production worker supervisors. Before this last group could absorb the Chart’s information, they would have to first interpret the abbreviations. How would the Chart’s information be valued by this group? If a legend had been added to the Chart, would that enhance its value? It would probably increase the value of the Chart by the production workers. However, the economist group might degrade the information’s assigned value because of its “unsophisticated” inclusion of a legend. There are many other aspects of the interpretation for information such as font size, electronic versus printed material, and video versus a single picture. The message of a tragic video may have less impact and less value than a single picture of the event. Watching a video of someone igniting themselves might have less of an impact than a single picture that is the close-up of the victim’s face with textual words off to the side. The information’s value in this case (Scope of Perspective) is the creator – not the distributor. The underlining “data” was the same. The single picture was just one frame in the video.
- 24. 24 Interpretation and manipulation of information can be considered closely related while assigning values. The processes are different yet it seems that the manipulating information process might follow interpreting the information process. Parameter: Manipulation of Information There are times when information by itself or in its current form does not convey its true value. For example, the raw data of a scientific experiment or study may not be valued as much to the general audience as a visual presentation of its findings. TED presentations are a frequent example of this situation. Manipulation is not the same as interpretation. It means that information needs to be re- configured, disassociated, or associated with other information to be usable. This means that the value of the information by “itself” was not significant to stand alone. This will influence the value of that information. Adding other information to an existing information object can be an enhancement. For example, Profit/ Loss information is presented to a CEO from two different sources. The information from each of the sources is highly valued as to their audibility and accuracy. The information required no interpretation. The resulting figures are an extremely close match. Presented separately, the information would achieve a certain level of value per its Scope of Perspective audience. However, combining the separate information assets together into one information may have exploded the information’s value upward. Arriving at the same conclusions from two different sources allows additional trust and confidence in both information assets. Presenting the information together, which is manipulating the information, increased its value to the CEO. There are many examples of manipulating information that decreases the value of the information. The scientific experiment could be a very simple example. The data and conclusions of the findings are combined into a report/paper. At this point none of the data is changed or manipulated. Therefore, the initial value of the experiment’s “data” flows to the report/ paper which is an information asset. The problem arises when some of the experiment’s data are omitted from the report/paper. Once this fact is discovered the report/paper’s information value is diminished. Additionally, the experiment’s data (information) may also be diminished by association. Thus the manipulation of information can have a negative effect. Another example can reflect both a positive and negative value assessment of a specific type of information. A magazine has finished with a photo shoot for an advertisement. The raw photo has been valued high by the production crew as to its auditability and accuracy. The photo
- 25. 25 stands alone without the need for interpretation. However, the editors and advertisers are not completely satisfied with the photo. The raw photo as information to the advertiser is not of high value. The photo is brought into Photoshop software and certain aspects are air brushed to produce the final image. The advertisers now value the new, manipulated information with a higher value than before. Once the image is release during the advertising campaign, the manipulation is unexpectedly disclosed and critics value the information (image) as having a low value. This might have been a concern to the advertisers except that the public (target audience) rated the advertisement as extremely high just as the advertisers did. The information (image) in its release garnered both high and low values. The difference between the two assessments was the audience or Scope of Perspective. Manipulation of Information should be carefully considered within the value of other parameters. If some information is scored (valued) low on accuracy and audibility, then this information is joined or associated with another piece of information. The newly formed information may be hindered in its valuation by its association with the low scoring information. It is like putting lipstick and make-up on a pig assuming the pig’s normal appearance is not highly valued. Parameter: Age of Information The age of information can decrease or increase the value of the information. If you have a report (say an Excel file) which is reviewed daily, then day old information within this file would reduce the value of this report. Yet it would not be considered worthless information. The situation becomes more complex when the information object is a combination of several sources. Even though the report is expected to be current not all of the data is current. For example, some of the data in the report is constant such as the 2010 population census for a specific area. This stable data is combined with the daily sales figures for a series of retail stores located within this same area. This report bases several calculations on these two pieces of information. The effect of this situation reveals that the report is not completely current and thus inaccurate. Its value is lowered. Yet, the receiving information (report) is not at fault except for its use of the aged information. If the report would have had an additional data element or label which reflected the age of the combined information, then the value of the information might not have suffered a lowering of its value.
- 26. 26 Another misconception is that older information is of less value than current information. In most uses of information, this attitude may be correct, however, this assumption can be disastrous in other situations. For example, there is one figure in a file that is almost one-year- old and has been used in almost the same time. Although not considered useless, maintenance personnel may have this file scheduled for deep archive or worse deleted entirely. The problem with removing this file is that it documents the accounting closing figures for inventory of the previous year. This means that inventory calculations of the current year will be highly dependent on the closing figures from the previous year. Therefore, in specific Scope of Perspective areas this infrequently used file has an associated high value. Parameter: Timeliness The Age of Information is not the same as the Timeliness of Information. If information is expected to be present at a specific point in time, then its value may increase or decrease as its time of availability is observed. One may review this as a process problem or process status but really it is whether the information is present or not. Information expected but not present is not really usable. One example involves airline travel. From the traveler’s point of concern (Scope of Perspective) the status of their flight departing on time, delayed, or cancelled is quite important. Whether the information is conveyed with a large overhead or a phone app update, the timeless of this information is of high value. If your flight is scheduled to depart in 40 minutes with a tight connection at the next airport, then the lack of a timely status update increases the pressure on an alternative decision. Does the traveler continue to wait hopefully on the original flight or does she beat the crowd to the customer service desk to find an alternative flight to the final destination? Announcing the cancellation of the flight at the schedule time of departure allows the information to have an almost zero value to the travelers. Subsequently after the passengers have board the airplane the value of the boarding information is of less importance. However, the departure time information is still of high value to those individuals that have connecting flights. A different example of timeliness of information comes from space shuttle launches. In days of past, each launch had three CPUs that continuously monitored the critical status of the launch systems. These devices were highly dependent not only on the accuracy of their information feeds but the timeliness of the information. Each system had the ability to stop the launch seconds before the ignition event was started. It is assumed that the CPU feed information is
- 27. 27 always accurate. The critical factor is the timeliness of the information. If there is any delay (fractions of a second) with the data feed, then it may not be able to terminate the launch. Parameter: End User The valuation of Information is incomplete unless the valuation calculations considers the END USER of the Information. For example, the captured performance metrics of a machine in the production line may have significant value to the line supervisor. However, to the COO the information might be supportive but not necessarily informative. Assigning the value of information to an END USER can be tricky because the person performing the valuation is most likely “not” the END USER. The criteria used in the END USER parameter should focus on the functions of the End User’s position. Does the information directly affect the functionality of the End User’s position? Can a commercial pilot fly a plane when a flight plan has not been submitted? Can a court issue a judgement if there is no paper trail? Another aspect of END USER valuation would be whether the information is usable for the specific position that the End User performs. Information provided to an End User during an action event normally are short and to the point. Audible information between mass transportation vehicles (airplanes, trains, etc.) and their controllers are examples. After landing his plane, receiving taxi instructions in a one-page PDF would be of less value than the cryptic series of pathway instructions which are normally provided by ground control. Parameter: Demand for Information The Demand for Information is different than the Frequency of Use. Demand establishes the actual need or lack of need for Information. If a set of Information is considered to be obsolete, then there may no demand for the information. In such a scenario, the parameter’s assigned value would be quite low or perhaps zero. Likewise, if there are many requests for that set of Information, then the Demand is high and the valuation would also be high. There may be some special situations where the assignment of the valuations could be tricky. There could be a significantly large number of request for some specific information. The
- 28. 28 problem is that the requested information does not actually exist with the company’s system. Can non-existent Information be assigned a value? In addition, there are times when a Demand should be qualified before assigning a value designation. The Information Demand from an internal organization or individual might be more on the curious side rather than a serious need. Inserting some parameter criterion such as “is funding available for the acquisition of the Information” might flush out the motivation behind the request. The response to this criterion could provide more credit to the overall valuation of the Demand for Information. Parameter: Strategic vs Tactical When assigning value to Information, there are times that an evaluator must take into account the big picture. Does the Information support a Tactical goal or perhaps a Strategic goal? In many cases the Information can support both Tactical and Strategic? It is up to the evaluators to assign the value in direct proportion to how directly the Information supports a goal. In addition, it should not be assumed that supporting a Tactical goal is less valuable then supporting a Strategic goal. The valuation will depend in the evaluation’s Scope of Perspective. Parameter: Frequency of Use One of the clearest indicator which indicate the value of Information is how often it is used. The number of uses or “touches” will emphasizes the Information’s importance. However, this calculation could be deceptive. One piece of Information may be quite valuable to a specific segment of the company. The value shows a high frequency in that it is used hundreds of times each day. The record revels that the total number of touches from the group’s accounts for 98 percent of its use. The deceptions come in to play, if the Scope of Perspective is the enterprise and not that specific group. Therefore, there should be more evaluation criteria that reflects the frequency of use valuation. For example, is the pattern of touching (number of accesses) consistent over a certain time period? This indicates if the Information is a fad or a fundamental and consistent need for this Information. Parameter: Dependency To Just as clusters of data together form Information, there are times when various Information joins with other Information sets to form a new Information. This new Information is dependent on its parts. For example, a report may be comprised of two pieces of Information.
- 29. 29 There is one major source and a minor one that provides the missing Information for a critical calculation within the report. The report would be useless and of no value without this minor fragment. The fact that this new Information like a report, absolutely requires the minor Information raises the value of the minor Information. This dependency value can be calculated by the number of other Information (reports, dashboard, etc.) is dependent and the minor Information. Another criterion is the percentage of dependency that is found in the dependent Information. If the minor information is used only as an add-on summary of data, then its value would be less. Parameter: Dependency From This parameter is the only valuation section that can be assigned a negative number. Whereas the minor Information in the Dependency To parameter may gain value from the dependency parameter – Information applicable to the Dependency From parameter generally loses value. The negative value amount will increase, the more critical the Information dependency is. Information that has no dependency would display zero values for this parameter. However, some situations of dependency actually increase the subjective value. When a dependent information object is universally considered to be of high value, then that assessed value may increase the value score of the receiving or dependent information object.
- 30. 30 Parameter: Ownership So, what is ownership? Ownership of information can be characterized as to when the person or the organization creates or maintains the information for users. In general, the subjective value of information that is maintained by its original creator increases. This direct connection without intermediaries also can enhances the auditability and accuracy values. The other aspect of Ownership is in the control of information. The Owner has the right to manage access to their information. If access is given freely to any organization or person without limitations, then the control of access is not a factor when considering the Ownership value of the information. In some cases, the information owner restricts access to the information. If the information is in high demand, then the control of the information can morph into a Chiefdom characterization. Since information as an asset has value, a Chiefdom that has amassed control of a large amount of information could be considered “rich”. Those Persons or Organizations which have little or no control of data are considered to be “poor”. The poor could also include the actual owner of the data if they have relinquished most of their control of the information. Whether such a situation is perceived as a positive value, would be determined by the evaluators and their designed criteria for this parameter. Often times an organization’s process of allowing information access is observed to be the Owner. In many of these cases, a specific Information Technology person, who can provide access to information, is identified as the Owner. The true Owner is expecting the Information Technology personnel to become the Custodian of their information. The Custodian has the responsibility to design, implement, and maintain the infrastructure or system where the information is stored for the Owner. Often these custodian responsibilities include maintaining the request system that controls access to the information. The responsibility is not Ownership but it sure appears to be. Parameter: Sensitivity It might be said that the best locations for surfing would be kept for the few in a group and not shared with the other surfers. If this were true, then the information that the group withheld would be considered sensitive. The information would also be considered valuable within and perhaps outside of the group. Once the secret or information was leaked, then its value would be less valuable as it would be more available. This reduction of the information’s value is due
- 31. 31 to the breakdown of security. What was once a hidden or closely guarded piece of information now has a wider audience. Of course, in the business world the sensitivity of information can come in many forms. The unexpected release of financial information can have major impacts on a business and reduce the value. However, the day or hour after the release of the information, the value of that information is less. This concept can be factual only within a certain Scope of Perspective. In another perspective the availability of information within an ever expanding audience might well increase the information’s value. Often the aspect of sensitivity is less concerned with the release or sharing of some information outside the business than within it. One department may have to report its numbers in a series of informational reports but it does not want to share that information with other departments. This impacts the value of the information in terms of being sensitive. This concept is applied at the basic level in applications where all departments have access to a reporting application but not all that information is available for viewing or reporting. The Omaha Department Store’s monthly sales are not available for review by the Denver Department Store. However, it could be available for the manager that supervises both the Omaha and Denver stores. There is another aspect of the Sensitivity in its relationship to its age. Many classified documents are released after a 20-year period. It is assumed that after 20 years of non- availability the information no longer is sensitive, at least from the government’s perspective. This release of information reflects that the information has zero or near zero value. Perhaps there are many historians that would be interested in this information which would provide low values instead of zero. In terms of business there may be many pieces of information that are still sensitive and therefore valuable even after long periods of time. Examples are discovered when businesses are very busy shredding documents in the late night hours. The value of sensitive information can also be taken from the release of sensitive information in the act itself. Perhaps we can assume that all the documents that Edward Snowden released were not necessary sensitive. However, the channel in which those documents were transmitted was super sensitive. Therefore, a document that was normally considered less than sensitive, is now considered sensitive because of its association with the release process. Its value has increased because of this association. All of the documents in the Snowden’s release may have lost some of their value, at least from the government’s perspective. Yet from the media outlet perspective, the values of those documents are of high value after the release.
- 32. 32 The surfers that have so carefully retained the sensitivity of the special location for surfing will be surprised at the drop of the value of their information when they discover their location is included in the “the best surfing spots” map being sold at the local filling station.