Determination of pH, Dissolved Oxygen, Sulphate, Phosphate and Total Hardness...
kohnthesis_FINAL
1. 1
Nitrogen and Phosphorus Enrichment Effects on Nutrient Supply in Reservoirs: a Small-
Scale Approach
An Undergraduate Honors Thesis
in the
Department of Crop, Soil, and Environmental Sciences
Submitted in partial fulfillment of the requirements for the
University of Arkansas
Dale Bumpers College of Agricultural, Food and Life Sciences
Honors Program
by
Jessalyn Kohn
May 2016
__________________________________________
Dr. J. Thad Scott, Ph.D., Chair
__________________________________________
Dr. Kristofor Brye, Ph.D.
__________________________________________
Dr. Lisa Wood, Ph.D.
2. 2
I. Summary
Eutrophication is a problem in many lakes, but the reduction of nutrient inputs such as
nitrogen (N) and phosphorus (P) to combat eutrophication can lead to an oligotrophic state,
which may be unable to support healthy aquatic ecosystems. This study examined how different
rates of chemical fertilization with N and P during times of nutrient limitation (mid-summer)
could affect particulate N and C concentrations in four lakes in northwest Arkansas. Fertilization
experiments were conducted in microcosms during the month of July 2014. Water samples from
each lake were collected and divided into six treatments: control, P-only, N:P 10, 20, 40, and 80.
Concentrations of particulate N and C were quantified using elemental analysis. For each lake,
particulate N and C generally increased as N:P supply increasedThe lack of a significant
difference between higher level N:P treatments (N:P 20 and 40 versus N:P 80) suggests on a
whole-lake scale, a lower rate of fertilizer addition can be used and still achieve the same effects
seen with greater N:P treatments.
II. Introduction
Worldwide, there are very few water bodies left unaffected by anthropogenic activities
(Smith et al 2006, Thompson 2013). One of the most common problems facing water bodies
today is eutrophication, the enhanced concentration of nutrients (Smith et al 1999, Anders and
Ashley 2007, Smith and Schindler 2009). There are many detrimental effects of eutrophication to
water bodies including increased occurrence of harmful algal blooms (HABs), reduction in
species diversity, oxygen depletion, and decreased aesthetic qualities, to name a few (Smith and
Schindler 2009). Eutrophication is a natural process in some ecosystems; however,
anthropogenic effects on the nitrogen (N) and phosphorus (P) cycle have been implicated
3. 3
worldwide in dramatic changes to aquatic ecosystems (Smith et al 1999, Elser et al 2007).
Though naturally N and P are limiting nutrients for primary production, amplification by human
activities of the global N and P cycles of 100% and 400%, respectively, has fueled excessive
production in many ecosystems in the process referred to as cultural eutrophication. (Elser et al
2007, Smith and Schindler 2009).
While N and P are often gain attention for their detrimental effects on aquatic
ecosystems, both of these nutrients are essential in some amount to support healthy and diverse
aquatic food webs. (Elser et al 2007). In addition to other functions, N is necessary for protein
synthesis, while both N and P are essential components of DNA (Conley et al 2009). Nitrogen
and P are critical for phytoplankton growth, which are the base of most aquatic food webs.
Nitrogen and P are the principal nutrients regulating primary productivity and thus higher trophic
level biomass in aquatic ecosystems (Smith 1982). Phosphorus has previously been identified as
the main nutrient limiting primary production in lakes (Schindler 1977), as fish biomass is
positively correlated with P level in lakes (Ney et al 1990). However, recent studies have shown
that N can be equally or even more limiting (Elser et al 2007). If N and Pare not present in
sufficient amounts to support healthy phytoplankton growth, then higher level food webs cannot
be supported (Lindemann 1942, Ney 1996).
In conjunction with the passing of the Clean Water Act forty-two years ago (Clean Water Act
1972), water quality management largely shifted to a reduction of these naturally occurring
nutrients, a process referred to as cultural oligotrophication (Anders and Ashley 2007). With this
trend, the beneficial effects of N and P on aquatic ecosystems are largely ignored in favor of
limiting nutrient inputs in order to have clear water that is aesthetically pleasing (Anders and
Ashley 2007). The passing of the Clean Water Act required states to designate uses for their
4. 4
lakes and streams and then design and implement standards to support those uses (Clean Water
Act 1972). If a lake is designated for primary contact recreation or for drinking water, then
working to reduce the external nutrient load to that lake will help achieve that goal. In this case, a
clean appearance may be much more important than a healthy, productive ecosystem. However,
many water bodies designated for primary contact recreation or for drinking water are also used
for recreational fishing, a sport that contributes billions of dollars annually to the United States
economy (American Sportfishing Association 2012). Low nutrient concentrations are
undesirable if those lakes are also designated to support aquatic life (Boyd and Sowles 1978). In
instances where these uses collide, stewards of water bodies encounter the Clear Water Paradox:
Users of these water bodies want the benefits of ecosystem services such as healthy fish
populations, but also want to see clear, aesthetically pleasing waters. These benefits are often
limited by water quality standards that limit biological productivity (Anders and Ashley 2007).
In such lakes with multiple uses, a balance must be struck between extreme algal growth as a
result of excessive primary production and nutrient-poor waters unsustainable for healthy, robust
fish populations (Ney 1996). In these cases, it is necessary to manage water quality for
conditions supporting all of the uses for which the water body is designated.
The trophic state is the level of biological productivity of both plants and animals in an
ecosystem (Carlson 1977). The continuum of trophic states is divided between oligotrophic,
mesotrophic, and eutrophic (Carlson 1977). Criteria have been developed for classification of
water bodies into trophic states based on relationships between Secchi depth, chlorophyll-a (chl-
a) concentration, and total phosphorus (TP) concentration (Carlson 1977, Smith et al 1999)
(Table 1). Oligotrophic lakes are characterized by low annual water temperature; short,
unproductive growing seasons; underlying granite bedrock; and relatively nutrient-poor
5. 5
watersheds, leading to extremely clear, nutrient poor water (Anders and Ashley 2007). Eutrophic
lakes are characterized by elevated nutrient loads from the surrounding watershed; long, highly
productive growing seasons that encourage the growth of nuisance aquatic plants and algae; and
greenish-brown water that may look, taste, and smell bad (Anders and Ashley 2007). The middle
ground is mesotrophic: lakes that exhibit characteristics of both oligotrophic and eutrophic lakes,
and thus can support a variety of designated uses. Therefore, today many fisheries managers
manage nutrient levels to achieve mesotrophic conditions in lakes with multiple designated uses.
(Stockner et al 2000, Thompson 2013).
Mesotrophic lakes usually support adequate primary production and thus can support higher-
level food webs without fueling excessive growth (Stockner et al 2000). However, the
implementation of a lake fertilization plan not only requires solid understanding of the effects of
nutrient additions will affect lake conditions, but also represents a significant economic cost.
Thus, before adding nutrients on a whole-lake scale, it is necessary to have some prior
knowledge and understanding of the extent of the lake response to fertilization treatments at
varying rates in order to avoid over-fertilization and wasted resources. Numerous small-sale
laboratory fertilization experiments have been conducted to examine nutrient limitation
(McDiffett 1980, Elser et al 2007). Though there has been some consensus that the results of
such small-scale laboratory experiments do not take into account long-term effects on the lake
ecosystem (Schindler et al 2008), employing small scale studies before applying nutrients on a
whole-lake scale can be valuable in informing water quality and fisheries managers on possible
whole-lake response to nutrient additions (Schindler 2012). By conducting small-scale
experiments before fertilization, not only can unforeseen environmental consequences of
fertilization be limited, but excessive economic costs can be avoided.
6. 6
III. Objectives & Research Hypotheses
The objective of this study was to explore the effects of varying rates of N and P fertilizer
additions on primary production using microcosm experiments with water from four nutrient-
managed lakes. The specific goals of the study were to 1) assess the potential effects of chemical
fertilizer additions on particulate N and C in four lakes and 2) determine an optimal rate of
fertilization in each lake. The data collected to achieve these goals came from microcosm
biomass data. The main hypothesis for the study was because of mid-summer nutrient limitation,
increase in the rate of N:P chemical fertilization will cause increase in particulate N and C. A
secondary hypothesis based on the findings of Elser et al 2007 was simultaneous inputs of N and
P will result in a greater response in particulate N and C concentrations than P additions alone.
IV. Materials & Methods
Study Sites
The study was conducted in four recreational sport fishing reservoirs in the Little Sugar
Creek watershed of Northwest Arkansas (Figure 1). Lake Ann (36°28'23.98"N, 94°13'30.07"W),
Lake Avalon (36°28'20.39"N, 94°16'20.46"W), Lake Lomond (36°28'3.80"N, 94°19'37.07"W),
and Lake Windsor (36°27'21.09"N, 94°15'48.20"W) (Figure 2) are owned and managed by the
Bella Vista Property Owners Association (BVPOA) to support multiple recreational use and
meet state water quality standards for primary contact recreation as stated by the Arkansas
Pollution Control and Ecology Commission Regulation 2 (Nutrient Management Plan for Bella
Vista Lakes 2010). While the Bella Vista lakes are technically man-made reservoirs, they are
subject to the same biological, chemical, and physical characteristics of natural lakes (Rast and
7. 7
Straškraba 2000) and water quality is measured using the same parameters as in natural lakes.
They have the characteristic dendritic shape of reservoirs and represent an intermediate aquatic
system between a flowing water body and a lake, with more riverine characteristics towards the
upstream end of the reservoir and more lacustrine characteristics downstream towards the
dammed end (Rast and Straškraba 2000). Water sampling for this study took place in the
lacustrine zone near the dammed end of these reservoirs. For names sake, the reservoirs in Bella
Vista include in this study are henceforth referred to as lakes. The lakes vary greatly in their size
and watershed area and characteristics (Table 2). In the 1990s, the BVPOA began managing the
lakes with chemical fertilizers to increase biological productivity, but fertilization ceased in 2002
because of over-fertilization leading to poor water quality and complaints from property owners.
After 2002, data showed that biological productivity and fisheries in the Bella Vista lakes had
decreased as a result of the reduced nutrient inputs. Past data has indicated that these reservoirs
become limited in nitrate (NO3) during the summer months, prompting the need for chemical
fertilization (Figure 3, 4) and indicating the need for a nutrient management plan that supports
healthy fisheries while balancing other uses such as swimming, boating, and aesthetics. The
current nutrient management plan was implemented in 2010 and includes consistent water
quality sampling and nutrient management based on monitoring data (Nutrient Managemnt Plan
for Bella Vista Lakes 2010).
Experimental Design – Microcosm Fertilization Experiments
Microcosm experiments were conducted in July of 2014 to observe the effects of
fertilization on biological productivity during the growing season. Temperatures in July 2014
were about 3ºC cooler than the 30 year climatology and precipitation was about 5 cm less than
8. 8
average (U.S. Climate Data 2016, Weather Spark 2016) (Table 5, Figure 5). During routine
water quality sampling as part of the BVPOA Nutrient Management Plan, vertically-integrated
water samples from the photic zone of each lake were collected using a 4-L Van Dorn horizontal
sampler (Alpha water sampler, Wildco, Yulee, FL) to create a composite sample. The composite
sample from each lake was divided into 18 1-L cubitainers with triplicates of each fertilizer
treatment: control, P-only, and N:P 10, 20, 40, and 80. Nitrogen and P were added from stock
solution based on each lake’s initial Secchi depth and total N (TN) and total P (TP) and target
N:P (Table 6, 7). The volume of P added was kept constant and volume of N added was changed
depending on the N:P treatment. The microcosms were then randomly assorted and placed in a
water bath with overhead UV lighting to stimulate phytoplankton growth. The Secchi depth at
the time of water collection was used to calculate the initial TP concentration and initial
chlorophyll-a concentration based on the Carlson Trophic State Index (Carlson 1977) and initial
concentrations of particulate N and C were found using elemental analysis (NC Soil Analyzer,
Flash 2000 Organic Elemental Analyzer, Thermo Scientific, Lakewood, NJ) (APHA 2005)
(Table 8).
The cubitainers were incubated in the water bath for six days with in-vivo fluorescence
samples from each cubitainer measured on the date of the initial experimental setup and every 1
to 2 days during experiments. When in-vivo fluorescence measurements began to indicate a
decline in phytoplankton biomass, the microcosm experiments were concluded (Figure 6). Fifty
to two hundred mL of water from each cubitainer was mixed and filtered for analysis of
particulate C and N content using elemental analysis. The effect of fertilization rate was tested
using a one-way ANOVA using SAS 9.3 (SAS Institute Inc. Cary, N.C.) with a threshold p-value
of 0.05..
9. 9
V. Results
In the Lake Ann microcosms, particulate N concentrations generally increased with
increased N:P supply. Significant increases in particulate N occurred between the control and P-
only treatments, the N:P 10 treatment, and the N:P 20, 40, and 80 treatments (Figure 7, p-value =
0.0003). The N:P 10 treatment did not differ from the control and P-only treatments or the N:P
20, 40, and 80 treatments. Particulate C in the Lake Ann microcosms also increased with
increased N:P supply. There was no increase in particulate C between the control and P-only
treatments or the P-only and N:P 10 treatments, but the N:P 20, 40, and 80 treatments increased
from the control, P-only, and N:P 10 treatments (Figure 7, p-value = <0.0001) . There was no
pattern between treatments regarding the C:N ratio from the microcosm samples, and there was
no difference between the C:N of any of the groups (Figure 7, p-value = 0.4617).
The microcosms from Lake Avalon showed a similar pattern to that of the Lake Ann
microcosms. There was no increase in particulate N between the control, P-only, N:P 10, 20, and
40 treatments. The N:P 80 treatment increased over the control and P-only treatments, but not
from the N:P 10, 20 and 40 treatments. (Figure 8, p-value = 0.0146). Increases in particulate C
were measured between the control and P-only treatments and the N:P 40 and 80 treatments,
with no difference in the N:P 10 and 20 groups from either the control and P-only treatments or
the N:P 40 and 80 treatments (Figure 8, , p-value = 0.0031). Again, there was no obvious pattern
between treatments for the C:N ratio and all treatments were similar (Figure 8, ,p-value =
0.1630).
In Lake Lomond microcosms, there was not as strong of an increasing pattern between
treatments and there was no increase in particulate N between the control, P-only, N:P 10, 20,
10. 10
and 40 treatments. The N:P 40 and 80 treatments were the same, but the N:P 80 was the only
treatment that had any increase from the control treatment (Figure 9, , p-value = 0.0044).
Particulate C in the Lake Lomond microcosms increased with increasing N:P supply. The control
and P-only treatments and the P-only, N:P 10, 20, and 40 and N:P treatments were not different
However, the particulate C in the N:P 80 treatment was greater than all other treatments (Figure
9, p-value = <0.0001). Carbon:N again showed no difference between treatments (Figure 9, p-
value = 0.1584).
In the Lake Windsor microcosms, there was no difference in particulate N between the
control, P-only, and N:P 10 treatments and no difference between the N:P 10, 20, and 40
treatments. Particulate N in the N:P 20, 40, and 80 treatments was also similar, but particulate N
in the N:P 80 was greater than the control, P-only, and N:P 10 treatments (Figure 10, , p-value =
0.0003) . There was not a strong increasing trend in particulate C with increasing N:P. The P-
only treatment was lower than the N:P 80 treatment were different from each other; otherwise
the treatments were all similar (Figure10 , p-value = 0.0492). Only the microcosms from Lake
Windsor showed a significant difference in C:N. Phosphorus-only, N:P 10, and N:P 20 were all
than the control (Figure 10, p-value = 0.0144).
VI. Discussion
. Results showed that additions of both N and P chemical fertilizers in the microcosms
increased both particulate N and C in these reservoirs during the month of July, when nutrient
concentrations are especially limited. In general, as the added N:P supply in each microcosm
increased, the particulate N and C increased as well, showing that in general, on a whole-lake
11. 11
scale, these reservoirs would most likely show a nutrient level response proportionate with
fertilization rate.
Among the moderate (N:P 20 and 40) and high( N:P 80) treatments, there frequently was
no difference between different rates of fertilization on particulate N and C. For example, in the
Lake Ann microcosms, there was no increase in particulate N between the N:P 10, 20, 40, and 80
treatments, and with particulate C there was no increase between the N:P 20, 40, and 80
treatments. A similar pattern was seen in the Lake Avalon microcosms where there was no
increase in particulate N between the N:P 10, 20, 40, and 80 treatments, and no significant
difference in particulate C between the N:P 10, 20, 40, and 80 treatments . Lake Lomond
microcosms showed an increase in particulate N from the control at the N:P 40 and 80 treatments
and an increase in particulate C at the N:P 80 treatment. The Lake Windsor microcosms also
followed a similar pattern in which there was no increase in particulate N between the N:P 20,
40, and 80 treatments and no difference in particulate C between the N:P 10, 20, 40, and 80
treatments.
From this pattern, it may be possible that a moderate fertilization rate such as N:P 20 or
40 has the potential to achieve the same effects on nutrient supply as a higher fertilization rate
such as N:P 80 in these lakes. By fertilizing at the lowest rate needed to produce a positive
response, the risk of over-fertilization can be avoided, thus avoiding the possibility of over-
production leading to eutrophic conditions and the negative consequences accompanying it.
Besides environmental problems and avoiding complaints from property owners regarding HABs
and unpleasant look and smell, using the lowest rate of fertilization needed to produce a positive
response can also greatly reduce economic costs. At the time of this study, the BVPOA was
using a combination of Dunn’s ‘Trophy Grower’ liquid pond fertilizer (10-34-0) with a
12. 12
recommended application rate of 1-2 gallons per surface acre and a cost of $12.95 per gallon
(Dunn’s Fish Farm 2016), as well as a dozen to hundreds of bags of urea fertilizer (46-0-0), of
which the commodity price of a 50-lb bag in July 2014 was about $8 (IndexMundi 2016). Added
together, the cost of fertilization in these reservoirs during the summer months could be
anywhere between about $2,500 at the lowest fertilization rate of N:P 10 in Lake Avalon to over
$100,000 at the highest fertilization rate of N:P 80 in Lake Lomond (Table 9). Thus, there is a
definite economic benefit to gathering information on a smaller, less-expensive scale regarding
how these reservoirs may respond to chemical fertilization and the minimum amount of fertilizer
needed to achieve the desired response in. Previous experiments in Bella Vista (Thompson
2013) have indicated that on a whole-ecosystem scale, these reservoirs are likely to respond as
predicted based on microcosm results.
VII. Conclusion
In conclusion, additions of chemical N and P fertilizers can stimulate primary production
and phytoplankton growth and increase nutrient concentrations. During times of nutrient
limitation such as mid-summer, chemical fertilization with N and P fertilizers can be used to
stimulate primary productivity in multi-use waterbodies in order to achieve mesotrophic
conditions supporting multiple uses. Using a moderate rate of fertilization may achieve the same
effects as higher fertilization rates, reducing costs and decreasing the possibility of bringing
about undesirable environmental conditions. Small-scale fertilization experiments can be used to
inform on possible whole-lake ecosystem response before beginning a large-scale fertilization
program.
13. 13
Literature Cited
Clean Water Act (1972). Public Law, 92, 500.
American Sportfishing Association. (2012). Sportfishing in America: An Economic Force for
Conservation. Report prepared by Southwick Associates.
Anders, P.J., & Ashley, K.I. (2007). The clear-water paradox of aquatic ecosystem restoration.
Fisheries, 32(3), 125-128.
Boyd, C.E., & Sowles, J.W (1978). Nitrogen fertilization of ponds. Transactions of the American
Fisheries Society 107, no. 5 (1978): 737-741.
Carlson, R.E. (1977). A trophic state index for lakes. Limnology and Oceanography, 22(2), 361-
369.
Carpenter, S.R., Cole, J.J., Kitchell, J.F., & Pace, M.L. (2010). Trophic Cascades in Lakes:
14. 14
Lessons and Prospects, p. 55-71. In. J. Terborgh and J. A. Estes [eds.], Trophic Cascades.
Island Press. Washington, D.C. USA
Conley, D.J., Paerl, H.W., Howarth, R.W., Boesch, D.F., Seitzinger, S.P., Havens, K.E., &
Likens, G.E. (2009). Controlling eutrophication: nitrogen and phosphorus. Science,
323(5917), 1014-1015.
Dunn’s ‘Trophy Grower’ Liquid Pond Fertilizer. (2014). Retrieved from
http://dunnsfishfarm.com/liquid_fertilizer_44_ctg.htm
Elser, J.J., Bracken, M.E., Cleland, E.E., Gruner, D.S., Harpole, W.S., Hillebrand, H., & Smith,
J.E. (2007). Global analysis of nitrogen and phosphorus limitation of primary producers
in freshwater, marine and terrestrial ecosystems. Ecology Letters, 10(12), 1135-1142.
Lindeman, R.L. (1942). The trophic-dynamic aspect of ecology. Ecology, 23(4), 399-417.
McDiffett, W.F. (1980). Limnological characteristics of several lakes on the Lake Wales Ridge,
south-central Florida. Hydrobiologia, 71(1-2), 137-145.
Ney, J.J., Moore, C.M., Tisa, M.S., Yurk, J.J., & Neves, R.J. (1990). Factors affecting the sport
fishery in a multiple-use Virginia reservoir. Lake and Reservoir Management, 6(1), 21-
32.
Ney, J.J. (1996). Oligotrophication and its discontents: effects of reduced nutrient loading on
reservoir fisheries. American Fisheries Society Symposium. 16: 285-295.
Nutrient Management Plan for Bella Vista Lakes (2010). Bella Vista Property Owners
Association, Bella Vista, Arkansas.
Rast, W. and Straškraba, M. (2000). Lakes and Reservoirs: Similarities, Differences, and
Importance, Volume 1. United Nations Environment Programme-International
15. 15
Environmental Technology Centre ; International Lake Environment Committee
Foundation.
Schindler, D.W. (1977). Evolution of phosphorus limitation in lakes. Science, 195(4275), 260-
262.
Schindler, D.W., Hecky, R.E., Findlay, D.L., Stainton, M.P., Parker, B.R., Paterson, M.J., Beaty,
K.G., Lyng, M. & Kasian, S.E.M. (2008). Eutrophication of lakes cannot be controlled by
reducing nitrogen input: results of a 37-year whole-ecosystem experiment. Proceedings
of the National Academy of Science. 105: 11254-11258.
Schindler, D.W. (2012). The dilemma of controlling cultural eutrophication of lakes.
Proceedings of the Royal Society B.1032: 1-12.
Smith, V.H. (1982). The nitrogen and phosphorus dependence of algal biomass in lakes: an
empirical and theoretical analysis. Limnology and Oceanography. 27: 1101-1112.
Smith, V. H., Tilman, G. D., & Nekola, J. C. (1999). Eutrophication: impacts of excess nutrient
inputs on freshwater, marine, and terrestrial ecosystems. Environmental pollution, 100(1),
179-196.
Smith, V.H., Joye, S. B., & Howarth, R. W. (2006). Eutrophication of freshwater and marine
ecosystems. Limnology and Oceanography, 51(1part2), 351-355.
Smith, V. H., & Schindler, D. W. (2009). Eutrophication science: where do we go from here?.
Trends in Ecology & Evolution, 24(4), 201-207.
Stockner, J.G., Rydin, E., & Hyenstrand, P. (2000). Cultural oligotrophication: causes and
consequences for fisheries resources. Fisheries, 25(5), 7-14.
16. 16
Thompson, B. (2013). Reservoir Management Techniques to Enhance Biological Productivity
and Protect Water Quality. (Master’s Thesis). University of Arkansas, Fayetteville,
Arkansas.
Urea Monthly Price – US Dollars per Metric Ton. (2014). Retrieved from
http://www.indexmundi.com/commodities/?commodity=urea&months=60
U.S. Climate Data (2016). Retrieved from
http://www.usclimatedata.com/climate/fayetteville/arkansas/united-states/usar0189
WeatherSpark (2016). Retrieved from https://weatherspark.com/averages/31879/Bentonville-
Arkansas-United-States
17. 17
Tables and Figures
Table 1. Average total nitrogen (TN), total phosphorus (TP), chlorophyll-a (chl-a), and Secchi
depth of each trophic state (Smith et al 1999).
Trophic state TN (mg/m3
) TP (mg/m3
) chl-a (mg/m3
)
Secchi depth
(m)
Oligotrophic <350 <10 <3.5 >4
Mesotrophic 350-650 10-30 3.5-9 2-4
Eutrophic 650-1200 30-100 9-25 1-2
18. 18
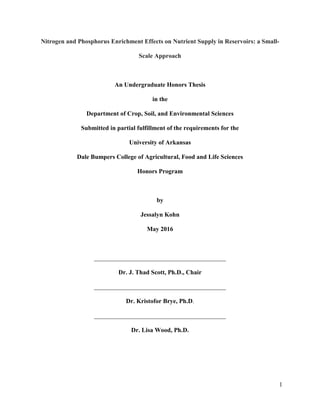
Figure 1. Map of four lakes and their respective watersheds in Bella Vista, Arkansas generated
from GIS (Global Information System) satellite data. Maps also show land use. Green areas are
forest; yellow areas are pasture; red areas are urban (Nutrient Management Plan for Bella Vista
Lakes 2010).
Lake Lomond
Lake Windsor
Lake Ann
Lake Avalon
19. 19
Figure 2. Google Earth satellite image of Lakes Ann, Avalon, Lomond, and Windsor in Bella
Vista, Arkansas.
20. 20
Table 2. Watershed and lake size conversions of the four lakes included in the study (Nutrient
Management Plan for Bella Vista Lakes 2010).
Lake
Watershed
Area (km2
)
Lake
Surface
Area (km2
)
Watershed
Area (acres)
Lake
Surface
Area (acres)
Maximum
Depth (m_
Ann 19.5 0.420 4,820 104 16.2
Avalon 6.00 0.240 1,480 59.7 15.2
Lomond 34.0 2.25 8,410 557 24.4
Windsor 29.8 0.910 7,360 226 24.1
21. 21
Figure 3. NO3 concentration in Lakes Avalon, Ann, Lomond, and Windsor from January to
December 2014.
22. 22
Figure 4. NO3, particulate N, and particulate C concentration in (A) Lake Ann, (B) Lake Avalon,
(C) Lake Lomond, and (D) Lake Windsor from January to December 2014.
23. 23
Table 5. Average weather and 30-year climatology data for the Northwest Arkansas region from
January 2014 to July 2014 (U.S. Climate Data 2016).
Month
Average
Monthly
High (ºC)
30 Year
Average
Monthly
High (ºC)
Average
Monthly
Low (ºC)
30 Year
Average
Monthly
Low (ºC)
Average
Monthly
Precipitation
(cm)
30 Year
Average
Monthly
Precipitation
(cm)
January -5.2 7.8 -12 -3.3 0.71 6.5
February -6.7 11 -12 4.4 0.25 6.1
March 12 15 -1.2 3.3 9.7 10.2
April 20 21 7.1 8.3 8.7 11
May 24 24 14 13 14 13
June 28 29 19 18 11 12
July 29 32 18 21 3.5 8.2
24. 24
Figure 5 (A) Northwest Arkansas region year-round climatology data since 1992 (WeatherSpark
2016). (B) Average July temperatures based in Northwest Arkansas based on climatology data
since 1992 (WeatherSpark 2016).
A
25. 25
Table 6. Example microcosm fertilizer rate calculator (Lake Ann). The Secchi depth at the time
of water collection was used to calculate the initial total phosphorus (TP) and the TP and total
nitrogen (TN) needed to achieve a desired Secchi depth and chlorophyll-a (chl-a) concentration.
Microcosm Fertilizer Calculator
2.80 Current Secchi Depth
4.40 Current Chlorophyll-a
18.3 Current TP (µg/L)
1.50 Target Secchi Depth (m)
11.1 Target Chl-a (µg/L)
2.50 Target Response Ratio
34.5 Target TP (µg/L)
16.3 TP Needed (ug/L)
73.5
TN Needed
(µg/L)
10
N:P
Supply
(molar)
147 20
294 40
588 80
Table 7. Microcosm nutrient addition calculator. The volume of stock N and P solution that
needed to be added was calculated based on TP and TN required from Table 3.
Microcosm Nutrient Addition Calculator
Cubitainer
Volume (L):
0.9
Stock Solution
Conc. (mg/L)
Volume Needed (mL) N:P
Supply
(molar)P N P N
10 100 1.46
0.66 10
1.32 20
2.65 40
5.29 80
26. 26
Table 8. Initial Secchi depth, total phosphorus (TP), chlorophyll-a (chl-a), particulate nitrogen
(N), particulate carbon (C), and trophic state of Lakes Ann, Avalon, Lomond, and Windsor at
time of water collection for microcosm experiments.
Lake
Secchi
Depth
(m)
TP (mg/L) Chl-a (µg/L)
Particulate
N (mg/L)
Particulate
C (mg/L)
Trophic
State
Ann 2.8 0.018 4.4 0.19 1.1 Mesotrophic
Avalon 2.3 0.023 5.9 0.24 1.4 Mesotrophic
Lomond 4.0 0.013 2.6 0.20 1.3
Meso-
Oligotrophic
Windsor 3.7 0.014 2.9 0.18 1.0
Meso-
Oligotrophic
27. 27
Figure 6. Microcosm in-vivo chlorophyll-a. (A) Ann, (B) Avalon, (C) Lomond, (D) Windsor.
When in-vivo chlorophyll-a showed a decline in biomass, the experiment was concluded.
28. 28
Figure 7. (A) Particulate N, (B) Particulate C and (C) C:N in Lake Ann microcosms.
29. 29
Figure 8. (A) Particulate N, (B) Particulate C, and (C) C:N in Lake Avalon microcosms.
30. 30
Figure 9. (A) Particulate N, (B) Particulate C, and (C) C:N in Lake Lomond microcosms.
31. 31
Figure 10. (A) Particulate N, (B) Particulate C, and (C) C:N in Lake Windsor microcosms.
32. 32
Table 9. Low (N:P 10), high (N:P 80), and optimal (based on microcosm results) cost of
fertilization in each lake.
Optimal
Lake N:P
Pond Pro
(10-34-0)
application
rate
Cost/Gallon
Lake
Area (ac)
Urea (46-0-0)
Application
Rate
Cost/50
lb Bag
Fertilization Cost
Ann
N:P 20
1-2
gallons/ac
$12.95
104.4
Dozens-
hundreds of
bags
$8
Low: $4.473.45
Optimal: $6,993.03
High: $22,110.53
Avalon
N:P 40
59.7
Low: $2,560.23
Optimal: $6,889.10
High: $12,660.92
Lomond
N:P 40
556.9
Low: $22,875.39
Optimal: $64,233.68
High: $118,044.74
Windsor
N:P 80
225.9
Low: $9,366.57
Optimal: $24,782.81
High: $45,377.80