
Recommended
More Related Content
What's hot
What's hot (20)
Similar to Galaxy Brand Extension: Popcorn
Similar to Galaxy Brand Extension: Popcorn (20)
More from Jessica Grocock
More from Jessica Grocock (13)
Recently uploaded
Recently uploaded (20)
Galaxy Brand Extension: Popcorn
- 1. Introduction Brands can be defined as ‘a name, term, sign, symbol, or design, or combination of these, which is intended to identify the goods and services of one seller or group of sellers and to differentiate them from their competitors (Kotler,2013). Galaxy chocolate is a fast moving consumer good (FCMG) (Brassington and Pettitt, 2005) that originated in the UK in the year 1960 and has seen strong growth that continues year on year (Galaxy, no date). This report will analyse both Galaxy’s position within the market, including its financial status and market share, to provide a creative brand extension which would strategically benefit the parent brand, Mars Limited. Key UK Consumer Segments The chocolate industry has remained constant since 2015, with 9 out of 10 people eating chocolate, demonstrating the enduring appeal (Mintel, 2016). With a high amount of people consuming chocolate, dividing the population into segments helps the brands message become much more targeted (Blythe, 2016). A market segment is a group of customers with similar requirements which can be satisfied by a distinct marketing mix (Chernatony, 2001). Galaxy use demographic segmentation to focus on 45-54 year-old women (Mintel, 2016), a logical choice as small chocolate bars are consumed by over 45’s the most, with 35% of women eating chocolate bars four or more times a week compared to 24% of men (Mintel, 2016). Although segmentation can reach consumers more effectively (Armstrong, 2016), it can also have a drawback. Consumers aged 16-24 are the driving force of the snack market (Mintel, 2016), with 79% of the age group eating snacks at least once a day. This age group are also the most likely to interact with brands on social media (Mintel, 2016); Galaxy are neglecting a huge consumer segment as well as the critical need to utilise social media in a digital age as they have less online mentions than brands who have less sales (Mintel, 2014). Trends Within the Market Palmers ‘brandsphere’ theory is an external scanning model which notes factors that can have an affect on the brand that cannot be controlled (Palmer, 2009). Trends within a market lie under the Macro environment. The key trend for FCMG’s between 2015 and 2016 was the attention sugar received in the media. Alongside 48% of consumers claiming to be trying to lose weight (Mintel, 2015), this has resulted in 40% of consumers choosing to buy healthier snacks instead of chocolate (Mintel, 2016). Positively, the emotional benefits of chocolate seem to outweigh health
- 2. concerns for 4 in 10 users, which has helped the market stagnate in the face of the sugar epidemic (Mintel, 2016). Galaxy will have to adapt to the UK’s ageing population; over 55’s are projected to increase by 10%, with only 24% of them eating chocolate (Mintel, 2016). Over-55s show the most concern for health issues like cholesterol and heart health, which various ingredients in Galaxy have been proven to contribute to (Mintel, 2015). Analysis of Galaxy’s Market Share Market Share 2015 2014 2013 2012 Value (%) 8 (2015) 6 (2014) 7 (2014) 7 (2013) Volume (%) 8 6 7 7 2015 2014 2013 2012 Total Sales (M) 241 261 280 271 - Figure 1: Galaxy’s market share and sales (Mintel, 2016) (Mintel, 2014) (Mintel, 2013) - FCMG’s compare market share (MS) frequently as it is the measure of the consumer’s preference for a product over other very similar products (Economic Times, no date). MS can be defined by the proportion of the total amount of products sold within a specific product market measured by both value and volume (Habel, 2009). Galaxy is the second leading brand in chocolate confectionary 2015, owning 8% volume and value market share (Mintel, 2016) . Galaxy increased their market share by 2% between 2014/15 (Mintel, 2016). Laverty’s study showed that share may be a significant predictor of product return (Laverty, 2001); this is apparent as Mars profits dropped between 2013 and 2014 Mars’ by £904,994 (Fame, 2016) which resulted in a 1% dip in market value whilst previously maintaining their status (Mintel, 2013). Drummond (2010) argues that brands are intentionally accepting lower financial returns with their products in order to develop their market position; this appears to be the case as between 2014/2015, sales drop by £20M yet the MS increases by 2%, whereas between the years 2012/13 where MS remains at 7%, the total sales increase by £10M. Galaxy’s Financial Performance
- 3. - Figure 2: Mars UK Limited Revenue/Turnover and Profit (Fame, 2016). - Mars’ profit and revenue increases yearly apart from the years 2013-2014 where there is a large decrease (Fame, 2016). Between 2013/14 Galaxy lost 1% MS due to sales falling by 7% (Mintel, 2014). Due to a three-year streak in positive turnover, Mars invested into Galaxy advertisement with £2.5M spent on TV alone (Mintel, 2014). This appears to be ineffective as their profit decreased by £4994 and their turnover decreased by £5879. A Mintel report states that 79% of 16-24 year-olds are eating snacks once a day or more (Mintel, 2016); not targeting this focal segment within their advertising could potentially be causing the decline. When the market share rose to 8% in 2015, Mars’ had an increase of £23,634 revenue and £7593 in profit due to the launch of the Galaxy Duet sub-brand and Galaxy Salted Caramel in 2015. Galaxy’s Competitors Galaxy’s main competitor is Dairy Milk (DM) who own 16% of the industries MS with the rest of the market owning only 1-5% out of 100 (Mintel, 2016). DM excel in regards to sales selling £507M worth of product whereas Galaxy only sold £241M in 2015. However, Galaxy grew in sales by £10M compared to 2014 whereas DM only increased by £7M; this is due to two new line extensions. -Figure3: An adaptation of Kotler’s Price Matrix - Dairy Milk is overall preferred in the UK; however, when totaling the sales from 2015 from each chocolate bar owned by both parent brands, Mars earned earned £3663.9M whereas Mondelez only earned 90.8M (Mintel, 2016). Drummond (2010) argues that brands are intentionally accepting lower financial returns with their products in order to develop their market position, which may be the reason Galaxy is so far behind in it’s market share and profitability compared to Dairy Milk. FMCG’s like chocolate will have an elastic demand, a small percentage increase in price will produce a decrease in demand as consumers will opt for a cheaper product that offers the same qualities (Blythe, 2016). Kotler’s price matrix can be used to compare Galaxy’s pricing (Kotler,2013). Galaxy is trusted by consumers, offering high quality products at a medium price (Mintel, 2016), which would put Galaxy in the ‘High value’. However, Kotler’s matrix can be criticized as consumers actually believe Galaxy to be ‘not as good value as Cadbury or Kit Kat’ and is only favourite brand to 13% of consumers compared to Cadburys 20% (Mintel, 2016). HIGH QUALITY LOW QUALITY High valueUnderpriced Premium offering Good value Overpriced LOW PRICE Very cheap products Low value Underpriced HIGH QUALITY
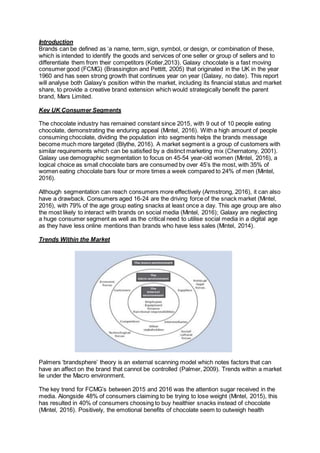
- 4. Brand Positioning Brand positioning (BP) is the design of a company’s image and what it offers so that it occupies a distinct and valued place in consumers’ minds (Keller, 2013). Galaxy position themselves as a ‘treat’, as the ‘perfect partner for chocolate indulgence, why have cotton when you can have silk?’ (Galaxy, no date). - Figure 4: Evaluating effectiveness of Brand Positioning - Figure 4 is a matrix used to evaluate the effectiveness of a BP (Chernatony, 2001). Research by Mintel states the biggest reason for buying chocolate is to ‘treat oneself’ (Mintel, 2016), which show’s Galaxy’s position as an indulgent treat has high relevance to consumer’s. Galaxy heavily advertising itself as a ‘me-time’ (Mintel, 2016) supports Galaxy having a high score on the extent to which Galaxy emphasizes it’s unique selling point, resulting in Galaxy having a ‘market orientated’ position. Alexander (1996) states that semiotics/symbols can be helpful to exploit a cultural myth, which for Galaxy, is that their product is unhealthy; one in five consumers worry about the saturated fat content of chocolate (Mintel, 2014). Semiotics can help position a brand by identifying the opposite of the myth and then using this cultural contradiction to overcome it and satisfy a customers need. The stronger the opposition, the stronger a brands position (Chernatony et al, 1992). Galaxy plays on the perceived female need of ‘me time’ against the unhealthy stigma chocolate has and positions itself as a ‘self reward’ (Figure 5) (Carter, 2010). HIGH Extent to which the organisation emphasizes the UCP LOW LOW FIRM CENTRERED MARKET ORIENTATED MISSED OPPORTUNITY MISUNDERSTOOD CONSUMER AND BADLY COMMUNICATED Relevance to customer HIGH
- 5. . - Figure 5: An adaptation of Alexander’s myth concept (Chernatony, 2001)- Marketing and Communications Approach The promotional mix can be used to dissect the direct way in which an organisation communicates with target audiences (Brassington and Pettitt, 2005). INDULGENT TREAT UNAPPETISING FOOD HEALTHY FOOD UNHEALTHY FOOD Cultural norms Cultural contradictions Cultural contradictions Cultural norms
- 6. - Figure 6 (top), Figure 7 (bottom) - Figure 8 - With more than 40 pence in every pound made being spent on advertising, figure 6 shows that Mars has been the biggest spender on advertising since 2012 (Mintel, 2016). Galaxy had the highest ad spend in 2013 (Mintel, 2014) due to the Audrey Hepburn TV advert; Audrey represent classiness and elegance which is a perfect mirror to their ‘silk, not cotton’ strapline and is relevant to the consumer age group (McGee, 2014). The drop in sales and profit that year may be due to the choice of communication as, since 2010, there have been yearly declines in TV viewings (Mintel, 2016). Galaxy’s outgoings on promotion is huge compared to it’s profits in figure 2; a solution could be to attract new demographic via social media, especially 16-24 year-olds who are very active on SM according to figure 8. SM is a way to reach customers at minimal cost (Brassington and Pettitt, 2005). Galaxy have not posted on their Facebook since February; an increased level of use could be a way to cut costs and create customer service and gain exposure (Brassington and Pettitt, 2005). Creative Analysis of Galaxy’s Intangible Values: Brand equity is the differential effect that brand knowledge has on consumer response to the marketing of that brand, which will hopefully create loyal customers (Keller, 2013). To differentiate themselves from competitor’s a brand must focus on intangible values as consumers are less concerned with attributes, but more focused on emotional benefits (Chernatony, 2001). Using Chernatony’s brand pyramid in Figure 9 (Chernatony, 2001) it is clear Galaxy have a logical foundation to have high brand equity. - Figure 9: An adaptation of Chernatony’s brand pyramid - The brand pyramid, if portrayed within marketing techniques, creates a brand essence understanding; the benefits lead to an emotional reward for the consumer (Chernatony, 2001). VanAuken (2010) states a brand’s essence can be described in a three-word phrase Indulgence Galaxy Chocolate Smooth, creamy and delicious Reduces hunger Treating yourself, havinga luxury treat
- 7. to quickly describe a company. However, Blackett and Broad contradict this with their ‘Interbrand’s Brand Blueprint’ which is a detailed proposition of values made from customer research (Chernatony, 2001). Whilst consistent advertising and mass-market appeal help Galaxy to be seen as accessible, they still hold an element of luxury and indulgence that encourages consumers to consider buying it for special occasions (Mintel, 2014); Galaxy is seen as ‘treat’ as intended. Galaxy is seen as having a family image, consistent high quality and trust; being seen as family orientated will benefit Galaxy as the second highest reason to buy chocolate after ‘indulging’ is for an evening at home and trust will ensure brand loyalty when extending (Mintel, 2016). Ethical qualities are lacking from Galaxy’s brand essence. 16-24 year-olds are the only demographic to see the brand as ethical due to it’s collaboration with the rainforest alliance (Mintel, 2016); including this age-group within marketing techniques may lead to a brand essence extension. - Figure 10: an adapted version of the Interbrands Brand Blueprint model (Chernatony, 2001) - 8% Market share 1960 A treat Origin: UK FACTS AND SYMBOLS BRAND PERSONALITY WHAT THE PRODUCT DOES FOR ME HOW THE BRAND MAKES ME LOOK HOW THE BRAND MAKES ME FEEL HOW WOULD I DESCRIBE THE PRODUCTSatisfies hunger Releases endorphins luxury velvety creamy delicious smooth richCORE Indulged Naughty Happy Luxurious Upper-class Proud to be associated with Trustworthy Good value accessible Comforting traditional wholesome authentic Family orientated Why have cotton when you can have silk? - Luxurious - Indulgent - High quality
- 8. BP is defined as ‘the set of human characteristics associated with a brand’; a distinctive personality can help create a set of unique and favorable associations in consumer memory (Keller, 1993). Aaker’s theory (Aaker, 1997) shows five branches of personality (figure 11). Galaxy come under the sincerity category as consumers describe the brand to be honest, wholesome and comforting (Mintel, 2016). A critique of this theory to assess a brand’s personality is that the categories do not include any negative qualities or consider brand’s being in multiple categories (Avis, 2012); this is apparent as Galaxy score high in consistency with consumers, so is compatible with the competence category (Mintel, 2014). Brand extension A brand extension is when a firm uses an existing brand name to introduce a completely new product (Keller, 2013). - Figure 12 – Figure 12 (Mintel, 2016) shows that new product launches within the chocolate industry declined to 26% in 2015; there is a gap within the market to be innovative, a quality that consumers do not perceive Galaxy to be (Mintel, 2014). - Figure 11: The brand personality framework -
- 9. According to figure 2 Galaxy’s profit is increasing each year; Galaxy have the financial comfort to extend. Failure rates of brand extensions within FCMG’s industries have risen to 80% (Hem, L.E. et al, 2003), it important to assess key trends within the market beforehand. The chocolate industry as a whole has stagnated in volume sales over the last two years due to seven in 10 consumers cutting down on snacks to reduce calorie intake (Mintel, 2016) and 4 in 10 consumers choosing healthier snacks (Mintel, 2015). 16-24 year olds are the main consumer of both chocolate and snacks (Mintel, 2014); Galaxy choosing against targeting this market may be the reason behind sales decline. A probable brand extension could be chocolate covered popcorn, as it combines the current market’s need for a healthier snack whilst potentially attracting a younger demographic as 16-24 year olds show a bias towards favouring healthy snacks (Mintel, 2015). Ansoff’s growth matrix (figure 13) can be used to deduce that the extension would be using a diversification strategy by targeting new consumers with a new product (Keller, 2013). - Figure 13: Ansoff’s Growth Matrix - Popcorn is the star growth performer in the UK market, doubling from 2010 to 2015 (Mintel, 2016). Propercorn, a brand known for it’s low calorie flavours, has seen 126% value growth in the past year (the Grocer, 2016). Popcorn has high health credentials with one in four people stating the flavours are healthy (The Telegraph, 2016). Cadbury’s released a toffee and chocolate covered popcorn in 2012 (Reynolds, 2012) which is no longer for sale. This may be due to the high sugar and fat content in the product. Galaxy could use their high brand equity status to apply price skimming, setting a high price to attract consumers who seek status and see high price as an exclusive product (Brassington and Pettitt, 2005), corresponding with current consumer opinion that Galaxy are a brand proud to be associated with (Mintel, 2014). Popcorn bags will accommodate portion control, a factor which limits the amount of calories consumed; women, Galaxy’s current demographic, look for portion controlled snacks as 57% of them are trying to lose weight (Mintel, 2016). Galaxy have a lack of online presence from Galaxy; social media could be utilised as discussion online has led to a fifth of chocolate buyers to try a new product (Mintel, 2016). Using online advertising will decrease costs, creating an increase of profit and a positive cash flow. Market Development PRODUCTS NewExisting Market Penetration Product Development Market NewExisting Diversification
- 10. A disadvantage of this brand extension is a healthier alternative to the popular chocolate bar may have damaging effects on sales. Choosing to target a further consumer segmentation may weaken the brand’s image which Keller (2013) states is especially evident in high- quality brands, a quality which consumers believe Galaxy to be (Mintel, 2014). However, the product would be the perfect portrayal of Galaxy overcoming the cultural contradiction mentioned in Alexander’s myth diagram (Alexander, 1996); Galaxy could position the popcorn as an ‘innocent indulgence’, staying true to it’s brand essence whilst attracting both existing and new consumers.