NCB_2010
- 1. LETTERS
A spindle-like apparatus guides bacterial chromosome
segregation
Jerod L. Ptacin1
, Steven F. Lee2
, Ethan C. Garner3
, Esteban Toro1
, Michael Eckart4
, Luis R. Comolli5
,
W.E. Moerner2
and Lucy Shapiro1
Until recently, a dedicated mitotic apparatus that segregates
newly replicated chromosomes into daughter cells was
believed to be unique to eukaryotic cells. Here we demonstrate
that the bacterium Caulobacter crescentus segregates its
chromosome using a partitioning (Par) apparatus that has
surprising similarities to eukaryotic spindles. We show that
the C. crescentus ATPase ParA forms linear polymers in vitro
and assembles into a narrow linear structure in vivo. The
centromere-binding protein ParB binds to and destabilizes ParA
structures in vitro. We propose that this ParB-stimulated ParA
depolymerization activity moves the centromere to the opposite
cell pole through a burnt bridge Brownian ratchet mechanism.
Finally, we identify the pole-specific TipN protein1,2
as a new
component of the Par system that is required to maintain the
directionality of DNA transfer towards the new cell pole. Our
results elucidate a bacterial chromosome segregation mechanism
that features basic operating principles similar to eukaryotic
mitotic machines, including a multivalent protein complex at the
centromere that stimulates the dynamic disassembly of polymers
to move chromosomes into daughter compartments.
Recent evidence suggests that Caulobacter crescentus and other bacteria
use DNA partitioning (Par) systems related to those found in plasmids
to segregate chromosomal origin regions on DNA replication. Par sys-
tems are found throughout bacterial species3
and consist of three core
components: 1) an origin-proximal centromeric DNA sequence, parS;
2) an ATPase ParA, hypothesized to provide the force for centromere
segregation through dynamic polymerization; and 3) a mediator protein
ParB, which binds to parS and is predicted to regulate and couple ParA-
induced force to parS movement. In C. crescentus, ParA and ParB are
essential4
. Depletion of ParB, overexpression of ParA and/or ParB, extra
parS sequences, or mutations in the ParA ATPase active site result in
severechromosomesegregationdefects4–6
.Furthermore,theC. crescentus
parS site has been identified as the functional centromere6
, and blocking
DNA replication initiation prevents translocation of the ParB–parS com-
plex to the opposite cell pole7
. In addition to the core Par components,
C. crescentus uses a pole-specific protein PopZ to tether the parS region
to the pole through direct interaction with ParB, which prevents reverse
segregation of the ParB–parS complex8,9
. Together, these data suggest
that the C. crescentus Par system, in cooperation with the polar PopZ
network, mediates the active segregation and subsequent tethering of the
parS region to the cell pole to initiate chromosome partitioning.
Despite a clear role in DNA partitioning, the mechanisms proposed
for Par systems are diverse and largely hypothetical10–16
. However, Par
systems have several common features. Various ParA homologues have
been shown to polymerize in vitro10,11,16–20
. Dynamic pole-to-pole oscilla-
tion of ParA localization has been observed in vivo, and in some cases has
been shown to require ATPase activity and the presence of both ParB and
parS10,12,13,15,19,21–25
. Importantly, recent observations demonstrate a corre-
lation between ParB movement and a retracting cloud-like localization
of ParA during segregation12,15
, suggesting that a ParA structure ‘pulls’
ParB–parS complexes. However, the architecture of ParA assemblies,
the molecular mechanisms by which these structures form and generate
chromosomalmovement,andthecellularcomponentsrequiredtoimpart
directionality to ParA-mediated segregation have yet to be established.
To examine the role of ParA and ParB in chromosome segregation, we
replaced the C. crescentus chromosomal parA and parB genes with parA-
eyfp and cfp-parB, respectively, and used time-lapse microscopy to image
synchronized cells. Initially CFP–ParB bound to parS formed a focus
(red) at the old pole, as reported previously5
, and ParA–eYFP (green)
localized predominantly between the new pole and the CFP–ParB focus
(Fig. 1a). Next, the CFP–ParB focus duplicated, and one focus followed
theedgeofarecedingParA–eYFPstructuretowardstheoppositecellpole
(Fig. 1a, top row; Supplementary Information, Fig.S1a), suggesting that a
retracting ParA complex moves ParB–parS during segregation12,15
.
To obtain higher resolution images of ParA in vivo, we performed two-
colour single-molecule fluorescence imaging to extract super resolution
imagesofParA–eYFPandmCherry–ParBlocalizationsduringsegregation
1
Department of Developmental Biology, Stanford University School of Medicine, Beckman Center, Stanford, CA 94305, USA. 2
Department of Chemistry, Stanford
University, Stanford, CA 94305, USA. 3
Department of Systems Biology, Harvard Medical School, Boston, MA 02115, USA. 4
Stanford Protein and Nucleic Acid Facility,
Stanford University School of Medicine, Beckman Center, Stanford, CA 94305, USA. 5
Life Sciences Division, Lawrence Berkeley National Laboratory, Berkeley,
CA 94720, USA.
Correspondence should be addressed to L.S. (shapiro@stanford.edu)
Received 23 March 2010; accepted 1 July 2010; published online 25 July 2010; DOI: 10.1038/ncb2083
nature cell biology VOLUME 12 | NUMBER 8 | AUGUST 2010 791
© 20 Macmillan Publishers Limited. All rights reserved10
- 2. L E T T E R S
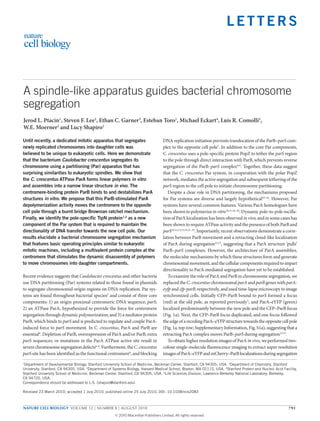
in live cells. Figure 1b shows representative epifluorescence and super
resolutionimagesofParA–eYFP(green)andmCherry–ParB(red)incells
atdifferentstagesofparSprogressiontowardsthedistalpole.Weobserved
thatParA–eYFPmoleculeslocalizedtoadiscretelinearstructure(Fig.1b;
SupplementaryInformation,Fig. S1aandb)withwidthsof40.1 ±9.5nm.
A cell imaged before replication initiation (Fig. 1b, cell A), shows a lin-
ear ParA–eYFP structure. Cells imaged during segregation (Fig. 1b, cell
B) show linear ParA–eYFP assemblies that frequently have the highest
density of ParA localizations between the new pole and the segregating
ParB–parScomplex,reflectingatsuperresolutiontheretractingcloud-like
ParAlocalizationsintheepifuorescenceimagesinFig. 1a(Supplementary
Information, Fig. S1b). Finally, cells imaged after the completion of parS
segregation (Fig. 1b, cell C) show linear ParA structures that stretch from
poletopole,suggestingreorganizationoftheParAstructureaftersegrega-
tion. No ordered assemblies were observed when we imaged cytoplasmic
eYFP alone, but linear ParA–eYFP structures were observed in cells after
20 nm
Diffraction limited
Cell A
Super resolution
Cell A Cell B Cell C
mina
b
0 5 10 15 20
c
Figure 1 ParA and ParB dynamics in vivo and ParA polymerization
in vitro suggest a retracting polymeric ParA structure guides centromere
segregation. (a) A retracting ParA structure leads the ParB–parS complex
towards the new pole. Time-lapse epifluorescence microscopy of JP110
swarmer cells imaged at 5-min intervals on initiation of S phase. Phase-
contrast, ParA–eYFP (green) and CFP–ParB (red) images (top row), or
phase and CFP–ParB images (bottom row) are overlaid. The translocating
CFP–ParB-bound parS complex is indicated (white arrow). Scale bars, 1 μm.
(b) Super-resolution imaging reveals that the retracting ‘cloud’-like ParA
in epifluorescence images corresponds to a narrow linear ParA structure.
Representative images of JP138 cells at various stages of parS segregation
are shown: a diffraction-limited epifluorescence image and corresponding
super resolution image of a representative cell (cell A); a cell undergoing
parS segregation (Cell B); and a cell after parS segregation is completed (cell
C). For the super resolution images, the locations of ParA–eYFP (green) and
CFP–ParB (red) molecules are plotted as 2D Gaussians with width defined by
the fit error of the single-molecule localizations, and overlaid with the white
light cell outline. Scale bars, 1 μm. (c) Purified ParA polymerizes in the
presence of ATP in vitro. A representative negative-stain electron micrograph
of ParA incubated with ATP is shown (upper panel; scale bar, 100 nm).
Higher magnification images (lower panel; scale bar, 20 nm), showing single
(lower left) and bundled ParA protofilaments (lower middle and right).
792 nature cell biology VOLUME 12 | NUMBER 8 | AUGUST 2010
© 20 Macmillan Publishers Limited. All rights reserved10
- 3. L E T T E R S
fixing with formaldehyde (Supplementary Information, Fig. S1c) and
whenParAwasfusedtomCherry(SupplementaryInformation,Fig.S1c).
To further demonstrate the consistency between the epifluorescence
and super resolution experiments, we reconstructed diffraction-limited
images using the super resolution fitted localization data (Supplementary
Information, Fig. S1d) that matched well with the epifluorescence images
(Fig. 1a). We conclude that ParA–eYFP is assembled predominantly into
a narrow linear structure oriented along the long axis of the cell, which
could not be resolved with diffraction-limited microscopy.
The narrow linear structures of ParA–eYFP observed in vivo sug-
gest that these structures consist of ParA polymers. We therefore
purified ParA and measured multimerization using light scattering
(Supplementary Information, Fig. S2a). ParA combined with ATP pro-
duced a rapid increase in light scattering, indicating polymerization
(green). No increase in light scattering was observed in the absence of
nucleotide, and ADP stimulated a slow increase (blue and red, respec-
tively). We imaged ParA structures directly using negative-stain elec-
tron microscopy. When incubated without ATP, no ParA polymers
were observed (Supplementary Information, Fig. S2b). However, in
the presence of ATP, ParA formed linear polymers that were laterally
bundled (Fig. 1c, upper and lower panels), as observed for other ParA
homologues10,11,16,17,19
.
We performed a mutational analysis to determine the roles of ParA
biochemical interactions in ParA localization. The proposed ParA
biochemical pathway18
is shown in Fig. 2a. Apo–ParA binds to ATP
(Fig. 2a, top), stimulating ParA homodimerization18,19
. The ATP-bound
ParA dimer interacts with ParB, binds to DNA, or polymerizes18,19
.
ParB stimulates ParA ATP hydrolysis11,19,26
or nucleotide exchange27
,
releasing ParA as monomers (Fig. 2a, bottom). We mutated conserved
ParA residues to abrogate specific biochemical interactions (Fig. 2a;
a
ParA
ParA
ParA
ParA
ATP binding
Dimerization
ATP hydrolysis/
exchange
ParB
b
ParB
DNA
Merge ParA–eYFP CFP–ParB
d e
0 50 100 150 200
Time (s)
Response(R.U.)
Response(R.U.)
30
80
130
180
0
ParA binding ParB
1800
100
Time (s)
0
400
800
1200
1600
0 50 150 200
ParA binding DNA
c
ParA–ADP
ParA–ATP
ParA only
No ParA
ParA–ADP
ParA–ATP
ParA only
No ParA
Wild-type
K20Q
ATP binding
G16V
dimerization
D44A
ATP hydrolysis
R195E
DNA binding
ParA–eYFP
Polymer
Figure 2 Mutational and biochemical analysis of C. crescentus ParA. (a)
Consensus view of the ParA biochemical pathway18
. Apo–ParA (half-circle)
binds ATP (green circle), changes conformation (triangle with green circle),
and dimerizes18
. ParB-stimulated ATP hydrolysis or nucleotide exchange of the
ParA dimer (square with green circles) causes release of ADP (red circle) and
Pi
to reset the cycle. (b) Images of C. crescentus strains expressing merodiploid
wild-type or mutant ParA–eYFP. Phase, ParA–eYFP (green) and CFP–ParB
(red) are overlaid as shown. White arrows indicate partially translocated ParB
foci. Scale bars, 1 μm. (c) Images of E. coli cells expressing wild-type and
mutant C. crescentus ParA–eYFP proteins. Phase-contrast and eYFP images
(green) are overlaid. Scale bars, 1 μm. (d) ParA requires ATP for interaction
with ParB. Surface plasmon resonance (SPR) analysis using immobilized ParB.
ParA (500 nM) injected with ATP (green), ADP (red), or no nucleotide (blue) at
t = 0, and buffer only (150 s). Response units (R.U.) are plotted versus time
(s). (e) ParA requires ATP for non-specific DNA binding. SPR analysis using
immobilized non-specific DNA duplex (a scrambled parS sequence). ParA
(500nM) injected with ATP (green), ADP (red), or no nucleotide (blue) at t = 0,
and buffer only (150 s). Response units (R.U.) are plotted versus time (s).
nature cell biology VOLUME 12 | NUMBER 8 | AUGUST 2010 793
© 20 Macmillan Publishers Limited. All rights reserved10
- 4. L E T T E R S
Supplementary Information, Fig. 2c–e) and observed the localizations in
C. crescentus using fluorescence microscopy (Fig. 2b). Wild-type ParA–
eYFP localized as a retracting ‘comet’-like structure (Figs 1a, 2b). An
ATP-binding mutant, ParAK20Q
(ParAbinding
)12,13,18,22,23,28
localized diffusely
with puncta at the new pole (Fig. 2b). A ParA dimerization mutant,
ParAG16V
(ParAdimer
)18,23,29
, localized diffusely and in bipolar foci (Fig. 2b),
and an ATP hydrolysis mutant, ParAD44A
(ParAhydrolysis
)18,29
, colocalized
with ParB foci and in patches throughout the cell (Fig. 2b). Localization
of ParA proteins that contained a ParAbinding
mutation, combined with a
ParAdimer
or a ParAhydrolysis
mutation, was identical to that of the ParAbinding
mutant alone (Supplementary Information, Fig. S3f). Similarly, localiza-
tion of a ParA protein that contained a ParAdimer
mutation, combined
with a ParAhydrolysis
mutation, was indistinguishable from that of the sin-
gle ParAdimer
mutant (Supplementary Information, Fig. S3f), consistent
with the proposed hierarchy.
We assessed the role of nucleoid binding in ParA localization. We
created a DNA-binding mutant, ParAR195E
(ParADNA
)11,25,30
, and found
that it localized exclusively in foci at the cell poles (Fig. 2b), suggesting
a role for DNA binding in ParA localization. To further examine ParA
DNA binding, we observed the localizations of ParA–eYFP mutants in
a b
+ParB–ParB
0 5 10
No
parS
parS
ParA–eYFP CFP–ParB
ParA–eYFP/
CFP–ParB
–ParB
mCherry–ParB
–ParB
mCherry–ParB
L12A
c
d
min
min0 5 10
0
500
1000
1500
2000
2500
3000
3500
4000
0 200 400 600 800 1000
ParA + ATP +/– ParB
Response(R.U.)
Time (s)
ParA, ParB
ParA, no ParB
No ParA, ParB
No ParA, no ParB
Figure 3 ParB in complex with parS drives the dynamics of ParA structures
on DNA. (a) ParB is required for the dynamic movement of ParA structures
in vivo. C. crescentus strains in which the only copy of ParB was controlled
by the xylose-inducible promoter were cultured in medium with (+ParB)
or without (–ParB) xylose, and induced to express ParA–eYFP (green),
or ParA–eYFP and mCherry–ParB (+mCherry–ParB) or mCherry–ParBL12A
(+mCherry–ParBL12A
; red). Phase and eYFP, or phase/eYFP/mCherry
images were collected at 5-min intervals and overlaid as shown. Scale bar,
1 μm. (b) ParA localization in E. coli requires ParB and parS for dynamic
movement along the nucleoid. The E. coli strains eJP142 (+parS plasmid)
and eJP140 (–parS plasmid) were induced to express CFP–ParB (red)
and/or ParA–eYFP (green), and phase, eYFP and CFP images were collected
and overlaid as shown. The white arrow indicates dynamic ParA–eYFP
localization (see c). Scale bar, 1 μm. (c) Time-lapse image series of eJP142
cells showing ParA–eYFP localization dynamics. Cultures were prepared as
described in b, and phase, eYFP and CFP images were collected at 5-min
intervals and overlaid. The predominant localization of ParA is indicated
with a large white arrow, and smaller arrow indicates other localizations.
Scale bar, 1 μm. (d) ParB destabilizes a DNA-bound ParA complex in vitro.
SPR analysis using an immobilized non-specific 162-nucelotide duplex
DNA. ParA (375 nM) was first injected with ATP for 150 s (blue region)
followed by buffer only for 150 s. Subsequently, 6His–ParB (1 μM dimer,
red trace) or buffer only (green trace) was injected for 6 min (grey region)
followed by buffer only. The blue trace shows a flow sequence in which no
ParA was injected, followed by 6His–ParB (1 μM dimer), showing negligible
non-specific DNA binding by 6His–ParB. The black trace represents a flow
sequence lacking ParA and 6His–ParB. Response units (R.U.) are plotted
against time (s).
794 nature cell biology VOLUME 12 | NUMBER 8 | AUGUST 2010
© 20 Macmillan Publishers Limited. All rights reserved10
- 5. L E T T E R S
Escherichia coli (Fig. 2c), which does not contain a Par system3
but has
prominent nucleoid masses. In E. coli, ParAbinding
–eYFP, ParAdimer
–eYFP
and ParADNA
–eYFP all localized diffusely (Fig. 2c). By contrast, wild-type
ParA–eYFPandParAhydrolysis
–eYFPlocalizedinpatchesalongthenucleoid
(Fig. 2c and data not shown), supporting the requirements of ATP bind-
ing and dimerization for ParA interaction with DNA.
To directly examine the biochemical requirements for ParA interac-
tionwithParBandwithDNA,weusedsurfaceplasmonresonance(SPR).
Response(R.U.)
a
b
c
TipNCTD
TipNNTD
TipN
mCherry/eYFP eYFPmCherry
0 7 14 22 min
Phase
ParA–eYFP
mCherry–ParB
d
mCherry–ParB
mCherry–ParB
ΔtipN
ParA–ATP
ParA–ADP
ParA only
No ParA
ParA binding TipNCTD
Time (s)
54
ΔtipN
0
10
20
30
40
50
60
70
80
90
100
Bipolar
Partial
Unipolar
parB::cfp-parB vanA::mchy-parB vanA::mchy-parB
ΔtipN
Cells(percentage)
–20
0
20
40
60
80
100
120
140
50 100 150 2000
Figure 4 TipN confers new pole-specific directionality to Par-mediated DNA
transfer through direct interaction with ParA. (a) Strains lacking tipN show
severe parS segregation defects. Synchronized cultures of JP2 (parB::cfp-
parB), and of JP138 (vanA::pvan-mCherry-ParB) and JP141 (vanA::pvan-
mCherry-ParB, ΔtipN) were induced to express mCherry–ParB and imaged
for phase and mCherry or CFP fluorescence after the initiation of S phase.
Representative fields of JP138 (upper left panel) and JP141 (lower left
panel) are shown. The white arrows indicate partially segregated ParB–parS
foci. Scale bar, 1 μm. Mean percentage of cells (right panel) with bipolar
ParB foci (blue), unipolar foci (green), or partially translocated foci (red)
for JP2, JP138 and JP141. Data are mean ± s.e.m. (n = 3 replicates of
>400 cells each). (b) Pauses and reversals of ParB–parS translocation in
the absence of tipN. A ΔtipN strain was induced to express ParA–eYFP
(green) and mCherry–ParB (red). Synchronized and phase-contrast, eYFP
and mCherry fluorescence images were collected at the indicated intervals
after the initiation of S phase. A representative ΔtipN cell undergoing parS
translocation reversal is shown as phase/eYFP/mCherry overlay. The large
white arrows indicate the major ParB-associated ParA localization; smaller
arrows indicate other associated ParA structures. Scale bar, 1 μm. (c)
Heterologous colocalization assay in E. coli demonstrates that TipN recruits
ParA–eYFP into a complex in E. coli. A portion of the Shigella protein IcsA
(IcsA507–620
) recruits full-length and fragments of C. crescentus TipN to
the E. coli cell pole. Full-length TipN (top row), TipNNTD
(middle row) or
TipNCTD
(bottom row) fused to IcsA507–620
–mCherry (red) were co-expressed
with ParADNA
–eYFP (green) in E. coli cells, and imaged for phase contrast,
eYFP and mCherry fluorescence. Images are overlaid: phase/mCherry/eYFP
(left column), phase/mCherry (middle column), phase/eYFP (right column).
Colocalization is observed only with full-length and TipNCTD
fragments.
(d) Purified ParA and TipNCTD
interact directly in vitro. SPR analysis using
immobilized TipNCTD
. ParA (750 nM) was injected with ATP (green), ADP
(red), or no nucleotide (blue), followed by buffer only (150 s). Response
units (R.U.) are plotted versus time (s).
nature cell biology VOLUME 12 | NUMBER 8 | AUGUST 2010 795
© 20 Macmillan Publishers Limited. All rights reserved10
- 6. L E T T E R S
When we immobilized ParB and added ParA and ATP, we observed a
rapid increase in response (Fig. 2d). ParA injected with ADP or without
nucleotide produced a minimal response (Fig. 2d). We next immobi-
lized the non-specific DNA duplex, parS-scr8
, and assessed ParA associa-
tion. ParA produced an increase in response when combined with ATP
(Fig. 2e). On its own, or when combined with ADP, ParA produced a
minimal response (Fig. 2e), suggesting that ATP is required for ParA
polymerization and its interaction with ParB and with DNA.
As ParA readily binds DNA in vitro and in vivo, we hypothesized that
nucleoid-immobilized ParA structures move the ParB-bound centro-
mere complex through ParB-stimulated dissociation of ParA subunits
from the DNA. We examined the role of ParB in ParA dynamics by
localizing ParA–eYFP in ParB-depleted cells. After ParB depletion, ParA
localized uniformly throughout the cell, whereas dynamic ParA–eYFP
structures were observed in cells not depleted of ParB (Fig. 3a). In cells
depleted of wild-type ParB, but expressing mCherry–ParB, ParA–eYFP
localization was dynamic and led mCherry–ParB foci poleward (Fig. 3a).
However, expression of a ParA interaction-deficient mutant, ParBL12A
(ref.32;SupplementaryInformation,Fig.S3a)producedstaticmCherry–
ParB foci and diffuse ParA–eYFP localization (Fig. 3a). To dissect the
role of parS, we localized ParA and ParB in E. coli cells with and without
a parS-containing plasmid. ParA–eYFP expressed with or without the
parS plasmid localized to the nucleoid (Fig. 3b). CFP–ParB expressed
alone localized diffusely without parS, but formed foci in the presence
of the parS plasmid (Fig. 3b). Co-expressed ParA–eYFP and CFP–ParB
localized similarly to the single expression strains without parS, but in
the presence of parS, CFP–ParB formed foci and ParA–eYFP occasion-
ally oscillated between nucleoids (Fig. 3b, c). These results suggest that,
in vivo, ParB clustered on parS stimulates the dynamic localization of
ParA structures over the nucleoid.
We tested the effect of ParB on the stability of ParA–DNA complexes
in vitro using SPR. When associated with a nonspecific DNA surface,
ParA with ATP produced a rapid increase in response, followed by a
slow dissociation with buffer only (Fig. 3d). When ParB was injected
during ParA dissociation, we observed an abrupt increase in response,
indicating the formation of a ParB complex with DNA-bound ParA.
Subsequently, the signal rapidly decreased to well below the ParA disso-
ciation curve, indicating the dissociation of ParA from the DNA (Fig. 3d,
red). Similar results were observed using gel shifts (Supplementary
Information, Fig. S3b). These data suggest that the ParB–parS complex
moves relative to the ParA-bound nucleoid through simultaneous bind-
ing to and removal of ParA from the structure.
The C. crescentus ParA dynamics observed in E. coli suggest that ParA,
ParBandparSaresufficienttoassembleadynamicmachine.However,the
polar localization of ParA mutants in C. crescentus (Fig. 2b) suggests that
additional factors contribute to ParA localization. To identify polar inter-
actionpartnersofParA,weexpressedthebipolar-localizedParADNA
–eYFP
instrainswithdeletionsinproteinsknownto localizeto thenewcellpole.
IncellslackingthenewpoleproteinTipN1,2
,weobservedadecreaseinthe
frequency of new-pole ParADNA
–eYFP foci (data not shown), suggesting
that TipN is required to position ParADNA
. To examine the role of TipN in
segregation, we visualized ParB–parS segregation in synchronized wild-
type(JP138)and∆tipN(JP141)strains.TheJP138strainhadasimilareffi-
ciencyofchromosomesegregationasthatobservedforthe parB::cfp-parB
strain (Fig. 4a). However, the ∆tipN strain showed predominantly partial
parS segregation events (Fig. 4a). Time-lapse imaging of ParA–eYFP and
mCherry–ParB in ∆tipN showed that ParB–parS translocation paused
frequently and reversed direction (Fig. 4b; Supplementary Information,
Fig.S3c).ReversalcorrelatedwithParAredistributiontotheoppositeside
oftheParB–parScomplex(Fig.4b;SupplementaryInformation,Fig.S3c).
Therefore,TipNisrequiredtomaintainParA-mediatedparStranslocation
directionality towards the new pole.
To determine whether ParA and TipN interact directly, we devel-
oped an assay to screen for protein–protein interactions in E. coli. This
assay used a peptide from the Shigella protein IcsA (IcsA507–620
, hereafter
referred to as IcsA) to localize proteins to the E. coli cell pole33
, allow-
ing colocalization studies with other fluorescent proteins. Full-length
C. crescentus TipN fused to IcsA localized to the E. coli pole and recruited
ParADNA
–eYFP (Fig. 4c), whereas IcsA alone did not (data not shown).
IcsA fusions to both the TipN N-terminal domain (TipNNTD
, residues
1–207) and the C-terminal domain (TipNCTD
, residues 205–888) also
localized to the cell pole, but only the TipNCTD
recruited ParADNA
–eYFP
(Fig. 4c). We assayed the direct interaction of ParA with immobilized
TipNCTD
in vitro using SPR. On addition of ParA and ATP, we observed
ATP
or
a b
(i) (ii)
(iii)
(iv)
(v)
(vi)
(vii)
(viii)
(i)
(ii)
(v)
?
(iii)
(iv)
?
Figure 5 A burnt-bridge Brownian ratchet mechanism for Par-mediated
chromosome segregation in C. crescentus. (a) Proposed sequence of
molecular interactions during Par-mediated DNA segregation. (i) Apo-
ParA (green circle) binds ATP, changes conformation (green box), and (ii)
dimerizes, (paired green box)18
. The ParA-ATP homodimer (iii) binds to the
nucleoid, or (iv) polymerizes along DNA or in solution (red arrows indicate
the direction of polymerization/depolymerization). (v) TipN (yellow circles)
may nucleate or stabilize a ParA polymer at the new pole, and (vi) ParA fibres
bundle. The ParB–parS complex (red circles/blue parS DNA) (vii) encounters
the end of a ParA fibre and binds. ParB stimulates the terminal ParA of a
protofilament to release (viii) and the ParB complex ratchets along the end
of a retracting ParA structure (blue arrow indicates direction of ParB–parS
movement). (b) Diagram showing the proposed mechanism operating within
the C. crescentus cell. (i) A C. crescentus swarmer cell. The unreplicated
chromosome (brown coil partially associated with ParA) is tethered to the
old pole via ParB (red circle) interactions with PopZ (cyan line)8,9
. TipN
(yellow circle) is positioned at the new pole1,2
. (ii) The ParB–parS complex
is released from the pole and duplicated parS (purple line indicates newly
replicated DNA) are decorated with ParB, while TipN may effect the
formation or stabilization of a ParA fibre structure (green complex) at the
new pole. (iii) A ParB–parS complex encounters the ParA structure and
binds it. (iv) The ParB–parS complex disassembles the ends of some ParA
protofilaments, ratcheting along a receding ParA structure, leaving other
ParA filaments behind. (v) The ParB–parS complex is tethered to the polar
PopZ complex. The ParA structure reorganizes, and TipN is recruited to the
division site to be positioned for subsequent rounds of segregation.
796 nature cell biology VOLUME 12 | NUMBER 8 | AUGUST 2010
© 20 Macmillan Publishers Limited. All rights reserved10
- 7. L E T T E R S
an increase in signal corresponding to ParA binding that was specific for
TipNCTD
(Fig. 4d). ParA and ADP, or no nucleotide, produced a lower
signal than that observed with ATP (Fig. 4d), suggesting that apo-ParA
interacts directly with the C-terminal region of TipN, and that ATP
augments the interaction.
Together, our data support a burnt-bridge Brownian ratchet model
for Par-mediated chromosome segregation in C. crescentus (Fig. 5a, b).
In vitro, ParA formed linear polymers, but also interacted readily with
DNA in vitro and in vivo, suggesting that ParA polymers may form
either along the nucleoid or freely in the cytoplasm, or both, and bun-
dle into a linear structure (Fig. 5a, vi). In vitro, ParB removes ParA from
DNA, consistent with our observations in vivo that ParB depletion
or mutation quenches ParA dynamics, and that wild-type ParB com-
plexes ‘follow’ a receding ParA structure. Thus, we propose that ParB
stimulates the dissociation of ParA subunits from the ends of a ParA
structure while remaining attached, moving the ParB-parS complex
along a retracting ParA structure (Fig. 5a, vii). The simultaneous inter-
action with, and dissociation of, the ParA structure may be explained
by the association of multiple ParB proteins with the parS region34,35
.
Thermal motion of the ParB-parS complex may be trapped by ParB
binding to the ParA structure as the structure shortens, explaining the
rectified diffusional motion observed for ParB complexes in Vibrio
cholerae36
. Finally, our data suggest that ParB-parS complexes move
along a subset of fibres within the ParA bundle, as a less intense struc-
ture is often left behind the translocating ParB complex. Thus, ParA
may be available for ParB-stimulated removal only when located at
protofilament termini.
The C. crescentus Par system mobilizes the parS locus unidirection-
ally from the old pole to the new pole37
, in contrast to the bidirectional
movement observed for plasmid segregation15
. One contributor to uni-
directionality in C. crescentus is the polar protein PopZ, which tethers
ParB-parS to the cell pole8,9
(Fig. 5b, i) to prevent reversals. Here we
identify a new directionality factor for the C. crescentus Par system: the
new pole-specific protein TipN1,2
. Without TipN, ParA localizes aber-
rantly, causing pauses and reversals in ParB–parS segregation. These
defects observed in the absence of tipN may reflect secondary effects,
such as on the MreB-associated cytoskeleton1
. However, ParA and TipN
interact directly in vitro (Fig. 4d), suggesting a functional interaction
in vivo. TipN might nucleate or stabilize ParA structures at the new pole
(Fig. 5b, i). Alternatively, TipN might simply provide a binding site for
ParA to increase the local concentration and bias the insertion of free
ParA molecules into the structure at the new pole. After segregation, the
translocated ParB–parS complex is anchored to PopZ at the new pole
(Fig. 5b, v), while TipN is recruited to the division plane to remain at the
new poles of the daughter cells to reset the cycle.
Overall, the basic operating principles that drive DNA segregation
seemtobeshared betweenprokaryotic andeukaryotic mitotic machiner-
ies. The bacterial ParB–parS complex shares functional and architectural
similarities with the eukaryotic kinetochore complexes, as both associate
with, and spread along, the centromere DNA region38
. Both C. crescen-
tus and eukaryotic kinetochores seem to use multivalent attachments to
allowthesimultaneousbindingto,anddepolymerizationof,thepolymers
that guide their movement, reminiscent of the eukaryotic DamI–Ndc80
complex proposed to follow along depolymerizing microtubule ends38
.
Finally,polarTipNmayfunctionasacentrosome-likeorganizationcentre
to bias the movement of retracting polymers towards the cell pole.
METHODS
Methods and any associated references are available in the online version
of the paper at http://www.nature.com/naturecellbiology/
Note: Supplementary Information is available on the Nature Cell Biology website.
ACknoWLEdGMEnTS
We thank Jimmy Blair for assistance with modelling of ParA mutants, and critical
reading of the manuscript; and Grant Bowman, Erin Goley and Julie Biteen
for technical advice. We thank Jian Zhu and Thomas Earnest for providing
purified 6His–ParB. This work is supported by National Institutes of Health
grants R01 GM51426 R24 and GM073011-04d to L.S., NIH/NIGMS fellowship
F32GM088966-1 to J.P., NIH/NIGMS award R01GM086196-2 to W.E.M., the
Smith Stanford Graduate Fellowship to E.T., and a Helen Hay Whitney postdoctoral
fellowship to E.G. This work was also supported by the Director, Office of Science,
Office of Biological and Environmental Research, of the U.S. Department of Energy
under contract no. DE-AC02-05CH11231.
AuThoR ConTRibuTionS
J.P., S.L., W.E.M. and L.S. designed the research; J.P. performed C. crescentus
genetic, epifluorescence microscopy and biochemical experiments; S.L. performed
single molecule imaging and data analysis; E.G. purified native ParA and
performed ParA light-scattering experiments; E.T. designed ParA/DNA SPR
experiments and performed time-lapse microscopy experiments on ΔtipN strains;
M.E. performed SPR experiments and analysis; L.C. performed ParA negative-
stain electron microscopy imaging; W.E.M. and L.S. supervised the study; J.P., S.L.,
W.E.M. and L.S. wrote the paper.
CoMPETinG inTERESTS
The authors declare no competing financial interests.
Published online at http://www.nature.com/naturecellbiology/
Reprints and permissions information is available online at http://npg.nature.com/
reprintsandpermissions/
1. Lam, H., Schofield, W. B. & Jacobs-Wagner, C. A landmark protein essential for
establishing and perpetuating the polarity of a bacterial cell. Cell 124, 1011–1023
(2006).
2. Huitema, E., Pritchard, S., Matteson, D., Radhakrishnan, S. K. & Viollier, P. H. Bacterial
birth scar proteins mark future flagellum assembly site. Cell 124, 1025–1037 (2006).
3. Gerdes, K., Moller-Jensen, J. & Bugge Jensen, R. Plasmid and chromosome partitioning:
surprises from phylogeny. Mol. Microbiol. 37, 455–466 (2000).
4. Mohl, D. A., Easter, J., Jr & Gober, J. W. The chromosome partitioning protein, ParB,
is required for cytokinesis in Caulobacter crescentus. Mol. Microbiol. 42, 741–755
(2001).
5. Mohl, D. A. & Gober, J. W. Cell cycle-dependent polar localization of chromosome
partitioning proteins in Caulobacter crescentus. Cell 88, 675–684 (1997).
6. Toro, E., Hong, S. H., McAdams, H. H. & Shapiro, L. Caulobacter requires a dedi-
cated mechanism to initiate chromosome segregation. Proc. Natl Acad. Sci. USA 105,
15435–15440 (2008).
7. Bowman, G. R. et al. Caulobacter PopZ forms a polar subdomain dictating sequential
changes in pole composition and function. Mol. Microbiol. 76, 173–189.
8. Bowman G. R. et al. Polymeric protein anchors the chromosomal origin/ParB complex
at a bacterial cell pole. Cell 134, 945–955 (2008).
9. Ebersbach G, B. A., Jensen GJ, Jacobs-Wagner C A self-associating protein critical for
chromosome attachment, division, and polar organization in Caulobacter. Cell 134,
956–968 (2008).
10. Lim, G. E., Derman, A. I. & Pogliano, J. Bacterial DNA segregation by dynamic SopA
polymers. Proc. Natl Acad. Sci. USA 102, 17658–17663 (2005).
11. Bouet, J. Y., Ah-Seng, Y., Benmeradi, N. & Lane, D. Polymerization of SopA partition
ATPase: regulation by DNA binding and SopB. Mol. Microbiol. 63, 468–481 (2007).
12. Fogel, M. A. & Waldor, M. K. A dynamic, mitotic-like mechanism for bacterial chromo-
some segregation. Genes Dev. 20, 3269–3282 (2006).
13. Hatano, T., Yamaichi, Y. & Niki, H. Oscillating focus of SopA associated with filamentous
structure guides partitioning of F plasmid. Mol. Microbiol. 64, 1198–1213 (2007).
14. Leonard, T. A., Moller-Jensen, J. & Lowe, J. Towards understanding the molecular basis
of bacterial DNA segregation. Philos. Trans. R. Soc. Lond. B. Biol. Sci. 360, 523–535
(2005).
15. Ringgaard, S., van Zon, J., Howard, M. & Gerdes, K. Movement and equipositioning of
plasmids by ParA filament disassembly. Proc. Natl Acad. Sci. USA 106, 19369–19374
(2009).
16. Barilla, D., Rosenberg, M. F., Nobbmann, U. & Hayes, F. Bacterial DNA segrega-
tion dynamics mediated by the polymerizing protein ParF. EMBO J. 24, 1453–1464
(2005).
17. Ebersbach, G. et al. Regular cellular distribution of plasmids by oscillating and filament-
forming ParA ATPase of plasmid pB171. Mol. Microbiol. 61, 1428–1442 (2006).
18. Leonard, T. A., Butler, P. J. & Lowe, J. Bacterial chromosome segregation: structure
and DNA binding of the Soj dimmer — a conserved biological switch. EMBO J. 24,
270–282 (2005).
nature cell biology VOLUME 12 | NUMBER 8 | AUGUST 2010 797
© 20 Macmillan Publishers Limited. All rights reserved10
- 8. L E T T E R S
19. Pratto, F. et al. Streptococcus pyogenes pSM19035 requires dynamic assembly of
ATP-bound ParA and ParB on parS DNA during plasmid segregation. Nucleic Acids
Res. 36, 3676–3689 (2008).
20. Batt, S. M., Bingle, L. E., Dafforn, T. R. & Thomas, C. M. Bacterial genome partition-
ing: N-terminal domain of IncC protein encoded by broad-host-range plasmid RK2
modulates oligomerisation and DNA binding. J. Mol. Biol. 385, 1361–1374 (2009).
21. Ebersbach, G. & Gerdes, K. The double par locus of virulence factor pB171: DNA
segregation is correlated with oscillation of ParA. Proc. Natl Acad. Sci. USA 98,
15078–15083 (2001).
22. Ebersbach, G. & Gerdes, K. Bacterial mitosis: partitioning protein ParA oscillates
in spiral-shaped structures and positions plasmids at mid-cell. Mol. Microbiol. 52,
385–398 (2004).
23. Quisel, J. D., Lin, D. C. & Grossman, A. D. Control of development by altered localization
of a transcription factor in B. subtilis. Mol. Cell 4, 665–672 (1999).
24. Marston, A. L. & Errington, J. Dynamic movement of the ParA-like Soj protein of
B. subtilis and its dual role in nucleoid organization and developmental regulation.
Mol. Cell 4, 673–682 (1999).
25. Castaing, J. P., Bouet, J. Y. & Lane, D. F plasmid partition depends on interaction of
SopA with non-specific DNA. Mol. Microbiol. 70, 1000–1011 (2008).
26. Barilla, D., Carmelo, E. & Hayes, F. The tail of the ParG DNA segregation protein
remodels ParF polymers and enhances ATP hydrolysis via an arginine finger-like motif.
Proc. Natl Acad. Sci. USA 104, 1811–1816 (2007).
27. Easter, J., Jr & Gober, J. W. ParB-stimulated nucleotide exchange regulates a switch in
functionally distinct ParA activities. Mol. Cell 10, 427–434 (2002).
28. Fung, E., Bouet, J. Y. & Funnell, B. E. Probing the ATP-binding site of P1 ParA: partition
and repression have different requirements for ATP binding and hydrolysis. EMBO J.
20, 4901–4911 (2001).
29. Murray, H. & Errington, J. Dynamic control of the DNA replication initiation protein
DnaA by Soj/ParA. Cell 135, 74–84 (2008).
30. Hester, C. M. & Lutkenhaus, J. Soj (ParA) DNA binding is mediated by conserved
arginines and is essential for plasmid segregation. Proc. Natl Acad. Sci. USA 104,
20326–20331 (2007).
31. Thanbichler, M. & Shapiro, L. MipZ, a spatial regulator coordinating chromosome
segregation with cell division in Caulobacter. Cell 126, 147–162 (2006).
32. Gruber, S. & Errington, J. Recruitment of condensin to replication origin regions by
ParB/SpoOJ promotes chromosome segregation in B. subtilis. Cell 137, 685–696
(2009).
33. Charles, M., Perez, M., Kobil, J. H. & Goldberg, M. B. Polar targeting of Shigella
virulence factor IcsA in Enterobacteriacae and Vibrio. Proc. Natl Acad. Sci. USA 98,
9871–9876 (2001).
34. Breier, A. M. & Grossman, A. D. Whole-genome analysis of the chromosome partitioning
and sporulation protein Spo0J (ParB) reveals spreading and origin-distal sites on the
Bacillus subtilis chromosome. Mol. Microbiol. 64, 703–718 (2007).
35. Rodionov, O., Lobocka, M. & Yarmolinsky, M. Silencing of genes flanking the P1 plasmid
centromere. Science 283, 546–549 (1999).
36. Fiebig, A., Keren, K. & Theriot, J. A. Fine-scale time-lapse analysis of the bipha-
sic, dynamic behaviour of the two Vibrio cholerae chromosomes. Mol. Microbiol. 60,
1164–1178 (2006).
37. Viollier, P. H. et al. Rapid and sequential movement of individual chromosomal loci to
specific subcellular locations during bacterial DNA replication. Proc. Natl Acad. Sci.
USA 101, 9257–9262 (2004).
38. Tanaka, T. U. & Desai, A. Kinetochore-microtubule interactions: the means to the end.
Curr. Opin. Cell Biol. 20, 53–63 (2008).
798 nature cell biology VOLUME 12 | NUMBER 8 | AUGUST 2010
© 20 Macmillan Publishers Limited. All rights reserved10
- 9. DOI: 10.1038/ncb2083 M E T H O D S
METHODS
Bacterial strains and culture conditions. Culturing and manipulation of bacte-
rial strains were carried out as described previously31
.
Description of plasmids, cloning and bacterial strains. Descriptions of
C. crescentus and E. coli strains and plasmids are provided in Supplementary
Information, Tables S2 and S3. Specific details of strain construction, cloning
and primer sequences will be provided on request.
Construction of plasmids. The oligonucleotides used for constructing the fol-
lowing plasmids are listed in Supplementary Information, Table 4. For general
subcloning PCRs, KOD Hotstart DNA polymerase (Toyoba) was used for amplifi-
cation. For quickchange mutagenesis, Pfu Ultra (Stratagene) was used. Restriction
enzymes and calf intestinal phosphatase (CIP) were obtained from NEB, and T4
DNA ligase from Fermentas. Unless otherwise stated, all point mutations were
introduced using the Quickchange method (Stratagene).
The plasmid pJP9 contains the parA gene with carboxy-terminal eyfp under
control of the xylose promoter for integration at the chromosomal xylX locus.
The parA gene was amplified and cloned into the NdeI and SacI sites in pXYFPC
5 (ref. 41).
The plasmids pJP45, pJP47, and pJP49 are derivatives of pJP9 in which the
mutations G16V, K20Q, and D44A, respectively, were introduced. The plasmids
pJP52 and pJP53 are variants of pJP45 with the substitution D44A or K20Q
respectively, and the plasmid pJP85 is a variant of pJP49 with the substitution
K20Q.
The plasmid pJP58 is a high-copy replicating plasmid that carries theparA–eyfp
E. coli gene under control of the vanillate inducible promoter. The parA–eyfp gene
was cloned into the NdeI and XbaI sites of pBVMCS 4 (ref. 41)
The plasmid pJP80 allows the genomic replacement of theparA and parB genes
with parA–eyfp and cfp–parB, respectively. The parA–eYFP gene was amplified
from pJP9. The cfp–parB gene, including the intergenic region between parA and
cfp–parB, was amplified from the C. crescentus strain JP2 (MT190; ref. 31). These
PCR products were digested with XbaI and SphI and ligated simultaneously into
the SphI site of pNPTS138 (M.R.K. Alley, unpublished).
The plasmid pJP88 is a variant of the plasmid pACYC-duet1 that allows the
IPTG-inducible expression of ParA–eYFP. The parA–eyfp gene was amplified
from pJP9 and cloned into the NdeI/XhoI sites of pACYC-duet1. A similar strat-
egy was applied to clone the parA–eyfp genes that contained the desired mutations
for plasmids pJP89, pJP94, pJP95 and pJP96, but using pJP50, pJP45, pJP47 and
pJP49, respectively, as templates for PCR.
The plasmid pJP97 contains the parB gene with mcherry N-terminally fused
under control of the vanillate-inducible promoter for integration at the chromo-
somal vanA locus. The parB gene was amplified from the plasmid pMT329 (ref.
31) and cloned into the KpnI and NheI sites in pVCHYN 2 (ref. 41).
The plasmid pJP102 is a low-copy replicating plasmid that carries a DNA
sequence containing the double parS locus from the C. crescentus gidA promoter
region cloned into the KpnI site of pRVMCS2 (ref.41).
The plasmid pJP108 is a derivative of pBad/HisA (Invitrogen) that allows ara-
binose-inducible expression of the protein fragment IcsA507–620
with a C- terminal
mCherry fusion, which localizes to the E. coli cell pole. The icsA507–620
gene frag-
ment was amplified and cloned into the NdeI/KpnI sites in pVCHYC 2 (ref. 41)
to create the plasmid pJP104. The pBad/HisA vector and the icsA507–620
–mcherry
gene were amplified before both products were digested with HindIII and ligated
to create pJP108.
The plasmids pJP110, pJP111, and pJP112 were created by PCR amplifying
fragments of the tipN gene. These products were digested with KpnI and SacI and
ligated into the KpnI/SacI sites of pJP108.
The plasmid pJP120 contains the tipN–CTD gene (residues 205–888) with
an N-terminal 6His tag under control of the IPTG-inducible T7 lac promoter.
The tipN–CTD gene was amplified and cloned into the NdeI and SacI sites in
pET28a (Novagen).
The plasmid pJP131 contains the parB gene with mcherry N-terminally fused
under control of the vanillate-inducible promoter for integration at the chromo-
somal vanA locus. The parB gene was amplified from the plasmid pMT329 and
cloned into the KpnI and NheI sites in pVCHYN 5 (ref. 41). The plasmid pJP133
is a derivative of pJP131 in which the mutation L12A was introduced using the
quickchange primers listed in Supplementary Information, Table 4.
To create the non-specific DNA duplex for SPR experiments in Fig. 3d, a 162
nucleotide region of the C. crescentus parB gene that does not contain a parS site
was amplified using pJP97 as a template.
Protein expression and purification. For purification of native ParA, cultures of
EG223 were grown at 37ºC in Luria Bertani (LB) broth to and absorbance (A600
) of
0.6, cooled to 18 ºC and induced with 2 mM IPTG for 14 h. Pellets were lysed by
sonication in Buffer LC (100 mM KCl, 20 mM Tris-HCl at pH 7.0, 1 mM CaCl2
,
1 mM EDTA, 2 mM dithiothreitol (DTT)) with protease inhibitors, DNAase and
lysozyme. The lysate was incubated at 4 ºC for 2.5 h to allow ParA to precipitate,
and then spun at 125,000g for 30 min. The pellet was resuspended in Buffer
LC + 700 mM KCl, and incubated overnight. Samples were spun at 125,000g for
30 min, and the supernatant recovered. This was warmed to 25 ºC, and spun at
360,000g for 40 min to preclear aggregates. MgCl2
(20 mM) and ATP (10 mM)
were added, and the solution incubated at 25 ºC for 45 min, then spun at 360,000g
for 30 min. The glassy pellet was resuspended in Buffer F (500 mM KCl, 20 mM
Tris-HCl at pH 7.0, 1 mM CaCl2
, 1 mM EDTA, 2 mM DTT) + 5 mM EDTA,
and pulled though a syringe tip, dialysed into Buffer F, and run on a Superdex
S200 column in Buffer F. Peak fractions were combined with 50% glycerol and
frozen at –80 ºC.
For purification of 6His–TipNCTD
, eJP172 was cultured in LB containing kan-
amycin (kan) to A600
of about 0.6, induced with 1 mM IPTG for 2 h at 37 ºC before
pelleting at 8000g. Cell pellets were resuspended in lysis buffer (50 mM Hepes
at pH 7.5, 500 mM NaCl, 5% glycerol, 0.5% Triton X-100, 10 mM imidazole,
0.1 mM EDTA, 20 μg ml–1
RNaseA, 1 mM PMSF, 1 mM DTT) with protease
inhibitors (Roche), and passed twice through a French press (16,000 psi) before
centrifuging at 20,000g 30 min. The supernatant was loaded onto a 1-ml Nickel
HisTrap column (GE Healthcare), washed with 20 column volumes of wash buffer
(50 mM Hepes at pH 7.5, 500 mM NaCl, 10 mM imidazole, 5% glycerol), and
eluted using a linear gradient of imidazole from 10–500 mM in wash buffer at
1 ml min–1
. Pure fractions were dialysed into 50 mM Hepes at pH 7.5, 500 mM
NaCl, 5% glycerol, and stored at –80 ºC.
Epifluorescence microscopy and image analysis. Imaging was carried out as
described previously6
. The data in Fig. 4a were counted by hand and represented
as the mean percentage of cells observed at each stage 30 min after initiation of S
phase. Error bars represent the standard error of the mean calculated from three
independent experiments of > 400 cells per strain.
ParA–eYFPmutantlocalizations. C. crescentusstrains were cultured to log phase
in PYE containing oxytetracycline. Expression was induced by adding 0.3% xylose
for 120 min at 28 ºC before imaging. E. coli strains were grown to A600
of about
0.2 and induced with 0.1 mM IPTG for 60 min at 37 ºC before imaging.
Localization of the C. crescentus Par system in E. coli. E. coli BL21(DE3) strains
eJP140 (no parS plasmid) and eJP142 (with parS plasmid) were cultured to log
phase at 37 ºC in LB containing chloramphenicol/gentamycin (chlor/gent) and LB
containing chlor/gent/kan, respectively. Cultures were induced by the addition of
0.1 mM IPTG and/or 0.04 μM anhydrotetracycline for 60 min before imaging.
IcsA assay for protein–protein interactions in E. coli. IcsA507–620
–mCherry was
used to localize TipN and fragments thereof to the cell pole in E. coli. The E. coli
BL21(DE3) strains eJP157 (no TipN), eJP166 (TipN), eJP164 (TipNNTD
, residues
1–207), and eJP 165 (TipNCTD
, residues 205–888) were grown to log phase at
37 ºC in LB containing ampicillin/chlor. Protein expression was induced by the
addition of 0.08% arabinose and 0.04 mM IPTG, and images were acquired about
0.5 h after induction.
Sample preparation for single-molecule imaging. C. crescentus strains were
grown in M2G at 28°C for 2 days at log phase, induced with 0.15% xylose and
0.5 mM vanillate for 60 min, and swarmer cells were collected and resuspended
in M2 medium on ice. An aliquot of swarmer cells was resuspended in M2G
and deposited onto a 15 × 15 × 0.5 mm pad of 1.5% agarose (Sigma) in M2G
mounted on a 35 × 50 mm glass slide (Fisher Finest). Fluorescent beads (1 nM)
were added (Tetraspeck Microspheres, Invitrogen, 100 nm) as fiduciary markers.
A 22 × 22 mm top coverslip was applied (Fisher) and the sample was sealed with
wax. Samples were incubated at room temperature for 10–15 min, and imaged
for a maximum of 20 min.
nature cell biology
© 20 Macmillan Publishers Limited. All rights reserved10
- 10. M E T H O D S DOI: 10.1038/ncb2083
Single-moleculefluorescenceimaging. Whitelighttransmissionandsingle-mol-
ecule fluorescence images were acquired with an Olympus IX71 inverted micro-
scope equipped with an infinity-corrected oil immersion objective (Olympus
UPlanApo,×100,1.35NA)anddetectedona512×512pixelAndorIxonEMCCD
at a rate of 35 ms per frame for ParA–eYFP and 100 ms per frame for mCherry–
ParB. The general epifluorescence setup has been described previously39
; here the
filters used were a dichroic mirror (Chroma, Z514RDC), a 530-nm long pass filter
(Omega XF3082) for eYFP, and a 615-nm long pass filter (Chroma, HQ615LP) for
mCherry. Two colour images were acquired sequentially. First, mCherry–ParB
foci were imaged using 594-nm excitation light (Coherent, HeNe laser), and then
the same sample was illuminated with 514 nm light (Coherent Innova 90 Ar+
laser) to image the ParA–eYFP at intensities of 102
–103
Wcm–2
.
Super-resolution imaging and analysis. Super-resolution images were obtained
using image processing techniques published previously40
. Briefly, the use of eYFP
required initial bleaching until separated single molecules were observed. Then,
for each 35 or 100 ms imaging frame, the position of the a single emitter was
determined relative to a fixed fiducial by fitting the signal above background to
a 2D Gaussian function using the nonlinear least squares regression function
(nlinfit) in MATLAB (MathWorks). The super resolution structure images are
the sum of all fitted positions, where the inherent fluorescent intermittency of
eYFP allowed the continual sampling of the ParA fibre during the course of a
typical experiment (60 s) without the need for reactivation. Integration times
in the 35–100 ms range caused our images to reject quickly diffusing proteins.
Finally, each single-molecule position was re-plotted using a custom macro writ-
ten in ImageJ (http://rsb.info.nih.gov/ij/) as a 2D Gaussian profile defined by the
measured integrated intensity and a width given by the average statistical error
in localization of the centre (95% confidence interval, averaged over all single-
molecule localizations). Cell outlines were extracted by the derivative of the white
light transmission image using a custom edge-finding macro in ImageJ.
Cell fixation/ fixed-cell super resolution imaging. For experiments in
Supplementary Fig. S1c, log-phase cultures of the C. crescentus strain JP138
were induced to express ParA–eYFP and mCherry–ParB with 0.15% xylose and
0.5 mM vanillic acid for 60 min at 28°C. Cells were pelleted at 8000g 3 min at 4°C,
resuspended in M2G with 4% formaldehyde for 10 min at ambient temperature,
followed by 30 min on ice. Fixed cells were washed three times using equal vol-
umes of cold M2G, and stored on ice before imaging.
Light scattering assays. Long-term storage of concentrated ParA (6–40 μM) was
done in 500 mM KCl to avoid precipitation, and light scattering was carried out at
this salt concentration to differentiate between polymer and aggregate formation.
ParA was exchanged into Buffer F using a Nap5 column (GE Healthcare). Right-
angle light scattering was measured using a digital K2 Fluorimeter at 320 nm at
room temperature. An initial reading for 100 s was taken to establish the unpo-
lymerized baseline, after which nucleotide and/or MgCl2
was added. Light scat-
tering signals were normalized to the 0–100-s baseline.
Negative-stain electron microscopy. Negative-stain electron microscopy experi-
ments were performed in 20 mM Hepes pH7.5, 100 mM KCl, 2 mM MgCl2
,
supplemented where indicated with ATP at 1 mM and ParA at 1 μM. Reactions
were incubated for 5–10 min at ambient temperature before processing. Samples
were processed and imaged essentially as described previously8
.
Surface plasmon resonance (SPR) experiments. SPR experiments were per-
formed on a Biacore 3000 system at 25°C using a flow rate of 30 μl min–1
in Buffer
HMK (20 mM Hepes/NaOH, 2 mM MgCl2
, 100 mM KCl) and, where indicated,
contained1mMATPorADP(Sigma).AllproteinsweredialysedintoBufferHMK
before injection. Purified 6His–ParB and 6His–TipNCTD
were indirectly immobi-
lized to CM5 sensor chips through covalently coupled anti-6His antibodies. The
biotinylated parS and parS-scr duplex DNA molecules were immobilized on a
streptavidin-coated Sensor Chip SA (Biacore) according to the manufacturer’s
instructions. Data were corrected for non-specific interactions by subtracting the
signal in a control flow cell that lacked immobilized ligand, and analysed using the
BIAevaluationsoftware(Biacore).ForexperimentsinFig. 2d,abiotinylated162-bp
non-parS containing PCR product was produced using primers (5΄-ccatgtccgaag-
ggcgtcgtggt-3΄and5΄-attctagcggccgctcagcggaaggtccgacggggc-3΄),withpMT329as
a template, and were purified and immobilized as described above.
ParB depletion/ParA–eYFP localization experiments. The C. crescentus strain
JP78 was grown to log phase in PYE containing kan/gent and 0.0625% xylose4
,
washed with 28°C PYE containing kan/gent, but lacking xylose, and resuspended
in the same buffer. Cultures were grown for 5 h at 28°C to allow ParB deple-
tion before splitting. Vanillic acid (0.25 mM) was added to one half, and both
halves were incubated for an additional hour at 28°C to induce expression of
ParA–eYFP. Before imaging, equal cell densities were collected and boiled in
2 × SDS sample buffer (125 mM Tris-HCl at pH 6.8, 20% glycerol, 5% SDS, 10%
B-mercaptoethanol) for western blot analysis using antibodies raised against
ParB5
(data not shown) to confirm depletion.
ParB depletion, mCherry–ParB and ParA–eYFP addback experiments. The
strains JP158 and JP159 were cultured to log phase in PYE containing kan/gent/
oxytetracycline with 0.0625% xylose, washed and resuspended in PYE medium
lacking xylose. Cultures were grown for 5 h to allow ParB depletion before adding
0.5 mM vanillic acid, and cultured for an additional hour at 28°C to induce expres-
sion of ParA–eYFP and mCherry–ParB or mCherry–ParBL12A
before imaging.
ParA–ParBinteractionassayinE.coli. The assay takes advantage of the observa-
tion that ParAD44A
(ParAhydrolysis
) colocalizes intensely with the parS-bound ParB
complex in vivo, and mutations in ParB that disrupt this interaction should form
parS-bound complexes that do not colocalize with ParAD44A
–eYFP. Cultures of the
E. coli BL21(DE3) strains eJP211 and eJP212, which carry a parS-containing plas-
mid, were cultured to log phase at 37 ºC, induced to express CFP–ParB (eJP211)
or CFP–ParBL12A
(eJP212) by the addition of anhydrotetracycline to 0.04 μM and
IPTG to 0.1 mM and grown for an additional 30 min at 37 ºC before imaging.
Gel shift experiments. A 162-nucleotide DNA probe was prepared by PCR from
the C. crescentus parB gene. Purified PCR products were end-labelled with 32
P-γ-
ATP. Binding reactions were assembled at room temperature in 20 mM Hepes/
NaOH at pH 7.5, 100 mM KCl, 2 mM MgCl2
, and 2.5% glycerol, with DNA probe
at 2.5 nM and 1 mM ATP or ADP. ParA was added to 625 nM, incubated at room
temperature for 5 min before the addition of ParB (625 nM dimer) and/or unla-
belled 185-nucleotide parS DNA (20 nM, or 75 μg ml–1
BSA (where applicable)).
Reactions were incubated for an additional 5 min at room temperature before
loading onto pre-cast, 4–15% non-denaturing PAGE gels (BioRad) and run in 1×
Tris-borate buffer with 1 mM MgCl2
.
39. Deich, J., Judd, E. M., McAdams, H. H. & Moerner, W. E. Visualization of the movement
of single histidine kinase molecules in live Caulobacter cells. Proc. Natl Acad. Sci. USA
101, 15921–15926 (2004).
40. Biteen, J. S. et al. Super-resolution imaging in live Caulobacter crescentus cells using
photo-switchable EYFP. Nature Methods (2008).
41. Thanbichler, M., Iniesta, A.A., Shapiro, L. A comprehensive set of plasmids for vanil-
late- and xylose-inducible gene expression in Caulobacter crescentus. Nucleic Acids
Res. 35, e137 (2007).
nature cell biology
© 20 Macmillan Publishers Limited. All rights reserved10
- 11. supplementary information
www.nature.com/naturecellbiology 1
DOI: 10.1038/ncb2083
Figure S1 ParA and ParB SR images during chromosome segregation in vivo are
consistent with a ParB-mediated ParA depolymerization model for chromosome
segregation. (a) A field showing two-color SR images of multiple cells prior to
the initiation of S-phase (cells labeled A-F, for precisions see Supplementary
Information, Table 1). Evident is the ubiquity with which long-axis oriented
ParA filaments appear. (b) Image gallery showing various two-color SR images
of cells imaged during ParB/parS segregation (cells labeled A-D). All exhibit
partially translocated ParB foci and a well-defined ParA filament along the
long axis of the cell. (c) (left) Cytoplasmic eYFP does not localize into fiber
structures. Caulobacter crescentus strain JP145 (xylX::eyfp, expressing
cytoplasmic eYFP) was imaged and analyzed as described above. The temporal
integration regime precludes the imaging of Brownian diffusers, and the image
is likely generated when the fluorophore displays some non-specific pausing.
(right) ParA fiber structures were observed when ParA was fused to mCherry.
A mixed culture of JP4 (xylX::parA-mcherry) was induced to express ParA-
mCherry and imaged and processed as described for ParA-eYFP. Intermittency
of the label was used as the blinking mechanism to produce single-molecule
localizations and SR images, as with eYFP. (lower middle) Linear ParA
structures are observed in cells fixed with formaldehyde during segregation. The
strain JP137 was induced to express ParA-eYFP and mCherry-ParB, swarmer
cells were collected, and stimulated to enter S-phase. Cells were fixed with 4%
formaldehyde, imaged and processed using identical parameters to the other
single molecule experiments. (d) ParA structures observed in super-resolution
images are consistent with epifluorescence images when enhanced resolution
is removed. In a control experiment to test the fitting algorithm, the single-
molecule localization data used to generate the SR filaments (middle column)
were replotted as Gaussian functions with the original (diffraction-limited) fit
width rather than the positional error. The resulting reconstructed diffraction-
limited image (right column) agreed well with the unprocessed diffraction-
limited epifluorescence data (left column). Overall, these controls confirm that
the SR structures observed are consistent with the epifluorescence microscopy
experiments, yet show greater detail.
Supplementary Information, Figure 1
a. b.
d.c.
Epifluorescence
unprocessed data
super-resolution
data
reconstructed
diffraction-limited
data
A
B
cytoplasmic eYFP ParA-mCherry
fixed cell
A
B
C
D
E
F
A B
DCC
© 2010 Macmillan Publishers Limited. All rights reserved.
- 12. s upp le me ntary information
2 www.nature.com/naturecellbiology
Figure S2 ParA in vitro polymerization and in vivo mutational analysis. (a)
Right angle light scattering assay using purified ParA protein in the presence
of Mg only (blue), Mg-ADP (red), or Mg-ATP (green). Light scattering
(absorbance units) is plotted as a function of time (seconds). (b) Negative
stain electron micrographs of ParA incubated with or without ATP are
shown (scale bar= 50nm). ParA protofilaments (formed in the presence of
ATP) are ubiquitous. No polymers are observed in the absence of ATP. (c)
Pairwise amino acid sequence alignment of the T. thermophilus ParA (Soj)
and Caulobacter ParA (ParA) proteins, with identical residues highlighted
in red, similar residues in yellow, and non-conserved residues in black. The
red arrowheads indicate conserved residues mutated in Figure 2b of this
study. (d) Ribbon representations of chain A (yellow) of the Soj ParAD44A
homodimer crystal structure bound to Mg2+ (not shown) and ATP (stick
representation) (18, PDB ID: 2BEK). Shown is a magnified view of the active
site of the chain A subunit of the Soj structure. The ATP is displayed in stick
representation, and the Mg2+ ion as a green sphere. Depicted in cyan/blue
spheres is lysine20, which when replaced with glutamine 23 or alanine 18
produced an ATP binding defect in orthologous ParA proteins. Displayed
in red spheres is the alanine residue replacing aspartate 44 (mutated to
alanine in the Soj structure to prevent ATP hydrolysis) that coordinates the
nucleophilic water via the carboxyl oxygen 18. (e) Ribbon representations of
chain A (yellow) and chain B (cyan) of the Soj ParAD44A homodimer crystal
structure bound to Mg2+ (not shown) and ATP (stick representation) (18,
PDB ID: 2BEK). The G16 residue that was mutated to valine to prevent
dimerization (while allowing ATP binding) in each monomer is shown as a
sphere and produces a steric clash between monomers upon ATP binding18.
(f) Localizations of combination ATPase active site mutants of ParA-eYFP
demonstrate hierarchical dominance of mutant localizations. The indicated
strains were induced to express wild type or mutant ParA-eYFP, swarmer cells
were isolated, and phase, ParA-eYFP (green) and CFP-ParB (red) images
were collected and overlayed. Images of single mutant strains are shown for
comparison. Scale bars= 1µm.
Supplementary Information, Figure 2
a. b.
+ ATP - ATP
0 100 200 300 400
0
20
40
!
60
80
100
lightscattering(a.u.x1000)
time (s)
ParA light scattering
ParA-ADP
ParA-ATP
ParA only
c. d.
e. f.
G16V/ D44A
dimer/ hydrol
K20Q/G16V
ATP bind/ dimer
K20Q/ D44A
ATP bind/ hydrol K20Q
G16V
© 2010 Macmillan Publishers Limited. All rights reserved.
- 13. supplementary information
www.nature.com/naturecellbiology 3
Figure S3 ParB mutational and biochemical analysis and ΔtipN timelapse
experiment. (a) An assay for ParA and ParB interaction demonstrates that
ParBL12A does not interact with ParA in vivo. The assay takes advantage of the
observation that ParAD44A (ParAhydrolysis) colocalizes intensely with the parS-
bound ParB complex in vivo, and mutations in ParB that disrupt this interaction
should form parS-bound complexes that do not colocalize with ParAD44A-eYFP.
The E. coli BL21(DE3) strains eJP211 and eJP212, which carry a parS-
containing plasmid, were induced to express CFP-ParB (eJP211) or CFP-
ParBL12A (eJP212) and ParAD44A-eYFP, and phase, eYFP, and CFP images were
collected and overlayed as shown. Clear colocalization (yellow foci in overlay)
of ParAD44A-eYFP and CFP-ParB was observed, however, colocalization was not
observed for ParAD44A-eYFP and CFP- ParBL12A, demonstrating the ParBL12A
is defective in forming stable ParA interactions. Scale bars= 1µm. (b) ParB-
bound parS destabilizes a DNA-bound ParA complex in vitro. Native PAGE
gel shift assay using a 32P-labeled non-specific185 base pair duplex DNA
incubated with the following components. Lane1- no ParA. 2- ParA ADP, 3-7-
ParA ATP, 3- no additions, 4- ParB, 5- duplex parS DNA, 6- ParB and parS,
7- BSA. (g) Representative timelapse image series of JP133 (xylX::parA-eyfp,
vanA::mcherry-parB, delta tipN) (series A-D) in which representative ParB/parS
segregation defects and aberrant segregation in delta tipN cells are shown.
ParA-eYFP (green), mCherry-ParB (red), and phase contrast are overlayed.
Scale bars indicate 1µm.
Supplementary Information, Figure 3
a.
c. minutes
0
A
B
C
D
5 12 19 27 36 45 52 59 64
overlay CFP-ParB ParA -eYFP
D44A
CFP-ParB
CFP-ParB
L12A
b. 1 2 3 4 5 6 7
]free
ATP
]free
DNA
]shifted
DNA
© 2010 Macmillan Publishers Limited. All rights reserved.
- 14. s upp le me ntary information
4 www.nature.com/naturecellbiology
Supplementary Information, Table 1. Statistics of super-resolution images
Fig. Sample
Number of
Single
Molecule
localizations
Number of
Unique
Frames
Mean
Localization
precision
(nm)
Standard
deviation
(nm)
Imaging
Rate (ms)
Total
Imaging
Time (s)
Strain
1b. (ParA) Cell A 2002 1308 29.55 15.05 30 60 JP138
Cell B 1214 998 41.71 17.90 30 60 JP138
Cell C 1589 1232 42.93 21.09 30 60 JP138
1b. (ParB) Cell A 34 51 36.37 13.84 100 15 JP138
Cell B 145 73 27.43 13.73 100 15 JP138
Cell C 267 168 27.56 10.62 100 30 JP138
1b. A 2491 1558 38.76 19.56 30 60 JP138
(ParA) B 1836 1384 33.66 15.49 30 60 JP138
C 1151 815 30.91 15.10 30 60 JP138
D 1657 1399 31.55 13.40 30 60 JP138
E 2027 1281 28.18 13.35 30 60 JP138
F 2002 1308 29.55 15.05 30 60 JP138
S1b. A 951 690 35.66 17.97 30 60 JP138
(ParA) B 1001 789 29.36 14.50 30 60 JP138
C 1350 742 35.71 14.27 30 60 JP138
D 1541 1162 38.87 13.08 30 60 JP138
S1b. A 261 136 24.60 11.05 100 15 JP138
(ParB) B 267 213 31.74 15.05 100 30 JP138
C 86 50 32.78 12.57 100 15 JP138
D 139 102 27.34 12.85 100 15 JP138
S1c.
Free
eYFP 3808 2821 42.48 30.58 30 150 JP145
mCherry 375 218 56.61 23.91 30 45 ET225
Fixed
Cell 1832 1303 35.53 16.72 30 60 JP138
S1d. A 1836 1384 33.66 15.49 30 60 JP138
(ParA) B 2002 1308 29.55 15.05 30 60 JP138
© 2010 Macmillan Publishers Limited. All rights reserved.
- 15. supplementary information
www.nature.com/naturecellbiology 5
Supplementary Information, Table 2. Bacterial strains used in this study
Caulobacter strain Relevant genetic markers/description construction,source or reference
CB15N wild type Caulobacter crescentus Evinger and Agabian 1977
MT190 parB::cfp-parB Thanbichler et al. 2006
UC9031 parB::frameshift, xylX::parB Mohl et al. 2001
NR1751 Δ tipN Huitema et al. 2006
ET225 xylX::parA-mcherry Toro et al. 2008
JP13 xylX::parA-eyfp pJP9 transformed into CB15N
JP21 xylX::parA-eyfp, parB::cfp-parB pJP9 transformed into MT190
JP40 xylX::parA (G16V)-eyfp, parB::cfp-parB pJP45 transformed into MT190
JP45 xylX::parA (K20Q)-eyfp, parB::cfp-parB pJP47 transformed into MT190
JP47 xylX::parA (D44A)-eyfp, parB::cfp-parB pJP49 transformed into MT190
JP62 xylX::parA-eyfp, Δ tipN pJP9 transformed into NR1751
JP64 xylX::parA (R195E)-eyfp, parB::cfp-parB pJP50 transformed into MT190
JP66 xylX::parA(G16V, D44A)-eyfp, parB::cfp-parB pJP52 transformed into MT190
JP67 xylX::parA(K20Q, G16V)-eyfp, parB::cfp-parB pJP52 transformed into MT190
JP78 parB::frameshift, xylX::parB, pBV4-parA-eyfp pJP58 transformed into UC9031
JP104 xylX::parA-eyfp (R195E), Δ pleC/podJ pJP50 transformed into PN1097
JP105 xylX::parA-eyfp (R195E), Δ tipN pJP50 transformed into NR1751
JP110 parA::parA-eyfp, parB::cfp-parB pJP80 transformed into CB15N
JP128 xylX::parA(K20Q, D44A)-eyfp, parB::cfp-parB pJP85 transformed into MT190
JP133 vanA::mcherry-parB, xylX::parA-eyfp, Δ tipN pJP97 transformed into JP62
JP137 xylX::parA-eyfp, vanA::mCherry-parB pJP97 transformed into JP13
JP138 vanA::mcherry-parB pJP97 transformed into CB15N
JP141 vanA::mcherry-parB, Δ tipN pJP97 transformed into NR1751
JP145 xylX::eyfp Judd et al. 2003
JP158 parB::frameshift, xylX::parB, vanA::mcherry-parB,
pBV4-parA-eyfp pJP131 transformed into JP78
JP159 parB::frameshift, xylX::parB, vanA::mcherry-parB,
pBV4-parA-eyfp pJP133 transformed into JP78
E. coli strain plasmid(s) maintained strain background
EG223 pEG223 Rosetta(DE3)pLysS (Novagen)
eJP140 pMT329 (pBBR ori- PTet-cfp-parB),
pJP88(pACYC-duet1-parA-eyfp) BL21(DE3) (Novagen)
eJP142 pMT329 (pBBR ori- PTet-cfp-parB),
pJP88(pACYC-duet1-parA-eyfp),
pJP102 (pRV2-parS) BL21(DE3) (Novagen)
eJP146 pJP89 (pACYC-parA-eyfp R195E) BL21(DE3) (Novagen)
eJP147 pJP88 (pACYC-parA-eyfp) BL21(DE3) (Novagen)
eJP157 pJP108 (pBad/HisA-icsA507-620-mcherry
pJP89 (pACYC-ParA-eyfp R195E) BL21(DE3) (Novagen)
eJP164 pJP110 (pBad/HisA-icsA507-620- tipN1-207-mcherry)
pJP89 (pACYC-ParA-eyfp R195E) BL21(DE3) (Novagen)
eJP165 pJP111 (pBad/HisA-icsA507-620- tipN205-888-mcherry)
pJP89 (pACYC-ParA-eyfp R195E) BL21(DE3) (Novagen)
eJP165 pJP112 (pBad/HisA-icsA507-620- tipN-mcherry)
pJP89 (pACYC-ParA-eyfp R195E) BL21(DE3) (Novagen)
eJP172 pJP120 (pET28a- tipN205-888) Rosetta(DE3)pLysS (Novagen)
eJP175 pJP94 (pACYC-duet1-parA-eyfp G16V) BL21(DE3) (Novagen)
eJP176 pJP95 (pACYC-duet1-parA-eyfp K20Q) BL21(DE3) (Novagen)
eJP177 pJP96 (pACYC-duet1-parB-eyfp D44A) BL21(DE3) (Novagen)
eJP211 pMT329 (pBBR ori- PTet-cfp-parB) BL21(DE3) (Novagen)
pJP96 (pACYCduet1-ParAD44A-YFP)
pJP102 (pRVMCS2-parS(2))
eJP212 pJP141 (pBBR ori- PTet-cfp-parBL12A) BL21(DE3) (Novagen)
pJP96 (pACYCduet1-ParAD44A-YFP)
pJP102 (pRVMCS2-parS(2))
© 2010 Macmillan Publishers Limited. All rights reserved.
- 16. s upp le me ntary information
6 www.nature.com/naturecellbiology
Supplementary Information, Table 3. Plasmids used in this study
plasmid description source
____________________________________________________________________________________________________
pMT329 pBBR1 based vector for tet-inducible CFP-ParB expression Thanbichler and Shapiro, 2006
pRVMCS2 vanillate-inducible protein expression from low-copy
plasmid in Caulobacter (kan resisitance) Thanbichler et al. 2007
pBVMCS4 vanillate-inducible protein expression from high-copy
plasmid in Caulobacter (gent resistance) Thanbichler et al. 2007
pACYCduet1 IPTG-inducible protein expression in E. coli (Novagen)
pET28a IPTG-inducible N-terminally 6His tagged protein expression (Novagen)
pBad/HisA Arabinose-inducible protein expression (Invitrogen)
pXYFPC5 for C-terminal eyfp fusion of gene and insertion behind
PxylX in the C. crescentus chromosome Thanbichler et al. 2007
pXCHYC5 for C-terminal mcherry fusion of gene and insertion behind
PxylX in the C. crescentus chromosome Thanbichler et al. 2007
pVCHYN2 for N-terminal mcherry fusion of gene and insertion behind
PvanA in the C. crescentus chromosome (kan resistance) Thanbichler et al. 2007
pVCHYN5 for N-terminal mcherry fusion of gene and insertion behind
PvanA in the C. crescentus chromosome (oxytet. resistance) Thanbichler et al. 2007
pNPTS138 vector for gene replacement by homologous recombination M.R.K. Alley, unpublished
pEG223 overexpression of native ParA in E. coli this study
pJP9 pXYFPC5-parA this study
pJP45 pXYFPC5-parA (G16V) this study
pJP47 pXYFPC5-parA (K20Q) this study
pJP49 pXYFPC5-parA (D44A) this study
pJP50 pXYFPC5-parA (R195E) this study
pJP52 pXYFPC5-parA (G16V, D44A) this study
pJP53 pXYFPC5-parA (K20Q, G16V) this study
pJP58 pBVMCS4-parA-eyfp this study
pJP80 pNPTS138- parA-eyfp/cfp-parB this study
pJP85 pXYFPC5-parA (K20Q, D44A) this study
pJP88 pACYCduet1-parA-eyfp this study
pJP89 pACYCduet1-parA-eyfp (R195E) this study
pJP94 pACYCduet1-parA-eyfp (G16V) this study
pJP95 pACYCduet1-parA-eyfp (K20Q) this study
pJP96 pACYCduet1-parA-eyfp (D44A) this study
pJP97 pVCHYN2-parB this study
pJP102 pRVMCS2-(double parS region from gidA promoter) this study
pJP108 pBad/HisA- icsA507-620-mcherry this study
pJP110 pBad/HisA- icsA507-620-tipN1-207-mcherry this study
pJP111 pBad/HisA- icsA507-620-tipN205-888-mcherry this study
pJP112 pBad/HisA- icsA507-620-tipN-mcherry this study
pJP120 pET28a- tipN205-888 this study
pJP131 pVCHYN5-parB this study
pJP133 pVCHYN5-parBL12A this study
pJP141 pMT329 (cfp-parBL12A) this study
© 2010 Macmillan Publishers Limited. All rights reserved.