Recommended

Recommended
More Related Content
Similar to Alterations to Orbitofrontal Cortex Functional Connectivity in Individuals with Prediabetes
Similar to Alterations to Orbitofrontal Cortex Functional Connectivity in Individuals with Prediabetes (20)
Recently uploaded
Recently uploaded (20)
Alterations to Orbitofrontal Cortex Functional Connectivity in Individuals with Prediabetes
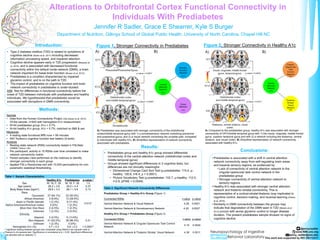
- 1. @jennyrsadler www.NIBLunc.org jenny_sadler@unc.edu This work was supported by R01 DK112317 Jennifer R Sadler, Grace E Shearrer, Kyle S Burger Department of Nutrition, Gillings School of Global Public Health, University of North Carolina, Chapel Hill NC • Type 2 diabetes mellitus (T2D) is related to symptoms of cognitive decline (Nolan et al, 2011) including decreased information processing speed, and impaired attention. • Cognitive decline appears early in T2D progression (Biessels et al, 2014) and is associated with decreased functional connectivity within the default mode network (DMN), a brain network important for basal brain function (Musen et al, 2012) • Prediabetes is a condition characterized by impaired glycemic control, and is on the path to T2D. • The impact of prediabetes on cognitive function and brain network connectivity in prediabetes is under-studied. AIM: Test for differences in functional connectivity before the onset of T2D between individuals with prediabetes and healthy individuals. We hypothesized that prediabetes would be associated with disruptions in DMN connectivity. Introduction: Methods: Sample • Data from the Human Connectome Project (Van Essen et al, 2012) Of the sample, n=825 with hemoglobin A1c measurement. • N=44 prediabetes group; A1c > 5.7% • N=44 healthy A1c group; A1c < 5.7%; matched on BMI & sex Measures • 4 resting state functional MRI runs = 58 minutes • NIH Toolbox’s cognitive function test battery (9 tests) Analysis • Resting state network (RSN) connectivity tested in FSLNets (FMRIB, Oxford, UK) • Per participant, activity in 15 RSNs over time correlated to make network connectivity matrix. • Paired samples t-test performed on the matrices to identify stronger connectivity in each group • Applied FSL’s Randomise tool with 10,000 permutations for non- parametric statistical thresholding. Alterations to Orbitofrontal Cortex Functional Connectivity in Individuals With Prediabetes Results: • Prediabetes group and healthy A1c group showed differential connectivity of the ventral attention network (orbitofrontal cortex and middle temporal gyrus) • Groups showed significant differences in 2 cognitive tests, but differences are not clinically meaningful. • Dimensional Change Card Sort Test (µ-prediabetes: 115.4, µ- healthy: 100.6, t=6.4, p < 0.0001) • Picture Vocabulary Test (µ-prediabetes: 102.7, µ-healthy: 112.5, t=2.9, pFWE < 0.0049). Figure 1. Stronger Connectivity in Prediabetes Table 1: Sample Characteristics Healthy A1c Prediabetes p-value a Sex M: 18, F: 26 M: 18, F: 26 1.0 Age (years) 28.3 ± 3.6 29.0 ± 4.4 0.37 Body Mass Index (kg/m2) 26.6 ± 3.3 28.1 ± 5.8 0.13 Race Caucasian 37 (84.1%) 22 (50.0%) 0.013* African American 3 (6.8%) 13 (29.5%) Asian or Pacific Islander 1 (2.3%) 5 (11.4%) Native American/American Indian 0 (0%) 1 (2.3%) More than One Race 2 (4.5%) 1 (2.3%) Unknown 1 (2.3%) 2 (4.5%) Ethnicity Hispanic 2 (4.5%) 6 (13.6%) 0.21Non-Hispanic 41 (93.2%) 38 (86.4%) Unknown 1 (2.3%) 0 (0%) Hemoglobin A1c (%) 4.7 ± 0.2 5.8 ± 0.2 < 0.0001* a significant testing between groups was completed using Welch’s two sample t-test or Pearson’s chi-squares test. Significance is considered at p < 0.05. Significant differences are denoted with an asterisk (*) A) Prediabetes was associated with stronger connectivity of the orbitofrontal cortex/middle temporal gyrus with 1) a somatosensory network containing precentral and postcentral gyrus; and 2) a visual network comprising the occipital pole; compared to individuals with healthy A1c. B) Simplified representation of network connectivity associated with prediabetes. Figure 2. Stronger Connectivity in Healthy A1c Table 2: Significant Network Connectivity Differences Prediabetes Group > Healthy A1c Group (Figure 1) Connected RSNs t-value p-value Ventral Attention Network & Visual Network 4.28 0.0001 Ventral Attention Network & Somatosensory Network 4.20 0.0027 Healthy A1c Group > Prediabetes Group (Figure 2) Connected RSNs t-value p-value Ventral Attention Network & Cingular-Operecular Task Control Network 4.15 0.0024 Ventral Attention Network & Thalamic Striatal, Visual Network 4.38 0.0011 A) Compared to the prediabetes group, healthy A1c was associated with stronger connectivity of OFC/middle temporal gyrus with 1) the insula, cingulate, middle frontal gyrus, superior temporal gyrus and with 2) a network including the thalamus, ventral striatum, and visual cortex. B) Simplified representation of network connectivity associated with healthy A1c. Conclusions: • Prediabetes is associated with a shift in ventral attention network connectivity away from self-regulating brain areas and towards sensory regions, as evidenced by: • Lack of connectivity of ventral attention network to the cingular-operecular task control network in the prediabetes group • Stronger connectivity of ventral attention network to sensory regions. • Healthy A1c was associated with stronger ventral attention network and thalamic-striatal connectivity. This is representative of a cortical-striatal-thalamic loop implicated in cognitive control, decision-making, and reversal learning (Peters et al, 2016). • Similarity in DMN connectivity between the groups may indicate that degradation of the DMN seen in T2D (Musen et al 2012) occurs with worse glycemic control or longer disease duration. The present prediabetes sample showed no signs of cognitive decline.