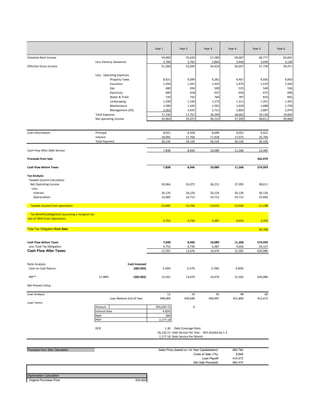
Multi-Year Cash Flow Analysis and Tax Calculations for Commercial Real Estate Investment
1. Year 1 Year 2 Year 3 Year 4 Year 5 Year 6
Schedule Rent Income 54,000 55,620 57,289 59,007 60,777 62,601
Less Vacancy allowance 2,700 2,781 2,864 2,950 3,039 3,130
Effective Gross Income 51,300 52,839 54,424 56,057 57,739 59,471
Less: Operating Expenses
Property Taxes 8,921 9,099 9,281 9,467 9,656 9,850
Insurance 1,350 1,391 1,432 1,475 1,519 1,565
Gas 480 494 509 525 540 556
Electricity 600 618 637 656 675 696
Water & Trash 720 742 764 787 810 835
Landscaping 1,200 1,236 1,273 1,311 1,351 1,391
Maintenance 1,500 1,545 1,591 1,639 1,688 1,739
Management (5%) 2,565 2,642 2,721 2,803 2,887 2,974
Total Expenses 17,336 17,767 18,209 18,662 19,128 19,605
Net operating income 33,964 35,072 36,215 37,395 38,611 39,866
Loan Information: Principal 8,031 8,358 8,699 9,053 9,422
Interest 18,095 17,768 17,428 17,073 16,704
Total Payment 26,126 26,126 26,126 26,126 26,126
Cash Flow After Debt Service 7,838 8,946 10,089 11,268 12,485
Proceeds from Sale 562,474
Cash Flow Before Taxes 7,838 8,946 10,089 11,268 574,959
Tax Analysis
Taxable Income Calculation
Net Operating Income 33,964 35,072 36,215 37,395 38,611
Less:
Interest: 26,126 26,126 26,126 26,126 26,126
Depreciation: 23,683 24,712 24,712 24,712 23,683
Taxable Income from operations -15,845 -15,766 -14,623 -13,444 -11,198
Tax Benefit/(obligation) (assuming a marginal tax
rate of 30%) from Operations:
4,753 4,730 4,387 4,033 3,359
Total Tax Obligation from Sale: 50,768
Cash Flow Before Taxes 7,838 8,946 10,089 11,268 574,959
Less Total Tax Obligation: 4,753 4,730 4,387 4,033 54,127
Cash Flow After Taxes: 12,591 13,676 14,476 15,302 629,086
Ratio Analysis: Cash Invested
Cash on Cash Return: (382,965) 3.29% 3.57% 3.78% 4.00%
IRR** 12.98% (382,965) 12,591 13,676 14,476 15,302 629,086
Net Present Value
Loan Analysis 12 24 36 48 60
Loan Balance End of Year 448,004 439,646 430,947 421,894 412,472
Loan Terms
Amount 456,034.72 0
Interest Rate 4.00%
Nper 360
PMT 2,177.18
DCR 1.30 Debt Coverage Ratio
26,126.15 Debt Service Per Year - NOI divided by 1.3
2,177.18 Debt Service Per Month
Proceeds from Sale Calculation 984,794
9,848
412,472
562,474
Depreciation Calculation:
Original Purchase Price: 839,000
Sales Price (based on 1st Year Capitalization):
Costs of Sale (1%):
Loan Payoff:
Net Sale Proceeds:
2. Transaction Cost 8,390
Value of land: 167,800
Value of Improvements: 679,590
Depreciation Term: 27.5
Depreciation allowed per year: 24,712
Monthly Depreciation 2,059
Gain on Sale Calculations:
Original Purchase Price: 839,000
Plus Capital Improvements: 0
Less Depreciation Claimed: 121,502
Adjusted Cost Basis: 717,498
Selling Price: 984,794
Less Expenses from Sale: 9,848
Adjusted Selling Price: 974,946
Adjusted Selling Price: 974,946
Less Adjusted Cost Basis: 717,498
Gain on Sale: 257,449
Tax Calculations:
Gain on Sale: 257,449
Unrecaptured depreciation (to be taxed at 25%) 121,502
Long Term Capital Gain (to be taxed at 15%) 135,946
Tax Due on Sale:
Unrecaptured Depreciation: 30,376
Long Term Capital Gain: 20,392
TOTAL TAX ON SALE 50,768
Purchase Price: 839,000
Transaction: 8,390
Loan Amount: 456,035
Cash Invested 382,965
Capitalization Rate (Year 1): 4.05%