
Recommended
Recommended
More Related Content
What's hot
What's hot (15)
Similar to Ratio analysis question workshop 4 lorry plc updated
Similar to Ratio analysis question workshop 4 lorry plc updated (20)
More from Aquamarine Emerald
More from Aquamarine Emerald (18)
Recently uploaded
Recently uploaded (20)
Ratio analysis question workshop 4 lorry plc updated
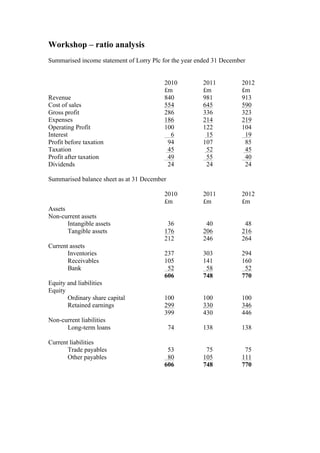
- 1. Workshop – ratio analysis Summarised income statement of Lorry Plc for the year ended 31 December 2010 2011 2012 £m £m £m Revenue 840 981 913 Cost of sales 554 645 590 Gross profit 286 336 323 Expenses 186 214 219 Operating Profit 100 122 104 Interest 6 15 19 Profit before taxation 94 107 85 Taxation 45 52 45 Profit after taxation 49 55 40 Dividends 24 24 24 Summarised balance sheet as at 31 December 2010 2011 2012 £m £m £m Assets Non-current assets Intangible assets 36 40 48 Tangible assets 176 206 216 212 246 264 Current assets Inventories 237 303 294 Receivables 105 141 160 Bank 52 58 52 606 748 770 Equity and liabilities Equity Ordinary share capital 100 100 100 Retained earnings 299 330 346 399 430 446 Non-current liabilities Long-term loans 74 138 138 Current liabilities Trade payables 53 75 75 Other payables 80 105 111 606 748 770
- 2. You are required: 1) To calculate relevant ratios for Lorry plc between 2010 and 2012 (use year-end figures for balance sheet items) Gross profit margin, ROCE, Operating profit margin; receivables collection days, payables payment days, inventory turnover days; current ratio, quick ratio; gearing ratio, interest cover 2) To analyse the performance of Lorry plc from 2010 to 2012.