Oregon Tax Exempt Bond Program Comparison
•Download as XLS, PDF•
0 likes•301 views

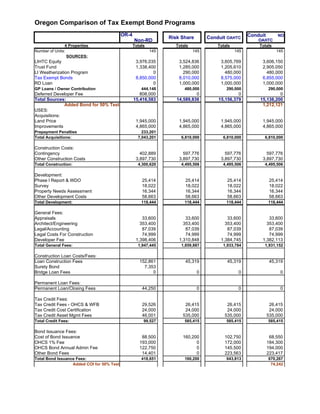
This document compares the sources and uses of funds for four different tax-exempt bond programs that could finance 145 units across four properties in Oregon. It finds that a conduit bond program would result in total sources of $14.6 million and uses of $14.6 million, breaking even exactly. A risk share bond program would require $15.2 million in sources and uses, while a conduit OAHTC program would need $15.1 million in both sources and uses. A non-RD program using only OAHTC would need $15.1 million in sources and uses as well.

Recommended
Recommended
More Related Content
Similar to Oregon Tax Exempt Bond Program Comparison
Similar to Oregon Tax Exempt Bond Program Comparison (20)
More from National Housing Conference & the Center for Housing Policy
More from National Housing Conference & the Center for Housing Policy (20)
Oregon Tax Exempt Bond Program Comparison
- 1. Oregon Comparison of Tax Exempt Bond Programs OR-4 Conduit NO Risk Share Conduit OAHTC Non-RD OAHTC 4 Properties Totals Totals Totals Totals Number of Units: 145 145 145 145 SOURCES: LIHTC Equity 3,976,035 3,524,836 3,605,769 3,606,150 Trust Fund 1,338,400 1,285,000 1,205,610 2,905,050 LI Weatherization Program 0 290,000 480,000 480,000 Tax Exempt Bonds 8,850,000 8,010,000 8,575,000 6,855,000 RD Loan 0 1,000,000 1,000,000 1,000,000 GP Loans / Owner Contribution 444,148 480,000 290,000 290,000 Deferred Developer Fee 808,000 0 0 0 Total Sources: 15,416,583 14,589,836 15,156,379 15,136,200 Added Bond for 50% Test 1,212,121 USES: Acquisitions: Land Price 1,945,000 1,945,000 1,945,000 1,945,000 Improvements 4,865,000 4,865,000 4,865,000 4,865,000 Prepayment Penalties 233,201 Total Acquisitions: 7,043,201 6,810,000 6,810,000 6,810,000 Construction Costs: Contingency 402,889 597,776 597,776 597,776 Other Construction Costs 3,897,730 3,897,730 3,897,730 3,897,730 Total Construction: 4,300,620 4,495,506 4,495,506 4,495,506 Development: Phase l Report & WDO 25,414 25,414 25,414 25,414 Survey 18,022 18,022 18,022 18,022 Property Needs Assessment 16,344 16,344 16,344 16,344 Other Development Costs 58,663 58,663 58,663 58,663 Total Development: 118,444 118,444 118,444 118,444 General Fees: Appraisals 33,600 33,600 33,600 33,600 Architect/Engineering 353,400 353,400 353,400 353,400 Legal/Accounting 87,039 87,039 87,039 87,039 Legal Costs For Construction 74,999 74,999 74,999 74,999 Developer Fee 1,398,406 1,310,848 1,384,745 1,382,113 Total General Fees: 1,947,445 1,859,887 1,933,784 1,931,152 Construction Loan Costs/Fees: Loan Construction Fees 152,861 45,319 45,319 45,319 Surety Bond 7,353 Bridge Loan Fees 0 0 0 0 Permanent Loan Fees: Permanent Loan/Closing Fees 44,250 0 0 0 Tax Credit Fees: Tax Credit Fees - OHCS & WFB 29,526 26,415 26,415 26,415 Tax Credit Cost Certification 24,000 24,000 24,000 24,000 Tax Credit Asset Mgmt Fees 46,001 535,000 535,000 535,000 Total Credit Fees: 99,527 585,415 585,415 585,415 Bond Issuance Fees: Cost of Bond Issuance 88,500 160,200 102,750 68,550 OHCS 1% Fee 193,000 0 172,000 184,300 OHCS Bond Annual Admin Fee 122,750 0 145,500 194,000 Other Bond Fees 14,401 0 223,563 223,417 Total Bond Issuance Fees: 418,651 160,200 643,813 670,267 Added COI for 50% Test 74,242
- 2. Interest: Construction Period Portion 268,000 Acquisition Portion 390,631 232,567 241,600 197,599 Other: Lease-up Period Portion 228,880 Total Interest: 887,511 232,567 241,600 197,599 Reserves/Contingencies: Lease-up / Operating Reserve 0 0 0 0 Development 15,000 20,000 20,000 20,000 Tenant Dislocation Costs 262,500 262,500 262,500 262,500 Deposit to Replacement Reserves 0 0 0 0 3 Mos Debt Service 119,221 0 0 0 Total Reserves/Contingencies: 396,721 282,500 282,500 282,500 Total Uses of Funds: 15,416,583 14,589,836 15,156,379 15,136,200 Surplus / (Gap Funding) 0 (0) (0) 0