1. 1
M.S. Research Plan
Jason A. Sulskis
Department of Atmospheric Science
The University of Wyoming
Laramie, WY 82070
Executive Summary
The UK lead COnvective Precipitation Experiment (COPE) campaign was commissioned in
order to improve Quantitative Precipitation Forecasts (QPF) through analysis of aircraft and
ground based radar observations and incorporation of those analyses into numerical model
studies. COPE was designed to study the complete storm evolution, including the details of
convergence lines, and storm growth and persistence.
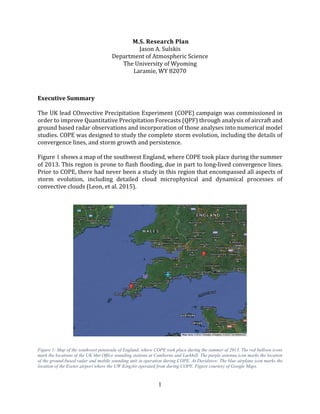
Figure 1 shows a map of the southwest England, where COPE took place during the summer
of 2013. This region is prone to flash flooding, due in part to long-lived convergence lines.
Prior to COPE, there had never been a study in this region that encompassed all aspects of
storm evolution, including detailed cloud microphysical and dynamical processes of
convective clouds (Leon, et al. 2015).
Figure 1: Map of the southwest peninsula of England, where COPE took place during the summer of 2013. The red balloon icons
mark the locations of the UK Met Office sounding stations at Camborne and Larkhill. The purple antenna icon marks the location
of the ground-based radar and mobile sounding unit in operation during COPE. At Davidstow. The blue airplane icon marks the
location of the Exeter airport where the UW KingAir operated from during COPE. Figure courtesy of Google Maps.
2. 2
The COnvective Precipitation Experiment – Microphysics and Entrainment Dependencies
(COPE-MED) project is a key component of COPE. The primary motivation of COPE-MED is
to investigate the microphysical pathways and dynamical interactions involved in convective
precipitation formation in the mid-latitudes. These microphysical pathways will typically
feed into, and simultaneously compete with, each other for condensate. Thus, how
entrainment affects precipitation development also needs to be considered.
The two main hypotheses of COPE-MED are that:
I. The formation of raindrops through the warm rain process is critical to the
development of heavy precipitation at the surface, even when ice processes are active.
II. The effects of entrainment must be mitigated by some factors in order to produce heavy
precipitation at the surface.
1. Goals and Objectives
The primary objectives of COPE-MED are (a) to investigate and understand the interaction
between the different microphysical pathways that affect heavy convective precipitation
formation and (b) to investigate the relative sensitivity of those pathways to changes in
environmental conditions. Of particular interest is how the relative strength of the warm rain
process, both directly and through the ice multiplication processes, impacts precipitation
development.
There are two specific goals for this research that fit into the broader COPE-MED objectives.
First, we will perform a detailed evaluation and survey of cloud liquid water content (CLWC)
and the cloud droplet number concentration (CDNC) as measured by multiple in-situ probes
during COPE. This will provide an assessment of the error and uncertainty in the overall
measurements and the range of values encountered throughout COPE. The survey will also
allow future investigations to be placed into context for the broader COPE data sets.
Second, we will investigate the characteristics of the droplet spectra during several, non-
precipitating (or low precipitation) cloud penetrations. We will attempt to quantify the
droplet spectral characteristics – focusing primarily on spectral bimodality and spectral
width – and then try to determine the environmental conditions that lead to those
characteristics. We will ascertain how these characteristics connect to other bulk quantities.
This connection should provide additional information about the underlying processes
responsible for droplet growth (and evaporation) and their role in the formation and
production of precipitation.
These goals will be achieved primarily through detailed analysis of aircraft data, obtained
from near cloud-top penetrations of convective, mixed-phase clouds. Ancillary data from
atmospheric sounding systems and ground-based radar will be used in order to provide a
different perspective and a broader context to the aircraft data.
3. 3
2. Background
2.1 In-Situ Instrumentation
Accurately measuring microphysical cloud properties for convective, mixed-phase clouds is
of crucial importance for COPE. In-situ measurements of cloud droplets often suffer from a
wide variety of instrument biases, uncertainties and limitations. For example, the King-
CISRO (King et. al., 1981) and the Nevzorov LWC/TWC (Korolev et. al., 1997) hot-wire
probes have an inherent threshold LWC detection limit of about 0.02 g m−3
. Further, both
have decreasing detection efficiencies for larger droplets, typically those larger than 60 µm,
due to factors such as an increasing probability of breakup and shedding. The accuracy of
LWC measurements in non-precipitating liquid clouds has been estimated to be between
10%–15% and there has been generally good agreement between the LWC-100 and
Nevzorov probes for values of LWC of up to 2 g m−3
(Korolev et. al., 1997).
Optical scattering probes, on the other hand, suffer from both natural and instrument
broadening. This can adversely affect the measurement of drop size distributions (Brenguier
et al. 1998; Lance et al., 2010). For example, the Forward Scattering Spectrometer Probe
(FSSP) (Knollenberg, 1976) typically suffers from optical coincidence errors, electronic
dead-time errors (Baumgardner et al. 1985), and artificial broadening in droplet size
distributions (Cooper, 1988). These can result in greater uncertainty for the higher order
products, such as CLWC, which are derived from those droplet size distributions (Lance et
al., 2010). These errors are usually corrected for using processing algorithms (Baumgardner
et al. 1985; Brenguir et al., 1989; Brenguier et al. 1994). The (CDP), developed by Droplet
Measurement Technologies, Inc. (DMT), improved upon some of the known uncertainties
and mechanical issues that the FSSP suffers from. It has a much smaller, less power-
consuming package and is less susceptible to shattering contamination in mixed phase
clouds. However, the CDP itself can suffer from uncertainties, especially coincidence errors.
Calibration by known water droplet sizes, masking the qualifier optics, and processing
improvements have greatly reduced those uncertainties (Lance et al., 2010).
2.2 Entrainment/Spectral Broadening
The effects of entrainment on the evolution of the cloud droplet spectra are far from being
fully understood. Entrainment of dry environmental air, which can occur from cloud top or
laterally, can dilute the droplet population, can shrink droplets by evaporation, and may
introduce additional CCN into the cloud that in turn can activate new droplets, if
subsequently lifted (Lasher-Trapp et. al., 2005). The entrained air is turbulently mixed so
that smaller and smaller parcels of sub-saturated and saturated air are produced. The
relative time scales for turbulent mixing and the droplet evaporation determines the
characteristics of the overall process (Lehmann et. al., 2009). The two extremes of the
entrainment/mixing process are homogeneous mixing and inhomogeneous mixing.
4. 4
Homogeneous mixing occurs on a time scale that is faster than the evaporation time of
constituent droplets. This results in the temperature and saturation levels being the same
for all droplets, which causes all the droplets to evaporate at more or less the same rate until
equilibrium is re-achieved. Therefore, the droplet diameters will all shrink at the same rate,
while the number concentrations stay the same, unless droplets deactivate. This results in
the droplet size distribution shifting toward the smaller diameters due to evaporation
(Baker et al., 1980; Baker et. al., 1984; Lasher-Trapp et. al., 2005).
Inhomogeneous mixing, on the other hand, occurs on a time scale that is slower than the
evaporation time of constituent droplets. The mixing proceeds slowly enough so that
individual droplets surrounded by dry, entrained air will completely evaporate while
droplets surrounded by saturated air will not. This uneven evaporation leads to changes in
droplet number concentrations, but not necessarily to the droplet diameter (Lehmann et. al.,
2009). Overall, inhomogeneous mixing leads to spectral broadening and may also lead to a
bimodal droplet spectra. If a parcel diluted by inhomogeneous mixing is lifted by a new
updraft it may also experience secondary activation (Telford et. al., 1984; Lasher-Trapp et.
al., 2005; Lehmann et. al., 2009).
Modern experimental results show that there is no one type of mixing that occurs with the
entrainment/mixing processes. It is likely a combination of both extremes. Additionally,
there may be no one specific cause of spectral bimodality but rather a combination of factors
(Blyth, 1992; Lehmann et. al., 2009).
3. COPE Data Overview
The COPE field campaign took place from July 3rd to August 28th 2013. Observations during
COPE were made using three research aircraft, ground-based and airborne radars, an elastic
backscatter lidar, aerosol instrumentation, radar wind profilers, and multiple atmospheric
sounding systems.
Three aircraft utilized during COPE include the University of Wyoming King Air research
aircraft (UWKA), the Facility for Airborne Atmospheric Measurements (FAAM) Bae-146, and
the Met Office Civil Contingency Aircraft (MOCCA). A total of 17 intense operation periods
(IOP), defined as a period when one or more aircraft operated, were conducted during COPE.
Of those 17, roughly one-third included deep convective cloud cases with cloud tops at
−15℃ or colder. The rest were shallower convection cases, with cloud tops near 0 °C (Leon,
et. al. 2015).
In this research we focus on measurements obtained from 14 missions flown by the UWKA.
Where appropriate, data from the BAe-146 for missions flown in coordination with the
UWKA will also be used.
Table 1 shows a breakdown of the instruments and platforms that were operational during
those 14 flights.
5. 5
Table 1: Table of instruments used for flights that are to be examined by this research plan.
Flight Date UWKA G.B. Radar BAe-146 Soundings
RF03 2013/07/10
RF04* 2013/07/18
RF05 2013/07/25
RF06 2013/07/27
RF07 2013/07/28
RF08 2013/07/29
RF09 2013/08/02
RF10 2013/08/03
RF11 2013/08/06
RF12 2013/08/07
RF13 2013/08/14
RF14 2013/08/15
RF15* 2013/08/17
RF16† 2013/08/17
We use data from the atmospheric sounding systems to provide a thermodynamic profile of
the pre-storm environmental conditions. Radiosondes were launched from the Cardington
mobile sounding unit, deployed at Davidstow, during IOPs at one to two hour intervals.
Additional radiosondes were launched at the standard UK Met Office sites of Camborne and
Larkhill at 0000 and 1200 UTC daily (Leon, et. al. 2015).
Ground based polarmetric, X-band radar, operated by the National Centre for Atmospheric
Science (NCAS), was also located at Davidstow. This radar provided coverage over the main
COPE domain. Volume scans included 8-10 elevation angles and were completed every ~ 5
minutes (Leon, et. al. 2015). Measurements relevant to the work described herein include
reflectivity, Doppler velocities, and differential reflectivity (ZDR). These data allow us to
obtain storm scale information, such as storm evolution. They also allow the aircraft
observations to be placed into a broader context.
* LWC-100 data is unusable for this flight.
† CDP data is unusable for this flight.
6. 6
In order to bridge the gap between the broad environmental contexts, the storm to
mesoscale information provided by the ground-based radars, and the detailed microphysical
parameters from aircraft in-situ probes, we use measurements from the Wyoming Cloud
Radar (WCR) and Wyoming Cloud Lidar (WCL) on the UWKA (Wang, et.al. 2012). Together,
these provided high resolution – up to tens of meters – information on sections of storm
structure, reflectivity, velocity, cloud edge, boundary layer top and the presence of aerosol
layers (Leon, et. al. 2015).
In-situ measurements from the UWKA included the ability to measure cloud droplet size
spectra from 1.5 − 50 µm, CLWC from droplets up to ~ 50 µm, and two-dimensional particle
images (both droplets and ice crystals) with size ranges between 15 µm − 10 mm (Wang,
et.al. 2012). The CLWC measurement capabilities aboard the UWKA include measurements
from 4 in-situ probes that utilize 3 different methodologies. The CDNC measurements are
provided by 2 single particle OPCs. There were also probes that measured environmental
conditions such as temperature, dew point, pressure, and other standard parameters of
interest.
Optical probes installed on the UWKA for COPE included a FSSP, CDP, and several optical
array probes (OAP) including a Fast 2D cloud (2DC) and 2D precipitation (2DP) probe. The
Gerber particle volume monitor, PVM-100A (PVM) (Gerber et al. 1994), DMT liquid water
concentration LWC-100 (LWC) hot-wire (based upon the original King-CISRO probe), and a
Nevzorov LWC/TWC (Korolev et. al., 1997) provided bulk measurements of CLWC. Table 2
lists the primary in-situ probes installed aboard the UWKA during COPE and the
measurement they provided.
Independent comparisons between the CDP and FSSP concentrations (corrected for
coincidence) agree to within 13% for UWKA flights RF01-RF15. However, glass bead sizing
analysis done by the UWKA group during COPE suggests that the FSSP is oversizing droplets
by up to 3-5 microns while the CDP is sizing, on average, correctly. This leads to FSSP-
estimated CLWC values roughly a factor of two greater than all of the other probes.
7. 7
Table 2: List of in-situ cloud physics instrumentation installed on the UWKA during COPE.
Instrument Capability
CDP‡ Single particle forward optical scattering spectrometer.
Measures cloud droplet size spectra within 2–50 μm (30
channels) CLWC directly derivable from spectra (Lance et.
al., 2010).
FSSP Single particle forward optical scattering spectrometer.
Measures cloud droplet size spectra in 15 channels with
lower and upper limits typically set at 1.5 and 47.5 μm.
CLWC directly derivable from spectra (Vali et al., 1998;
Brenguier et al., 1998).
PVM-100A Measures the optical response of 780 nm diode laser to a
volume of droplets with sizes up to ~60 μm. Has an effective
sample volume of 1.25 cm3
. Measures LWC in the range
0.002-10 g m-3 with an accuracy of 5% (Gerber, et. al., 1993).
LWC-100 Hot-wire method, measures cloud liquid water content
values between 0.1-6.0 g m-3 from droplets up to ~50 μm.
Response time on the order of 0.05 s. Accuracy ~ 5% at 1 g
m-3. Collection efficiency of 95% for droplets larger than 5
μm. Calculable from first principles but dry air term must be
calculated (King, et. al. 1978).
Nevzorov LWC/TWC§ Cloud liquid water content from droplets up to ~50 μm.
Double LWC sensors for redundancy. LWC collection
efficiency ~100% for diameters in between 10 μm and 100
μm. Deep cone TWC sensor for reduction in shattering
losses. Calculable from first principles & dry air term is
directly measured (Korolev et. al., 1997).
Fast OAP-2DC Two-dimensional greyscale particle images with 64 diodes
and 25-µm resolution duplicates. 100 channels with bin
boundaries starting at 13 μm and extending to 2,513 μm in
25-μm increments.
OAP-2DP Two-dimensional particle images. 20 channels with lower
and upper limits set at 100 and 10,000 μm, respectively;
(Gordon and Marwitz, 1984)
‡
All improvements, except the water droplet calibration procedure, mentioned in Lance et. al. (2010) were
implemented on the CDP installed on the UWKA during COPE.
§ The Nevzorov LWC/TWC probe was provided by Alexi Korolev for COPE and is not part of the standard suite
of in-situ instrumentation installed aboard the UWKA.
8. 8
4. Research Methodology & Preliminary Results
4.1 LWC Probe Comparisons
We will have made extensive comparisons between probes that measure CLWC. Each
probe’s CLWC measurement is plotted against that of the CDP. The data are segregated by
the following criteria:
1. Flight,
2. Range of droplet concentration,
3. Range of mean droplet diameter, and
4. Precipitating vs. non-precipitating clouds.
Segregation by flight allows us to compare the consistency between probes, between each
flight, so we can pick out any patterns between probes that may be due to issues specific to
a particular flight as opposed to some other condition that may exist across flight days.
Segregating the data by droplet concentration allows us to compare how each probe
measures LWC when subjected to various concentration ranges, especially those of
extremely high concentrations – e.g. polluted cases with droplet concentrations exceeding
1000 cm−3
were observed on certain days of COPE – and extremely low concentrations.
Those higher concentrations may, for example, enhance issues such as coincidence on
certain probes.
Similarly, segregation by mean droplet diameter allows comparison of each probe’s relative
behavior when exposed to droplet diameters of a particular range, particularly larger
droplets in the 30 − 40 µm range. Finally, segregation by precipitating vs. non-precipitating
clouds will allow us to see how each probe behaves when there are precipitation size drops
present that are falling through the cloud.
These comparisons will attempt to quantify how well each probe performs relative to the
others Preliminary results of this analysis show that while there is no clear trend in the
regression line slopes obtained with comparisons segregated by flight. However, there is
some visible consistency between probes here, especially those of the hot-wire class – see
Figure 2.
The LWC-100 and Nevzorov LWC probes follow the same trend, each measuring similar
differences when compared to the CDP from flight to flight. This begs the question of whether
or not the observed trend has something to do with the CDP itself measuring slightly
differently between flights, or perhaps some other factor. Part of this work is intended to
answer that question. On the other hand, the PVM-100A has a larger scatter of regression
line slopes compared to the CDP, which doesn’t seem to correlate to anything and points
more toward random variation between flights.
9. 9
Figure 2: Flight number plotted against regression line slopes for each CLWC probe when compared to the CDP.
When these comparisons are segregated by droplet concentration range, and mean droplet
diameter range, a much clearer trend between the regression slopes for all of the probes
becomes apparent. Figure 3 shows that the comparisons between the hot-wire class probes
and the CDP are remarkably well behaved. It also shows that, in the comparison between the
CDP and PVM, the PVM increasingly overestimates CLWC with increasing droplet
concentration (decreasing droplet mean diameter) when compared to the CDP.
Figure 3: CDNC and mean diameter plotted against regression line slopes for each CLWC probe when compared to the CDP.
10. 10
Overall, so far, the comparison between the CDP and independent LWC measurements from
other probes, particularly the hot-wire probes and Gerber PVM-100A, show very promising
results. All three use different methodologies for estimating CLWC, yet seem to agree to
within, approximately, 10-20% across all of the data from COPE. This is remarkably good
agreement and gives us confidence in the CLWC measurements obtained during the field
campaign.
4.2 COPE CLWC Survey
We will conduct a detailed survey of the CLWC and CDNC measured from all UWKA flight
data obtained from COPE – specifically of each of the UWKA flights described in Table 1. This
will include analyzing vertical profiles of CLWC and CDNC from flight data and compiling
detailed statistics of those for all the COPE days.
There are no preliminary results for the CLWC survey, as of yet.
4.3 Droplet Spectral Analysis
We are going to perform a detailed analysis of the observed droplet spectra during COPE. We
will attempt to quantify the both the degree of bimodality and the overall spectral widths at
various points in low precipitation penetrations from the 14 UWKA flights detailed in
Table 1.
Additionally, we will examine the environmental conditions leading to the observed spectral
characteristics. We will attempt to ascertain how these spectral characteristics connect to
observed bulk quantities during those cloud penetrations. We will also compare the upshear
and downshear profiles of the spectra during those flights. A careful statistical analysis will
be done in order to correlate the spectral widths and bimodality to the observed bulk
quantities – especially CLWC and CDNC, the shear profiles, and other observed
environmental conditions.
Figure 4 shows an example of a bimodal droplet spectra observed on August 2nd, which was
an extremely low precipitation day. The measured precipitation concentration was less than
0.015 L−1
for this penetration. Also, WCR quick looks showed an average of around −15 dBZ
reflectivity during the penetration showing that this penetration had little precipitation
present. The penetration altitude was at ~4.5 km and the WCR quick looks put cloud top at
~5.5 km.
There is a period of time when the smaller mode becomes dominate, without seeming to
deplete the larger mode appreciably. The CLWC for this penetration was only on the order
of 25% adiabatic, the total concentration varied between 50 − 200 cm−3
, and the vertical
wind velocities showed distinct downdrafts at cloud edge and there was on the order of a
4 m/s updraft where the secondary mode becomes more pronounced.
11. 11
Figure 4: Example of an extremely bimodal spectrum observed on August 2nd from 15:12:46 to 15:13:06 UTC. There is a short
period (marked by red box) where the smaller size mode grows without much change to the larger sized mode. The blue arrow
shows the shear direction.
Figure 5 shows another extreme case observed earlier on August 2nd. Again, the precipitation
concentration was measured to be less than 0.015 L−1
and WCR quick looks showed an
average of around −15 dBZ reflectivity during the penetration. Here, the droplet spectra are
extremely narrow and nearly monodisperse. Such spectra are unusual to see in nature this
close to cloud top. WCR quick looks for this penetration show it took place 500 m below
cloud top. The CLWC for this penetration was larger than 50% adiabatic (with parts of the
penetration nearing 75% adiabacity), the total concentration was between 400 − 600 cm−3
,
and there is a fairly substantial updraft of 15 m s−1
at the core of the cloud.
The spectra observed here is, therefore, most likely a fresh turret that has just formed and
this is the type of spectra one would expect to see given those particular observed
environmental conditions.
Figure 5: Example of a droplet spectrum from an August 2nd penetration, from 13:50:26 to 13:50:37 UTC, that has portions that
are extremely narrow and nearly monodisperse. The blue arrow shows the shear direction.
12. 12
Figure 6 shows an example of bimodal spectra from July 10th, which is another low
precipitation case with precipitation concentrations higher than August 2nd, but still less
than 0.15 L−1
for this penetration. In this case, however, the smaller mode does appear to
deplete the larger mode, unlike the above example from August 2nd. However, the larger
droplets are disproportionately impacted, so we aren’t yet sure what the underlying cause
of the shift in spectral shape is at work here.
Again, for this case, WCR quick looks show lower reflectivity – between −40 dBZ and
−20 dBZ. Based on the WCR quick looks, this penetration is right at cloud top at an altitude
of ~3.5 km. The CLWC for this penetration was larger than 75% adiabatic (becoming nearly
adiabatic for a short period) for the portion that is more unimodal. The CLWC then dropped
to between 50 − 75% adiabatic for the bimodal portion. The total concentration during the
penetration was fairly high, being measured between 800 − 1000 cm−3
with a 4 m s−1
updraft at the beginning of the penetration and a 4 m s−1
downdraft where the smaller mode
begins to deplete the larger mode.
This last example is more typical of the other low precipitation cases analyzed so far, namely
penetrations on July 10th and July 18th , where neither extreme example, as shown in Figure
4 and Figure 5, has been seen.
Figure 6: More typically seem bimodal spectral case from July 10th, from 12:07:36 to 12:07:46 UTC. Here the larger mode
seems to deplete while the smaller mode grows (shown by the red arrows), as is more typical for an entrainment mixing case.
13. 13
5. Next Steps & Timeline
Completed Steps
• Literature Review of airborne CLWC probes operation and data quality
• Evaluation/Comparison of CLWC measurements from UWKA probes (CDP, LWC100,
PVM, Nevzorov) segregated by:
o Flight
o Droplet number concentration
o Mean droplet diameter
• Evaluation/Comparison of FSSP/CDP number concentration
In Progress
• Literature Review of entrainment mixing/effects on character and evolution of
droplet spectra (to be completed June, 2015)
• Initial selection of cases for detailed droplet spectra analysis (to be completed May,
2015)
• Initial quantification of spectral characteristics (bimodality & spectral width) for
select cases to be used in droplet spectra analysis (to be completed June, 2015).
Next Steps
• Evaluation/Comparison of CLWC measurements from UWKA probes segregated by
precipitation concentration (to be completed mid-May 2015)
• Survey of CLWC measurements from COPE (to be completed by end May, 2015)
o Relationship to other in situ parameters (e.g. droplet number, vertical wind,
etc.)
o Relationship to environmental parameters (e.g. adiabaticity)
• Completion of case selection for detailed spectral analysis (to be completed June/July
2015)
• Completion of quantification of spectra bimodality, spectral width, and other
statistical spectral parameters of interest (July/August 2015).
• Relating the spectral parameters to other bulk in situ parameters and environmental
conditions (to be completed August 2015).
• Completion of Thesis (September 2015).
14. 14
References
Baker, M., R. G. Corbin, and J. Latham, 1980: The influence of entrainment on the evolution of
cloud drop spectra: I. A model of inhomogeneous mixing. Quart. J. Roy. Meteor. Soc.,
106, 581–598.
Baker, M., R. E. Breidenthal, T. W. Choularton, and J. Latham, 1984: The effects of turbulent
mixing in clouds. J. Atmos. Sci., 41, 299–304.
Baumgardner, D., Strapp, W., Dye, E., 1985: Evaluation of the forward scattering
spectrometer
probe: Part II. Corrections for coincidence and dead-time losses. J. Atmos. Oceanic
Tech., 2, 626–632.
Brenguier, J.L., Amodei, L., 1989a: Coincidence and dead-time corrections for particle
counters:
Part I. A general mathematical formalism. J. Atmos. Oceanic Tech., 6, 575–584.
Brenguier, J.L., Amodei, L., 1989b: Coincidence and dead-time corrections for particles
counters: Part II. High concentration measurements with an FSSP. J. Atmos. Oceanic
Tech., 6, 585–598.
Brenguier, J.L., Baumgardner, D., Baker, B., 1994: A review and discussion of processing
algorithms for FSSP concentration measurements. J. Atmos. Oceanic Tech., 11, 1409–
1414.
Brenguier, J.L., Rodi, A.R., Gordon, G., Wechsler, P., 1998: Improvements of droplet size
measurements with the fast-FSSP (Forward Scattering Spectrometer Probe). J. Atmos.
Oceanic Tech., 15, 1077–1090.
Blyth, A., 1992: Entrainment in Cumulus Clouds. Journal of Applied Meteorology, 626-641.
Cooper, W. A., 1988: Effects of coincidences on measurements with a Forward Scattering
Spectrometer Probe. J. Atmos. Oceanic Technol., 5, 823–832.
Gordon, G.L., and John D. Marwitz, 1984: An Airborne Comparison of Three PMS Probes. J.
Atmos. Oceanic Technol., 1, 22–27.
King, W. D., D. A. Parkin, and R. J. Handsworth, 1978: A hot-wire liquid water device having
fully calculable response characteristics. J. Appl. Meteorol., 17, 1809-1813
King, W. D., C. T. Maher, and G. A. Hepburn, 1981: Further Performance Tests on the CSIRO
Liquid Water Probe. J. Appl. Meteor., 20, 195–202.
Knollenberg, R. G., 1976: Three new instruments for cloud physics measurements. Preprints,
Int'l Conf. Cloud Physics, Boulder, Colorado, USA, Amer. Meteor. Soc., 544.
Korolev, A.V., G.A. Isaac, S.G. Cober, J.W. Strapp, and J. Hallett, 2003: Microphysical
characterization of mixed-phase clouds. Q.J.R. Meteorol. Soc., 129, 39-65.
Lance, S., Brock, C., Rogers, D., & Gordon, J., 2010: Water droplet calibration of the Cloud
Droplet Probe (CDP) and in-flight performance in liquid, ice and mixed-phase clouds
during ARCPAC. Atmospheric Measurement Techniques, 1683-1706.
Lasher-Trapp, S., Cooper, W., & Blyth, A., 2005: Broadening of droplet size distributions
from entrainment and mixing in a cumulus cloud. Quarterly Journal of the Royal
Meteorological Society, 195-220.
Leon, D., et. al. 2015: The Convective Precipitation Experiment (COPE): Investigating the
Origins of Heavy Precipitation in the Southwestern UK. Bull. Amer. Meteor. Soc. Submitted.
15. 15
Lehmann, K., Siebert, H., & Shaw, R., 2009: Homogeneous and Inhomogeneous Mixing in
Cumulus Clouds: Dependence on Local Turbulence Structure. Journal of the
Atmospheric Sciences, 3641-3659.
Telford, J. W., Thomas S. Keck, and Steven K. Chai, 1984: Entrainment at Cloud Tops and
the Droplet Spectra. J. Atmos. Sci., 41, 3170–3179.
Vali, G., Kelly, R., French, J., Haimov, S., Leon, D., Mcintosh, R., & Pazmany, A., 1998: Finescale
Structure and Microphysics of Coastal Stratus. Journal of the Atmospheric Sciences,
3540-3564.