Download to read offline
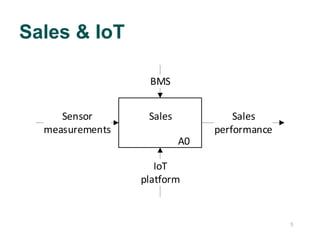
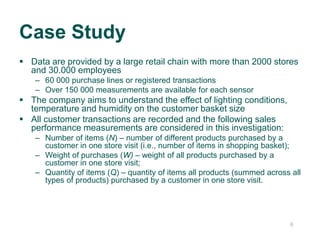
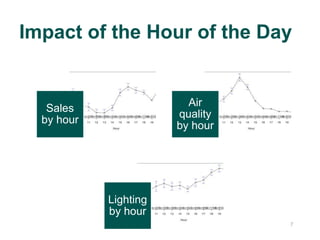
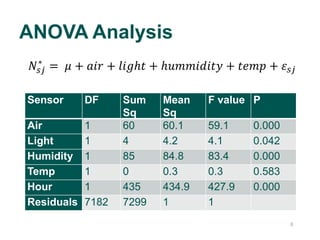
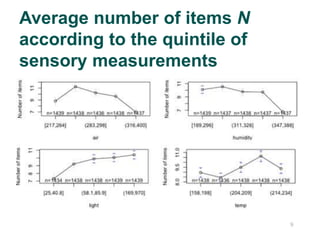
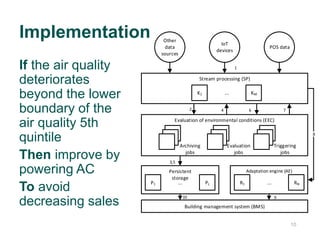
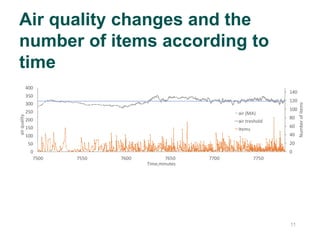

This document presents a framework for implementing IoT data analytics in retail to understand the relationship between environmental conditions and customer behavior. The framework was tested in a case study of a large retail chain using sensor data on lighting, temperature, humidity and air quality correlated with sales performance metrics. The analysis found air quality and humidity significantly impacted sales while temperature had a non-linear effect. An IoT platform was developed to enact decisions from the analytical models by dynamically adjusting environmental conditions and integrating real-time point-of-sale data.


![5G Explained! A High Level Overview [Introduction]](https://cdn.slidesharecdn.com/ss_thumbnails/5gexplainedahighleveloverview-260119165306-cc137a3e-thumbnail.jpg?width=640&height=640&fit=bounds)


