2. Schultz and Claudio
For a specific procedure which historically has a significant amount of variability, the average length
is not an accurate metric to be used in scheduling. Variability causes the time allotted to be inaccurate,
forcing either idle time into the system or late starts for subsequent surgeries assigned to that OR (Wu and
Aufses 2012). When start times for surgeries scheduled later in the day are significantly delayed or
postponed to a later date, financial costs are incurred by the facility such as overtime for operating theatre
and staff, extra risk to patient’s health, surgeon and staff fatigue, and the loss of functionality in the
multiple departments of Surgical Services. Additionally, a lack of slack (allowance for variability) in
scheduling models complicate a hospital’s ability to handle emergency and add-on cases (Van
Houdenhoven et al. 2007). An efficient operating schedule enables medical staff and materials to be
prepared beforehand and be utilized efficiently (Jeang and Chiang 2010).
Introducing a new scheduling model to replace or enhance traditional block scheduling for better
utilization of operating rooms or more efficient management of add-on cases or emergencies is frequently
proposed when addressing the surgical scheduling problem. Block scheduling is surgeon-centric and
control of the schedule is in the hands of the surgeon or surgery groups with the highest demand. Without
an environment that supports institutional change, shifting to a system that is more patient or organization
centered is typically met with much resistance. Scheduling algorithms which promote efficiency,
maximizing capacity or utilization, or smoothing OR volume are focused on what is best for the system
and frequently address variability in non-value added services, such as turnover time, check-in procedures
or resource allocation.
Variability based scheduling focuses on the patient within the system. By reducing the overall
uncertainty in the schedule, or concentrating procedures with high variability to specific time periods,
time should be made available for more efficient distribution of add-ons and emergency surgeries which
cause interruptions within block and open schedules (Denton et al. 2007). Late starts due to interruptions
as well as those due to inaccurate estimations of procedure times should not impact as many patients
(Saremi et al. 2013; Persson et al. 2009; Gul et al. 2011). Breaking down organizational barriers to
implement improved scheduling models is not the topic of this research; however, healthcare facilities
which embrace change have experienced the benefit of adopting improved scheduling models (Van
Houdenhoven et al. 2007).
This research proposes a new methodology for surgical scheduling which sequences procedures based
on duration groups and their level of variability. Variability was measured with the coefficient of
variation (CV) which divides the standard deviation by the mean (Hopp and Spearman 2008). Historical
data for 2011 through 2013 was acquired from a local, mid-size community health center with an OR
suite comprised of 8 operating rooms, one of which is dedicated to Caesarian Sections and more complex
deliveries and one pain management/procedure room. Emergency and add-on cases are typically
distributed throughout the ORs according to available capacity. The health center averages between 17
and 27 surgeries per day, based on the day of the week (Mondays/low and Tuesdays/high) with add-ons,
unscheduled and emergency surgeries accounting for approximately 17% of the procedures during
scheduled weekdays. The operating room assignments are based on a modified block schedule, with
reserved blocks for specific surgeons in specified rooms and open scheduling for the remaining rooms
and surgical groups. Currently, there is an unbalanced utilization of the operating rooms by the day of the
week. The volume of cases in a single OR can be high one day of the week if it is reserved by a surgeon’s
group, and low on other days if not reserved. Notably, the percentage of procedures starting late is greater
than 40% of the total procedures scheduled per week. By simulating the historical data, delayed starts
directly attributed to inaccurate estimation of procedure length were able to be isolated and recorded for
statistical comparison to late starts occurring in a new variability based scheduling model. The variability
based model provides a scheduling system for reducing the number of delayed starts caused by
inaccurately estimated procedure length with the flexibility for managing emergency procedures and add-
ons.
The current state model was built using historical data consisting of daily surgical schedules, actual
start times and end times for surgeries, operating room (OR) designations and a turnover distribution
based on the scheduled versus actual amount of time between procedures determined by duration
1354
3. Schultz and Claudio
grouping and level of variability. The new model was created using a scheduling algorithm based on the
mean times for six duration categories in combination with an assigned amount of variance based on high
or low levels of variability and the same turnover distributions used in the current state model. Procedure
duration averages and standard deviations were derived from the same three years of historical data
provided by the Surgical Services department. The new model displays the effects of multiple sequencing
rules and the removal of traditional block scheduling assignments while being restricted to the use of 6
ORs with all scheduled procedures completed within business hours.
Simulations were performed using Arena simulation software (v.14). The objectives of this research
were to (1) provide an accurate depiction of current state of the operating rooms at the hospital based on
historical data and (2) develop a new scheduling method acknowledging variability associated with
specific procedures and develop an algorithm for reducing the number and severity of late starts.
2 LITERATURE REVIEW
The body of literature on the topic of surgical scheduling is enormous and diverse. Topics range from
analysis of existing OR scheduling models using numerous performance measures, development of
techniques for improved scheduling under various constraints or sequencing algorithms and procedures
for determining how to manage or predict uncertainty occurring within all stages of the system. There are
a number of recent literature reviews which organize and interpret recent developments in this rapidly
expanding subject and present them in ways that will assist future research in the area. Literature review
configurations include: papers categorized into seven descriptive fields of study (Cardoen et al. 2010),
organized by type of operations research methodology (Erdogan and Denton 2010) or by time horizon to
which the results apply and the specific problem domain studied (May et al. 2011). For the purpose of this
article, literature was explored to determine which OR assignment models the research applied to and
their selected performance measures and research goals (block, modified block or open), common
modeling techniques (mathematical models and optimization programming or discrete-event simulation)
and how or if uncertainty in the system was addressed in literature.
2.1 OR Assignment Models and Performance Measures
Most literature agrees that there are three OR assignment models that are the basis for the scheduling
problem in individual or multiple operating room suites. A summary of the three different operating room
scheduling methodologies was provided in an article by Roland et al. (2009):
• Open scheduling: proposes a blank schedule in each period. The schedule is then filled on a first-
come-first-served basis, as information becomes available, or following a negotiation process.
• Block scheduling: schedules are based on area of surgery or particular surgeons reserving the
same day of week, time slot, and OR.
• Modified block scheduling: reallocates unused time to other surgeries not previously included in
the block. It is a more flexible method as it provides the opportunity to rearrange or to free
previously allotted slots of the operating schedule.
The scheduling problem, when applied to block assignments or single operating rooms, typically
address the sequencing of procedures within those blocks to target OR utilization or capacity. In some
instances, half days in an OR are assigned to separate surgeons with a fixed amount of hours available for
all scheduled procedures. Dexter et al. (2001) wanted to determine if the first procedure performed by the
second surgeon in an OR would begin on time more frequently while remaining within the total allotted
amount of time for the OR if a delay was scheduled between the surgeons. Using statistical analysis, they
developed a model using 90% upper prediction bounds on the duration of the last procedure by the first
surgeon to determine the length of the delay to schedule. They also used 90% upper prediction bounds on
the last procedure of the day to ensure the fixed hours were not exceeded. In addition to developing a new
scheduling model the research also tested the accuracy of their method of calculating the prediction
bounds.
1355
4. Schultz and Claudio
A methodology for transitioning away from a schedule with fixed hours to an “Any Workday” or “4
Weeks scheduling method” was proposed by Dexter et al. (2002). The proposed method allowed for a
more flexible block scheduling technique that would allow surgeons to schedule outside of fixed hours to
maximize OR efficiency and utilization trading off the cost of more resources being made available
outside of the traditional fixed hours. Resource constraints were also explored to smooth OR volume
(Smith et al. 2013) across a block system, and to optimize the scheduling of surgical activities where time
and human resources were limited (Roland et al. 2010) using an open scheduling model.
Throughout the literature, researchers have chosen to model block assignments and fixed hours as
model constraints and attempted to optimize the system using sequencing rules, mathematical
programming, multiple solving/optimization approaches and simulation within established blocks (Hans
et al. 2008; Persson et al. 2010; Chow et al. 2011; Bennis et al. 2013; Ballard and Kuhl 2006; Denton et
al. 2007; Steins et al. 2010; Shamayleh 2013; Smith et al. 201; Denton et al. 2006; Gul et al. 2011).
Open assignment models were more commonly used for analysis using simulation where more
complex, stochastic models could be designed. These models were found to be useful for: evaluating the
effectiveness of multiple scheduling algorithms (Arnaut 2010; Persson et al. 2010), methods for managing
emergency cases (Wullink et al. 2007), identifying bottlenecks in the system (Niu et al. 2011) and
minimizing wait times and completion time of the OR department (Saremi et al. 2013).
2.2 Modeling Techniques
Most surgical scheduling problems in literature use mathematical optimization models to analyze OR
systems. Mathematical techniques include Monte-Carlo simulation, mixed integer programming, genetic
solving approaches, simulated annealing, sequencing heuristics, tabu search algorithms, goal
programming, bin-packing techniques or combinations of these techniques. These models are typically
used to determine: 1) number of ORs required; 2) OR capacity; 3) OR utilization; 4) OR efficiency, which
includes number of late starts or cancellations and overtime for either staff or operating theatre; 5)
minimum number of surgeons required for the given demand at a hospital; 6) scheduling requirements for
elective vs. emergency procedures; and 7) calculation of prediction bounds for durations.
For example, Chow et al. (2011) used Monte-Carlo simulation in combination with mixed integer
programming for prediction of daily bed occupancy and to smooth bed occupancy over multiple ORs,
while the same combination of mathematical models was also used to better utilize capacity shared
between elective and emergency surgeries (Lamiri et al. 2009). Monte-Carlo simulation was also found in
combination with simulated annealing (Denton et al. 2006) to improve patient wait times while
decreasing overtime of the suite and in a combined approach with column generation to minimize costs
related to the overutilization of the ORs (Lamiri et al. 2007). Other mathematical models were designed to
move away from block scheduling by assigning elective patients to different ORs or days to minimize
costs associated with overtime which occur when surgeons overbook an OR to complete a large roster of
patients in a single day (Lamiri et al. 2007; Dexter 2000). In addition to minimizing total overtime,
optimization and goal programming were also used in the assignment of elective surgeries to ORs to
maximize the total number of free OR-days and total free capacity (Hans et al. 2008), to provide
flexibility in the schedule (Van Houdenhoven et al. 2007), increase access for emergency surgery (Smith
et al. 2013) and to minimize waiting time for patients (Saremi et al. 2013; Denton et al. 2007). Very few
of these models considered variability in procedure or service durations as a rule to schedule surgeries and
it was found that historical data for procedure duration or randomly generated time was used for running
the simulations.
The use of discrete-event simulation in surgical scheduling, typically performed using commercial
computer software such as Arena or WITNESS, has gained in popularity in the recent past. When used in
combination with mathematical models, discrete-event simulation is frequently used as means for model
verification or to test sequencing algorithms (Gul et al. 2011; Persson et al. 2009; Saremi et al. 2013).
Determining OR utilization and the throughput of an OR using operations research queuing models, such
as machine-shop with parallel machine scheduling (Arnaut 2010), can quite easily be performed using
1356
5. Schultz and Claudio
simulation. Niu et al. (2007) found that simulation is an efficient tool for identifying problems and
improving performance of healthcare systems. Other research works propose that simulation is a valuable
tool for analyzing and evaluating the performance of existing scheduling systems and is useful for
modelling the impact of changing specific characteristics of the system (Bennis et al. 2013; Ballard et al.
2006, Steins et al. 2010; Shamayleh 2013). Gunal (2012) provides a solid conceptual framework for
building hospital simulation models.
2.3 Managing Uncertainty
Methods for incorporating uncertainty in models varied significantly throughout existing literature. While
the majority of mathematical scheduling models used deterministic values for procedure length, a number
of models were dedicated to finding the most accurate method for predicting procedure length, thereby
reducing the variability associated with any scheduling model.
Already mentioned was a model which used a statistical method for calculating the 90% upper
prediction bounds on a surgery to allow for scheduling a delay between surgeons within a block (Dexter
et al. 2000). Dexter et al. (2010) estimated surgery durations for large variability procedures and those
with few historical data using the Bayesian method for calculating 90% upper prediction bounds. Various
forms of regression were also presented as more accurate methods for predicting surgery duration than
depending solely on historical means (Kougias et al. 2012; Kayis et al. 2012; Denton et al. 2006).
Throughout the literature on discrete-event simulation in healthcare, when distributions were used to
model procedure length, log-normal distributions were commonly used (Wullink et al. 2007; Gul et al.
2011; Steins et al. 2010). Strum et al. (2000) performed Goodness-of-Fit tests, on historical procedure
durations and found that distributions for procedure length followed a long-tailed, log-normal distribution
more closely than a normal distribution. Distributions were used to model variability in procedure length,
patient arrivals, and other stages in the operating process. Bennis et al. (2013) used triangular or uniform
distributions for all the stages in the operating process with procedure length distributions set by single
surgery groups. Arnaut (2010) used four processing versus set-up uniform distributions and Van
Houdenhoven et al. (2007) used variability in duration by surgical departments.
Some of the literature explored more unique methods of incorporating uncertainty in models. Several
researchers have used functions based on probability for adding variability to mathematical models (Hans
et al. 2008; Persson et al. 2009). Shamayleh et al. (2013) classified the complexity of procedures as either
minor, intermediate or major within surgical type. The natural variability associated with the occurrence
of emergency surgeries was modeled in comparison to artificial variability in elective surgeries as an
approach to emergency surgery assignment problems in Lamiri et al. (2009) and Smith et al. (2013).
A few topics were closely related to the type of variability based modeling reflected in this research
work. Gul et al. (2011) used discrete-event simulation embedded with a bi-criteria algorithm to optimize
opposing performance measures, patient wait time and surgical suite overtime. The authors fit
distributions to surgery groups, procedure levels and processes. They sequenced different levels of
surgeries within a surgical group based on mean, variance, and coefficient of variation using a normal
distribution for estimating the procedure duration. The appointment time for the patient was calculated by
an equation developed by Yellig and Mackulak (1997). The equation uses a multiplier depending on the
hedging level. If k is 0, then the procedure allocates to surgeries their mean duration. If k>0, the time
allocation will be more than the mean duration which is known in the literature as job hedging. The aim
of which is to provide additional buffer time to reduce the impact on patient waiting time for surgeries
running longer than the mean. Denton et al. (2006) proposed a mathematical model comparing
heuristics based on duration mean, variability and squared coefficient of variation (SCV) for calculating a
weighted sum of the expectation of three measures: waiting time, idling time and tardiness. Their model
was restricted to a particular OR/day combination and could be expanded to fit either block or open
scheduling.
Although these models are similar to the one proposed in this research in their methods for including
variability when proposing models to reduce late starts, the models do not include the variability
1357
6. Schultz and Claudio
associated with turnovers, and the models are designed to fit either block scheduling assignments or
single OR/day combinations. This research presents a new methodology for surgical scheduling which
sequences procedures based on duration groups, their level of variability, and specific turn over
distributions.
3 METHODOLOGY
The discrete-event simulation model design presented in this work was based on three years of historical
data which encompassed 567 specific type of procedures with 14,142 procedures performed after
eliminating those performed in the dedicated maternity OR and the pain management/injection room. For
each specific procedure, mean duration, standard deviation and coefficient of variation (CV) were
calculated. Procedures were designated one of 6 duration categories based on their mean duration and the
availability of time in each month to perform all procedures within each category as presented in table 1.
In addition, procedures were assigned a high or low level of variability based on their CV. Low variability
procedures were defined as those with a CV under 0.30. Consequently, procedures were grouped in one
of 12 groups based on mean duration and variability.
Turnover times between surgeries were assigned a distribution based on the preceding surgery’s
duration and variability group and whether or not the average procedure duration fell above or below the
mean for that group.
Table 1: Definition of duration categories.
3.1 Model Design
The simulation model for the current state of the hospital’s operating theatre was built to analyze the
number of late starts and length of delays experienced by each duration/variability group while operating
under current scheduling methods. The model read actual scheduled start times, procedure times and OR
assignments from 10 weeks of data selected for having an above average number of procedures
performed during those weeks. The first procedure of the day was scheduled for 07:30 and every
procedure with an assigned start time and OR was included in the model, including add-ons and
unscheduled surgeries, unless it was an emergency or add-on scheduled for after 16:30 or before 07:30. A
single week of scheduled surgeries was run in each iteration to be compared to a week’s results in the
proposed model. In order to reflect the same conditions that would apply to the proposed model, surgeries
were only allowed to commence at the scheduled start time or their actual start time if they began late,
they were unable to begin early. Surgeries beginning before the scheduled start were adjusted to begin on
time, along with any consecutive surgeries impacted by the adjustment. Turnovers were assigned the
prescribed turnover distribution based on the variability in turnover times due to complexity of surgery,
not allowing for outside interruptions or emergencies.
The model recorded statistics of the total number tardy for each group, the number that were over 30
minutes tardy and the average lateness by group. Validating the model involved comparing the number
tardy and lateness in the model to the actual records for the 10 weeks being simulated.
Duration
(min.)
# of
Procedures
Approximate Hrs.
required/month
Category
(301- MAX) 406 78.45 EXTREME
(173, 300) 1010 146.38 LONG
(125, 172] 1981 164.60 MIDLONG
(91, 124] 2829 169.47 MID
[60, 90] 3568 155.13 MIDSHORT
< = 59 4348 123.93 SHORT
1358
7. Schultz and Claudio
Table 2: Paired two sample t-tests for validation of the current state model.
Total No. Late Starts/week No. Late Starts: 30 min or greater/week
CURRENT STATE
ORIG
CURRENT STATE
MODEL
CURRENT STATE
ORIG
CURRENT STATE
MODEL
Mean 65.70 53.16 22.70 24.78
Variance 26.46 70.73 44.46 55.86
Pearson Correlation -0.089 0.519
P(T<=t) one-tail 0.0019 0.185
The historical data was anticipated to have more late starts than the model due to turnover durations
much greater than the model distribution allowed. Paired T-tests were run on the total number tardy and
the number tardy by greater than 30 minutes to determine if the model results were significantly different
from the original data set. Because of the small number of comparisons and the allowable amount of
variance between the actual data and the model, p-values were tested at ⍺= 0.10, for significance of
difference. The historical data showed a significant difference in total number of late starts compared to
the model, whereas the number of late starts greater than 30 minutes in duration were not proven to differ
(Table 2). Because the model removed the potential for any delays other than those related to procedure
duration, the model adjusted the total number of late starts down from the original number of late starts.
If the model had created a greater number of tardy procedures, it would not have been validated.
However, the results confirmed the effectiveness of the model for re-creating the current scheduling
methods used by the hospital and its ability to identify the expected number of late starts and the
procedures which were delayed by more than 30 minutes accurately.
Once the current state model was validated, it was determined the same conceptual model would be
effective for modeling any proposed scheduling algorithms. Consequently, figure 1 presents a depiction
of the conceptual model used for the simulation of both the current state and the proposed state with then
new scheduling algorithm. The files read by the proposed model reflected a new scheduling algorithm and
OR assignments with the same 10 weeks of procedure durations, under/over mean assignments, turnover
time distributions and was set to generate the same statistics for comparison.
Figure 1: Conceptual model of both the current state and proposed state models for the simulation.
3.2 Proposed Model Design
Building the variability based model required defining the constraints the model would operate within.
The same procedures were run for each week as in the current state model, however, the model ran under
the assumption that those procedures for each week were not fixed to be performed on a specific day or in
the same OR. All procedures would be completed by 16:30, allowing for the addition of emergency
procedures and add-ons to any of the ORs without exceeding the current utilization of the operating suite.
1359
8. Schultz and Claudio
−
Low Variability Procedures:
+ −
High Variability Procedures:
++ 1
2
Adjusted Average
Duration (Procedure)
Adjusted Average
Duration (Procedure)
Adjusted Standard
Deviation (Procedure)
Adjusted Standard
Deviation (Procedure)
Adjusted Average
Duration (Turnover)
Adjusted Average
Duration (Turnover)
Adjusted Standard
Deviation (Turnover)
Adjusted Standard
Deviation (Turnover)
Adjusted Average
Duration (Procedure)
Adjusted Average
Duration (Procedure)
Adjusted Standard
Deviation (Procedure)
Adjusted Standard
Deviation (Procedure)
Adjusted Average
Duration (Turnover)
Adjusted Average
Duration (Turnover)
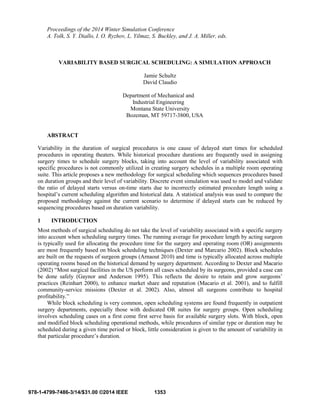
Figure 2: Algorithm for assigning scheduled time to each procedure to account for variability.
A new schedule was completed for each of the 10 weeks used in the current state model with adjusted
average durations and standard deviations for procedures and turnovers calculated for all procedures
within a duration/variability group whose procedure average duration fell either above or below the group
mean. Using these adjusted means and standard deviations, a simple algorithm was designed to assign one
of 24 set amounts of time to schedule for the completion of a procedure (Figure 2). For low variability
procedures, the adjusted average procedure and turnover durations were found to be inflated, distributions
skewed to the right, by infrequent long procedure durations. In order to compensate for this inflated
average and to create an algorithm that could be applied to all low variability procedures, the amount of
time to schedule needed to be corrected to be lower than the average. For high variability procedures, in
order to provide the flexibility to handle a larger occurrence of longer than average duration procedures,
the amount of time to schedule needed to be corrected to be slightly higher than the average. Table 3
presents a portion of the data used for assigning amount of time to schedule and the turnover distributions
used in both the current state and proposed model.
The final decision to be made about the model design was defining the sequencing rule for scheduling
within each OR on each day. It was determined there would be fewer late starts if procedures with
average durations over the mean for their group and high variability could be performed after those with
low variability and durations under the mean.
Table 3: Sample of the data used for calculating the new scheduled start times and the turnover
distributions used for both the current state and proposed model.
DURATION TURNOVER
DURATION/
VARIABILITY
GROUP
GROUP:
MEAN
DURATION
MEAN
IF OVER
OR
UNDER
ST.
DEV.
TURNOVER
MEAN
TIME
ST. DEV.
TURNOVER
SKED
TIME
TURNOVER
DISTRIBUTION
SHORT/LOW-
UNDER
40.3 37.17 0.96 21.20 9.90 47.51 8+ERLA(9,2)
SHORT/LOW-
OVER
40.3 49.87 5.57 35.00 11.30 67.10 8+ERLA(9,2)
SHORT/HIGH-
UNDER
44.4 32.63 10.34 26.30 10.60 64.10 TRIA(8,19,60)
SHORT/HIGH-
OVER
44.4 55.04 2.83 29.48 12.10 85.94 TRIA(8,19,60)
MIDSHORT/LOW-
UNDER
73.5 67.6 2.87 36.56 9.00 92.29 14+ERLA(14.1,1)
MIDSHORT/LOW-
OVER
73.5 78.47 3.27 34.56 9.00 100.76 14+ERLA(14.1,1)
MIDSHORT/HIGH
-UNDER
72.8 64.10 2.82 30.28 11.00 95.78 TRIA(11,22,60)
MIDSHORT/HIGH
-OVER
72.8 81.68 4.77 31.10 11.00 115.16 TRIA(11,22,60)
1360
9. Schultz and Claudio
In scheduling for a week, depending on the demand for specific procedures, low variability
procedures from the same duration/variability group were stacked early in the day, to be followed by one
or two high variability procedures. For example, 6 tonsillectomies would be scheduled for 50 minutes
each starting at 07:30, to be followed by a laparoscopic assisted partial colectomy being scheduled for
290 minutes including its turnover. Where demand did not allow for the sequencing rule to be applied,
best judgment was used for scheduling within the time constraints.
4 RESULTS
Each of the 10 weeks of procedures were run through 30 replications in both models to allow any
abnormal turnover times to be averaged into the results of the simulation. The total number of late starts
in the variability based model was lower for all of the 10 weeks, and late starts delayed by greater than 30
minutes were improved in all weeks, except for one week with an exceptionally low number of high
variability procedures. Average lateness was also significantly reduced in the proposed model to
approximately 11 minutes compared to approximately 28 minutes in the current state model. Paired t-tests
were run to check if improvements by the new model were statistically significant. The results, as
presented in Table 4, showed that both total number of late starts and those 30 minutes or greater were
significantly lower in the new model.
Short duration surgeries (under 90 minutes) with high variability experienced the longest and most
frequent delays in both models. An Erlang distribution came closest to representing the data for short
duration surgery turnovers and although the distribution skewed times to the low end of the data, the
average length for the turnovers was longer than what occurred in reality. Turnovers were allowed to
extend to over 60 minutes and it appears the distribution should have been restricted to a more realistic
maximum delay. The current state model experienced more frequent delays in the mid-length procedures
while the new model showed that the delays in procedures over 120 minutes were almost eliminated.
The practical implications are in the fact that a scheduling model that considers variability and is not
restricted by surgeon’s block assignments reduces the impact of late starts. The new model also
smoothed the utilization of the ORs. Instead of having one or two ORs available for add-ons, without
flexibility for handling emergencies, every room has the flexibility to add cases. Only cases that already
experience a large amount of variability will be impacted if cases are added either after the low variability
cases are completed or in rooms with only one or two long duration, high variability cases are scheduled.
Although there were a small number of weeks simulated, the scheduling algorithm and sequencing
rule can be adapted to handle larger sets of data once they are written into a scheduling program. The
results were all gathered from weeks with over 100 procedures to schedule which represented some of the
busiest weeks available in the past three years, making certain the heaviest demand could be met.
The significant change, a decrease from approximately 53% of procedures starting late to 35% in the
new model and from 24% of procedures starting more than 30 minutes late in the current system to 13%
in the proposed model, shows that including variability in procedure length deserves consideration in a
scheduling methodology.
Table 4: Paired two sample t-tests comparing the current state model and variability based model.
Total No. Late Starts/week No. Late Starts: 30 min or greater/week
CURRENT STATE
ORIG
PROPOSED
MODEL
CURRENT STATE
ORIG
PROPOSED
MODEL
Mean 53.16 35.61 24.78 13.67
Variance 70.73 35.94 55.86 27.94
Pearson Correlation 0.251 0.343
P(T<=t) one-tail 0.0001 0.0006
1361
10. Schultz and Claudio
5 CONCLUSIONS
There are many additional factors that need to be considered in designing a more robust variability based
scheduling methodology. A few of the elements identified that would augment the model are:
• Include a system for managing emergency and add-on procedures. With approximately 17% of
the total number of procedures being unscheduled, there is a need for developing a method for
incorporating slots for add-ons into the scheduling algorithm rather than just scheduling extra
needed capacity for each OR.
• While the model does attempt to group surgeries by their average duration within a specific OR
across a week, it would be practical to keep specific surgeon’s or surgery group’s procedures
together where possible.
• More accurate estimations for variability should be developed by analyzing procedures by
performing surgeon. This would most likely reduce the number of high variability surgeries,
opening more of the schedule up for procedures that can be stacked within an OR on a day which
would reduce the amount of slack in the system and allow for a more efficient method of
managing add-ons.
• A more realistic system for incorporating turnovers into the schedule should be addressed.
Procedures should be staggered to ensure the auxiliary staff is available for OR turnovers with
fewer conflicting procedures ending at the same time.
This research shows how one method can improve the efficiency of surgery scheduling, however, the
question remains: is it feasible? Changing to a system that is patient centric in place of a blocking system
that is beneficial to surgeons requires an organization that embraces change. Surgeons and staff would
have to be more flexible in their availability. For example, instead of being able to reserve an OR for an
entire day of tonsillectomies, a surgeon may be scheduled two half days, freeing the afternoons for more
complex surgeries. In a small hospital with relatively low utilization, the schedule would still provide the
flexibility for specific surgeries to be assigned to ORs that are better suited for those procedures. The
model adds one more consideration to the scheduling problem, if a procedure is highly variable, it should
be scheduled later in the day while procedures with low variability should be scheduled early leaving
enough time for the completion of those more complex procedures.
REFERENCES
Arnaout, J. P. 2010. "Heuristics for the Maximization of Operating Rooms Utilization using Simulation.”
Simulation 86: 573-583.
Ballard, S., and M. E. Kuhl. 2006. "The Use of Simulation to Determine Maximum Capacity in the
Surgical Suite Operating Room." In Proceedings of the 2006 Winter Simulation Conference, edited
by L. F. Perrone, F. P. Wieland, J. Liu, B. G. Lawson, D. M. Nicol, and R. M. Fujimoto , 433-438.
Piscataway, New Jersey: Institute of Electrical and Electronics Engineers, Inc.
Bennis, F., M. Amghar, N. Sbiti, and A. Elouadi. 2013. "Modeling and Performance Evaluation of the
Operating Room in a Hospital." International Journal of Emerging Science and Engineering (IJESE)
1, no.4.
Cardoen, B., E. Demeulemeester, and J. Beliën. 2010. "Operating Room Planning and Scheduling: A
Literature Review." European Journal of Operational Research 201, no. 3: 921-932.
Chow, V. S., M. L. Puterman, N. Salehirad, W. Huang, and D. Atkins. 2011. "Reducing Surgical Ward
Congestion Through Improved Surgical Scheduling and Uncapacitated Simulation." Production and
Operations Management 20, no. 3: 418-430.
Denton, B. T., A. S. Rahman, H. Nelson, and A. C. Bailey. 2006. "Simulation of a Multiple Operating
Room Surgical Suite." In Proceedings of the 2006 Winter Simulation Conference, edited by L. F.
Perrone, F. P. Wieland, J. Liu, B. G. Lawson, D. M. Nicol, and R. M. Fujimoto , 414-424.
Piscataway, New Jersey: Institute of Electrical and Electronics Engineers, Inc.
Denton, B. T., J. Viapiano, and A. Vogl. 2007. "Optimization of Surgery Sequencing and Scheduling
Decisions Under Uncertainty."Health care management science 10, no. 1: 13-24.
1362
11. Schultz and Claudio
Dexter, F. 2000. "A Strategy to Decide Whether to Move the Last Case of the Day in an Operating Room
to Another Empty Operating Room to Decrease Overtime Labor Costs." Anesthesia & Analgesia 91,
no. 4: 925-928.
Dexter, F., J. T. Blake, D. H. Penning, and D. A. Lubarsky. 2002. "Calculating a Potential Increase in
Hospital Margin for Elective Surgery by Changing Operating Room Time Allocations or Increasing
Nursing Staffing to Permit Completion of More Cases: a Case Study." Anesthesia & Analgesia 94,
no. 1: 138-142.
Dexter, F., R. D. Traub, and P. Lebowitz. 2001. "Scheduling a Delay Between Different Surgeons’ Cases
in the Same Operating Room on the Same Day Using Upper Prediction Bounds for Case
Durations." Anesthesia & Analgesia 92, no. 4: 943-946.
Dexter, F., E. U. Dexter, and J. Ledolter. 2010. "Influence of Procedure Classification on Process
Variability and Parameter Uncertainty of Surgical Case Durations." Anesthesia & Analgesia 110, no.
4: 1155-1163.
Dexter, F., and A. Macario. 2002. "Changing Allocations of Operating Room Time from a System Based
on Historical Utilization to One Where the Aim is to Schedule as Many Surgical Cases as Possible."
Anesthesia & Analgesia 94, no. 5: 1272-1279.
Erdogan, S. A., B. T. Denton, J. J. Cochran, L. A. Cox, P. Keskinocak, J. P. Kharoufeh, and J. C. Smith.
2011. Surgery planning and scheduling. Wiley Encyclopedia of operations research and management
science. http://ca. wiley. com/WileyCDA/Section/id-380199. html.
Gaynor, M., and G. F. Anderson. 1995. "Uncertain Demand, the Structure of Hospital Costs, and the Cost
of Empty Hospital Beds." Journal of Health Economics 14, no. 3: 291-317.
Gul, S., B. T. Denton, J. W. Fowler, and T. Huschka. 2011. "Bi‐Criteria Scheduling of Surgical Services
for an Outpatient Procedure Center." Production and Operations Management 20, no. 3: 406-417.
Gunal, M. M. 2012. "A Guide for Building Hospital Simulation Models." Health Systems 1, no. 1: 17-25.
Hans, E., G. Wullink, M. Van Houdenhoven, and G. Kazemier. 2008. "Robust Surgery
Loading." European Journal of Operational Research 185, no. 3: 1038-1050.
Hopp, W. J., and M. L. Spearman. 2008. Factory Physics (3rd
ed.). New York: McGraw-Hill/Irwin.
Jeang, A., and A. Chiang. 2012. "Economic and Quality Scheduling for Effective Utilization of Operating
Rooms." Journal of Medical Systems 36, no. 3: 1205-1222.
Kayis, E., H. Wang, M. Patel, T. Gonzalez, S. Jain, R. J. Ramamurthi, C. Santos, S. Singhal, J.
Suermondt, and K. Sylvester. 2012. "Improving Prediction of Surgery Duration using Operational and
Temporal Factors." In AMIA Annual Symposium Proceedings 2012:456. American Medical
Informatics Association.
Kougias, P., V. Tiwari, S. Orcutt, A. Chen, G. Pisimisis, N. R. Barshes, C. F. Bechara, and D. H. Berger.
2012. "Derivation and Out-of-Sample Validation of a Modeling System to Predict Length of
Surgery." The American Journal of Surgery 204, no. 5: 563-568.
Lamiri, M., F. Grimaud, and X. Xie. 2009. "Optimization Methods for a Stochastic Surgery Planning
Problem." International Journal of Production Economics 120, no. 2: 400-410.
Lamiri, M., J. Dréo, and X. Xie. 2007. "Operating Room Planning with Random Surgery Times." In IEEE
International Conference on Automation Science and Engineering 521-526.
Macario, A., F. Dexter, and R. D. Traub. 2001. "Hospital Profitability per Hour of Operating Room Time
can Vary Among Surgeons." Anesthesia & Analgesia 93, no. 3: 669-675.
May, J. H., W. E. Spangler, D. P. Strum, and L. G. Vargas. 2011. "The Surgical Scheduling Problem:
Current Research and Future Opportunities." Production and Operations Management 20, no. 3: 392-
405.
Niu, Q., Q. Peng, T. El Mekkawy, Y. Y. Tan, H. Bruant, and L. Bernaerdt. 2011. "Performance Analysis
of the Operating Room Using Simulation." In Proceedings of the Canadian Engineering Education
Association.
Persson, M. J., and J. A. Persson. 2010. "Analysing Management Policies for Operating Room Planning
Using Simulation." Healthcare Management Science 13, no. 2: 182-191.
1363
12. Schultz and Claudio
Reinhardt, U. E. 2000. "The Economics of For-Profit and Not-For-Profit Hospitals." Health Affairs 19,
no. 6: 178-186.
Roland, B., C. Di Martinelly, F. Riane, and Y. Pochet. 2010. "Scheduling an Operating Theatre Under
Human Resource Constraints." Computers & Industrial Engineering 58, no. 2: 212-220.
Saremi, A., P. Jula, T. El Mekkawy, and G. G. Wang. 2013. "Appointment Scheduling of Outpatient
Surgical Services in a Multistage Operating Room Department." International Journal of Production
Economics 141, no. 2: 646-658.
Shamayleh, A. 2013. "Surgical Theater Utilization and PACU Staffing." World Academy of Science,
Engineering and Technology 7:5-28.
Smith, C. D., T. Spackman, K. Brommer, M. W. Stewart, M. Vizzini, J. Frye, and W. C. Rupp. 2013.
"Re-Engineering the Operating Room Using Variability Methodology to Improve Healthcare Value."
Journal of the American College of Surgeons 216, no. 4: 559-568.
Steins, K., F. Persson, and M. Holmer. 2010. "Increasing Utilization in a Hospital Operating Department
Using Simulation Modeling." Simulation 86, no. 8-9: 463-480.
Strum, D. P., J. H. May, and L. G. Vargas. 2000. "Modeling the Uncertainty of Surgical Procedure Times:
Comparison of Log-Normal and Normal Models." Anesthesiology 92, no. 4: 1160-1167.
Van Houdenhoven, M., J. M. Van Oostrum, E. W. Hans, G. Wullink, and G. Kazemier. 2007. "Improving
Operating Room Efficiency by Applying Bin-Packing and Portfolio Techniques to Surgical Case
Scheduling." Anesthesia & Analgesia 105, no. 3: 707-714.
Wu, R. L., and A. H. Aufses Jr. 2012. "Characteristics and Costs of Surgical Scheduling Errors." The
American Journal of Surgery 204, no. 4: 468-473.
Wullink, G., M. Van Houdenhoven, E. W. Hans, J. M. Van Oostrum, M. Van der Lans, and G. Kazemier.
2007. "Closing Emergency Operating Rooms Improves Efficiency." Journal of Medical Systems 31,
no. 6: 543-546.
Yellig, E. J., and G. Mackulak. 1997. "Robust Deterministic Scheduling in Stochastic Environments: the
Method of Capacity Hedge Points." International Journal of Production Research 35, no. 2: 369-379.
AUTHOR BIOGRAPHIES
JAMIE SCHULTZ obtained her M.S. in Industrial and Management Engineering from Montana State
University, Bozeman, Montana. She has completed multiple projects and internships in the healthcare
field focused on process improvement, simulation, statistical analysis and scheduling solutions. Her email
address is 1jamieschultz@msn.com.
DAVID CLAUDIO is an assistant professor of industrial engineering in the Department of Mechanical
and Industrial Engineering at Montana State University, Bozeman, Montana. He received his Ph.D. in
Industrial Engineering from the Pennsylvania State University. His research interests include Human
Factors, Service Systems, Healthcare Engineering, and Decision Making. His email address is:
david.claudio@ie.montana.edu.
1364