The document discusses a study that found correlations between water temperatures, measured by indices like ONI and AMO, and forest fire severity over a nine-month window centered around peak fire months. The study created correlation maps showing the relationship between these climate indices and fire severity in different regions of South America. Understanding these correlations could help better prepare for possible fires by giving a four-month warning window before high-risk fire months. The methodology involved calculating fire severity seasons for years by summing values in the nine-month window, then correlating the climate index values for individual months within that window with the corresponding fire severity values.
Good Stuff Happens in 1:1 Meetings: Why you need them and how to do them well
James Middleton - Chen Thoughts - Annual Fire Season Severity
1. James Middleton
Summer 2012 Report
I. Introduction
The problem at hand is that there is a proven positive correlation between the temperatures in the
water and fires. Within the Chen paper, He showed these correlations using the Oceanic Nino
Index (ONI) and the Atlantic Multidecadal Oscillation (AMO). He took these and correlated
these values with the Annual Fire Season Severity (FSS) for a given location on the map. In each
year there is a nine month window from the peak fire month of that year, being four months
before and four months after the peak fire month. In the paper, Chen found the lead times such
that the maximum correlation between fire season severity and climate indices occurred. With
this he could show the correlation map of
South America of both ONI and AMO and the
combined correlation. The motivation of
showing these correlations is to better prepare
people. Knowing there is a four month
window by the peak fire month can help
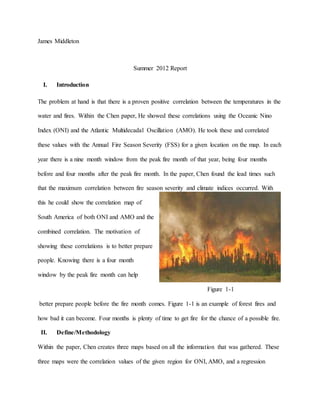
Figure 1-1
better prepare people before the fire month comes. Figure 1-1 is an example of forest fires and
how bad it can become. Four months is plenty of time to get fire for the chance of a possible fire.
II. Define/Methodology
Within the paper, Chen creates three maps based on all the information that was gathered. These
three maps were the correlation values of the given region for ONI, AMO, and a regression
2. model of both the ONI and AMO. Figure 1-2 is the three correlation maps that Chen created. The
process of each the ONI and AMO was done to find the values for the given years started by
taking a look at the peak fire month. Centered on
the peak fire month, they took a look at four
months after and four months before. This becomes
your nine month window. The sum of the nine
month window becomes your Fire Severity Season
for that given year. Now thinking about AMO and
ONI, you would start by looking at the three
months at a time. Take the mean of them three
months. This value you receive from the mean of
Figure 1-2
these three months would be the value for the individual month in the middle. The tricky part
about getting the individual month values will come down to getting the values for December
and January. When it comes to getting the value for December, you will have to look into the
next year and vice versa for January. After you gathered all the individual values for every
month then you would look back at the Fire Severity Season data that was computed. Correlate
the value for the individual month with the corresponding month computed for the Fire Severity
Season for the specific year.