1. H o u s i n g M a r k e t I n f o r m a t i o n
HOUSING MARKET OUTLOOK
Date Released:
C a n a d a M o r t g a g e a n d H o u s i n g C o r p o r a t i o n
Table of Contents
SUBSCRIBE NOW!
Access CMHC’s Market Analysis
Centre publications quickly and
conveniently on the Order Desk at
www.cmhc.ca/housingmarketinformation.
View, print, download or subscribe
to get market information e-mailed
to you on the day it is released.
CMHC’s electronic suite of national
standardized products is available
for free.
Housing market intelligence you can count on
Edmonton CMA
Fall 2015
Highlights1
„„ Single-detached housing starts will move lower in 2016 and rise in 2017
„„ Multi-family housing starts will increase in 2015 before declining in 2016 and
2017
„„ MLS®2
sales will decrease in 2015 and post modest gains in 2016 and 2017
„„ Edmonton’s apartment vacancy rate will rise
1 Highlights
2 New Home Market:
Total housing starts lower in
2016 and 2017
3 Existing Home Market:
Modest growth expected
in 2016
5 Rental Market:
Vacancy rates will rise over
the forecast horizon
5 Economic Trends:
Job growth will be slow in
2015 and 2016
8 Trends at a Glance
9 Forecast Summary
0
1,000
2,000
3,000
4,000
5,000
6,000
7,000
8,000
9,000
10,000
2006 2007 2008 2009 2010 2011 2012 2013 2014 2015f 2016f 2017f
Source: CMHC, CMHC Forecast (f)
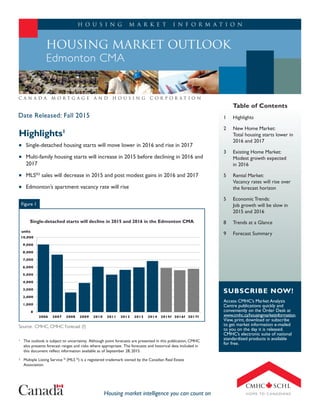
Figure 1
Single-detached starts will decline in 2015 and 2016 in the Edmonton CMA
1 The outlook is subject to uncertainty. Although point forecasts are presented in this publication, CMHC
also presents forecast ranges and risks where appropriate. The forecasts and historical data included in
this document reflect information available as of September 28, 2015.
2 Multiple Listing Service ®
(MLS ®
) is a registered trademark owned by the Canadian Real Estate
Association.
units
2. 2Canada Mortgage and Housing Corporation
Housing Market Outlook - Edmonton CMA - Date Released - Fall 2015
New Home Market:
Total housing starts lower
in 2016 and 2017
Strength across the multi-family
sector will push total housing starts
in 2015 18 per cent higher than
the previous year in the Edmonton
Census Metropolitan Area (CMA).
However, this strength will dissipate
in the closing months of 2015, and
throughout 2016 as slower economic
growth and reduced net migration
lead to softer housing demand in
2016. By 2017, rising inventory on
the multi-family market will lead to
a further reduction in total housing
starts. Overall, total housing starts are
forecast at 16,400 for 2015, 11,100 for
2016 and 10,800 for 2017.
Weaker economic conditions and
a well-supplied resale home market
will continue to weigh down the
new single-detached housing market
in Edmonton. Strength in the early
months of 2015 has dissipated,
and single-detached housing starts
through August were down six per
cent year-over-year.Through the final
months of 2015, single-detached starts
will be compared against relatively
strong numbers in 2014, leading to a
decline of 14 per cent by year’s end.
In 2016, lower migration, coupled
with relatively high inventory on
the existing home market, will lead
to a further contraction in single-
detached housing starts. In 2017, a
slight improvement on the economic
front should support some modest
growth in housing demand and lead
to a small increase in the number of
single-detached housing starts. Overall,
single-detached housing starts will
total 5,900 in 2015, 5,600 in 2016 and
5,800 in 2017.
Single-detached starts have declined
on a year-over-year basis for three
consecutive months, beginning in June
2015.The recent pull-back can, in
part, be attributed to rising inventory
levels.As of August 2015, there were
599 new completed and unabsorbed
single-detached homes in inventory,
up 11 per cent from the same month
of 2014.The increase was a result of
both higher number of show homes
and spec homes. Slower starts in the
past three months have pushed the
number of units under construction
down five per cent year-over-year,
with 4,030 single-detached homes
underway in August.The lower pace of
construction activity in recent months
should prevent inventory from rising
too quickly through the end of 2015,
which will help subdue the decline
in single-detached starts in 2016.
However, even with supply down year-
over-year for the first time in August,
demand for single-detached housing
starts is expected to be soft in 2016,
translating into a further reduction.
By 2017, a modest increase can be
expected as improving economic
conditions and employment translate
into a pick-up in demand. However,
this is predicated on inventory levels
not increasing too quickly in 2016 and
remaining at manageable levels moving
into 2017.
Compositional factors will drive the
average absorbed price for a new
single-detached home to $600,000 in
2015, up from $568,676 in 2014.As
of August 2015, homes priced above
$700,000 accounted for 19 per cent
of sales, up from 12 per cent in 2014.
In 2016, higher inventory on both
the new and existing home market
will lead to slower price growth, with
higher input prices contributing to
price increases. By 2017, a modest
pick-up in demand will lead to a
small increase in the pace of price
growth. Overall, the average absorbed
price will be $609,000 in 2017 and
$621,000 in 2017.
Multi-family starts, including semi-
detached, row, and apartment units
began 2015 at a record setting pace
in the first quarter.Through the first
0
200
400
600
800
1,000
1,200
2006 2007 2008 2009 2010 2011 2012 2013 2014 2015
Source: CMHC
Figure 2
Single-detached inventory has moved higher in recent months
in the Edmonton CMA
units
3. 3Canada Mortgage and Housing Corporation
Housing Market Outlook - Edmonton CMA - Date Released - Fall 2015
eight months of 2015, multi-family
housing starts reached 8,310 units,
up 88 per cent over the same period
of 2014. Strength in this market was
driven by higher row and apartment
starts, while semi-detached activity
was in-line with 2014 levels.A tight
rental market with rising rents
drew builders to increase rental
apartment starts, while relatively low
inventory on the ownership market
led to higher condo apartment and
row starts. However, this trend is
not expected to continue. Slower
employment growth this year, lower
migration and a higher vacancy
rate will slow demand in the multi-
family segment of the market. Also,
a higher number of completed and
unabsorbed units is expected as a
result of stronger activity over the
past two years, and this will lead to a
sharp decline in multi-family housing
starts in the Edmonton CMA in 2016,
followed by a more modest reduction
in 2017. Overall, multi-family housing
starts are forecast at 10,500 in 2015,
5,500 in 2016 and 5,000 in 2017.
The elevated pace of new
construction in the multi-family
market has started to decline.The
number of multi-family housing starts
has trended down from its peak and
this is expected to continue into
2016 and 2017.As of August, there
were 12,218 multi-family units under
construction, a near record high level.
With economic conditions expected
to remain weak through much of
2016, demand for multi-family units in
both the ownership and rental market
is expected to wane. Both the number
of semi-detached and row units in
inventory has started to increase
which should temper production of
these units in the coming months.
Apartment ownership inventory is
still relatively low, but as units under
construction move to completion,
inventory levels will rise.This will,
in turn, slow the pace of apartment
construction in 2016 and 2017.
Existing Home Market:
Modest growth expected
in 2016
Slower economic activity, which has
moderated employment growth
and migration, coupled with lower
consumer confidence will lead to a
reduction in the number of MLS®
sales in the Edmonton CMA in 2015.
In 2016, much of the same economic
factors will keep demand growth in
check, particularly through the first
half of the year. By 2017 improving
economic conditions should support
0
2,000
4,000
6,000
8,000
10,000
12,000
2006 2007 2008 2009 2010 2011 2012 2013 2014 2015f 2016f 2017f
Source: CMHC, CMHC Forecast (f)
Figure 3
Multi-family starts will decrease in both 2016 and 2017 in the Edmonton CMA
units
0
5,000
10,000
15,000
20,000
25,000
2006 2007 2008 2009 2010 2011 2012 2013 2014 2015f 2016f 2017f
Source: CREA, CMHC Forecast (f)
Figure 4
Edmonton’s MLS®
sales will post a modest gain in 2016 after declining in 2015
units
4. 4Canada Mortgage and Housing Corporation
Housing Market Outlook - Edmonton CMA - Date Released - Fall 2015
growth in demand for resale homes
in Edmonton, but with the economy
in a recovery phase, growth will be
modest compared to the gains posted
in 2013.All in, MLS®
sales will decline
by 12 per cent in 2015 to 17,500,
before posting a modest gain to
17,800 in 2016. Sales are expected to
grow 2.8 per cent in 2017 to reach
18,300.
MLS®
sales pulled back quickly in the
early months of 2015. In the first
quarter, sales were down 14 per cent
year-over-year. Since then activity has
picked-up, but has still lagged behind
last year’s levels in all but one month
of 2015.Through August 2015, sales
were down eight per cent from the
first eight months of 2014. Moving
forward, a weaker economic front
will keep the pace of sales near its
current levels into 2016. Mortgage
rates are expected to remain low in
2016, which will support sales activity.
However, some potential homebuyers
will choose to wait until economic
conditions firm up before entering
into the market. Others, who have
an existing home to sell, will need to
delay their purchase as the time to sell
on the resale market has lengthened.
Supply on the resale market remains
elevated. New listings were up 13
per cent in the first eight months of
2015, compared to the same period
of 2014.This has pushed overall
selection on the market up, with the
average number of active listings on
the market 30 per cent higher than
2014 levels in the first eight months
of 2015.This has led to a longer
selling period, with the average days
on the market reaching 54 days in
August, up from 49 in the same period
of last year. Both new and active
listings are expected to decline in
2016 and 2017, but will remain above
2014 levels throughout the forecast
horizon. Slightly higher sales activity
will support the decline in active
listings, as will fewer new listings as
potential home sellers wait for market
conditions to firm up before listing
their home.Active listings will average
about 6,100 units in 2015, 5,800 units
in 2016 and 5,500 units in 2017.
A larger selection of homes and lower
demand will temper price growth
in Edmonton in 2015.The average
resale price is forecast at $363,000
for 2015, relatively unchanged from
the $362,657 recorded in 2014.After
eight months of 2015, the average
MLS®
price was $371,235, up 2.7 per
cent from the same period of 2014.
The forecast calls for the average
price to moderate somewhat in the
remaining months of 2015, as higher
supply and lower demand lead to
small price declines. In 2016, price
0
2,000
4,000
6,000
8,000
10,000
12,000
2006 2007 2008 2009 2010 2011 2012 2013 2014 2015
Actual Trend
Source: RAE,Trended by CMHC
Figure 5
Edmonton MLS® active listings continue to surpass 2014 levels
units
$0
$50,000
$100,000
$150,000
$200,000
$250,000
$300,000
$350,000
$400,000
2006 2007 2008 2009 2010 2011 2012 2013 2014 2015f 2016f 2017f
Source: CREA, CMHC Forecast (f)
Figure 6
The average resale price will make small gains in 2016 in Edmonton
average price, residential
5. 5Canada Mortgage and Housing Corporation
Housing Market Outlook - Edmonton CMA - Date Released - Fall 2015
pressures will be weak through
much of the year.Although supply
is expected to contract modestly,
demand will remain soft as low
oil prices continue to weigh down
employment growth and migration.
This will lead to an average resale
price of $366,000. By 2017, improving
economic conditions will support
price gains more in line with inflation.
The average resale price is expected
to rise 2.2 per cent to $374,000.
Buyers continue to have the upper
hand in Edmonton’s resale market.
The sales-to-active listings ratio was
at 20 per cent in August, down from
32 per cent in the same month of
2014. Buyers’ conditions will prevail
through the end of 2015 and into
2016 as a result of higher supply
and lower demand. Conditions will
become more balanced near the end
of 2016 and into 2017 as an improving
economic environment supports
higher demand.
Rental Market:
Vacancy rates will rise
over the forecast horizon
Edmonton’s vacancy rate will rise
over the next three years as growth
in supply surpasses that of demand.
The rental vacancy rate in the
Edmonton CMA increased to 1.7 per
cent in October 2014, after reaching
a low of 1.4 per cent in 2013. From
July 2014 to June 2015 2,120 new
rental units were completed.These
units will increase the overall rental
universe in Edmonton for the 2015
survey. In 2016 and 2017, an elevated
number of rental units currently under
construction will lead to further
expansion of rental supply. In addition
to a rising supply, lower migration
and slower employment growth
this year has eased rental demand,
adding additional upward pressure
on the vacancy rate. Edmonton’s
primary rental market will also face
continued competition from the
secondary rental market, particularly
condominium apartments which, in
the face of easing demand, will also
push the vacancy rate up.The vacancy
rate in the Edmonton CMA will
increase to 3.0 per cent in 2015, 3.5
per cent in 2016 and 3.7 per cent in
2017.
Although the vacancy rate in
Edmonton will move higher over the
next three years, average rents are
expected to continue to increase.
However, the pace of growth will slow
and growth will not be a result of
higher demand, but rather the result
of changes in the type of units for
rent. New units, which typically rent
for an above-average price, will push
average rents higher over the next
three years. On the demand side, as
the vacancy rate moves higher rent
pressures for existing units will ease,
partially offsetting the increase from
new rental units. Overall, the average
rent for a two-bedroom apartment
will rise to $1,265 in 2015, $1,295 in
2016 and $1,320 in 2017.
The number of apartments in
Edmonton’s primary rental market is
expected to continue to move higher
over the next three years.The pace of
rental construction has been elevated
since 2012.As of August 2015, there
were 2,936 market rental apartments
under construction, 15 per cent
higher than the same month of 2014,
and almost double the preceding five-
year average.These units will be added
to the universe as they complete
in 2016 and 2017, putting upward
pressure on both the vacancy rate
and average rent. However, as vacancy
rates increase and rent growth slows,
builders will reduce the pace of new
rental construction.
Economic Overview:
Job growth will be slow in
2015 and 2016
The decline in oil prices has
contributed to weaker economic
conditions in Edmonton, which
will continue into 2016. Layoffs in
the energy sector and supporting
industries have continued in recent
months.After four years of strong
0
1
2
3
4
5
6
2006 2007 2008 2009 2010 2011 2012 2013 2014 2015f 2016f 2017f
Source: CMHC, CMHC Forecast (f), October Survey
Figure 7
Edmonton’s apartment vacancy rate will rise over the next three years
per cent
6. 6Canada Mortgage and Housing Corporation
Housing Market Outlook - Edmonton CMA - Date Released - Fall 2015
growth, the pace of employment
growth in 2015, although positive, is
much lower than what had become
the norm. Countering fewer prospects
in the energy sector is Edmonton’s
construction sector. Elevated
construction in the multi-family sector
and increased work in Edmonton’s
new ICE District have become the
bright spots in the current economy.
This work is expected to support
employment over the next two years.
Although lower oil prices have
dampened growth in the energy
sector, employment growth in
Edmonton has continued, albeit as
at a slower pace.After eight months
of 2015, employment was up 1.2
per cent in the Edmonton CMA,
with the economy adding 8,800
new positions.The majority of these
positions were full-time positions,
accounting for 7,300 of the job gains.
The construction sector, supported
by strong gains in multi-family housing
starts, and the finance, insurance and
real estate sector posted the largest
employment gains, while the trade
sector posted the largest decline.
Employment growth is expected to
hold at 1.2 per cent for 2015. In 2016,
low oil prices will keep employment
growth modest, at 1.3 per cent.As the
pace of economic growth picks up in
2017, employment growth will rise to
1.7 per cent.
Modest job creation, together
with lower migration, has kept the
unemployment rate in the Edmonton
CMA relatively low.As of August 2015,
the seasonally adjusted unemployment
rate was 5.5 per cent.The rate
peaked in May at 6.3 per cent, but
has since fallen. Moving forward,
employment gains will be modest in
the remaining months of 2015 and
in 2016, putting upward pressure on
the unemployment rate. Even though
migration is expected to decline, the
labour force will expand at a faster
clip than job creation pushing the
unemployment rate up. By 2017, the
unemployment rate will move down
slightly as the pace of job growth
moves slightly higher. Overall, the
unemployment rate will average 5.8
per cent in 2015, 6.2 per cent in 2016
and 6.0 per cent in 2017,
After declining on a year-over-year
basis for the first four months of 2015,
growth in average weekly earnings
has returned.Through August, weekly
earnings averaged $1,087, up 1.7 per
cent from the same period of 2014.
The increase in earnings can be partly
attributed to the creation of more
full-time jobs than part-time jobs,
which put upward pressure on the
average.Wage growth is expected to
remain modest over the next two
-1%
0%
1%
2%
3%
4%
5%
6%
7%
2006 2007 2008 2009 2010 2011 2012 2013 2014 2015f 2016f 2017f
Source: Statistics Canada, CMHC Forecast (f)
Figure 8
Employment growth will slow but remain positive in the Edmonton CMA
0
5,000
10,000
15,000
20,000
25,000
30,000
35,000
40,000
2006 2007 2008 2009 2010 2011 2012 2013 2014 2015f 2016f 2017f
Source: Statistics Canada, July to June, CMHC Forecast (f)
Figure 9
Net migration in the Edmonton CMA will move lower in 2015 and 2016
employment growth year-over-year
net migration
7. 7Canada Mortgage and Housing Corporation
Housing Market Outlook - Edmonton CMA - Date Released - Fall 2015
years as a higher unemployment rate
reduces labour market pressures.
With fewer jobs being created this
year in Edmonton, migration will
continue to move lower. In 2014,
net migration to the Edmonton
CMA declined to 32,507. In
2015, migration will post a larger
pullback as the weaker economic
environment attracts fewer people
into the city. Migration is expected
to fall to 17,000 in 2015. Much of
the decline will be due to lower
numbers of non-permanent residents,
including temporary foreign workers,
coming into Edmonton; however,
interprovincial migration will also
decline. In 2016, migration will remain
close to its 2015 levels, at 16,000.
By 2017, slightly higher employment
growth and a lower unemployment
rate will lead to a small uptick in
migration, to 17,500.
Mortgage rates are
expected to begin to rise
moderately from current
levels late in 2016
Mortgage rates are expected to
continue trending close to current
levels, supporting housing demand.
However, consistent with the view
of Canadian economic forecasters,
CMHC expects interest rates to begin
to rise moderately from current levels
late in 2016, contributing to a modest
slowdown in housing markets.
According to CMHC’s base case
scenario for 2015, the one-year
mortgage rate is expected to be in the
2.60 to 3.30 per cent range, while the
five-year rate is forecast to be within
the 4.10 to 5.20 per cent range. For
2016, the one-year mortgage rate is
expected to be in the 3.00 to 3.80 per
cent range, while the five-year rate is
forecast to be within the 4.70 to 6.00
per cent range. For 2017, the one-year
mortgage rate is expected to be in the
3.90 to 4.80 per cent range, while the
five-year rate is forecast to be within
the 5.10 to 6.50 per cent range.
8. 8Canada Mortgage and Housing Corporation
Housing Market Outlook - Edmonton CMA - Date Released - Fall 2015
Forecast Risks
This outlook is subject to some risks,
including:
„„ The current forecast is contingent
on oil prices remaining at current
levels in 2015, and gradually
rising in the latter half of 2016
and into 2017. If prices remain at
current levels in the longer term,
the economy will take longer to
recover, and will grow at a slower
pace.
„„ The pace of construction in the
multi-family market has been
elevated in 2015. If the pace
does not slow as anticipated, the
multi-family market is at risk of
overbuilding.This could lead to
downward price pressures and
higher inventory in both the
ownership and rental market.
Employment Employment growth will be slower in 2015 leading to a moderation in
housing demand.
Income Earnings growth has been supported by full-time job growth in recent
months. However, a higher unemployment rate will ease income
growth and slow the pace of housing demand.
Population Migration to Edmonton will moderate through to 2016, and post a
small increase in 2017. This will slow the rate of growth in demand
for housing in both the rental and ownership market.
Resale Market A well-supplied market will continue to provide more competition to
the new home market in the remaining months of 2015 and in 2016.
New Home Inventory Inventory has begun to increase in the single-detached market, and is
expected to rise on the multi-family market in the coming months.
This will prompt builders to slow production in both markets.
Key Factors and their Effects on Housing Starts
Mortgage Rates Mortgage rates will begin to rise gradually late in 2016, contributing to
moderation in housing demand.
Trends at a Glance
9. 9Canada Mortgage and Housing Corporation
Housing Market Outlook - Edmonton CMA - Date Released - Fall 2015
Forecast Summary
Edmonton CMA
Fall 2015
2012 2013 2014 2015(F) % chg 2016(F) % chg 2017(F) % chg
New Home Market
Starts:
Single-Detached 5,658 5,970 6,832 5,900 -13.6 5,600 -5.1 5,800 3.6
Multiples 7,179 8,719 7,040 10,500 49.1 5,500 -47.6 5,000 -9.1
Starts - Total 12,837 14,689 13,872 16,400 18.2 11,100 -32.3 10,800 -2.7
Average Price ($):
Single-Detached 514,259 529,824 568,676 600,000 5.5 609,000 1.5 621,000 2.0
Median Price ($):
Single-Detached 460,000 461,300 496,051 530,000 6.8 539,000 1.7 549,000 1.9
New Housing Price Index (% chg.) 0.9 0.4 0.1 0.3 - 1.4 - 1.7 -
Resale Market
MLS®
Sales 17,641 19,552 19,857 17,500 -11.9 17,800 1.7 18,300 2.8
MLS®
New Listings 31,410 30,011 31,315 34,200 9.2 33,500 -2.0 32,000 -4.5
MLS®
Active Listings 5,636 5,397 4,873 6,100 25.2 5,800 -4.9 5,500 -5.2
MLS®
Average Price ($) 334,318 344,977 362,657 363,000 0.1 366,000 0.8 374,000 2.2
Rental Market
October Vacancy Rate (%) 1.7 1.4 1.7 3.0 1.3 3.5 0.5 3.7 0.2
Two-bedroom Average Rent (October) ($) 1,071 1,141 1,227 1,265 3.1 1,295 2.4 1,320 1.9
Economic Overview
Mortgage Rate (1 year) (%) 3.17 3.08 3.14 2.60 to 3.30 - 3.00 to 3.80 - 3.90 to 4.80 -
Mortgage Rate (5 year) (%) 5.27 5.24 4.88 4.10 to 5.20 - 4.70 to 6.00 - 5.10 to 6.50 -
Annual Employment Level 706,400 728,100 744,800 754,000 1.2 764,000 1.3 777,000 1.7
Employment Growth (%) 4.0 3.1 2.3 1.2 - 1.3 - 1.7 -
Unemployment rate (%) 4.7 4.8 5.1 5.8 - 6.2 - 6.0 -
Net Migration (1)
26,541 34,436 32,507 17,000 -47.7 16,000 -5.9 17,500 9.4
MLS
®
is a registered trademark of the Canadian Real Estate Association (CREA).
Source: CMHC (Starts and Completions Survey, Market Absorption Survey), adapted from Statistics Canada (CANSIM), CREA, Statistics Canada (CANSIM)
NOTE: Rental universe = Privately initiated rental apartment structures of three units and over
The forecasts included in this document are based on information available as of September 28, 2015.
10. 10Canada Mortgage and Housing Corporation
Housing Market Outlook - Edmonton CMA - Date Released - Fall 2015
DEFINITIONS AND Methodology
New Home Market
Historical home starts numbers are collected through CMHC’s monthly Starts and Completions Survey. Building permits
are used to determine construction sites and visits confirm construction stages. A start is defined as the beginning of
construction on a building, usually when the concrete has been poured for the whole of the structure’s footing, or an
equivalent stage where a basement will not be part of the structure.
Single-Detached Start:
The start of a building containing only one dwelling unit, which is completely separated on all sides from any other dwelling or
structure.
Semi-Detached Start:
The start of each of the dwellings in a building containing two dwellings located side-by-side, adjoining no other structure and
separated by a common or party wall extending from ground to roof.
Row (or Townhouse) Start:
Refers to the commencement of construction on a dwelling unit in a row of three or more attached dwellings separated by a
common or party wall extending from ground to roof.
Apartment and other Starts:
Refers to the commencement of construction on all dwellings other than those described above, including structures
commonly known as stacked townhouses, duplexes, triplexes, double duplexes and row duplexes.
Average and Median Single Detached Home Prices:
Are estimated using CMHC’s Market Absorption Survey, which collects home prices at absorption and measures the rate
at which units are sold or rented after they are completed. Dwellings are enumerated each month after a structure is
completed until full absorption occurs. The term “absorbed” means that a housing unit is no longer on the market as it has
been sold or rented.
New Home Price Indexes:
Changes in the New Home Price Indexes are estimated using annual averages of Statistics Canada’s monthly values for New
Housing Price Indexes (NHPI).
Resale Market
Historical resale market data in the summary tables of the Housing Market Outlook Reports refers to residential transactions
through the Multiple Listings Services (MLS®
) as reported by The Canadian Real Estate Association (CREA). In Quebec, this
data is obtained by the Centris®
listing system via the Quebec Federation of Real Estate Boards.
MLS®
(Centris®
in the province of Quebec) Sales:
Refers to the total number of sales made through the Multiple Listings Services in a particular year.
MLS®
(Centris®
in the province of Quebec) Average Price:
Refers to the average annual price of residential transactions through the Multiple Listings Services.
11. 11Canada Mortgage and Housing Corporation
Housing Market Outlook - Edmonton CMA - Date Released - Fall 2015
Rental Market
Rental Market vacancy rates and two bedroom rents information is from Canada Mortgage and Housing Corporation’s
(CMHC’s) October Rental Market Survey (RMS). Conducted on a sample basis in all urban areas with populations of
10,000 and more, the RMS targets privately initiated structures with at least three rental units, which. have been on the
market for at least three months. The survey obtains information from owners, managers, or building superintendents
through a combination of telephone interviews and site visits.
Vacancy Rate:
The vacancy rate refers to the average vacancy rate of all apartment bedroom types. A unit is considered vacant if, at the time
of the survey, it is physically unoccupied and available for immediate rental.
Two Bedroom Rent:
The rent refers to the average of the actual amount tenants pay for two bedroom apartment units. No adjustments are made
for the inclusion or exclusion of amenities and services such as heat, hydro, parking, and hot water.
Economic Overview
Labour Force variables include the Annual Employment Level, Employment Growth, Unemployment Rate. Source: Statistics
Canada’s Labour Force Survey.
Net Migration:
Sum of net interprovincial (between provinces), net intra-provincial (within provinces), net international (immigration less
emigration), returning Canadians and temporary (non-permanent) residents as provided to the CANSIM database by Statistics
Canada’s Demography Division. Sources of inter-provincial and intra-provincial migration data include a comparison of
addresses from individual income tax returns for two consecutive years from Canada Revenue Agency (CRA) taxation
records. The migration estimates are modelled, with the tax file results weighted to represent the whole population.
13. CMHC’s Market Analysis Centre
e-reports provide a wealth of
detailed local, provincial, regional
and national market information.
Forecasts and Analysis –
Future-oriented information
about local, regional and
national housing trends.
Statistics and Data –
Information on current
housing market activities –
starts, rents, vacancy rates
and much more.
FREE REPORTS AVAILABLE ON-LINE
n Canadian Housing Statistics
n Condominium Owners Report
n Housing Information Monthly
n Housing Market Outlook, Canada
n Housing Market Outlook, Highlight Reports – Canada and Regional
n Housing Market Outlook, Major Centres
n Housing MarketTables: Selected South Central Ontario Centres
n Housing Now, Canada
n Housing Now, Major Centres
n Housing Now, Regional
n Monthly Housing Statistics
n Northern Housing Outlook Report
n Preliminary Housing Start Data
n Rental Market Provincial Highlight Reports
n Rental Market Reports, Major Centres
n Rental Market Statistics
n Residential Construction Digest, Prairie Centres
n Seniors’ Housing Reports
Get the market intelligence you need today!
Click www.cmhc.ca/housingmarketinformation
to view, download or subscribe.
Housing market
intelligence
you can count on
Quick and
easy access.
Information in one
central location.
The housing data you want, the way you want it
HOUSING MARKET
INFORMATION PORTAL
Neighbourhood
level data.
cmhc.ca/hmiportal
64343_2015_B02