1. Determinants of response/non-response to dietary
fat interventions on biomarkers of insulin resistance
I de Stanlaigh, A.M Murphy, Prof.HM Roche
Nutrigenomics Research Group, UCD Conway Institute for Biomolecular and Biomedical Sciences / UCD Institute of Food and Health,
School of Public Health, Physiotherapy and Sports Science, University College Dublin, Belfield, Dublin 4.
Observational studies have indicated associations between dietary fat intake
and the development of insulin resistance.
Intervention studies however, have concluded mixed results and
demonstrated variability in cohort response.
This variability allows for investigation into phenotypes more responsive to
dietary fat interventions ➔ more personalised and effective treatments
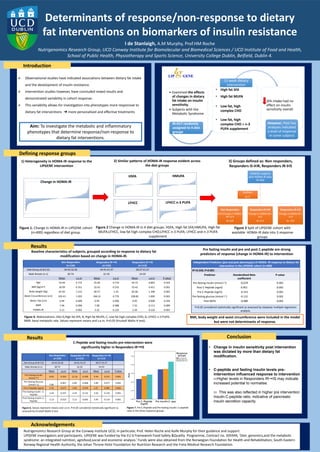
1) Heterogeneity in HOMA-IR response to the
LIPGENE intervention
Figure 1. Change in HOMA-IR in LIPGENE cohort
(n=400) regardless of diet group.
Change in HOMA-IR
2) Similar patterns of HOMA-IR response evident across
the diet groups
Figure 2 Change in HOMA-IR in 4 diet groups: HSFA, High fat SFA;HMUFA, High fat
MUFA;LFHCC, low fat high complex CHO;LFHCC n-3 PUFA, LFHCC and n-3 PUFA
supplement
Introduction
Aim: To investigate the metabolic and inflammatory
phenotypes that determine response/non-response to
dietary fat interventions.
• Change in insulin sensitivity post intervention
was dictated by more than dietary fat
modification.
• C-peptide and fasting insulin levels pre-
intervention influenced response to intervention
⇰Higher levels in Responders IR➞IS may indicate
increased potential to normalise.
⇰ This was also reflected in higher pre intervention
Insulin:C-peptide ratio, indicative of pancreatic
insulin secretion capacity.
Results
• Examined the effects
of changes in dietary
fat intake on insulin
sensitivity.
• Subjects with the
Metabolic Syndrome
N=417 randomly
assigned to 4 diet
groups
12 week dietary
intervention
SFA intake had no
effect on insulin
sensitivity overall.
However, Post hoc
analyses indicated
a level of response
in some subjects
Results
Defining response groups
Conclusion
• High fat SFA
• High fat MUFA
• Low fat, high
complex CHO
• Low fat, high
complex CHO + n-3
PUFA supplement
3) Groups defined as: Non responders,
Responders IS→IR, Responders IR→IS
Figure 3 Split of LIPGENE cohort with
available HOMA-IR data into 3 response
groups
Pre fasting insulin and pre and post C-peptide are strong
predictors of response (change in HOMA-IR) to intervention
Acknowledgements
Nutrigenomics Research Group at the Conway Institute UCD; in particular, Prof. Helen Roche and Aoife Murphy for their guidance and support.
LIPGENE investigators and participants. LIPGENE was funded by the EU 6 Framework Food Safety &Quality Programme, Contract no. 505944, ‘Diet, genomics,and the metabolic
syndrome: an integrated nutrition, agrofood,social and economic analysis.’ Funds were also obtained from the Norwegian Foundation for Health and Rehabilitation, South-Eastern
Norway Regional Health Authority, the Johan Throne Holst Foundation for Nutrition Research and the Freia Medical Research Foundation.
HSFA HMUFA
LFHCC LFHCC n-3 PUFA
Independent Predictors (pre and post phenotypic) of HOMA- IR response to dietary fat
intervention in the LIPGENE cohort (n=400)
R2=0.550, P=0.001
Predictor Standardised Beta
coeffecient
P-value
Pre fasting insulin (mmol l-1) -0.679 0.001
Post C-Peptide (ngml) 0.951 0.001
Pre C-Peptide (ngml) -0.315 0.001
Pre fasting glucose (mmol l-1) -0.131 0.001
Post NEFA -0.080 0.001
P<0.05 considered statistically significant as assessed by stepwise multiple regression
analysis.
Non Responders
(n=134)
Responders IR➞IS
(n=153)
Responders IS➞IR
(n=113)
Diet Group (A:B:C:D) 34:42:32:26 34:41:41:37 28:27:31:27
Male female (n:n) 60:74 61:92 54:59
Mean s.e.m Mean s.e.m Mean s.e.m P value
Age 54.94 0.772 55.00 0.710 54.73 0.892 0.933
BMI (kg/m2) 30.99 0.351 32.62 0.332 33.42 0.411 0.001
Body weight (Kg) 87.92 1.212 90.77 1.10 95.06 1.348 0.001
Waist Circumference (cm) 103.41 1.033 106.31 0.776 108.82 1.000 0.001
Waist: Hip (cm) 0.94 0.009 0.95 0.006 0.95 0.008 0.264
BMR 7.04 0.098 7.08 0.088 7.32 0.113 0.089
HOMA-IR 2.11 0.092 3.32 0.132 2.50 0.156 0.001
Figure 4. Abbreviations: Diet A,High fat SFA; B, High fat MUFA; C, Low fat high complex CHO; D, LFHCC n-3 PUFA;
BMR, basal metabolic rate. Values represent means and s.e.m. P<0.05 (Kruskall Wallis H test).
Baseline characteristics of subjects, grouped according to response to dietary fat
modification based on change in HOMA-IR.
BMI, body weight and waist circumference were included in the model
but were not determinants of response.
LIPGENE subjects
with HOMA-IR data
N=400
Non Responders
0.4>Change in HOMA-
IR>-0.4
N=134
Responders IS→IR
Change in HOMA-IR >
0.4
N=113
Responders IR→IS
Change in HOMA-IR <
-0.4
N= 153
Outliers
N=7
Non Responders
(n=134)
Responders IR➞IS
(n=153)
Responders IS➞IR
(n=113)
Diet Group (A:B:C:D) 34:42:32:26 34:41:41:37 28:27:31:27
Male female (n:n) 60:74 61:92 54:59
Mean s.e.m Mean s.e.m Mean s.e.m P value
Pre Fasting Insulin
(mmol l-1
)
8.03 0.334 12.16 0.439 9.44 0.521 0.001
Pre Fasting Glucose
(mmol l-1) 5.86
0.067 6.09 0.068 5.89 0.077 0.001
Pre C-Peptide (ngml) 2.33 0.072 2.84 0.070 2.67 0.085 0.001
Pre Fasting Insulin : C-
Peptide
3.44 0.107 4.34 0.132 3.50 0.154 0.001
Post Fasting Insulin: C-
Peptide
3.13 0.010 3.12 0.092 3.95 0.110 0.001
C-Peptide and fasting insulin pre intervention were
significantly higher in Responders IR➞IS
Figure 6. Values represent means and s.e.m. P<0.05 considered statistically significant as
assessed by Kruskall Wallis H test
Figure 7. Pre C-Peptide and Pre fasting insulin: C-peptide
ratio in the three response groups