


![©2015 Azul Systems, Inc.
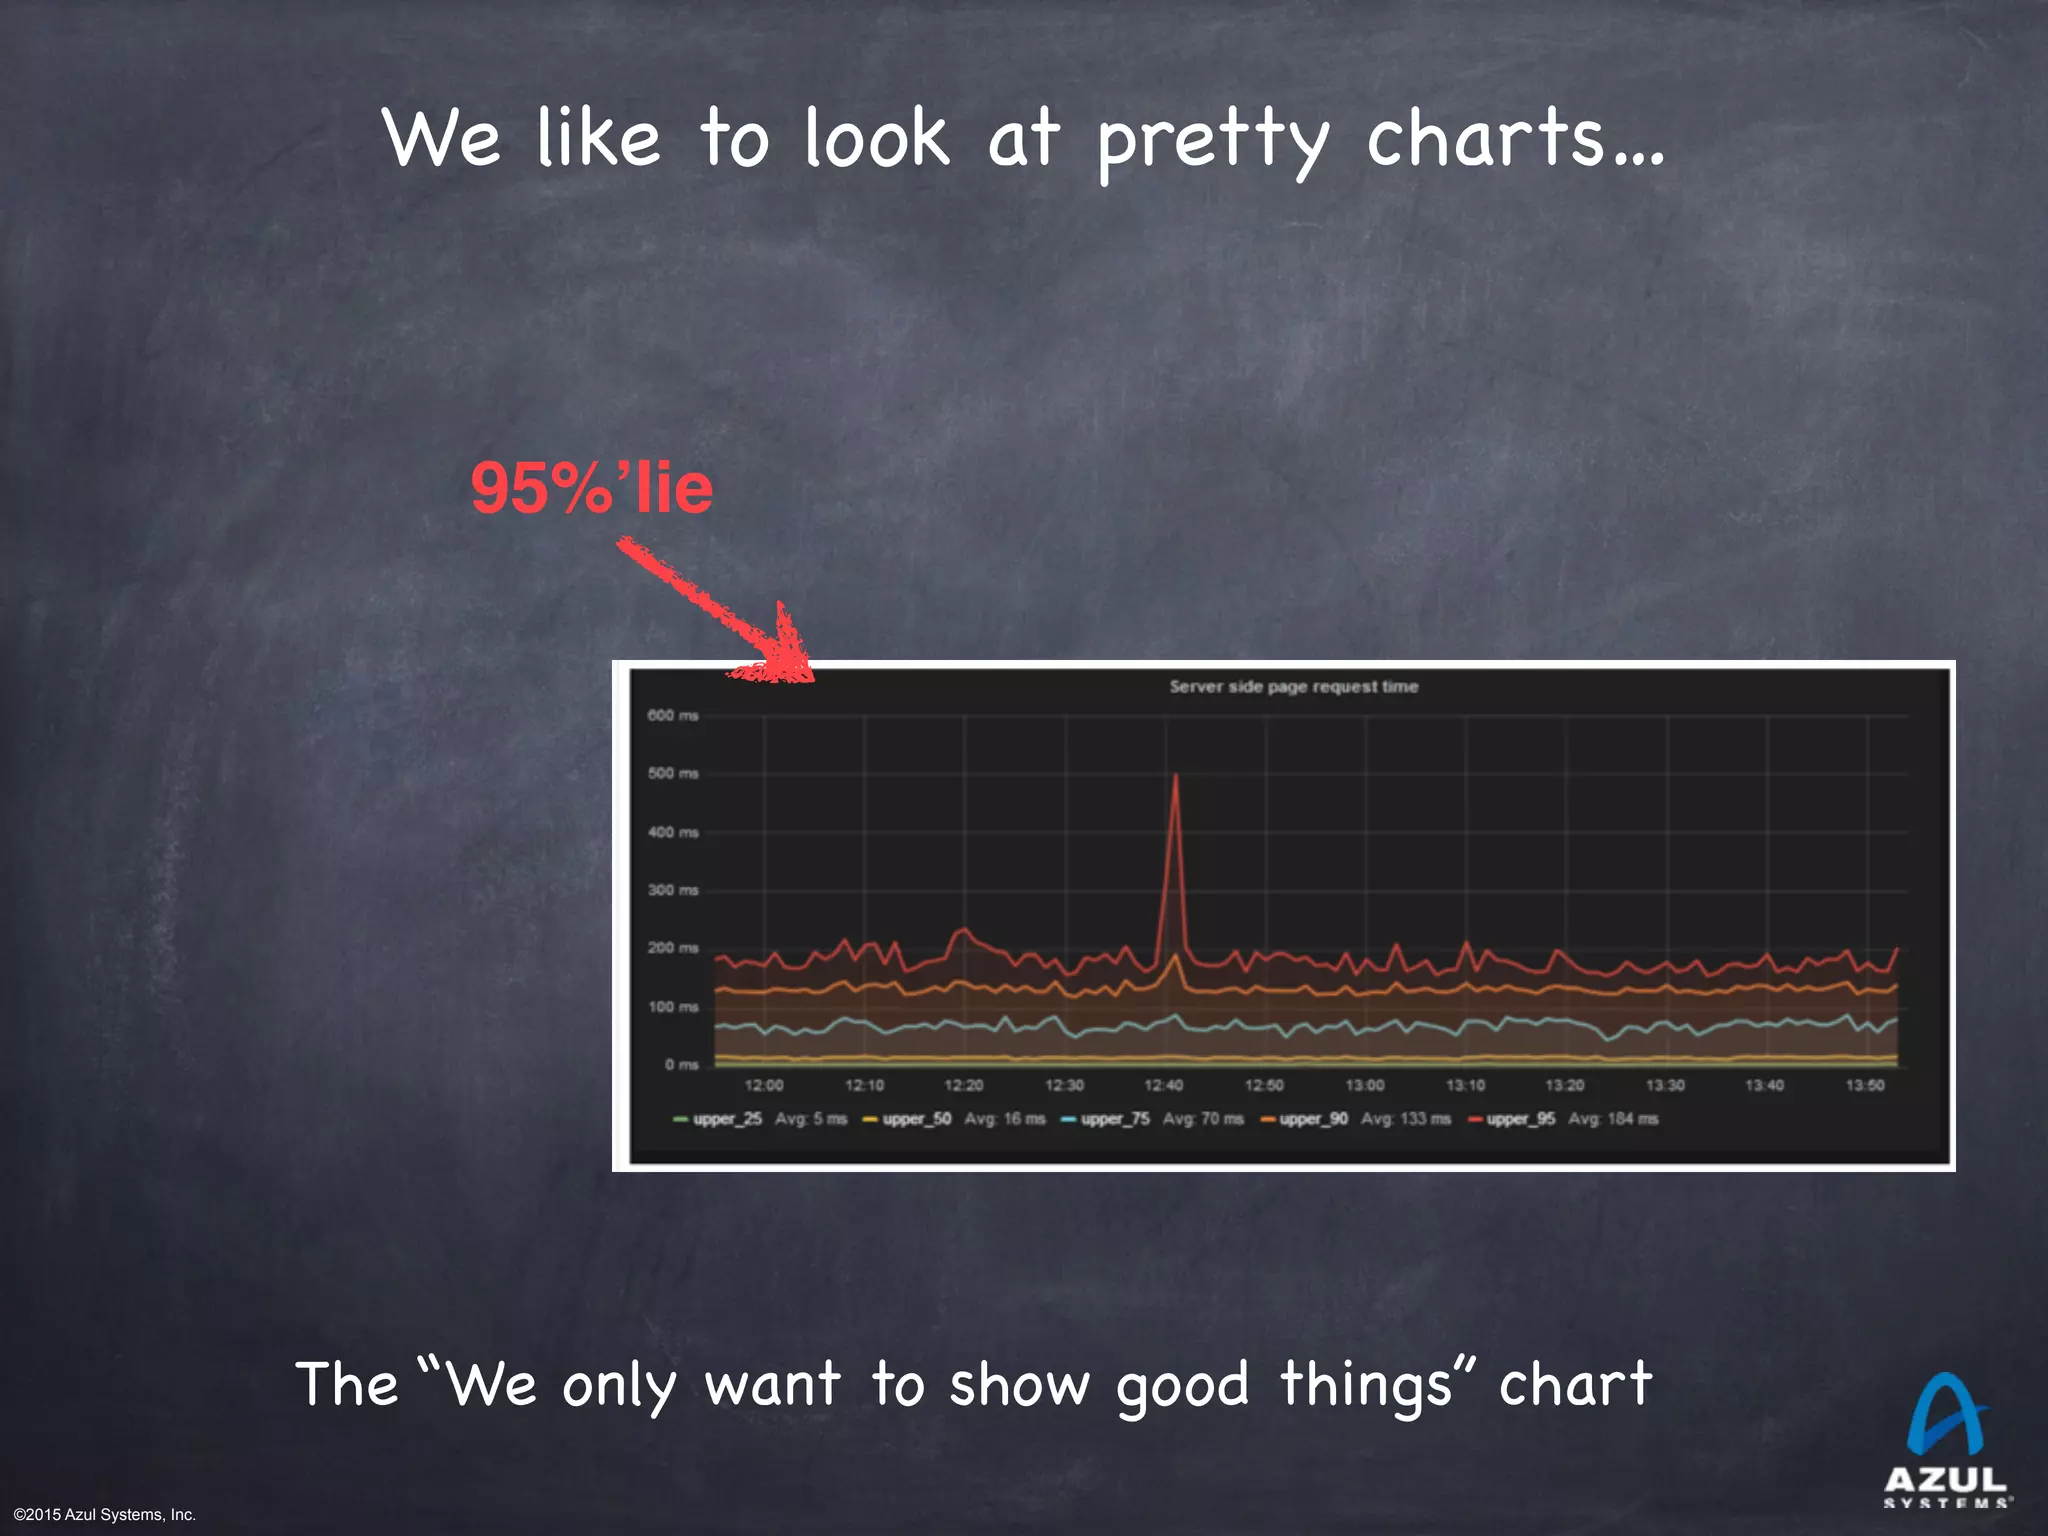
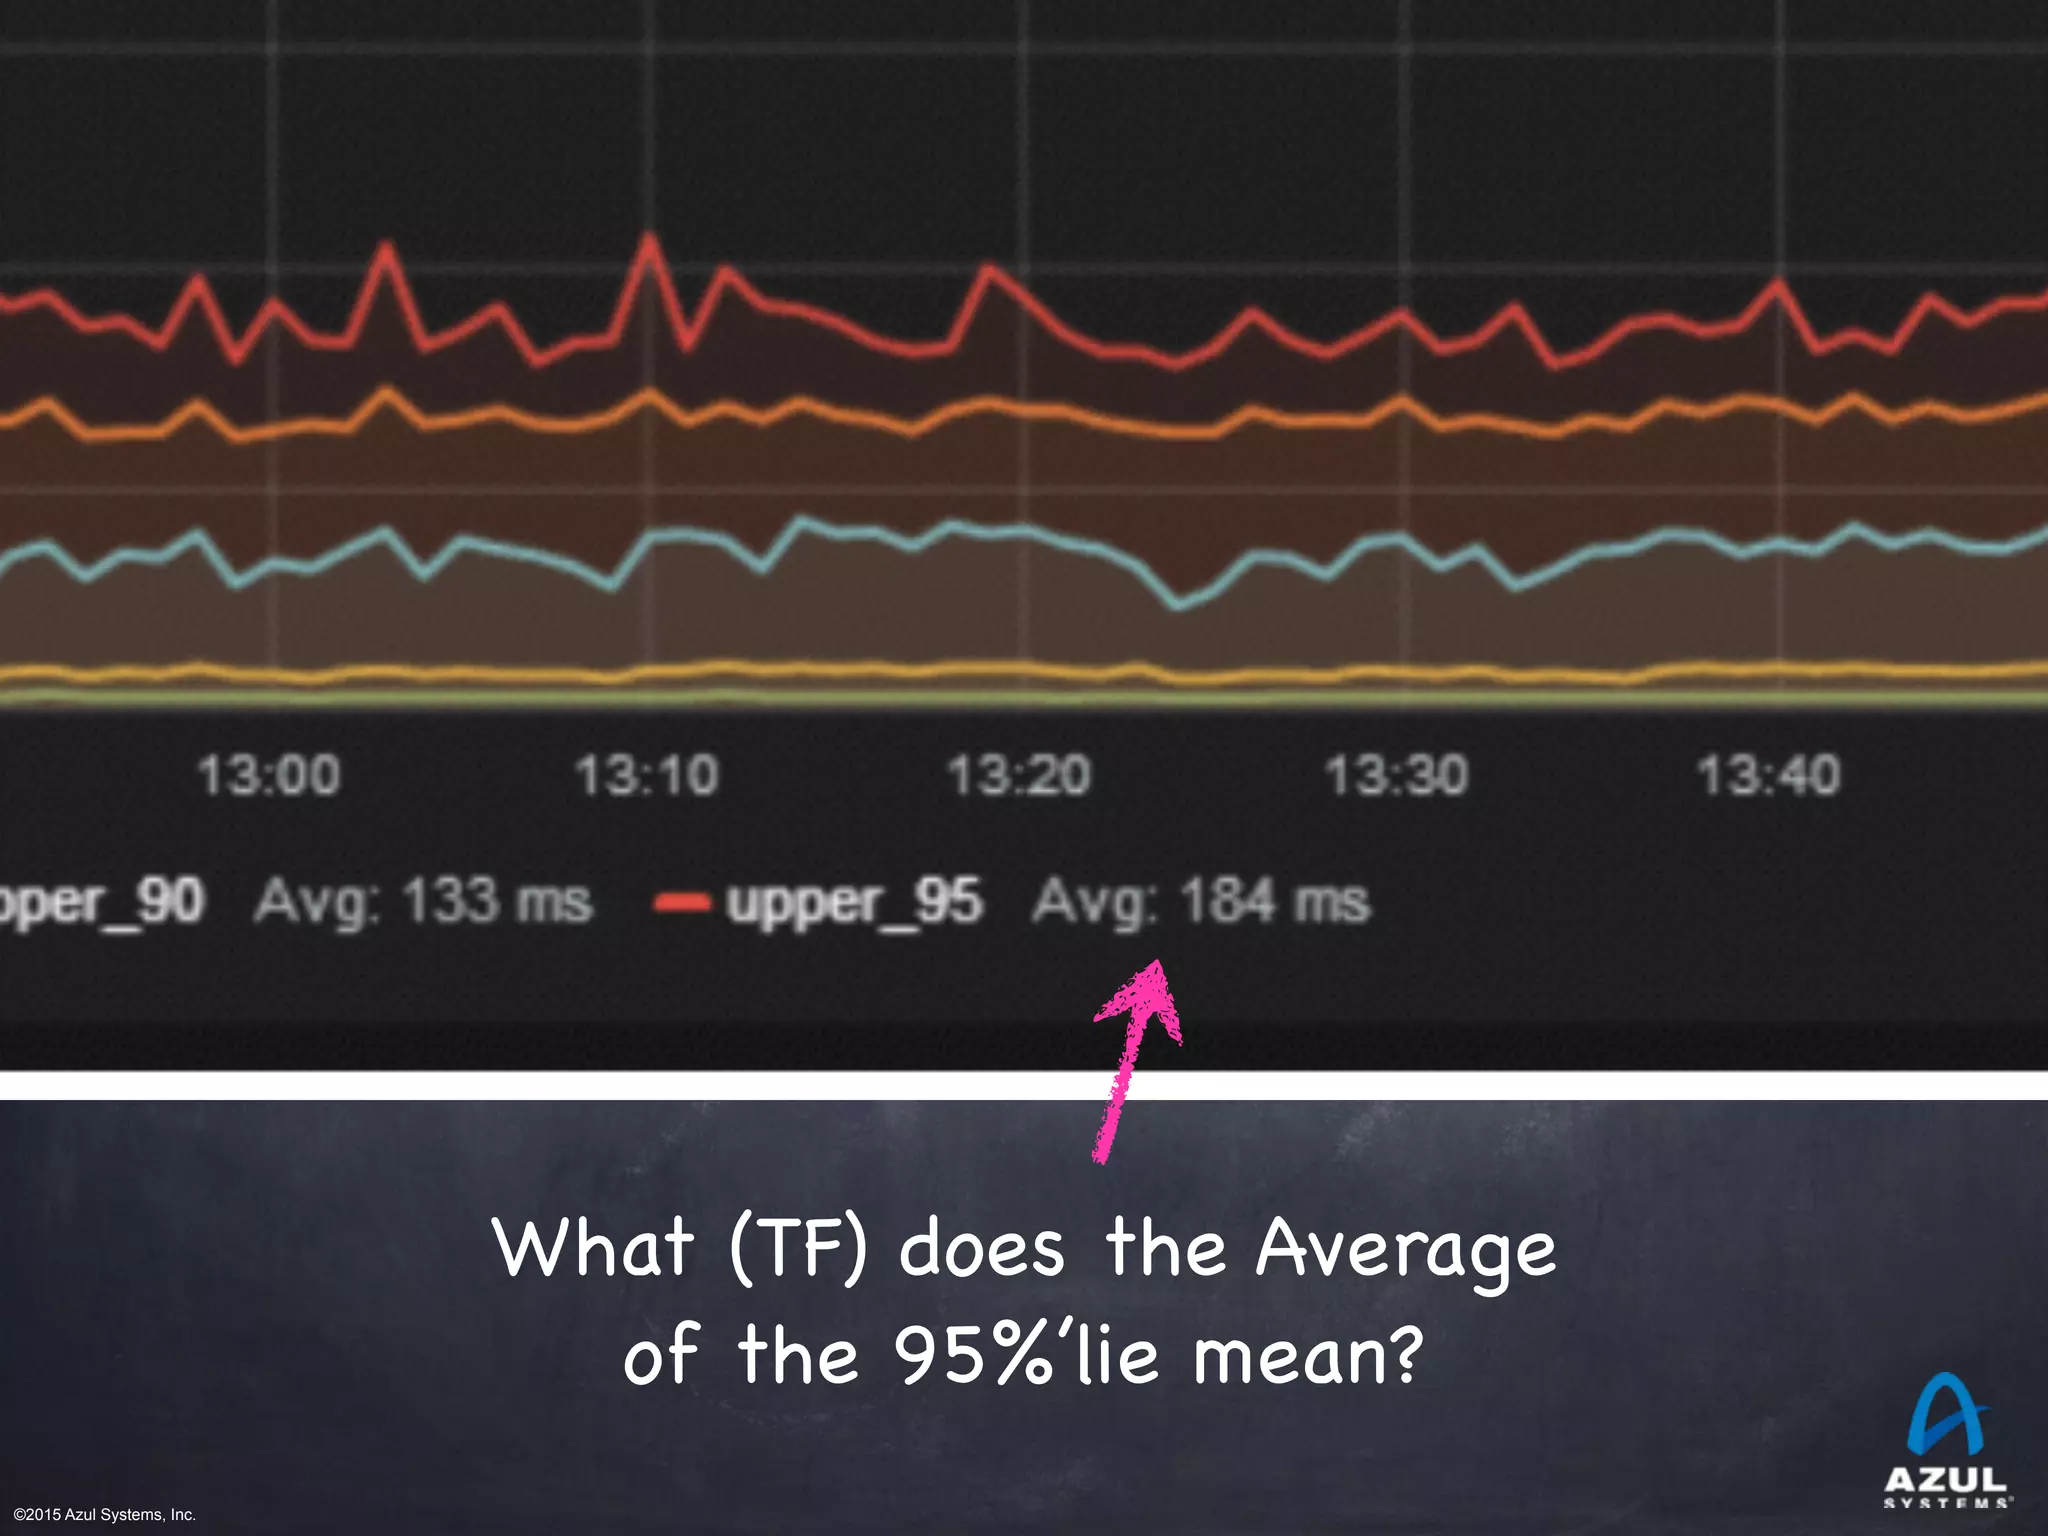
What (TF) does the Average
of the 95%’lie mean?
Lets do the same with 100%’ile; Suppose we a set of
100%’ile values for each minute:
[1, 0, 3, 1, 601, 4, 2, 8, 0, 3, 3, 1, 1, 0, 2]
“The average 100%’ile over the past 15 minutes was 42”
Same nonsense applies to any other %’lie](https://image.slidesharecdn.com/untitled-160328112522/75/How-NOT-to-Measure-Latency-18-2048.jpg)
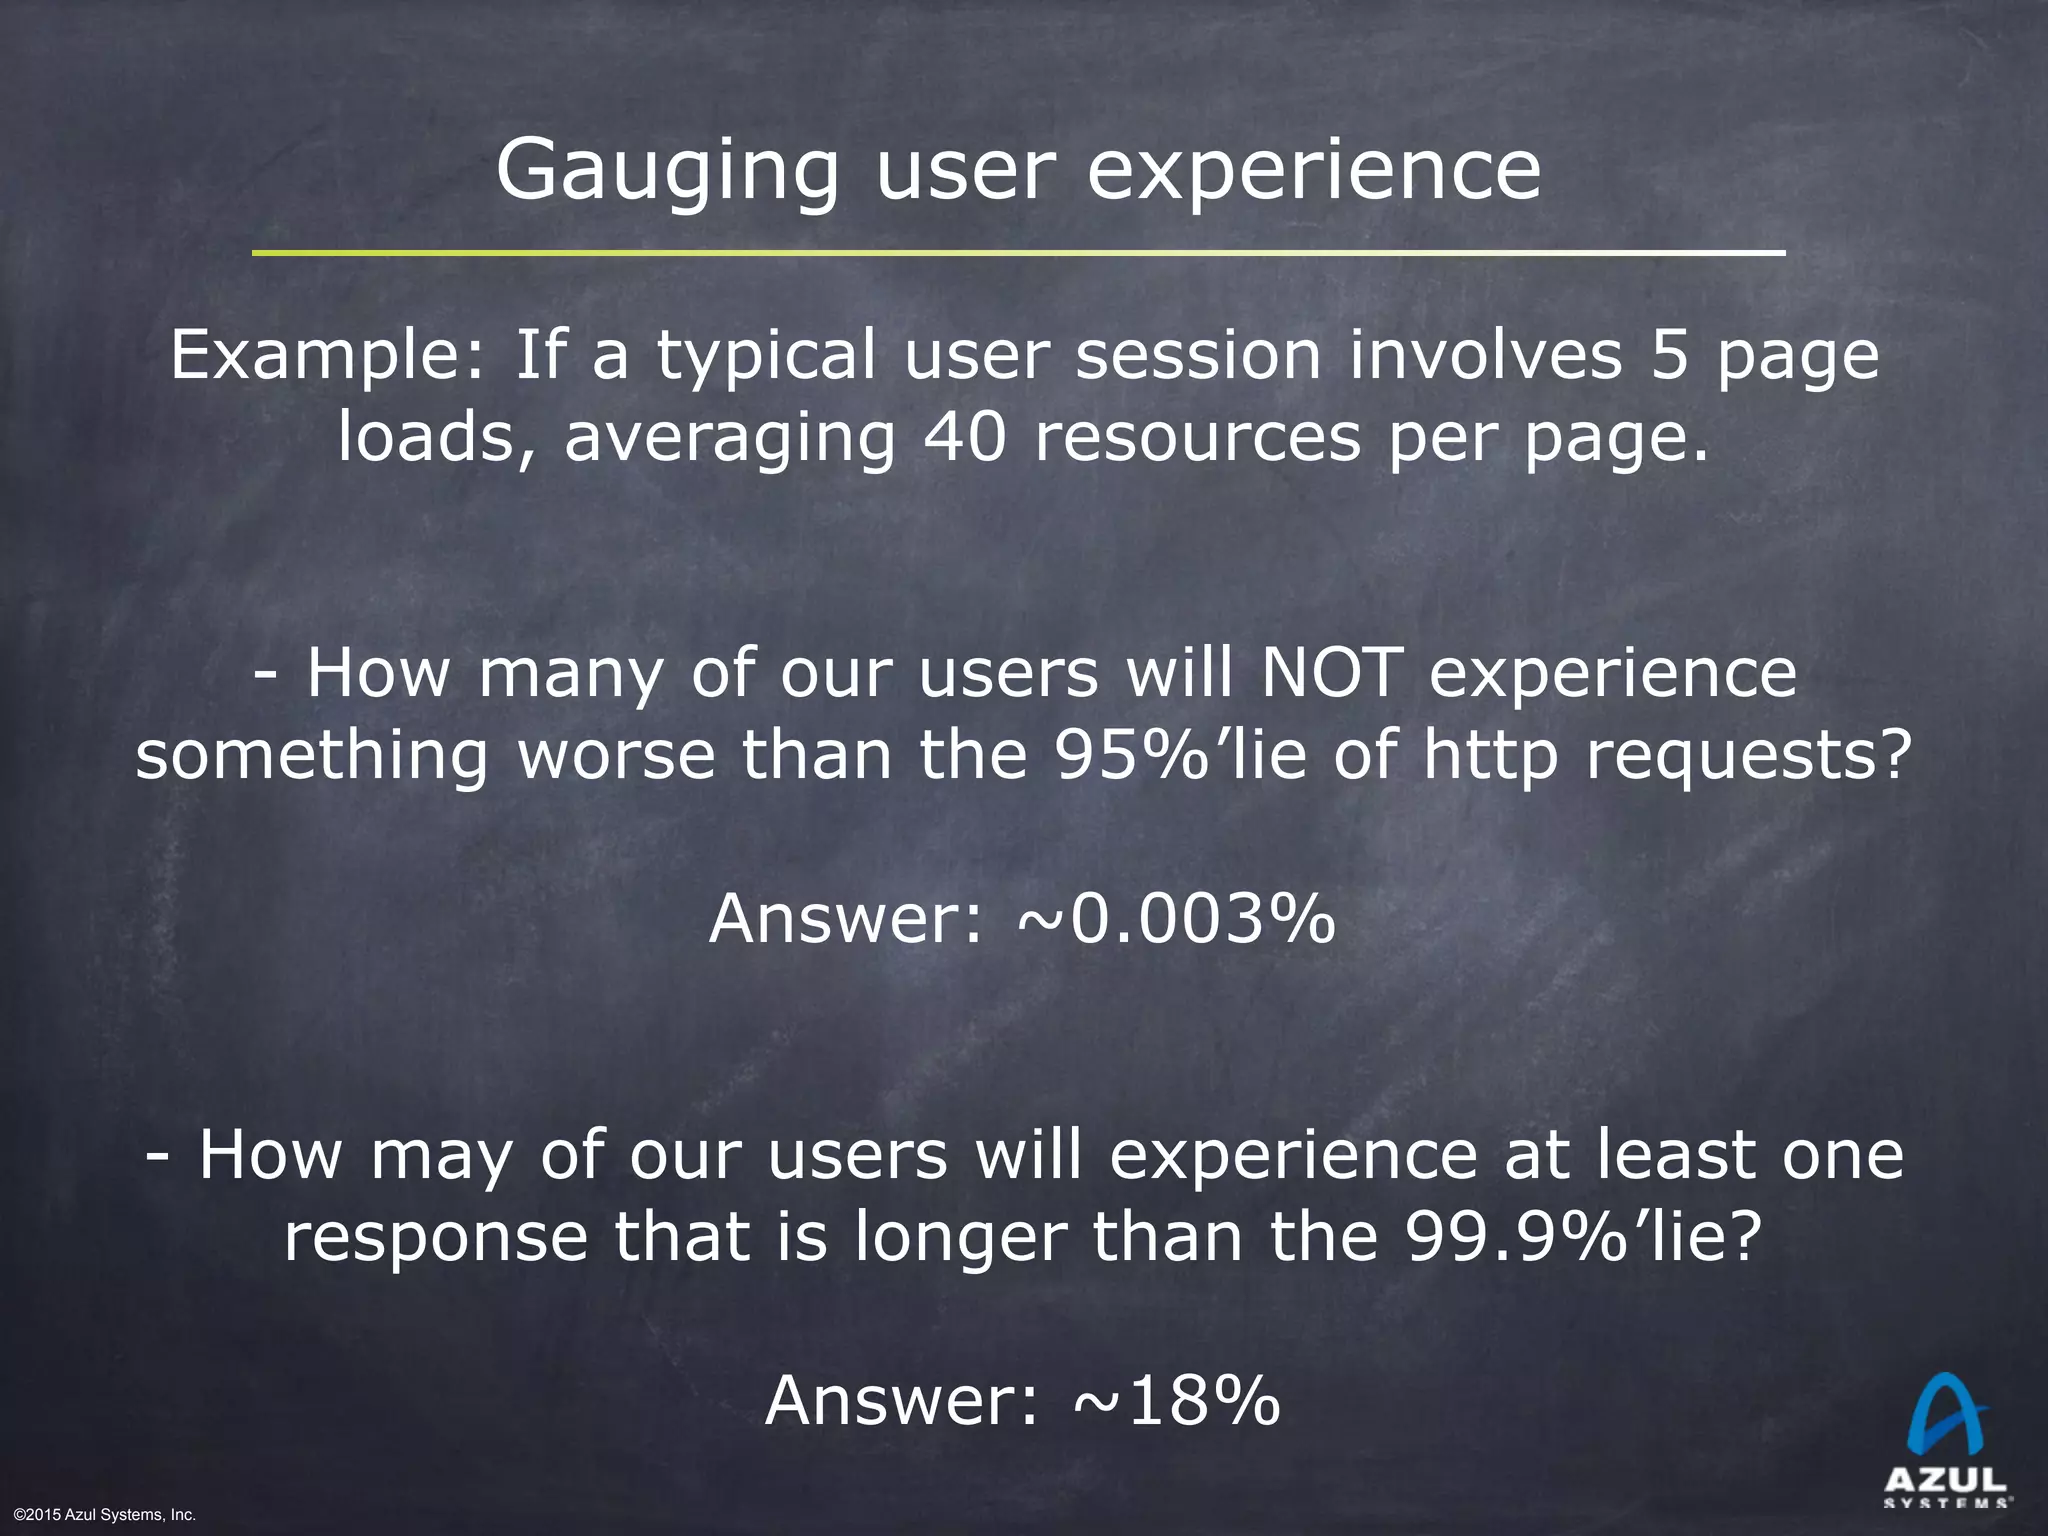
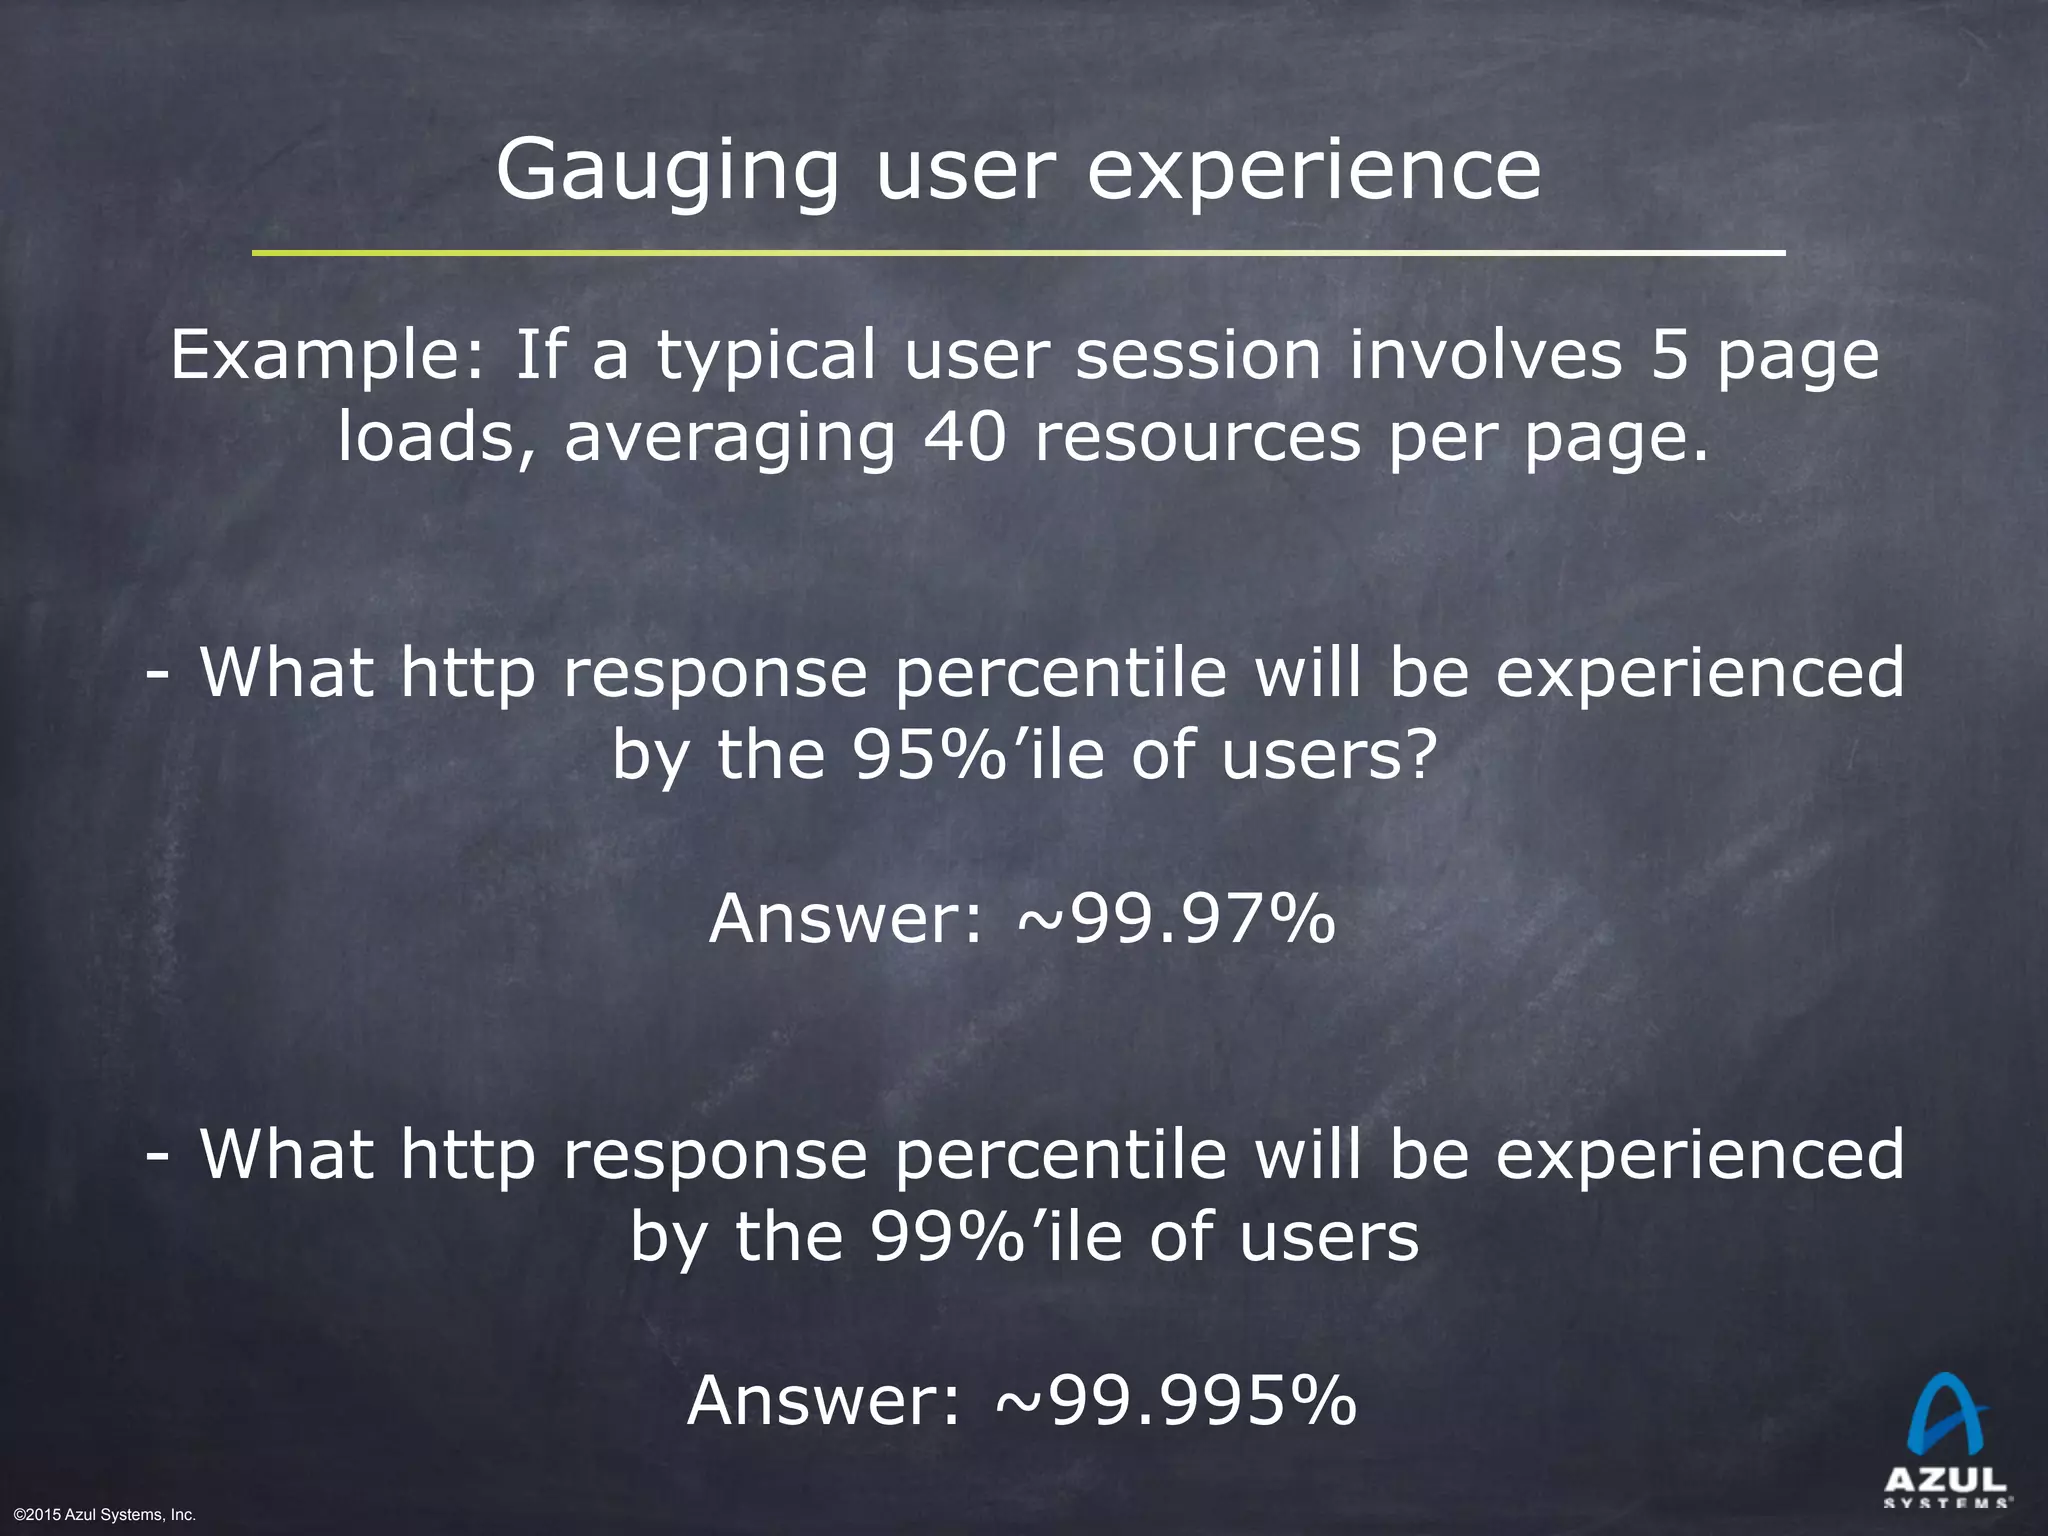
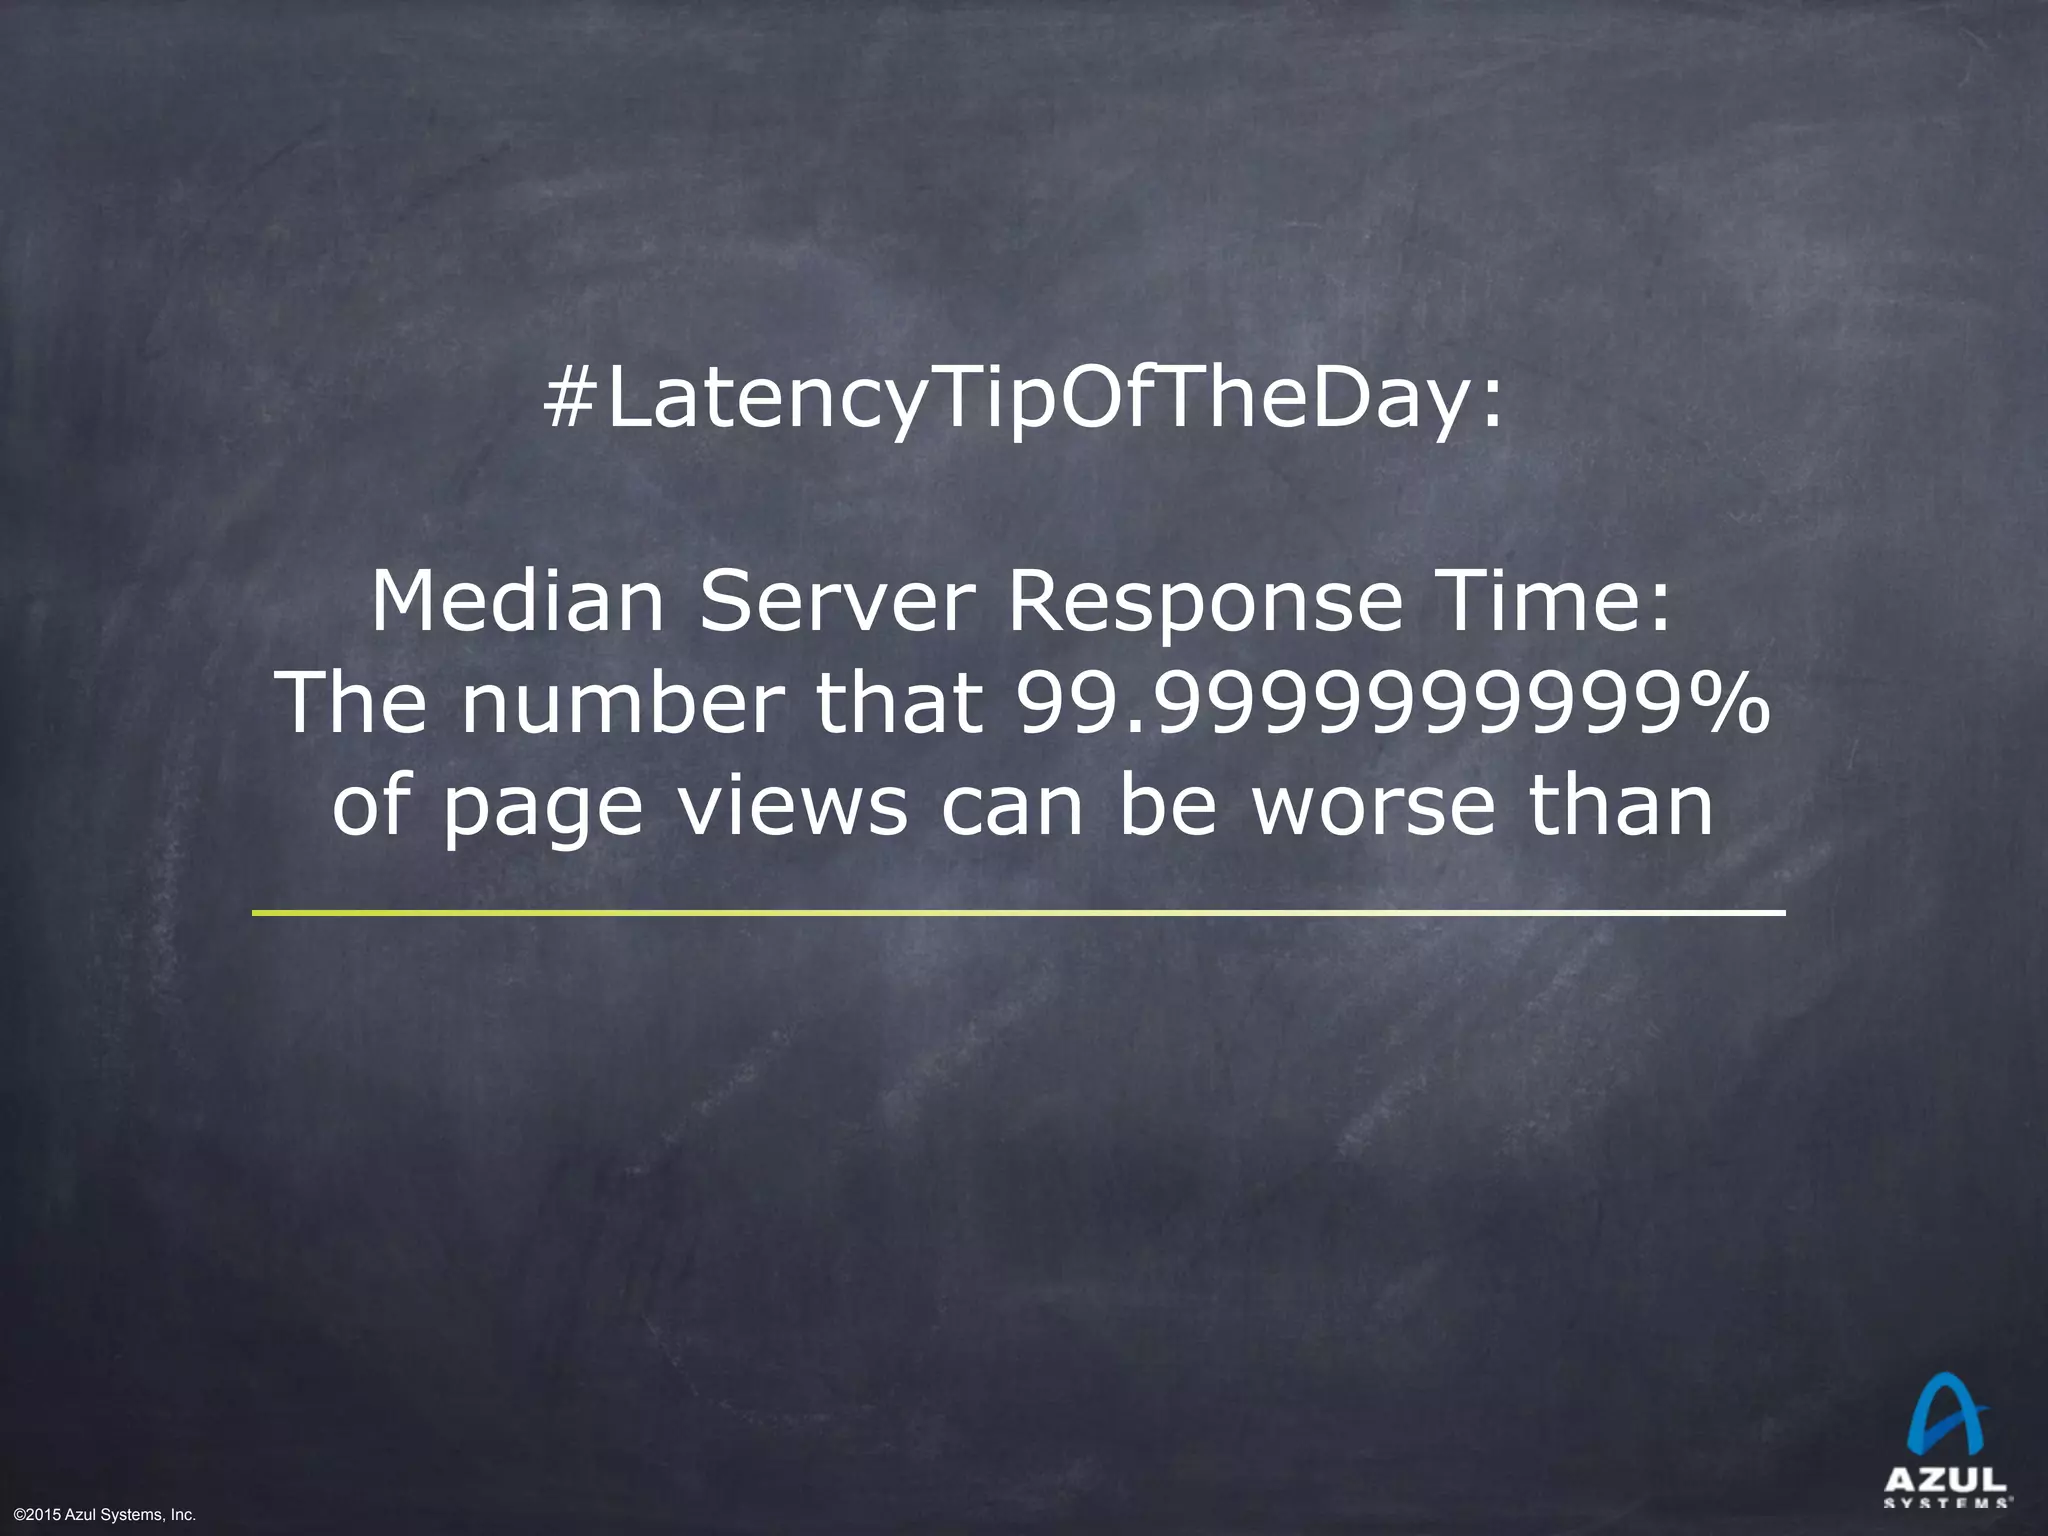
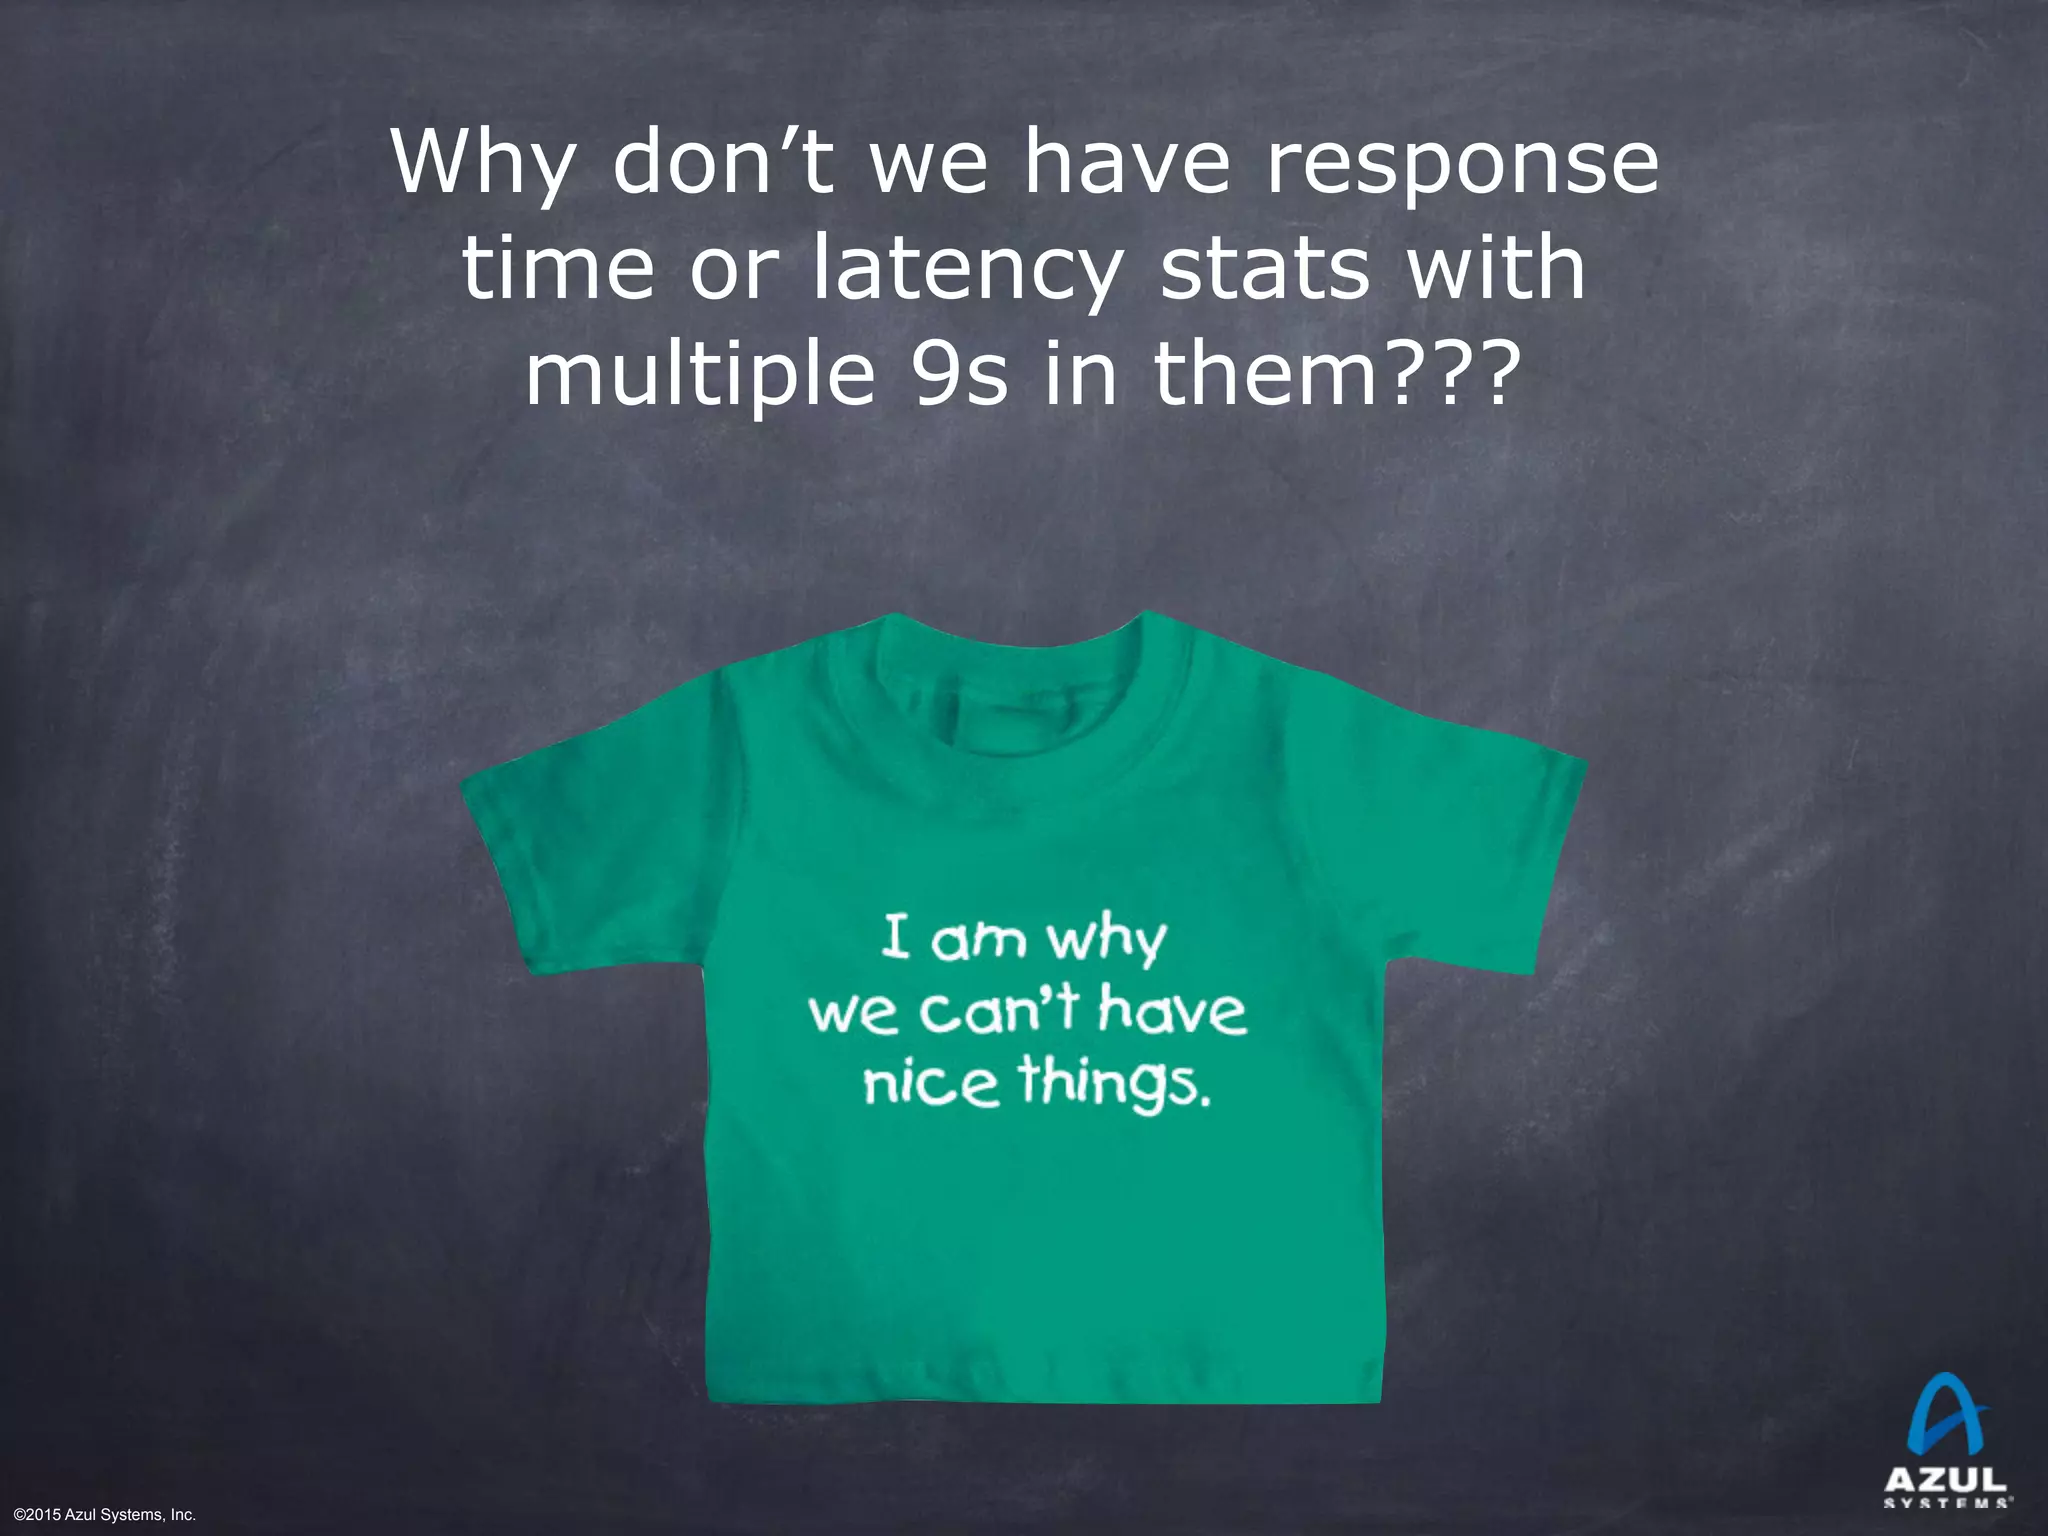
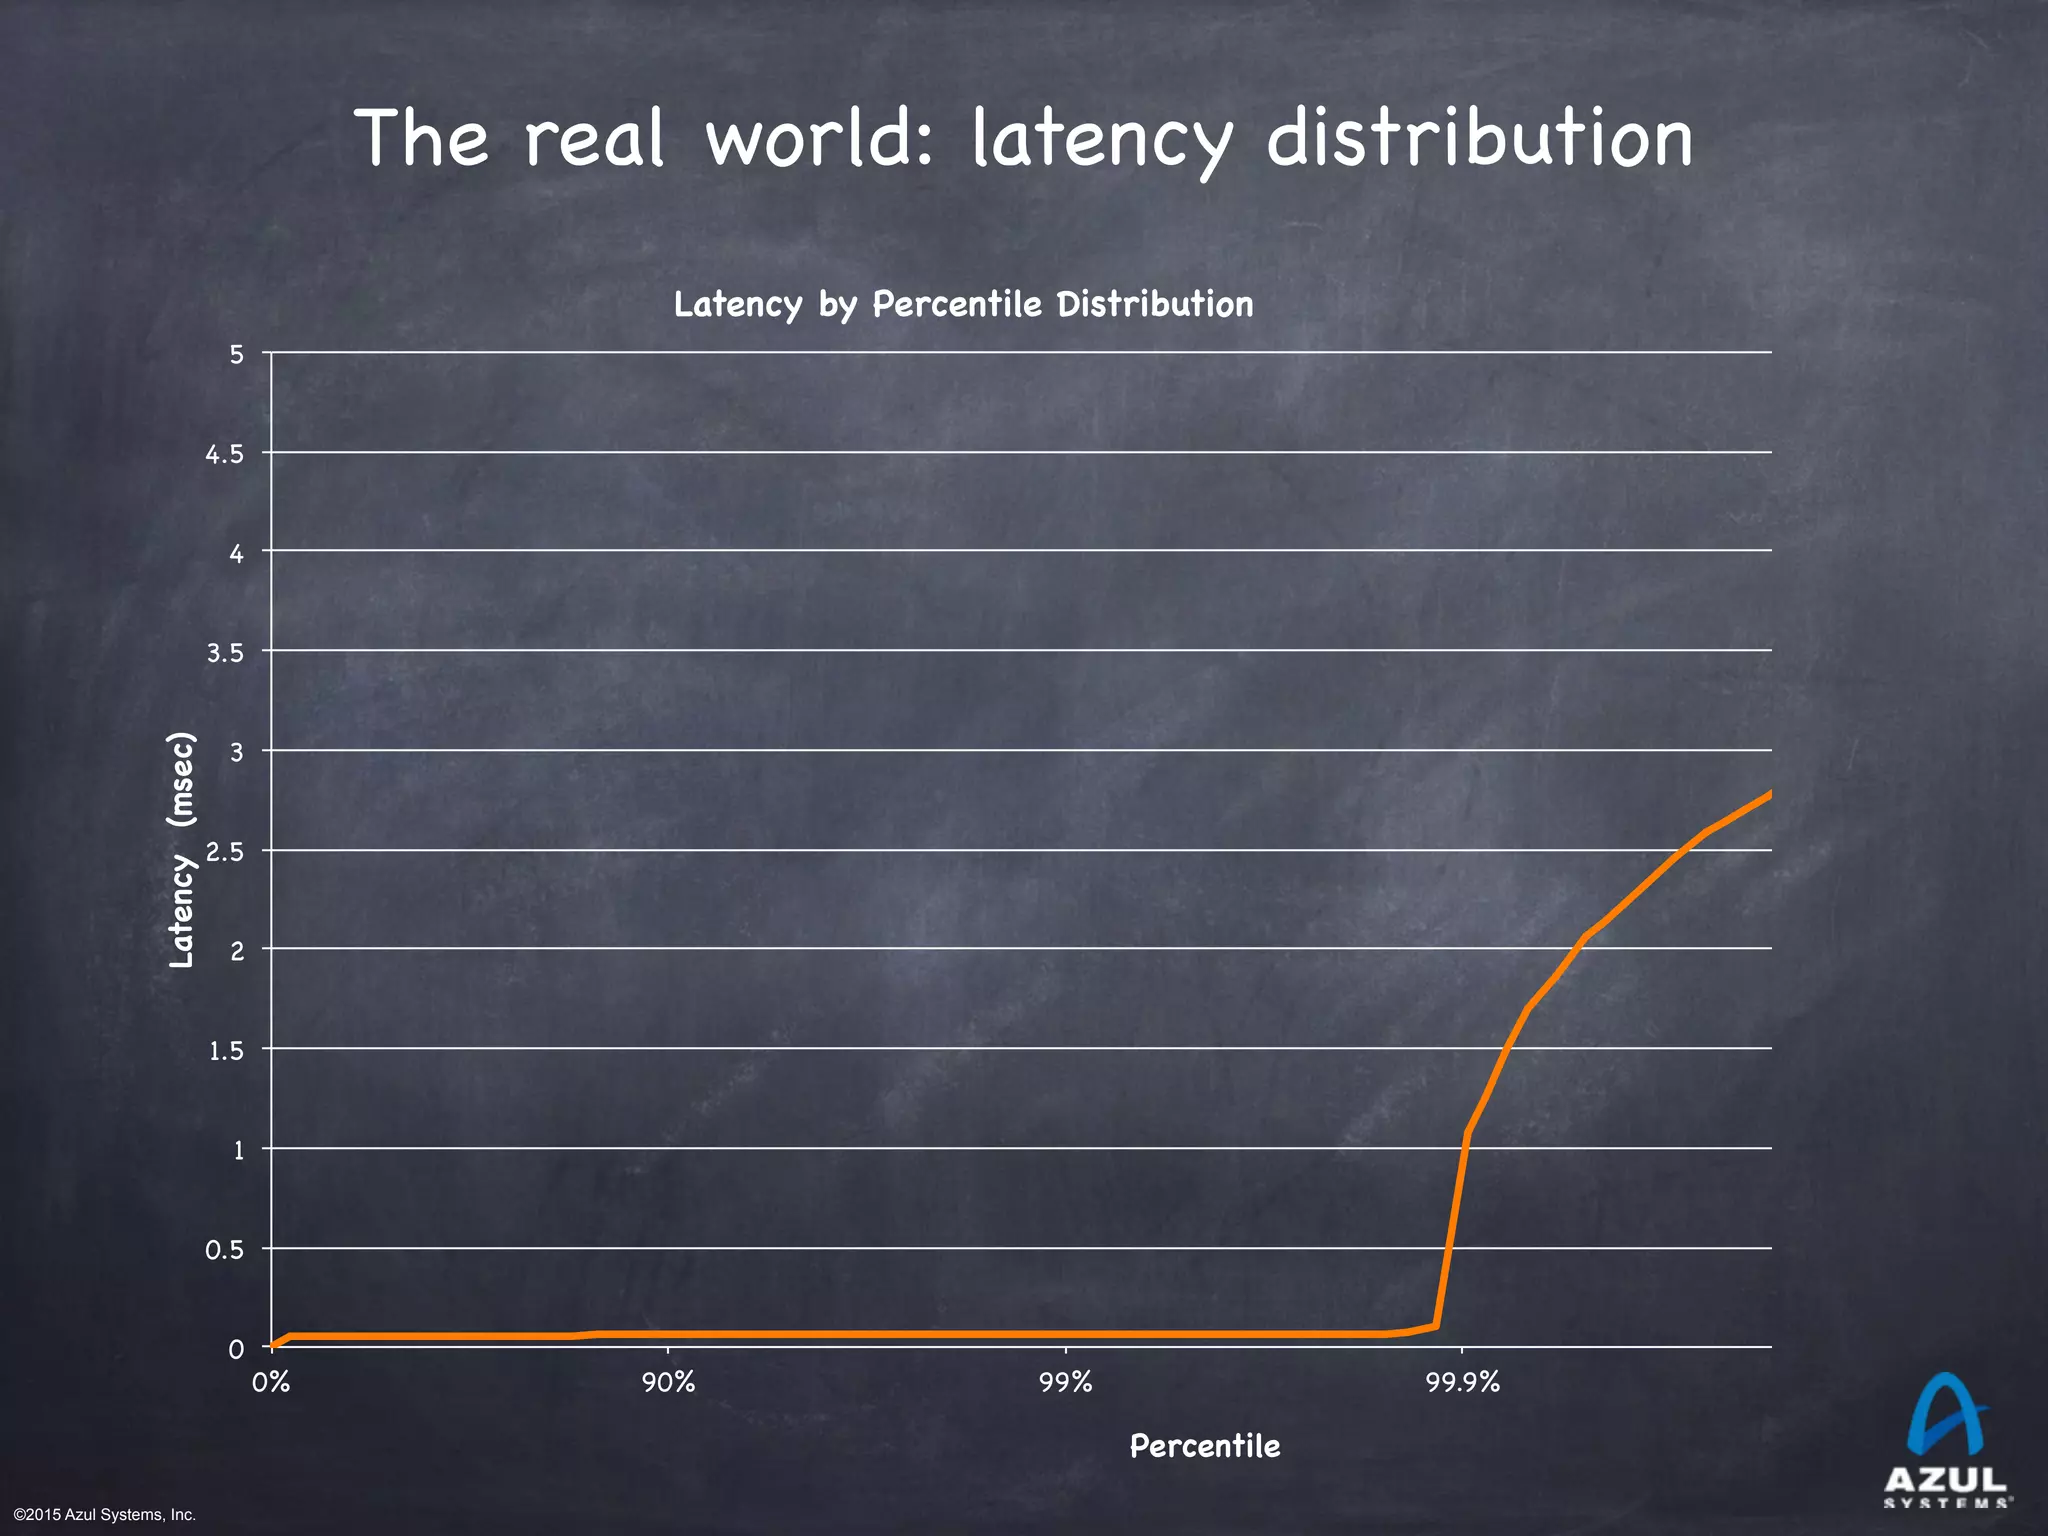
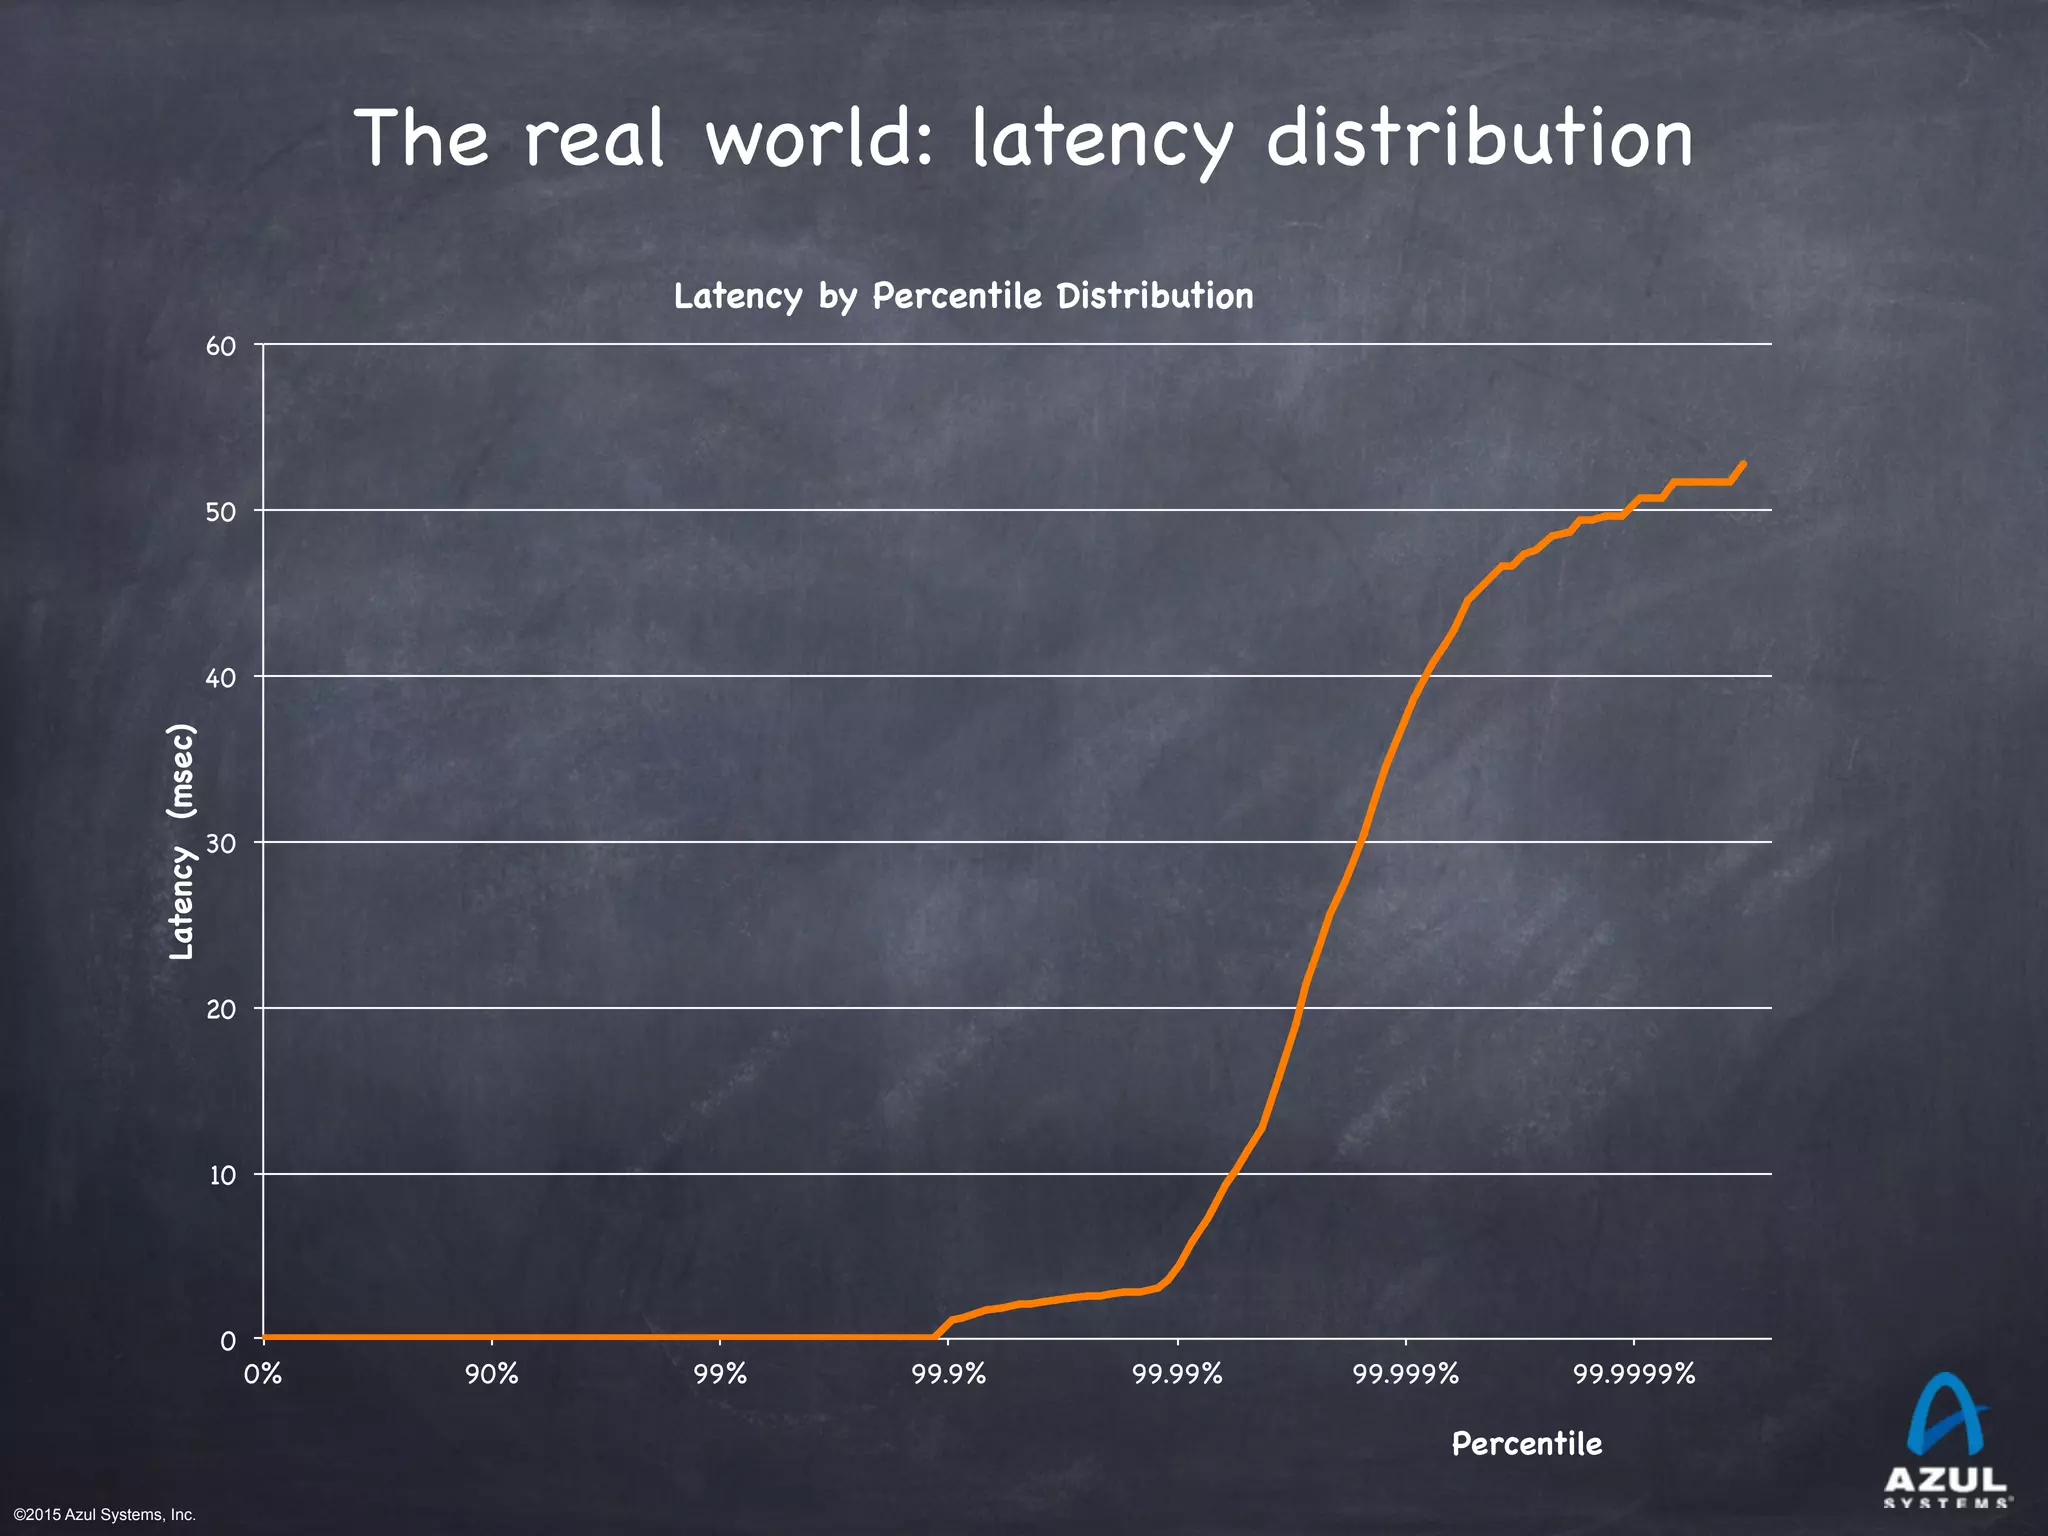
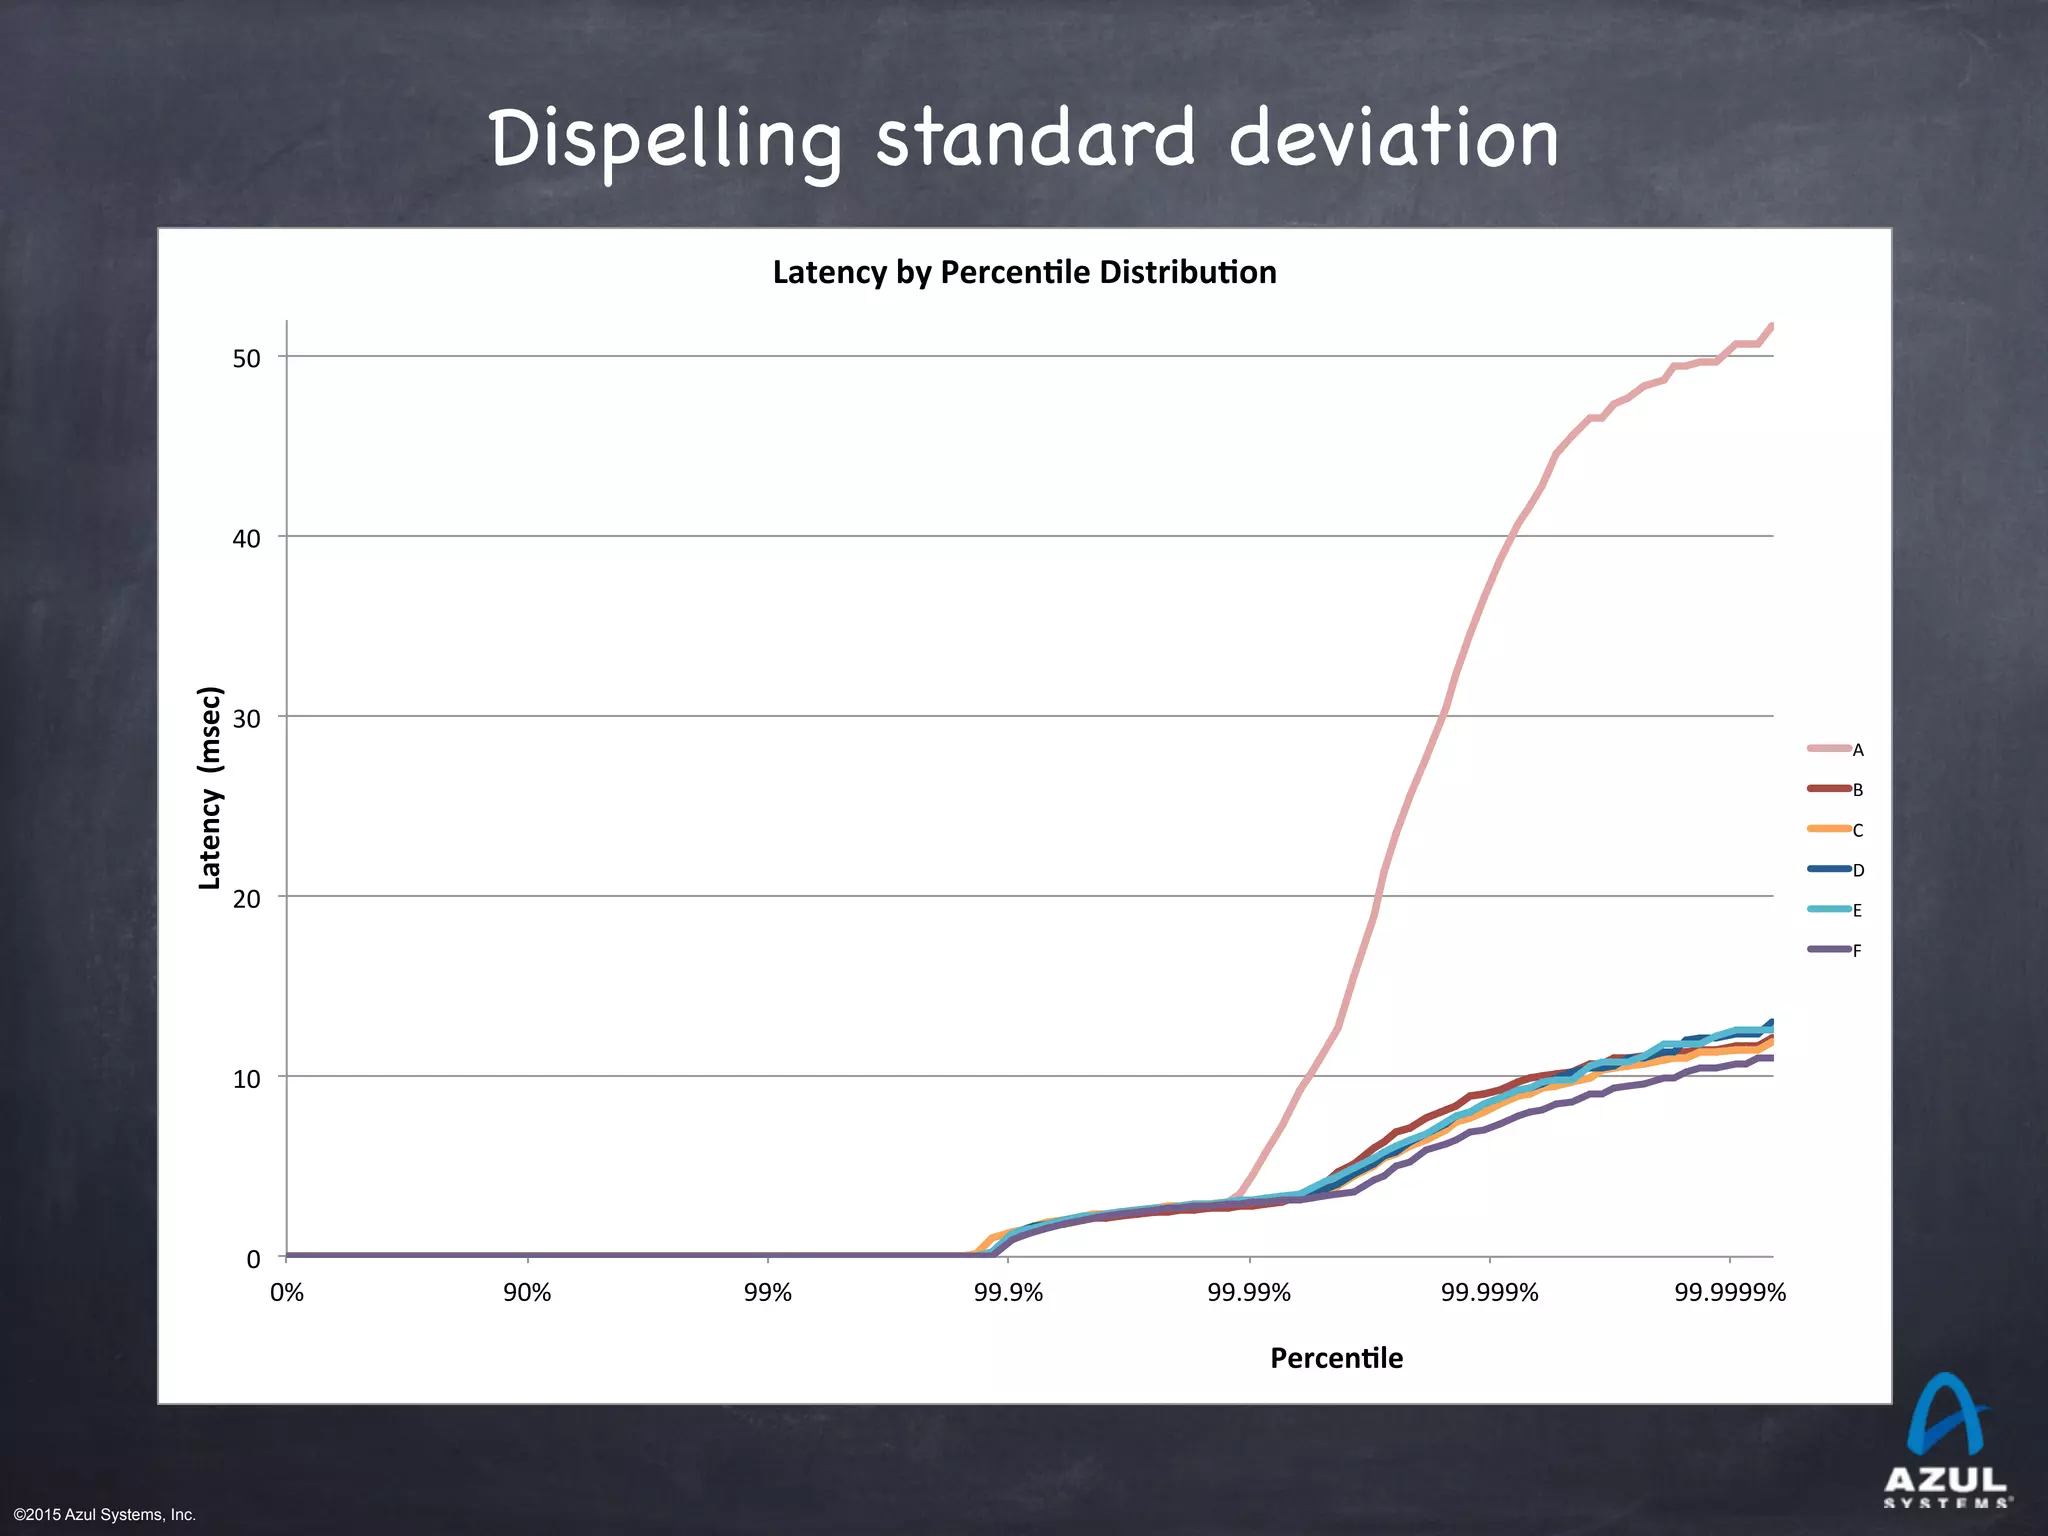
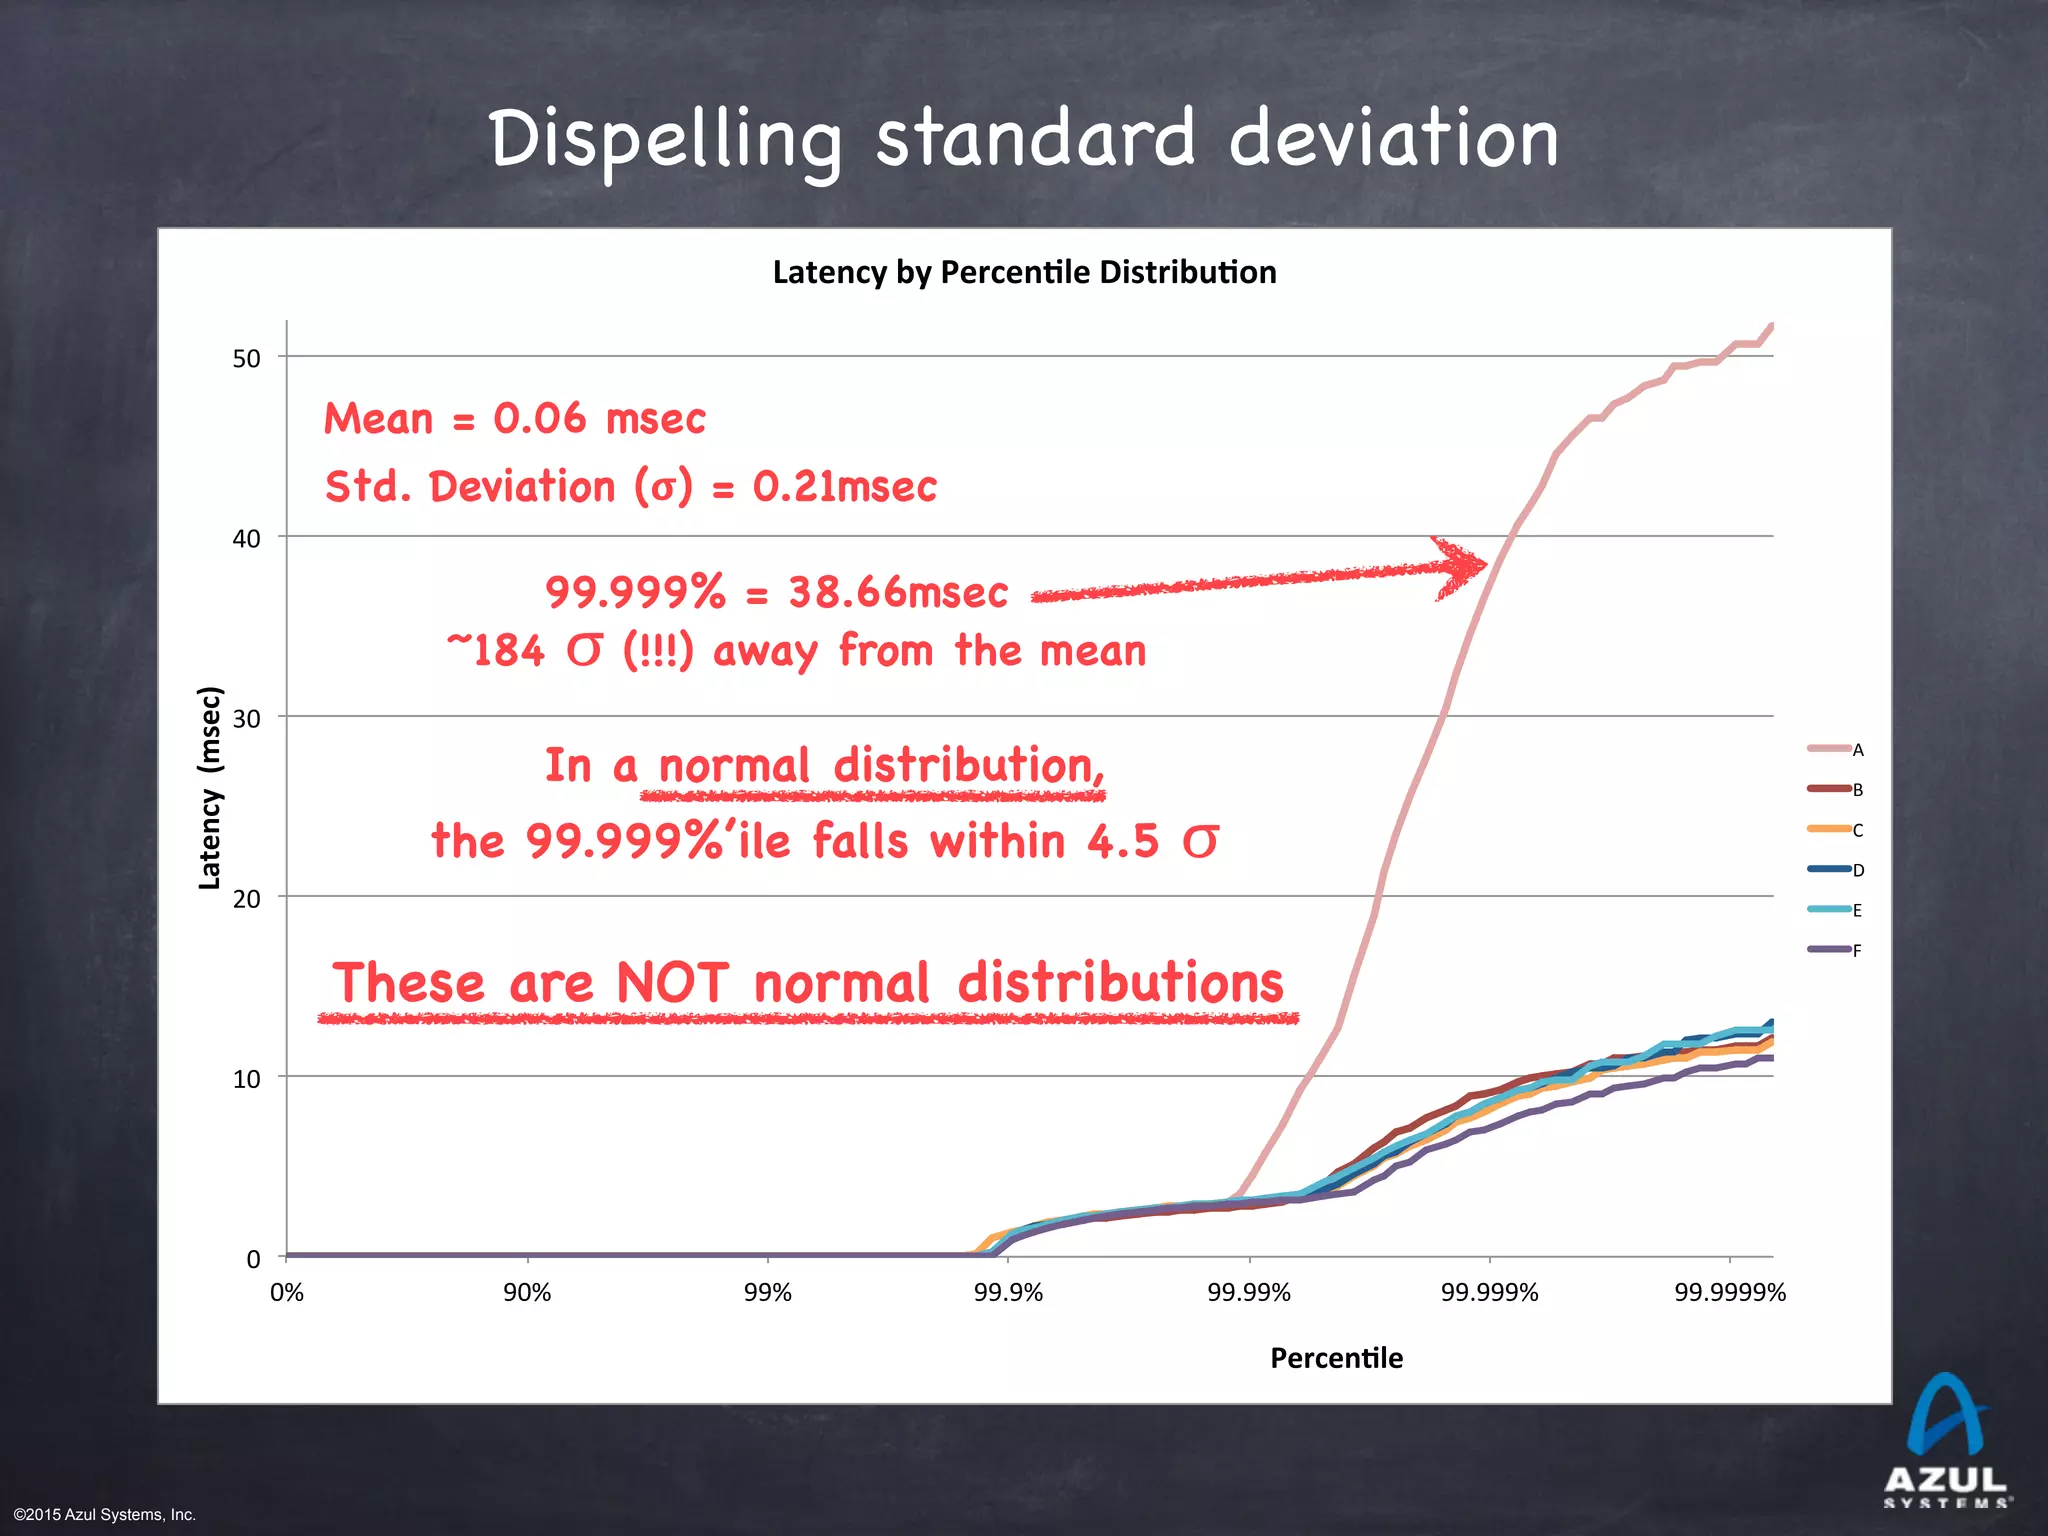
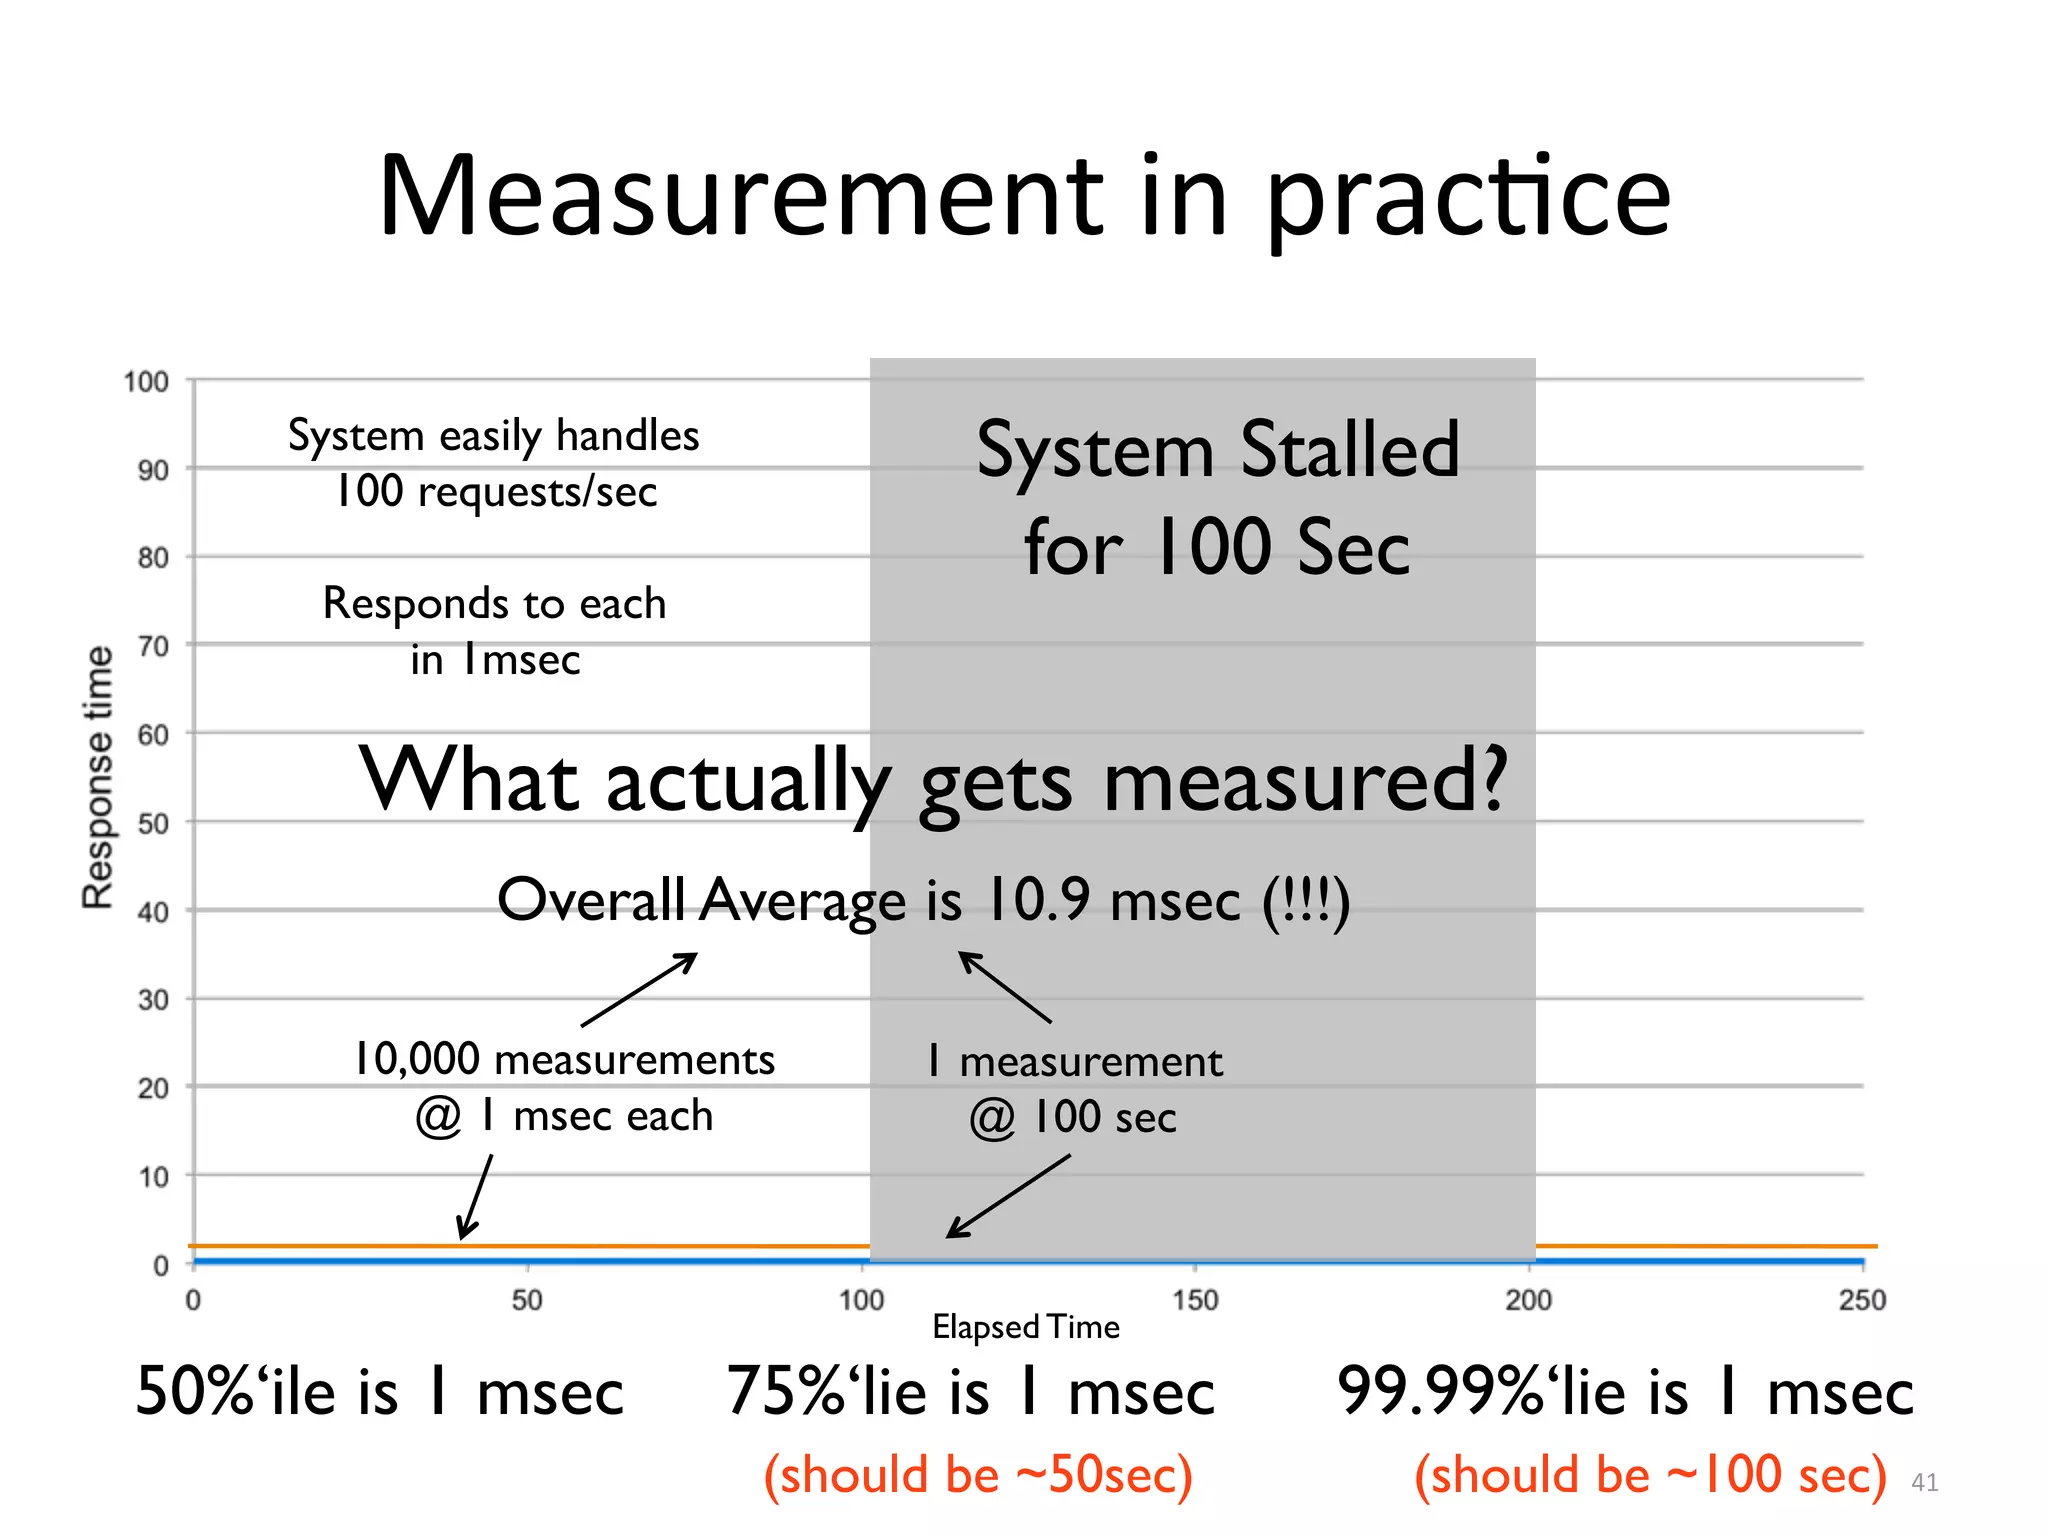
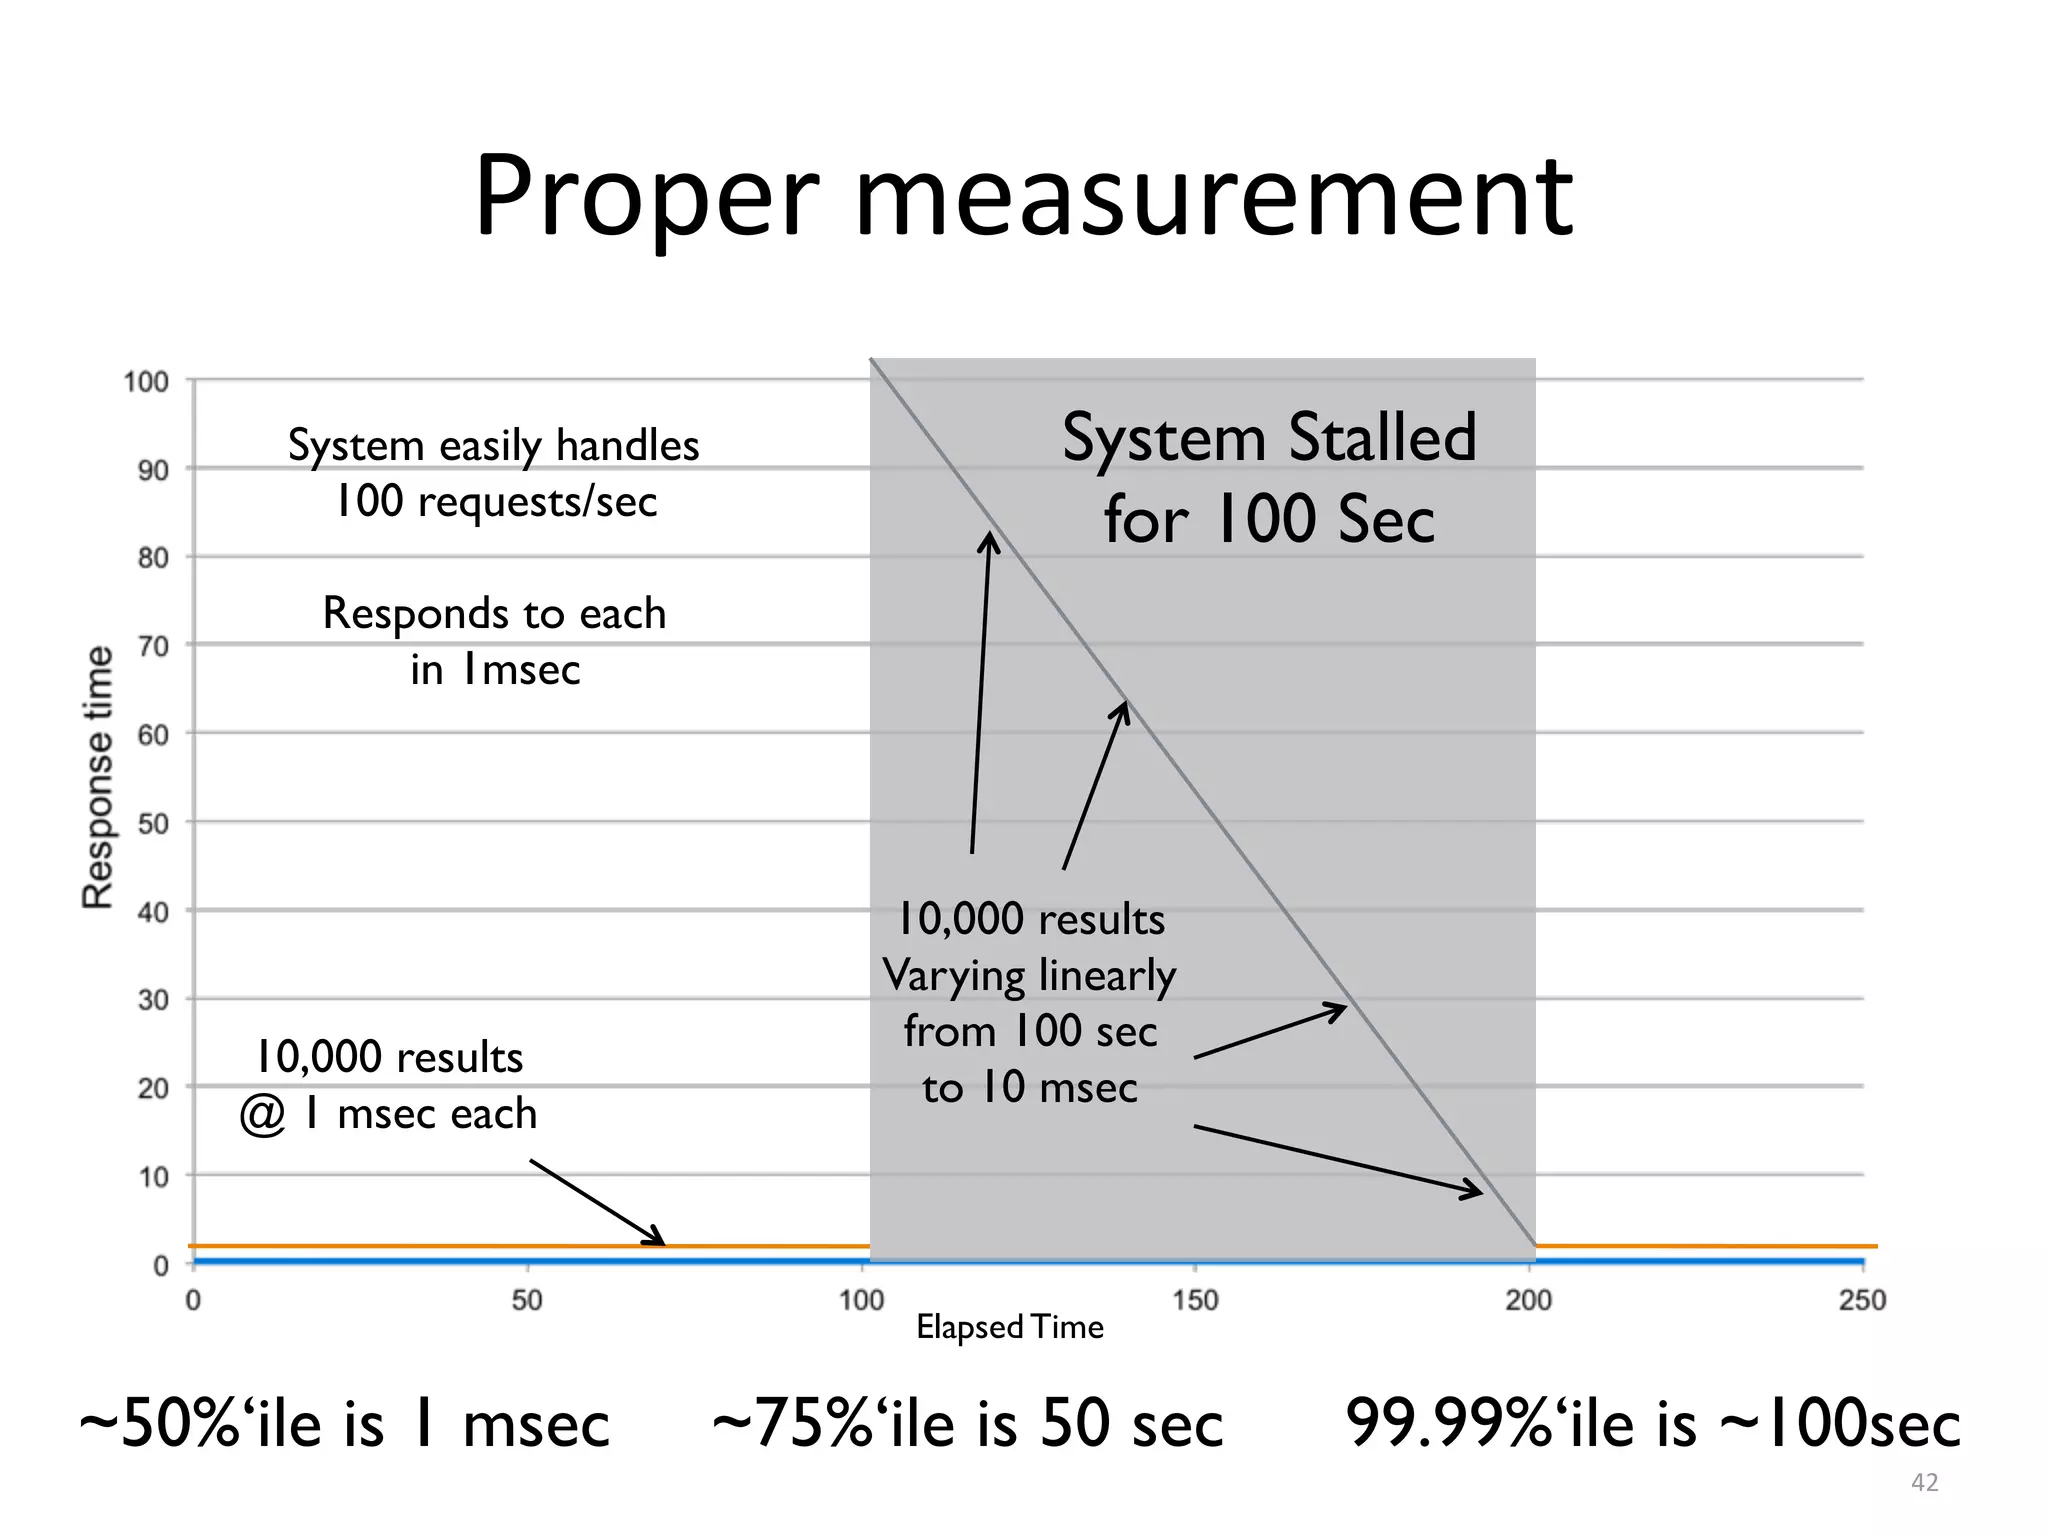
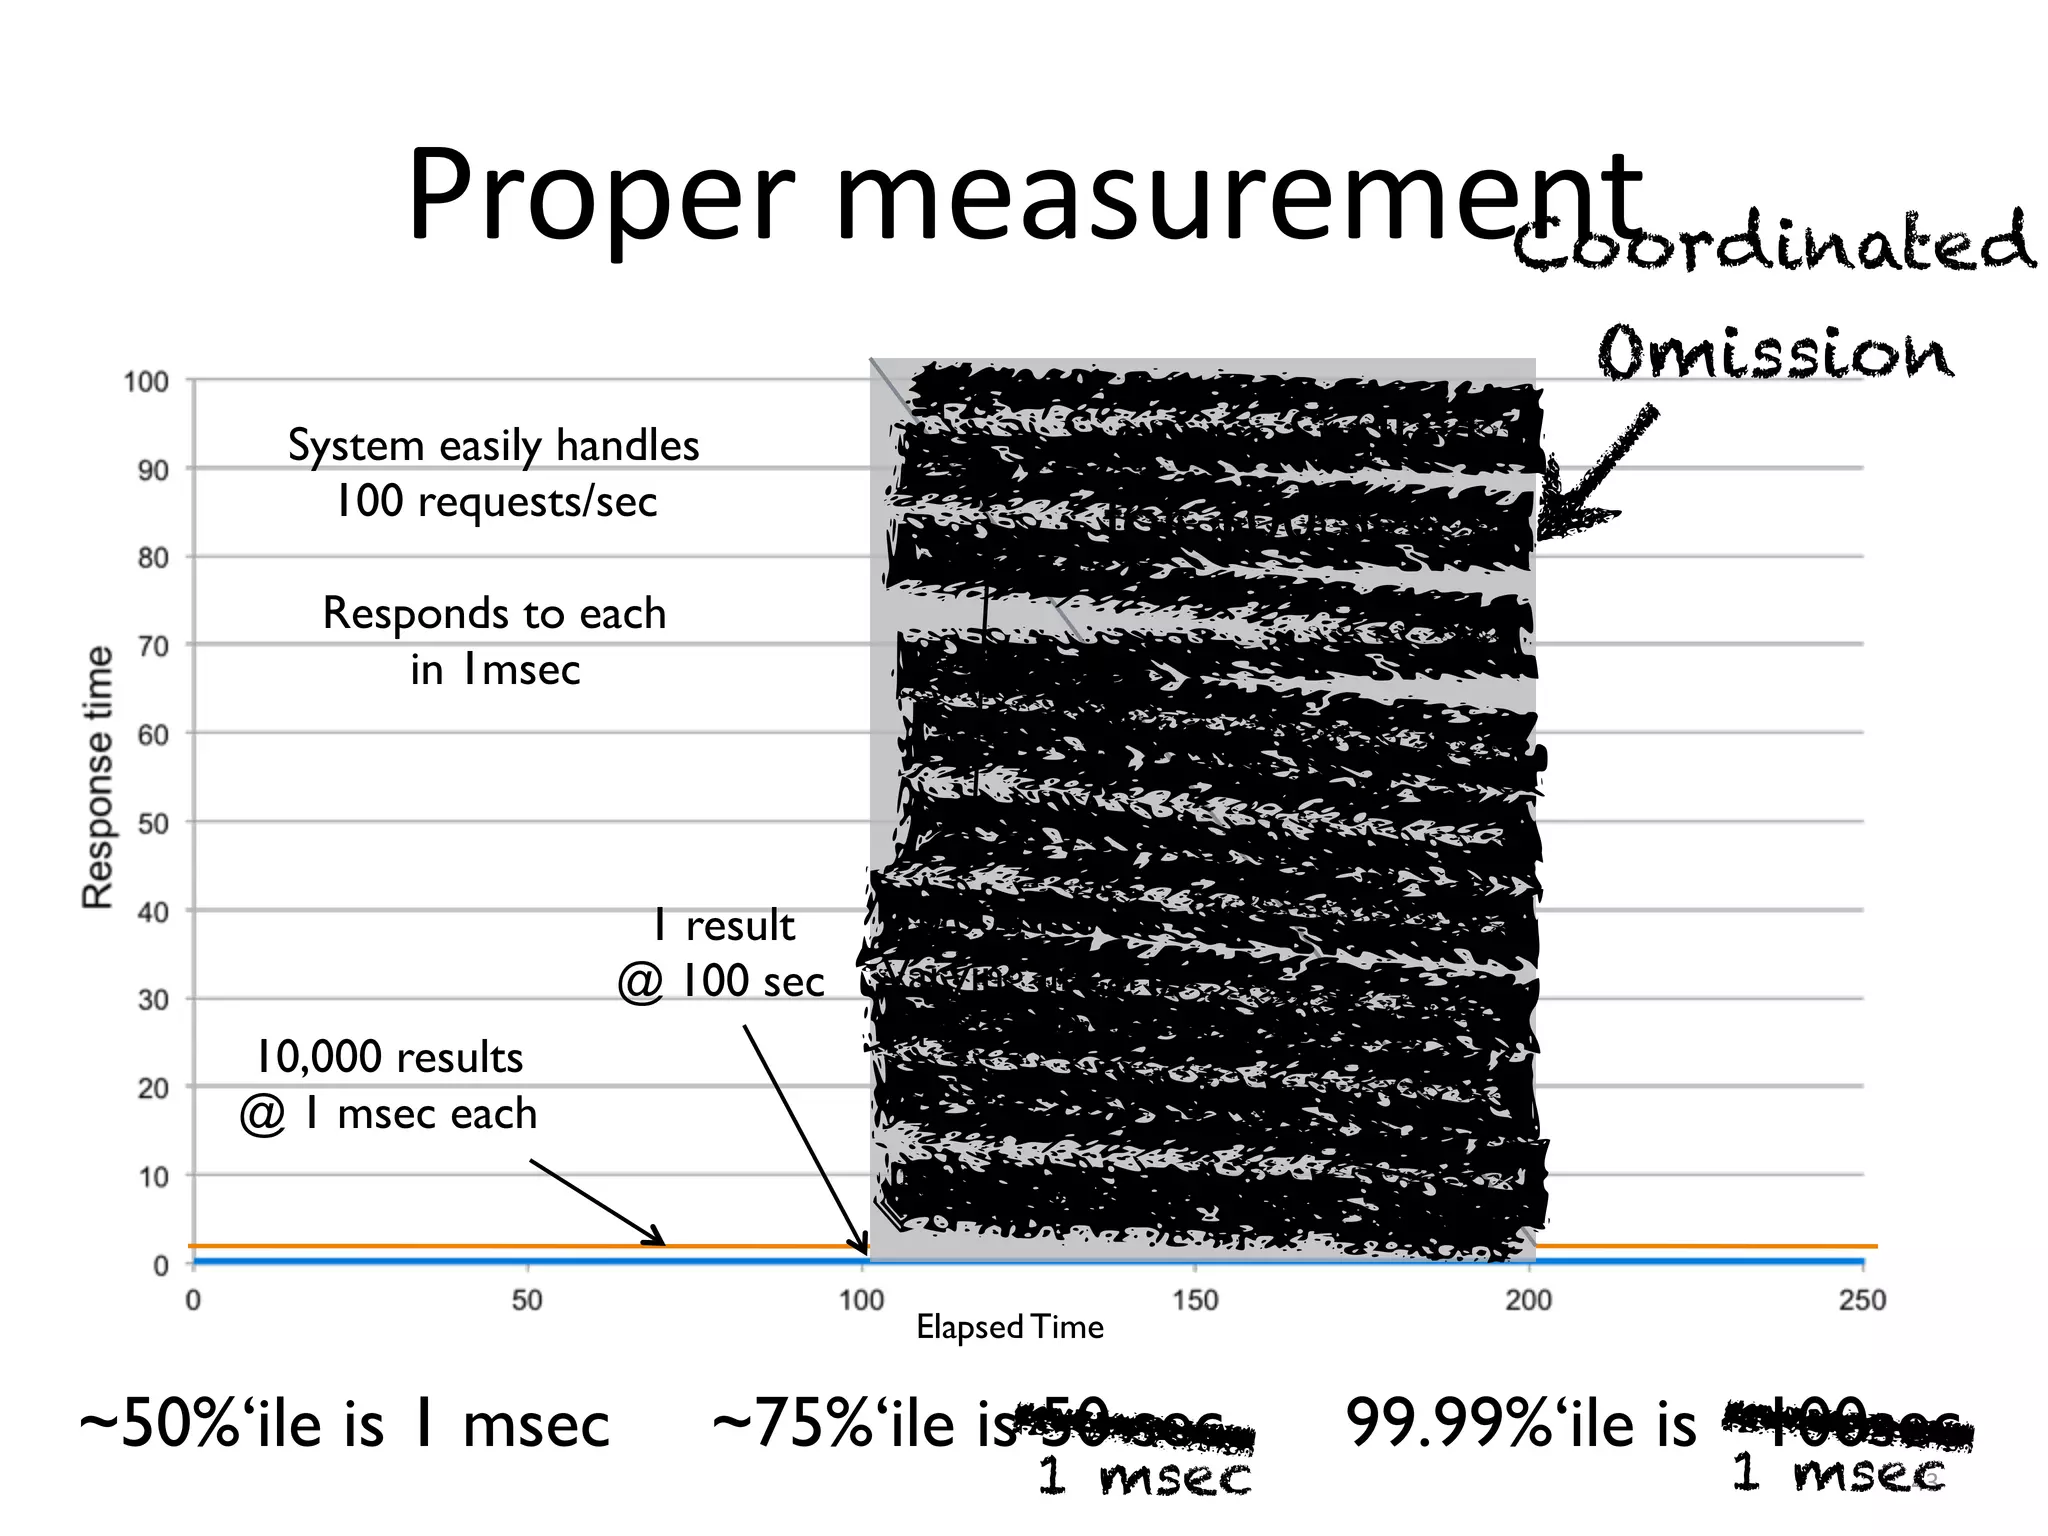
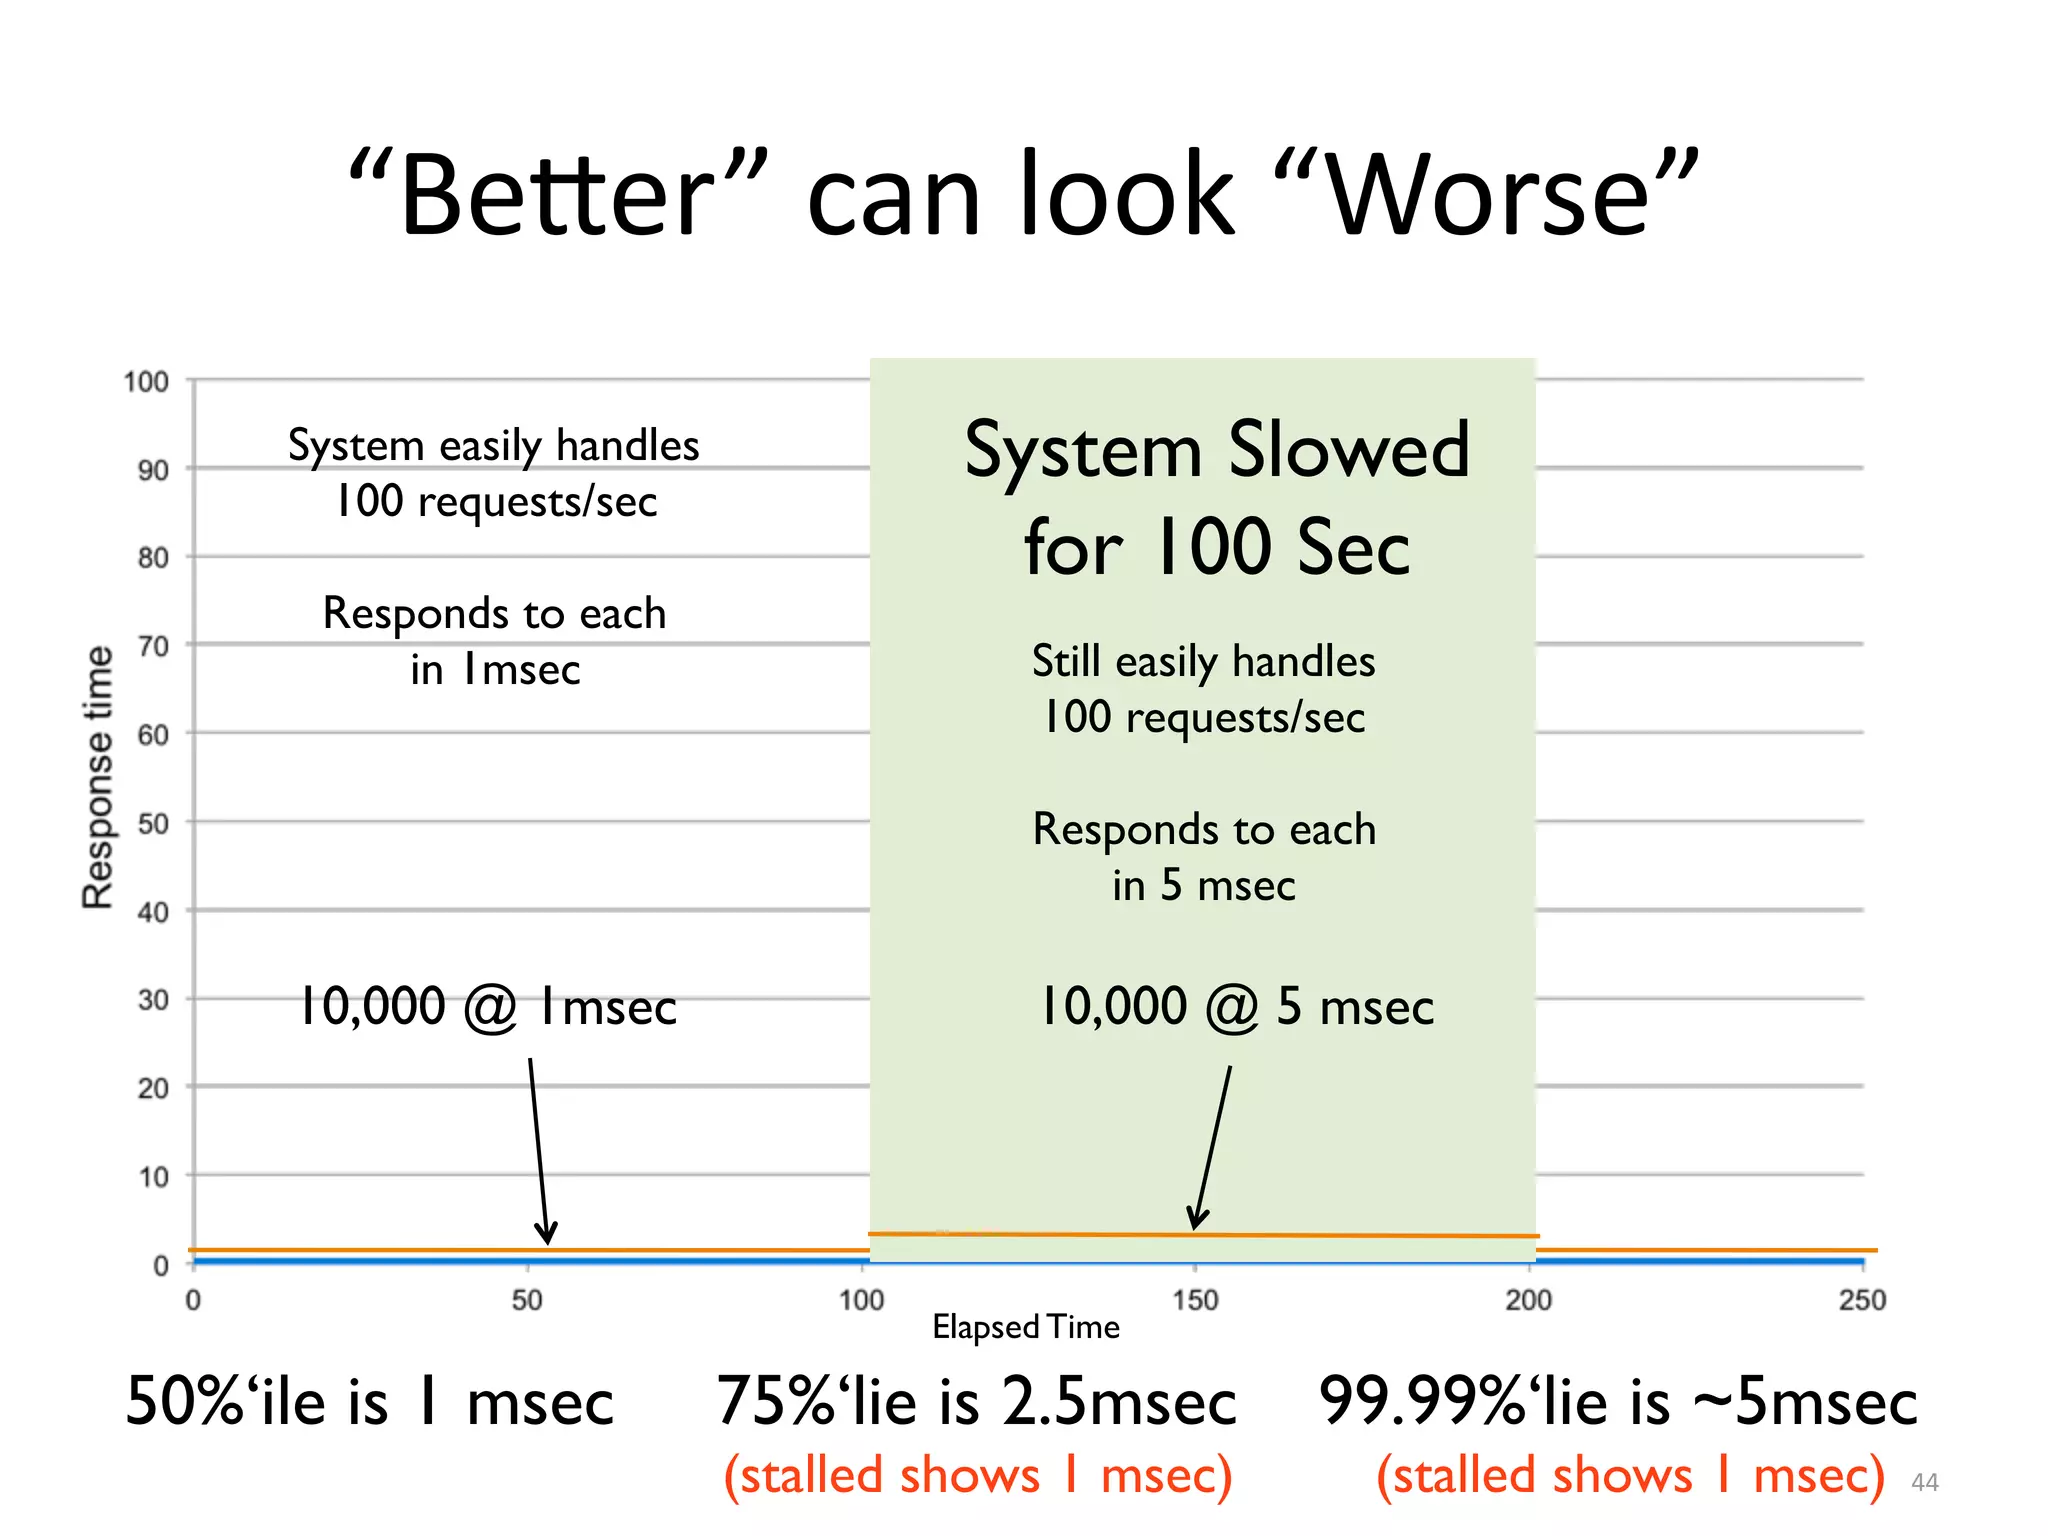
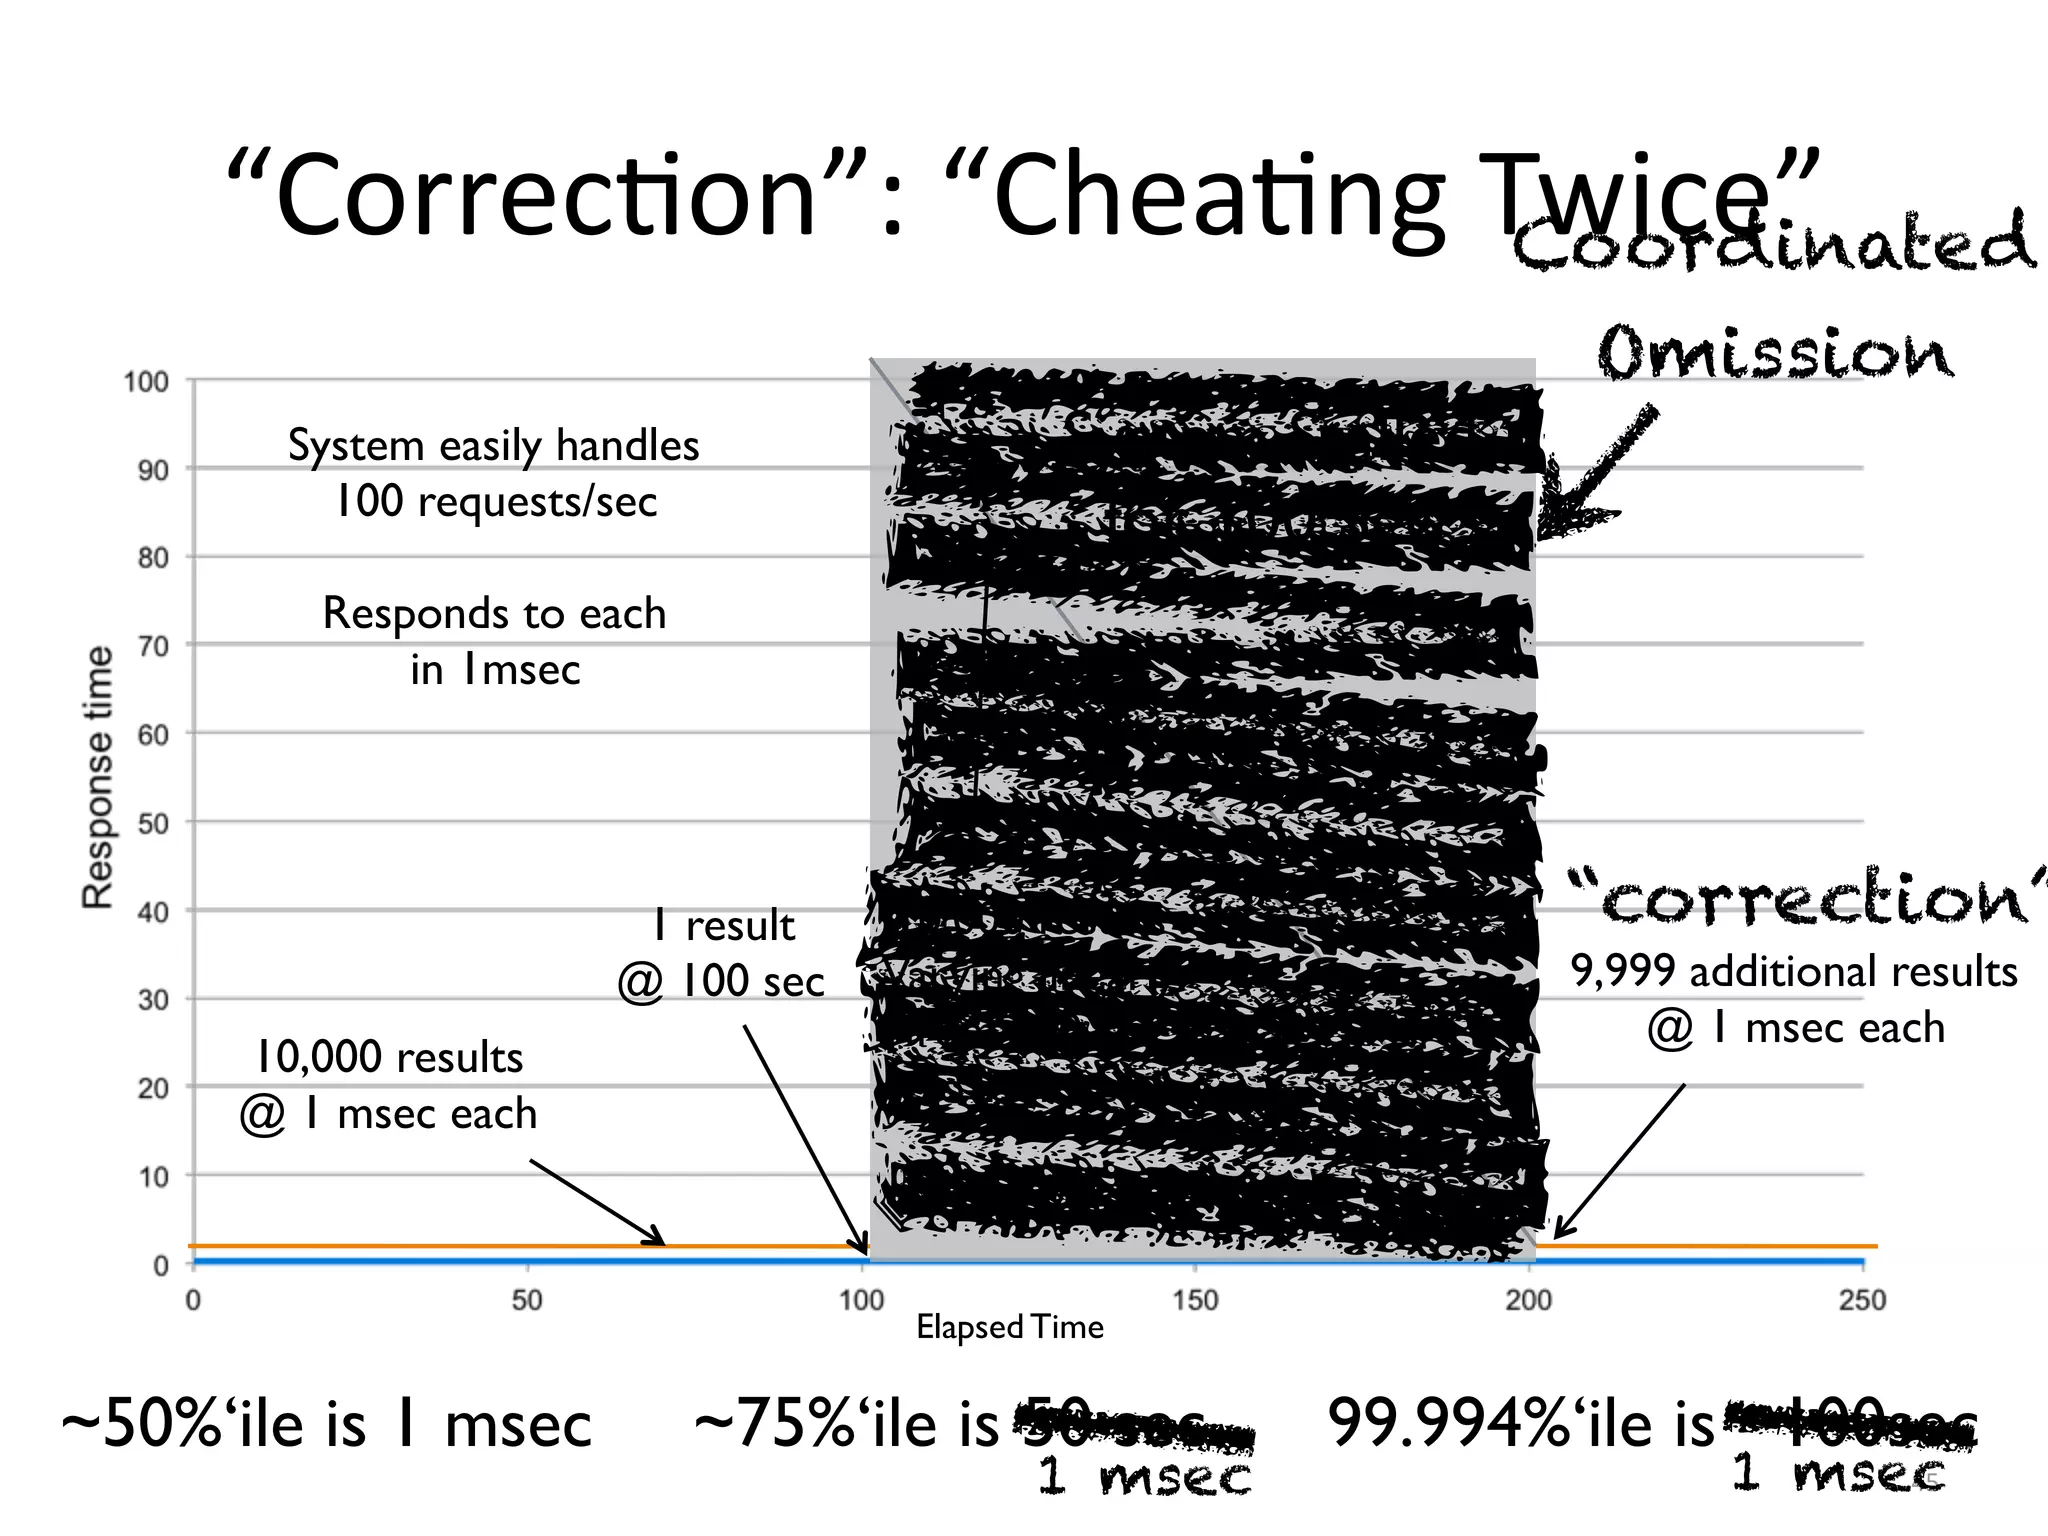
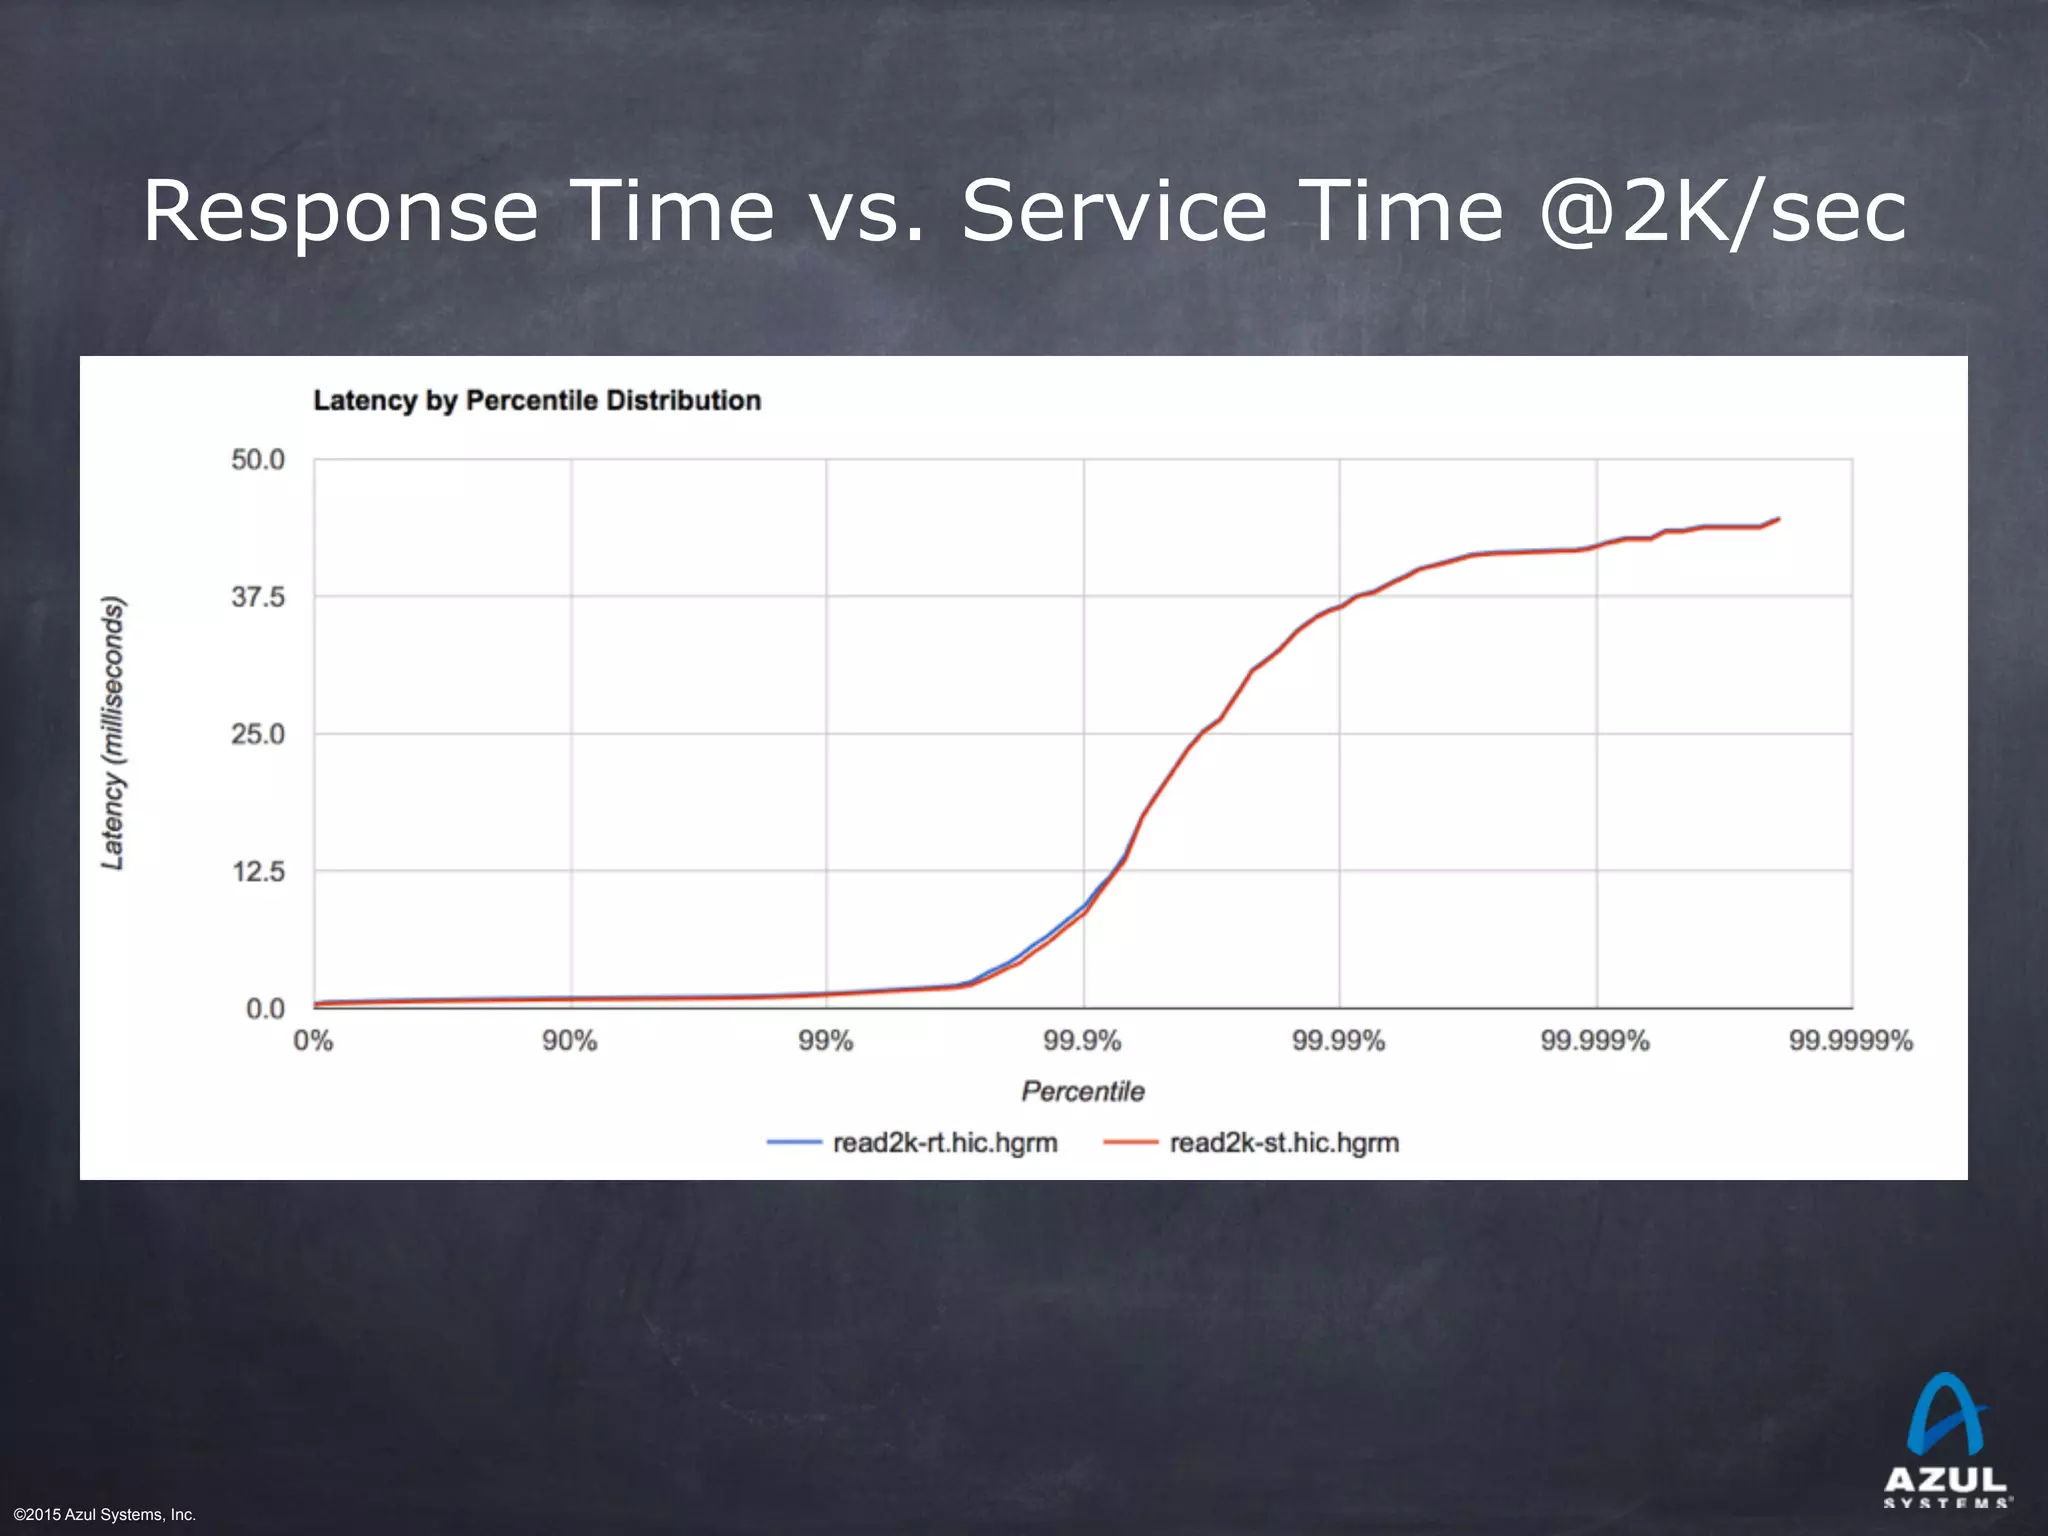
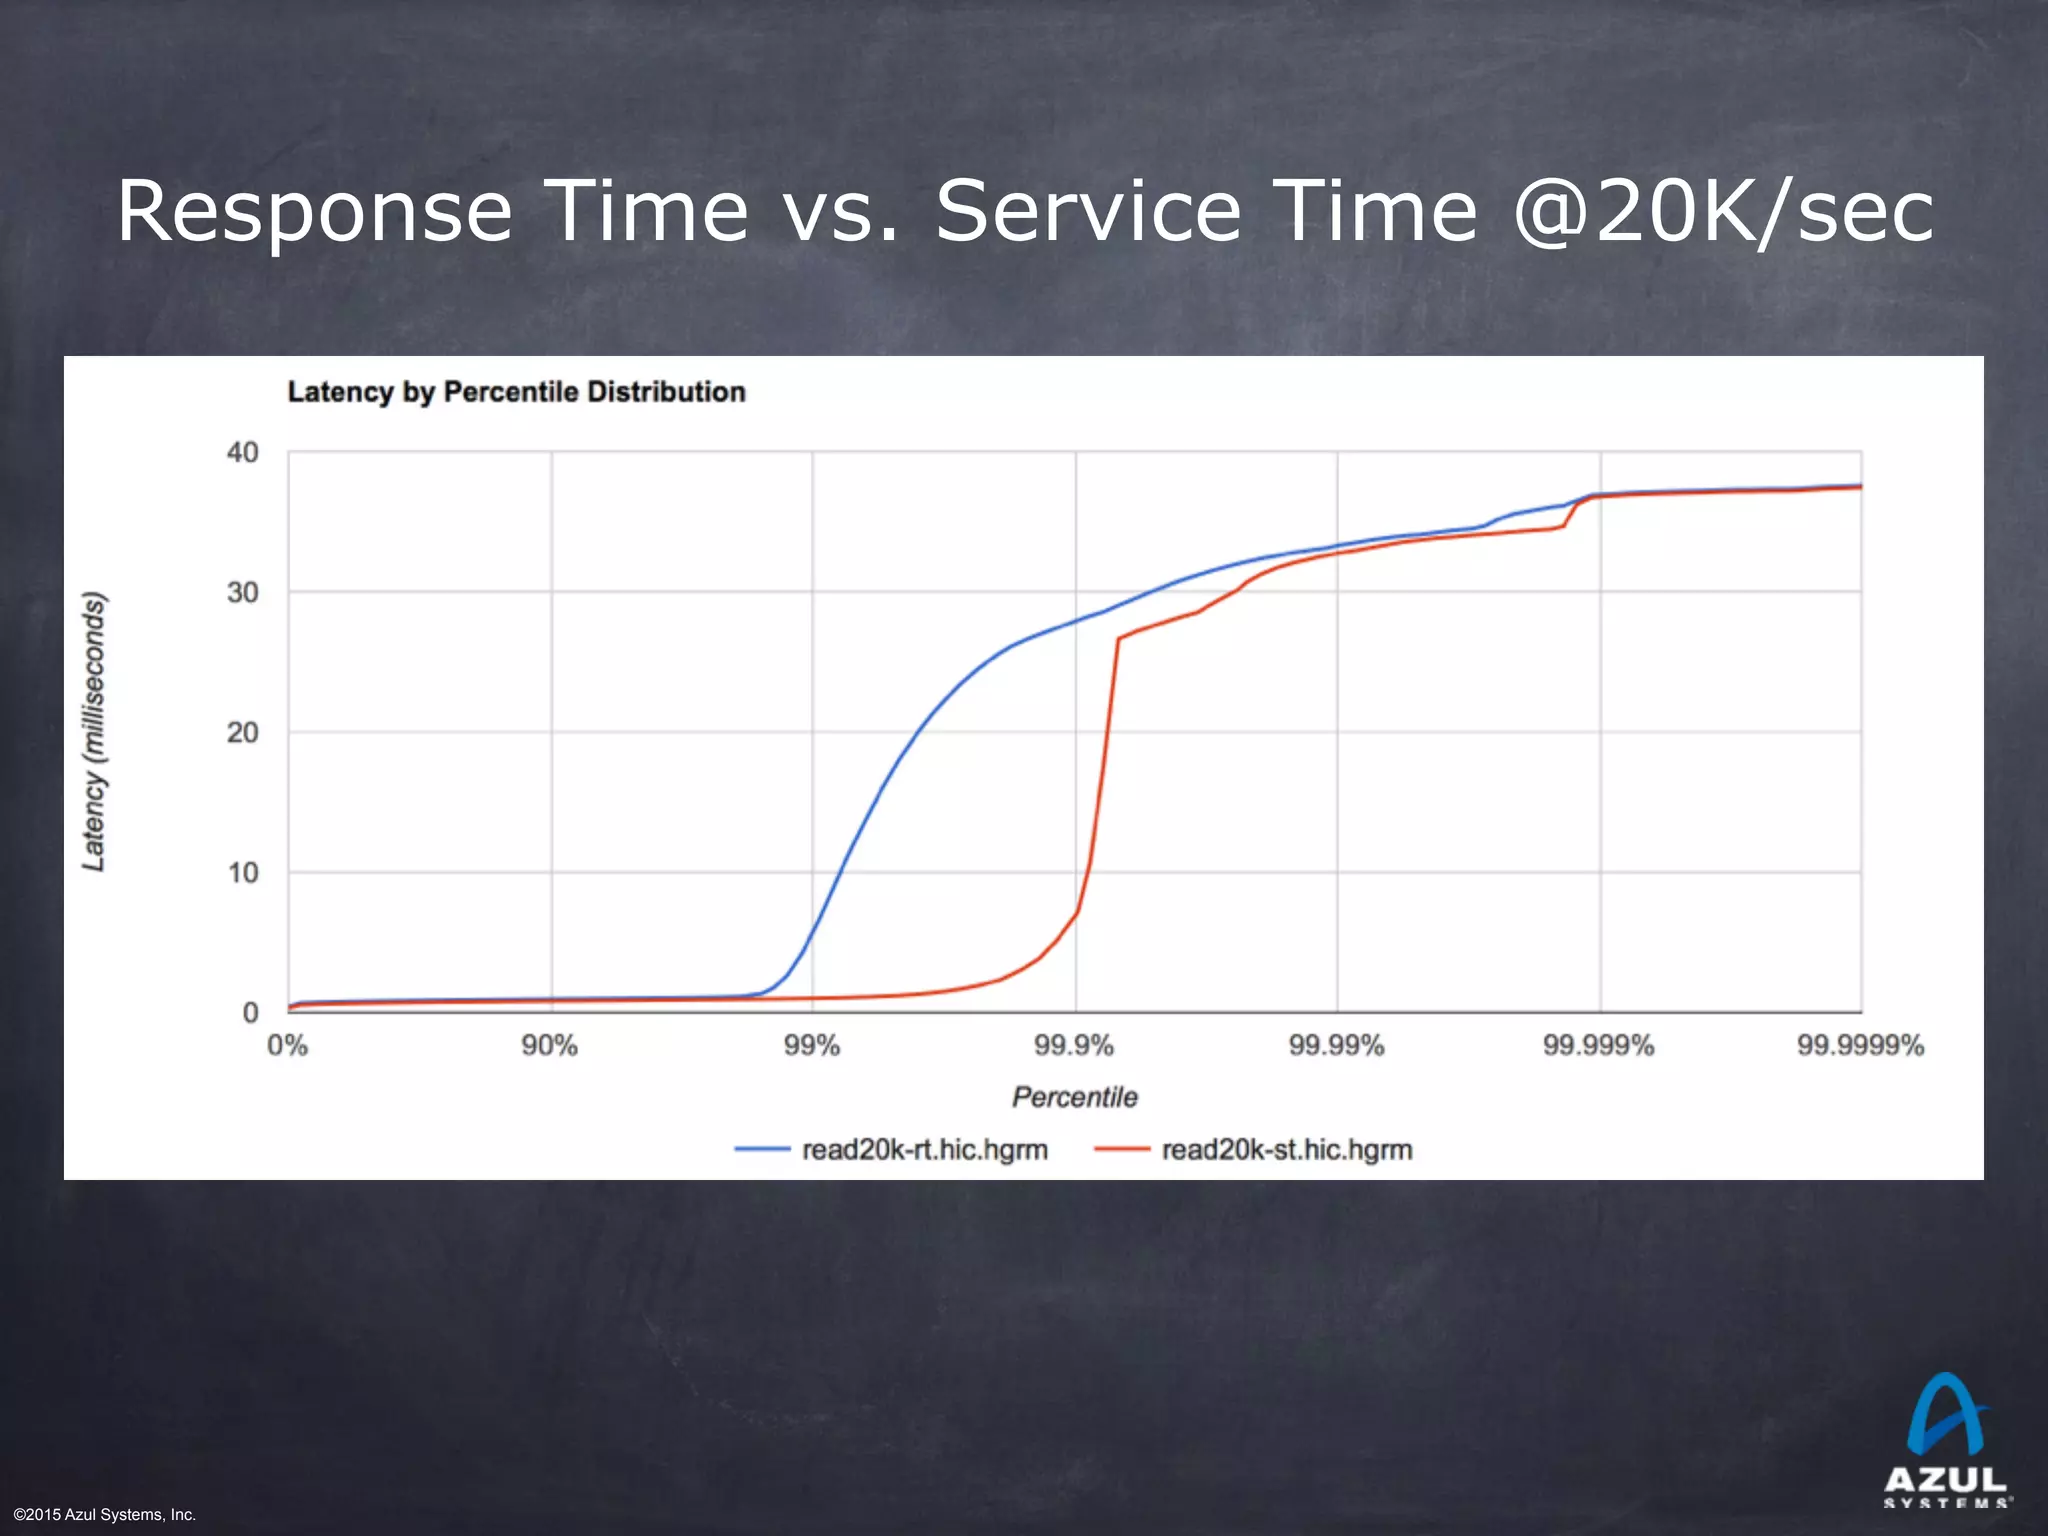
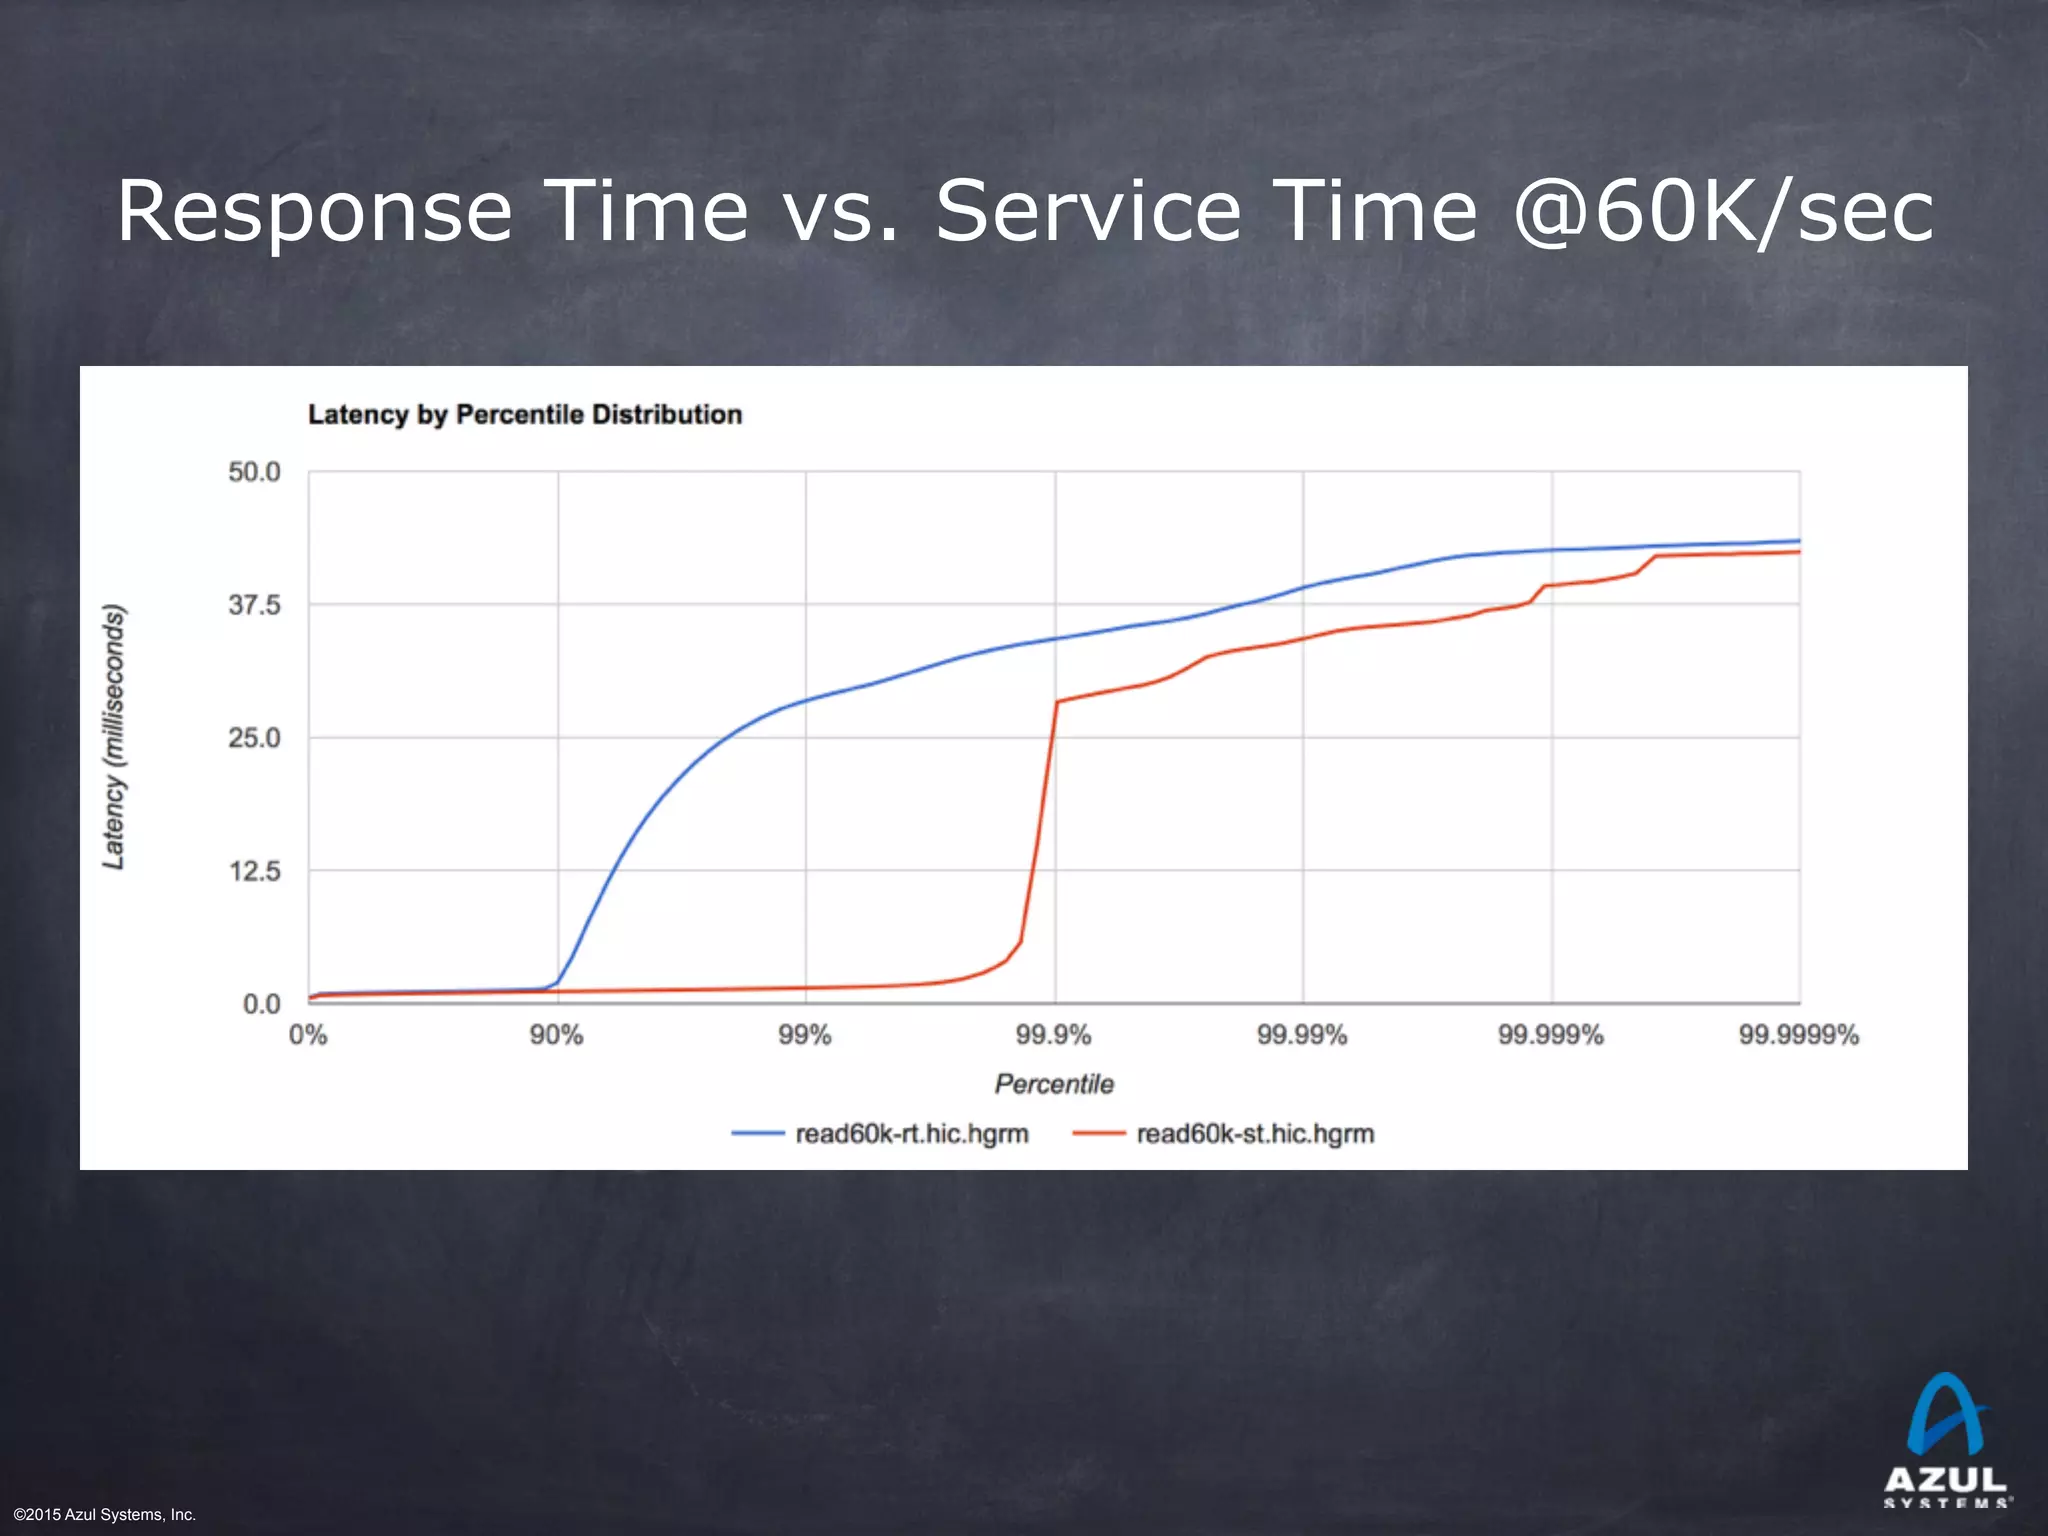
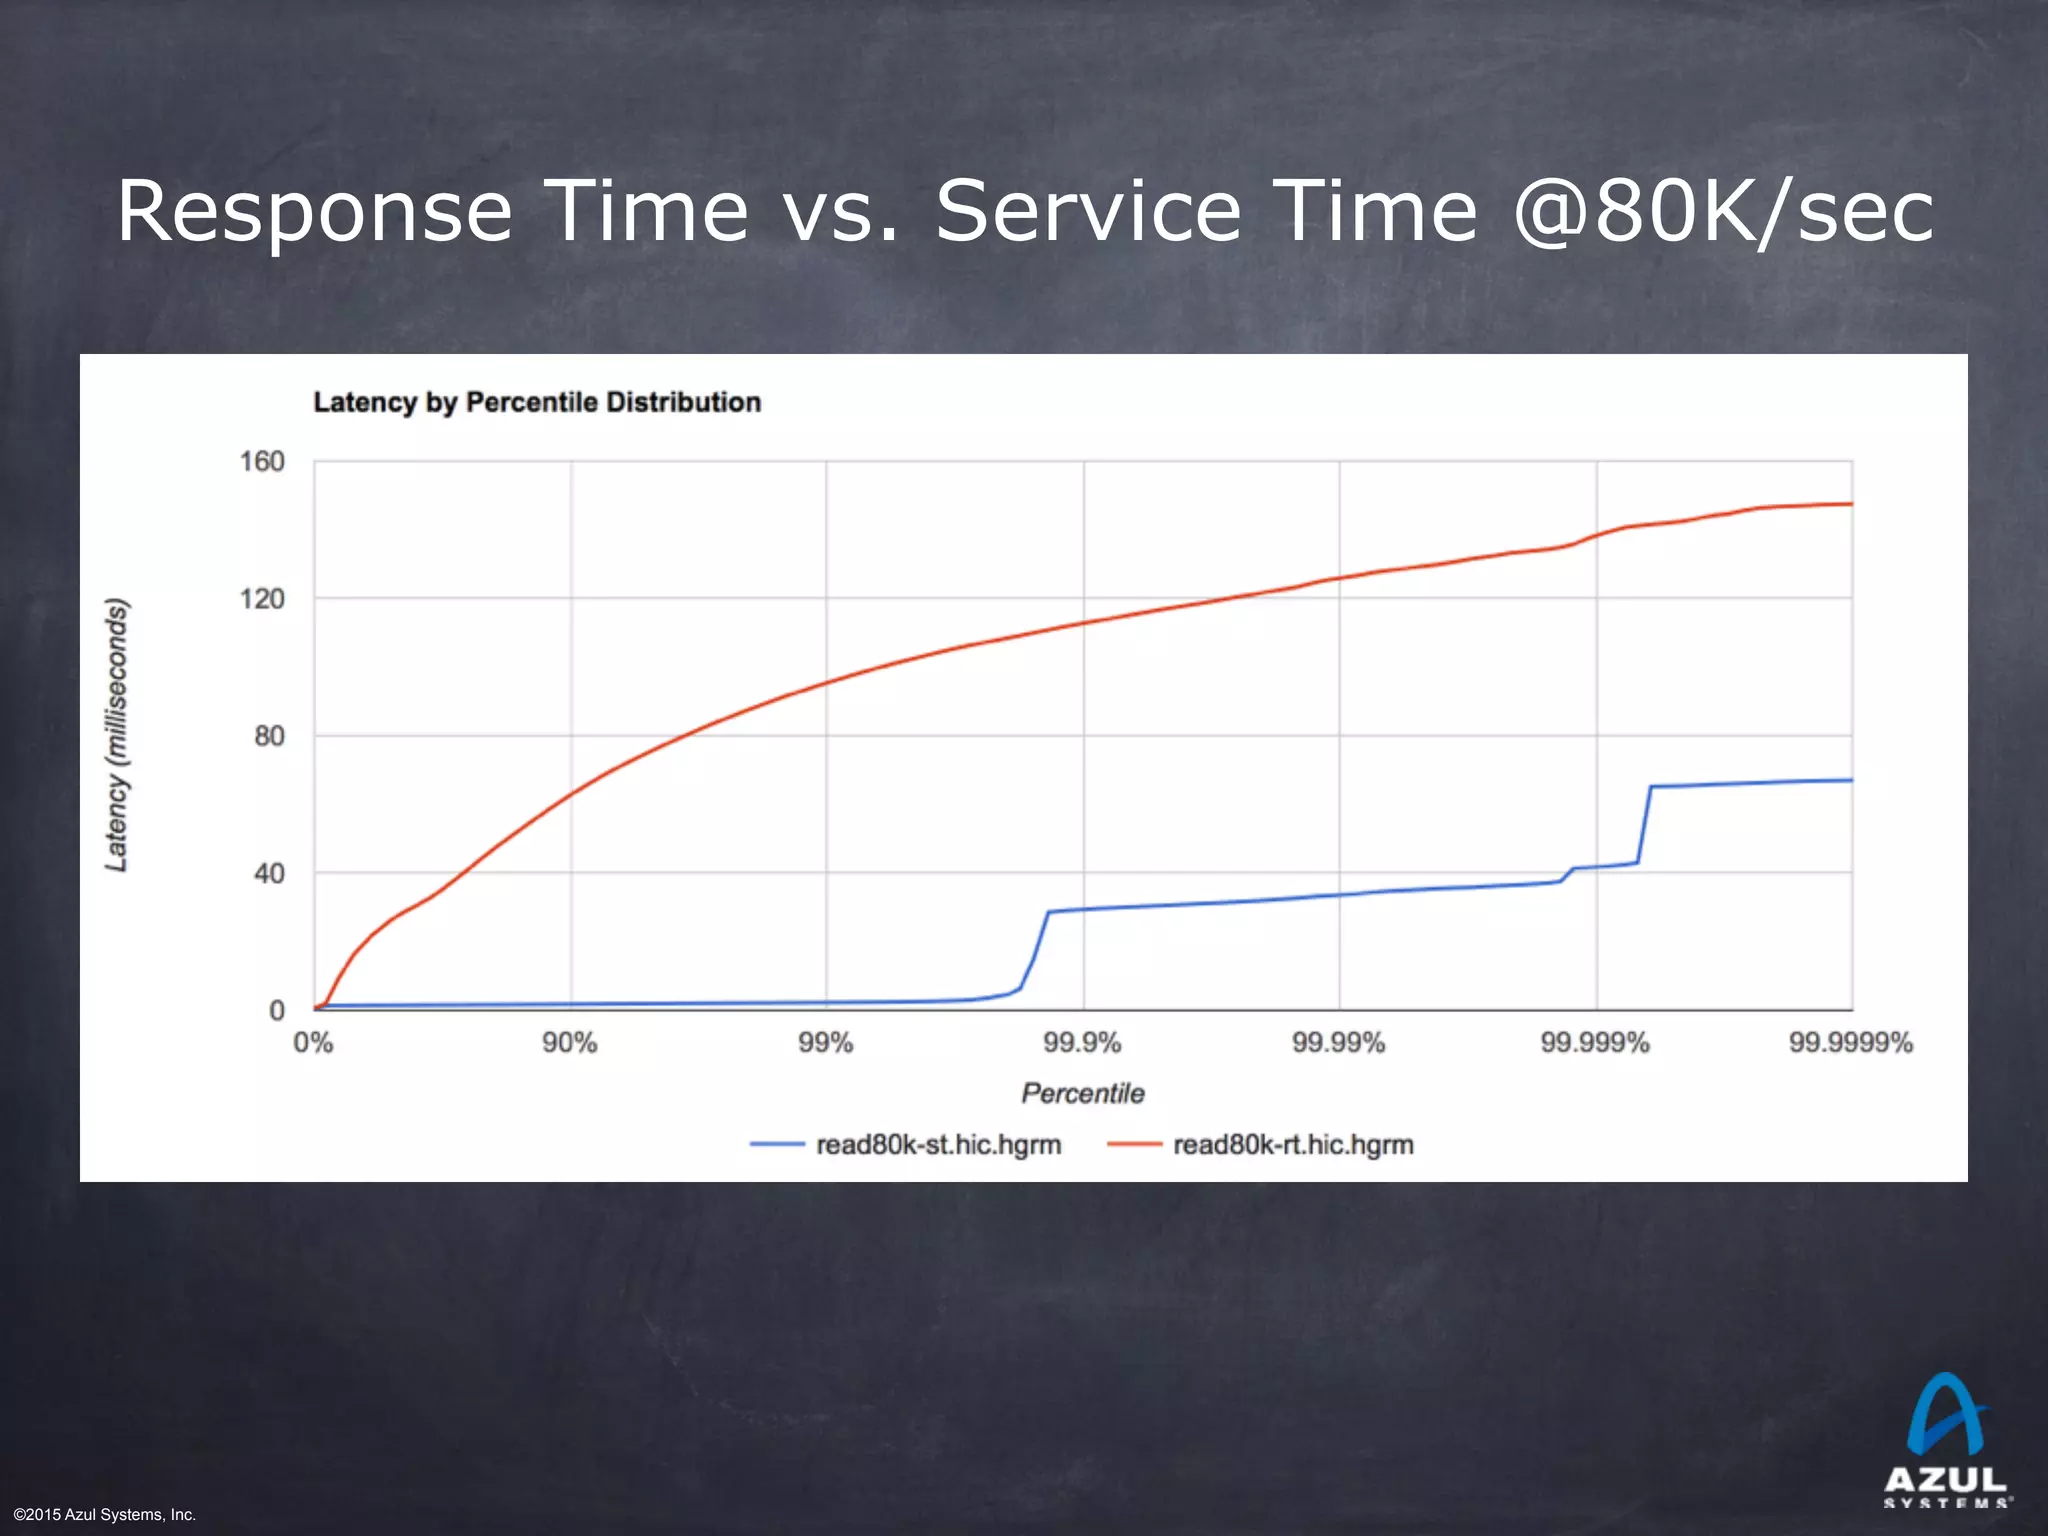
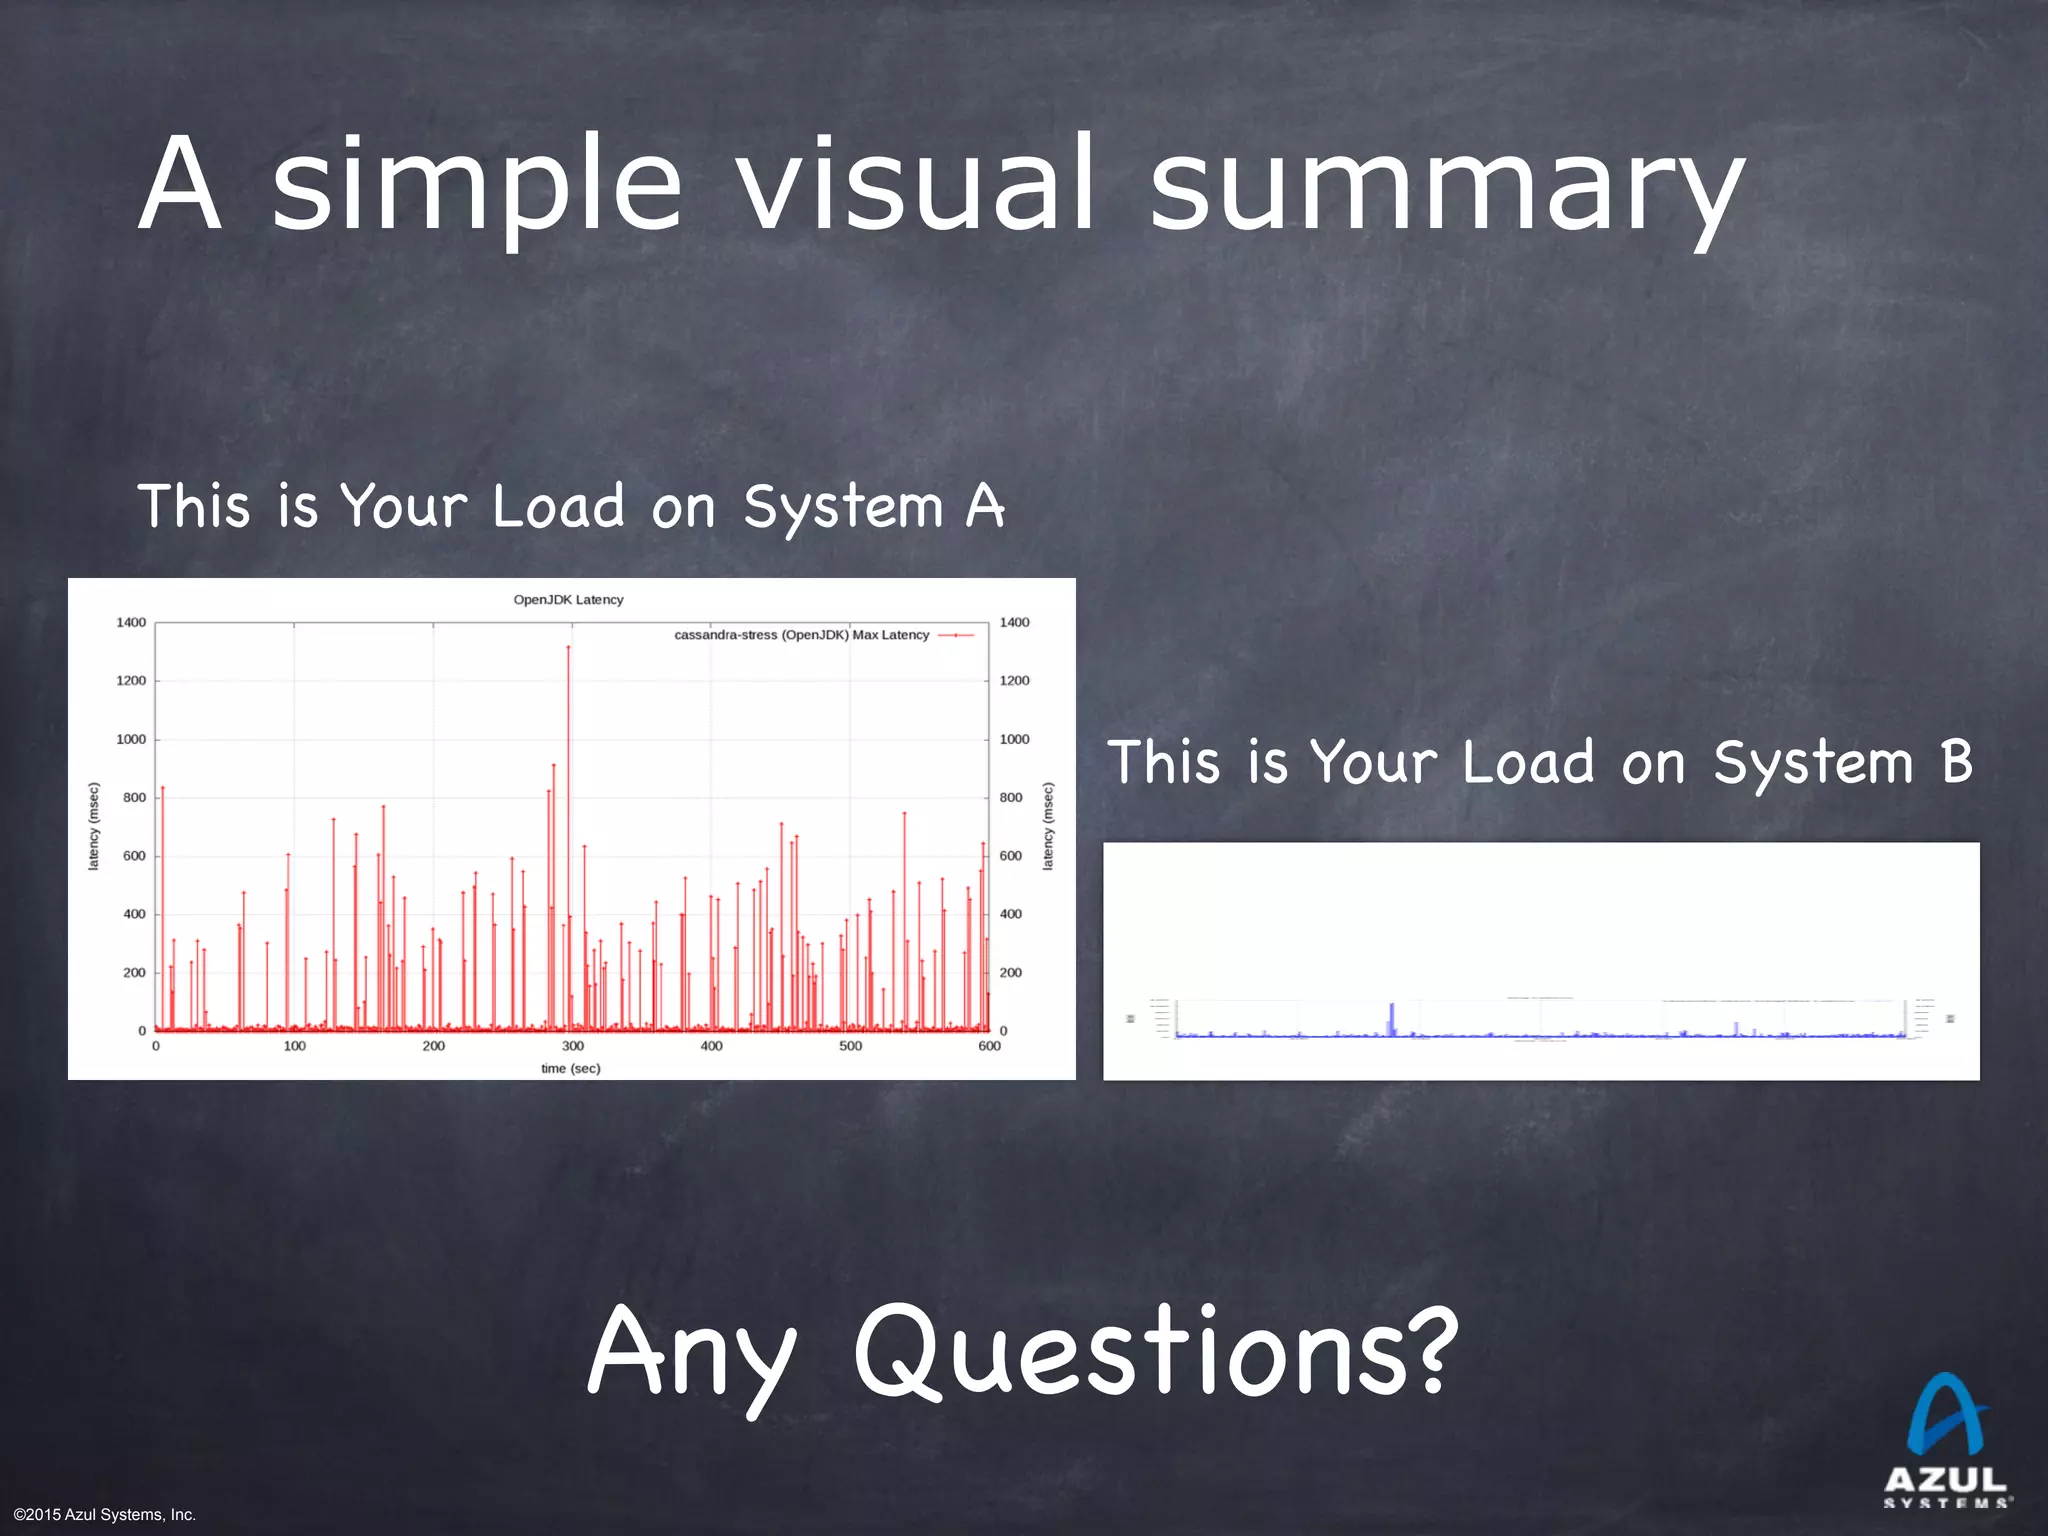
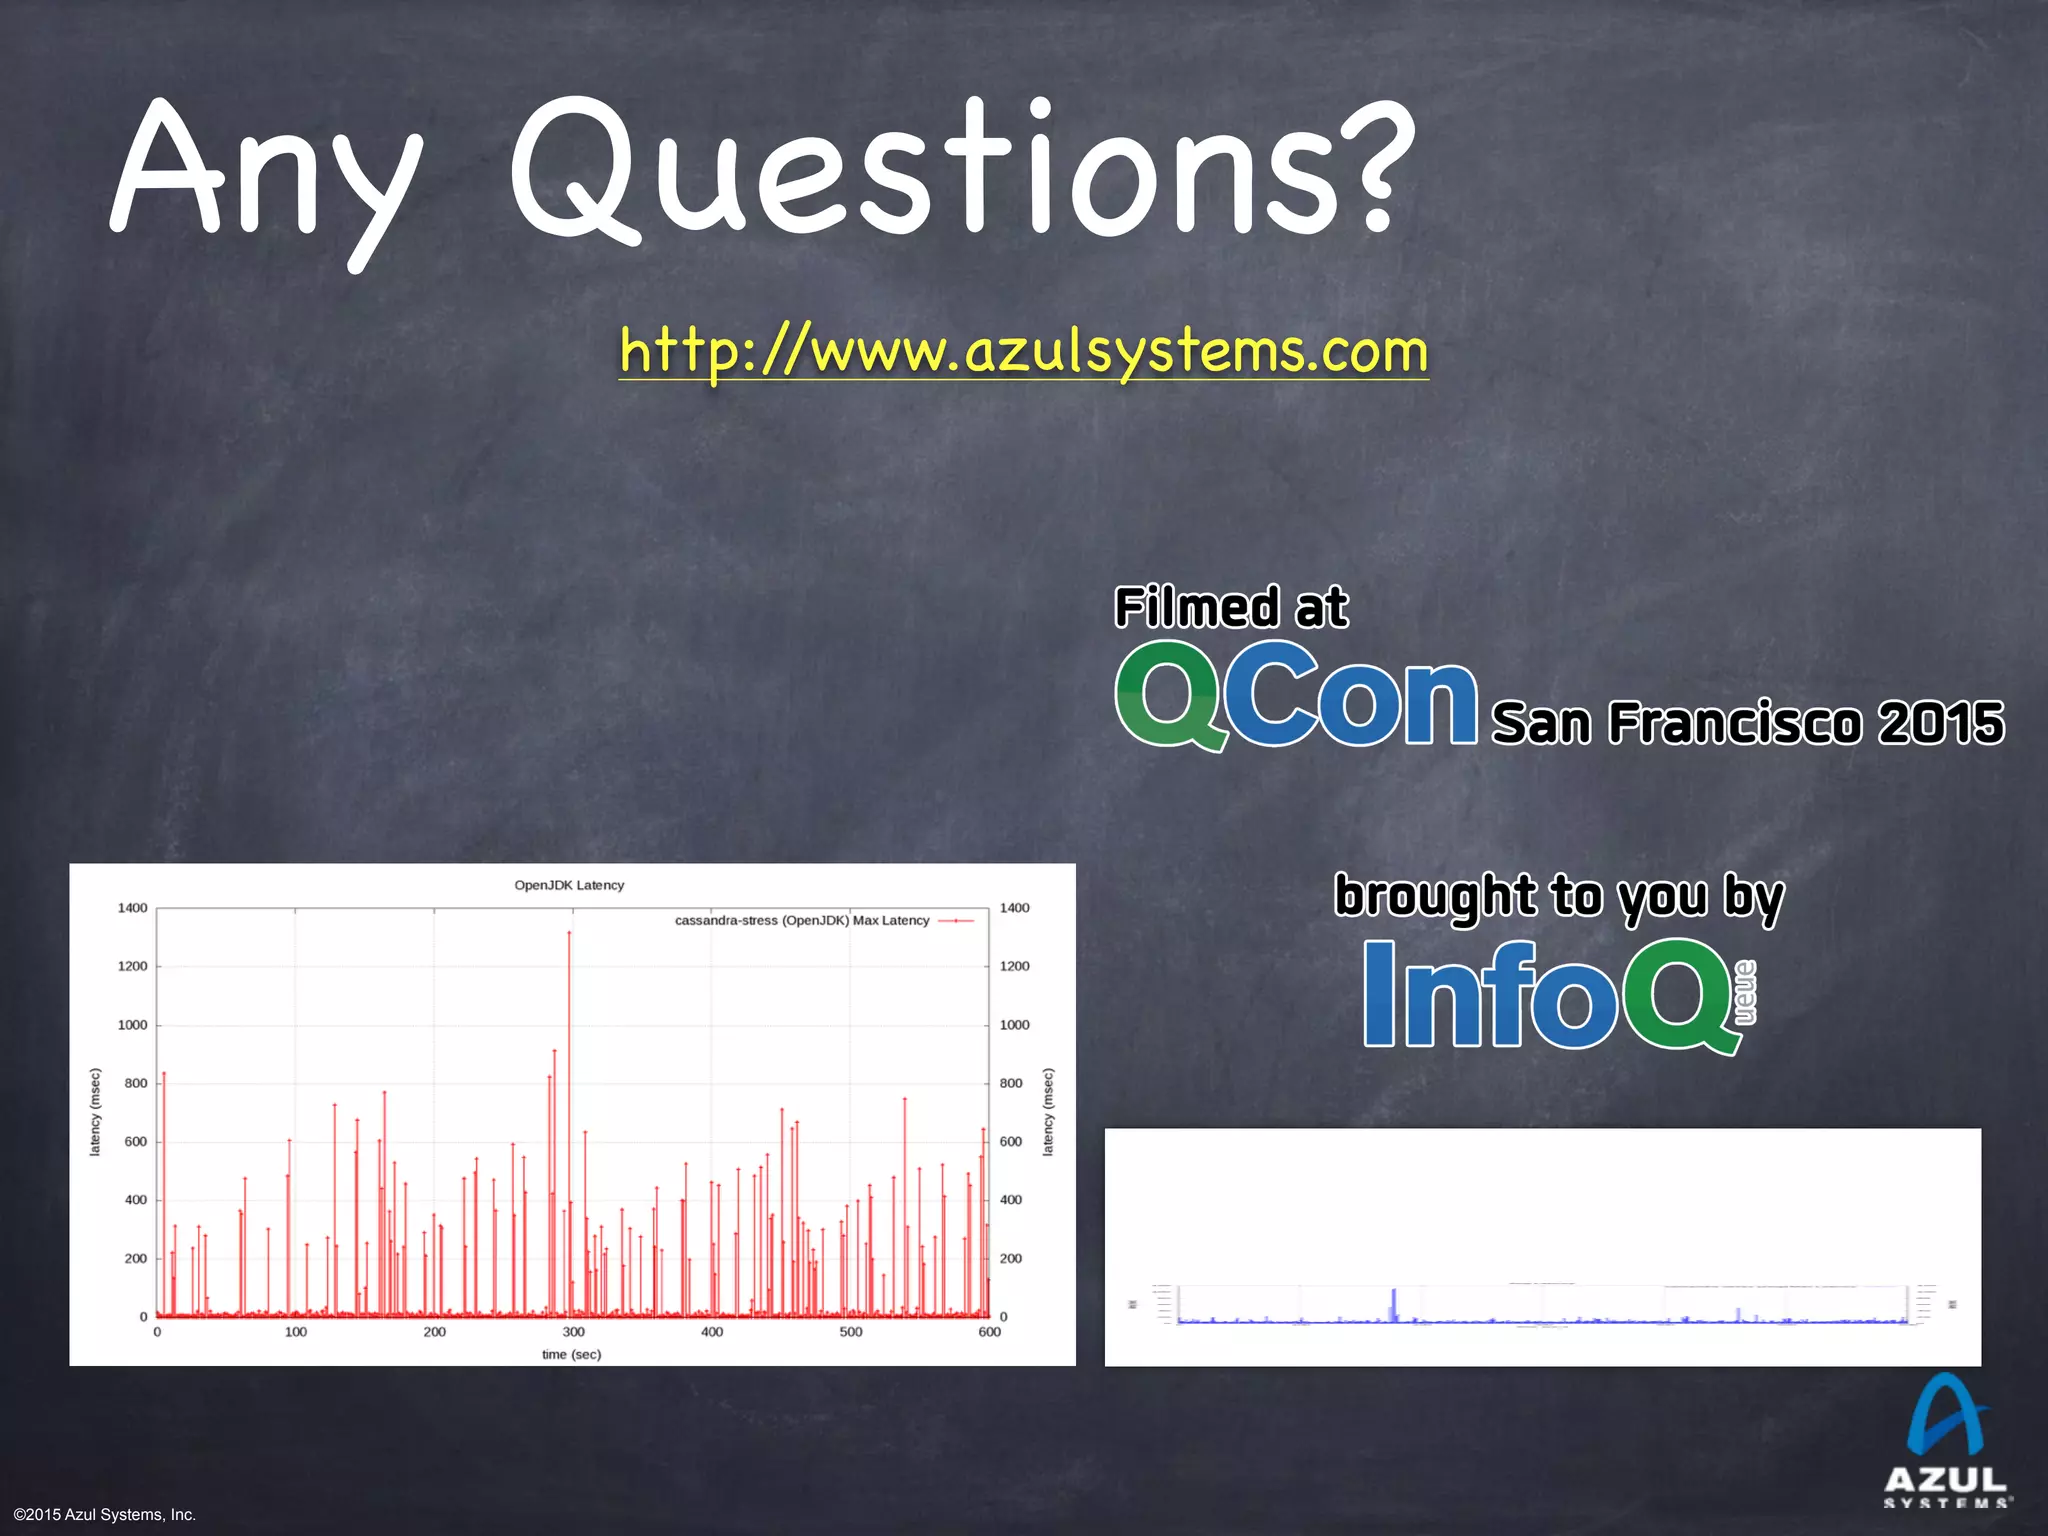

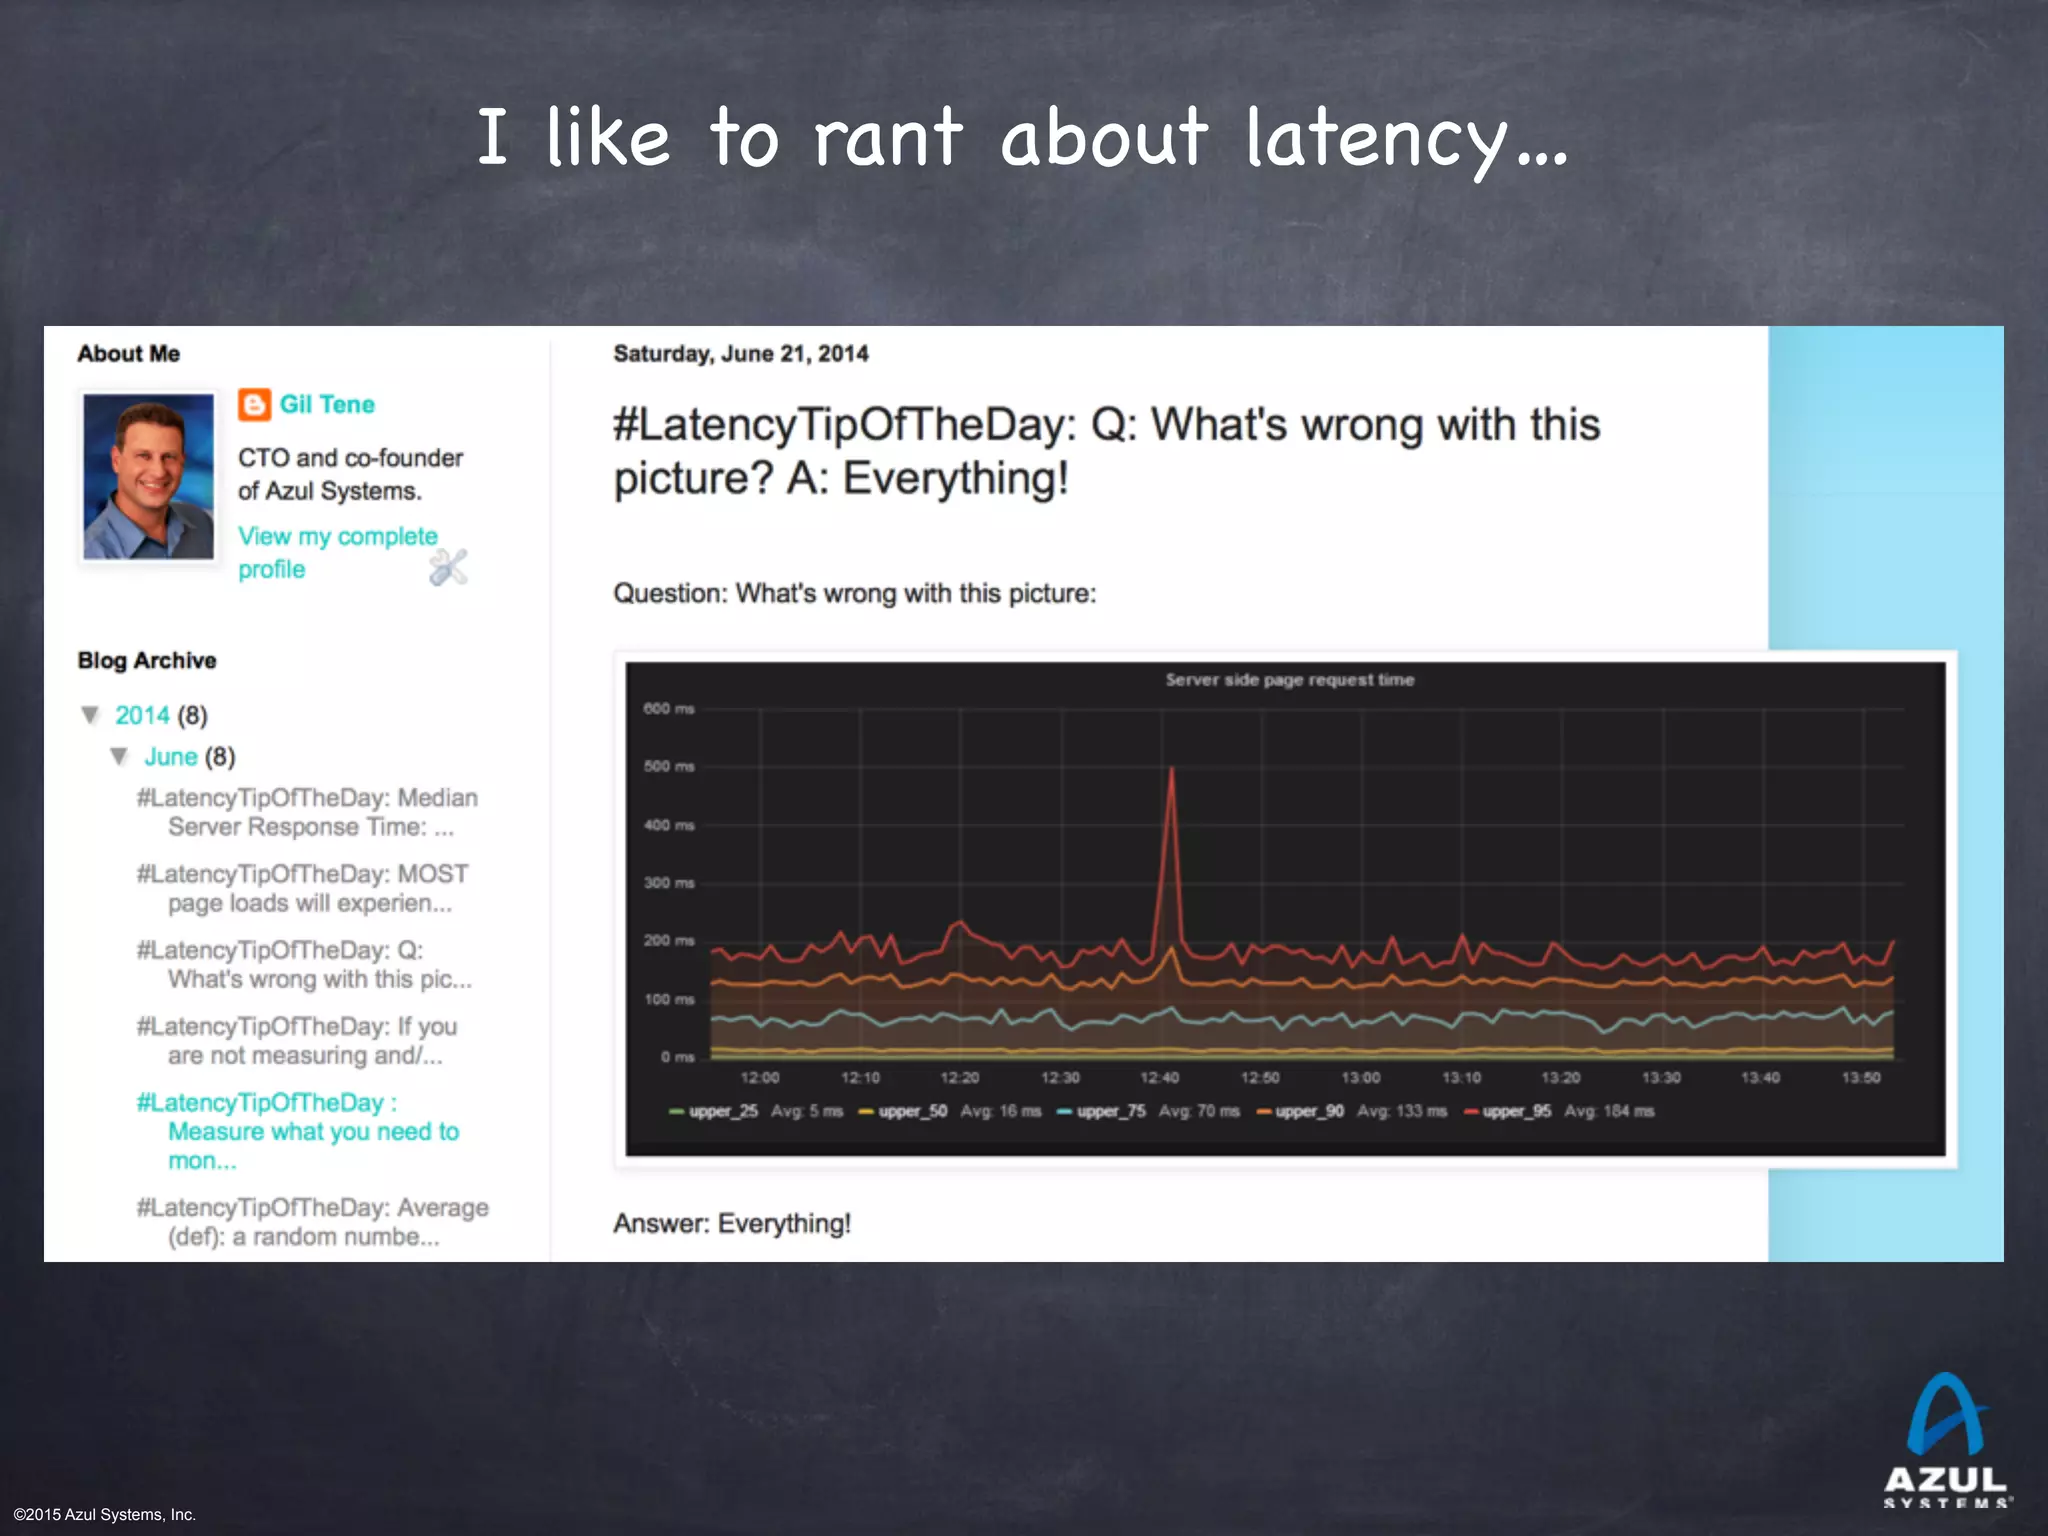
The document discusses the complexities of measuring latency in software systems, highlighting common misconceptions about percentiles and averages, particularly how they can misrepresent user experience. It emphasizes the importance of measuring the maximum latency and the pitfalls of coordinated omission in testing and monitoring. Additionally, real-world examples and statistical analyses are used to illustrate the actual behavior of latency distributions and their implications for system performance.


![Coded Agents – with UiPath SDK + LangGraph [Virtual Hands-on Workshop]](https://cdn.slidesharecdn.com/ss_thumbnails/codedagentsdeck-251215155422-5497c599-thumbnail.jpg?width=640&height=640&fit=bounds)


