SlideShare a Scribd company logo
1 of 9
Download to read offline
Data Analysis
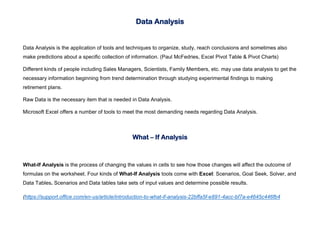
Data Analysis is the application of tools and techniques to organize, study, reach conclusions and sometimes also
make predictions about a specific collection of information. (Paul McFedries, Excel Pivot Table & Pivot Charts)
Different kinds of people including Sales Managers, Scientists, Family Members, etc. may use data analysis to get the
necessary information beginning from trend determination through studying experimental findings to making
retirement plans.
Raw Data is the necessary item that is needed in Data Analysis.
Microsoft Excel offers a number of tools to meet the most demanding needs regarding Data Analysis.
What – If Analysis
What-If Analysis is the process of changing the values in cells to see how those changes will affect the outcome of
formulas on the worksheet. Four kinds of What-If Analysis tools come with Excel: Scenarios, Goal Seek, Solver, and
Data Tables. Scenarios and Data tables take sets of input values and determine possible results.
(https://support.office.com/en-us/article/introduction-to-what-if-analysis-22bffa5f-e891-4acc-bf7a-e4645c446fb4
Scenarios: It is a collection of input values that are placed in formulas to get a result.
Goal Seek: It is used to find desired result by changing an input value.
Solver: It is used to find optimal solutions for all kind of decision issues.
Data Table: It is a range of cells where one column consists of a series of values, called input cells (
Let’s have a look at Examples:
Scenarios:
Let’s imagine that different percentage of sold items quantities have been sold at highest price and make scenarios
for these percentages including 60%, 70% and 80%.
Stores
1-Oct
2-Oct
3-Oct
4-Oct
5-Oct
6-Oct
7-Oct
Total
Store P 437 94 531 Higest Price Mid Price
Lowest
Price
Store E 56 29 49 46 49 70 43 342 % of sold idems 60% 22% 18%
Store H 52 35 42 52 60 28 18 287
Store C 36 46 38 29 55 58 22 284
Store G 14 56 28 23 55 32 31 239
Store I 22 23 13 30 62 53 29 232 Unit Profit
Number of Sold
Items
Store K 25 26 26 24 40 35 36 212 Higest Price 55 ₼ 60%
Store F 14 17 43 17 41 41 17 190 Mid Price 39 ₼ 22%
Store J 18 17 9 19 31 23 31 148 Lowest Price 25 ₼ 18%
Store A 22 20 19 29 33 11 12 146
Store M 23 13 18 13 17 27 11 122
Store D 16 19 15 7 19 13 33 122 Total Revenue 144,414.72 ₼
Store N 14 10 17 16 24 20 17 118
Store B 13 6 7 13 15 3 10 67
Store L 5 4 12 6 8 5 6 46
Store O 4 8 13 3 1 6 35
Store Q 1 2 4 3 3 13
Total 771 330 351 425 510 422 325 3,134
1. On the Data tab, in the Forecast group, click What-If Analysis
2. Click Scenario Manager
3. Add a scenario by clicking on Add
4. Type a name (80% highest), select cell L3 (% sold for the highest price) for the Changing cells and click on OK
5. Enter the corresponding value 0.8 and click on OK again
6. Next, add 2 other scenarios (70% and 60%)
Finally, your Scenario Manager should be consistent with the picture below:
Note: To see the result of a scenario, select the scenario and click on the Show button. Excel will change the value of
cell L3 accordingly for you to see the corresponding result on the sheet.
Scenario Summary
To easily compare the results of these scenarios, execute the following steps
1. Click the Summary button in the Scenario Manager
2. Next, select cell L13 (Total Revenue) for the result cell and click on OK
Result:
Conclusion: if you sell 80% for the highest price, you obtain a total revenue of 158 392.36 AZN, if you sell 70% for
the mid price, you obtain a total revenue of 151 403.54 AZN, and if you sell 60% for the lowest price you obtain a total
revenue 144 414.72 AZN. Here We Excel with what-if analysis (Scenarios) in Excel.
To be continued…

More Related Content

What's hot

1c s4 i using runcharts final
1c s4 i using runcharts final1c s4 i using runcharts final
1c s4 i using runcharts finalABCiABUHB
 
ABCi Charts - Runcharts Tool user guide
ABCi Charts - Runcharts Tool user guide ABCi Charts - Runcharts Tool user guide
ABCi Charts - Runcharts Tool user guide ABCiABUHB
 
Quality Control KPI Dashboard Showing Defects And Downtime
Quality Control KPI Dashboard Showing Defects And DowntimeQuality Control KPI Dashboard Showing Defects And Downtime
Quality Control KPI Dashboard Showing Defects And DowntimeSlideTeam
 
Performance Indicators Percentage Circle
Performance Indicators Percentage CirclePerformance Indicators Percentage Circle
Performance Indicators Percentage CircleSlideTeam
 
MS Excel Pivot Table Reports & Charts
MS Excel Pivot Table Reports & ChartsMS Excel Pivot Table Reports & Charts
MS Excel Pivot Table Reports & Chartsdnbakhan
 
Scatter diagram and control chart
Scatter diagram and control chartScatter diagram and control chart
Scatter diagram and control chartnithyanithi26
 
MS-Excel Working with Pivot Table
MS-Excel Working with Pivot TableMS-Excel Working with Pivot Table
MS-Excel Working with Pivot TableP. SUNDARI ARUN
 
WorldCat Local Lists for Serials Reporting
WorldCat Local Lists for Serials ReportingWorldCat Local Lists for Serials Reporting
WorldCat Local Lists for Serials ReportingDarinlee Needham
 
Creating a Worksheet in Calc
Creating a Worksheet in CalcCreating a Worksheet in Calc
Creating a Worksheet in Calctclanton4
 
Straight-Line Depreciation System by Excel (MS Word Texs)
Straight-Line Depreciation System by Excel (MS Word Texs)Straight-Line Depreciation System by Excel (MS Word Texs)
Straight-Line Depreciation System by Excel (MS Word Texs)Excel Accounting Software
 
Downloaded open data
Downloaded open dataDownloaded open data
Downloaded open dataNoel Hatch
 
Working with Pivot Tables
Working with Pivot TablesWorking with Pivot Tables
Working with Pivot TablesKingston Tagoe
 
Excel tips: How to use Conditional Formatting Tables
Excel tips: How to use Conditional Formatting TablesExcel tips: How to use Conditional Formatting Tables
Excel tips: How to use Conditional Formatting TablesStefania Borchia
 
Kpi Executive Dashboard
Kpi Executive DashboardKpi Executive Dashboard
Kpi Executive Dashboardinflow
 
Excel test review
Excel test reviewExcel test review
Excel test reviewLisa Stack
 
Excel: Sensitivity Analysis with data tables
Excel: Sensitivity Analysis with data tablesExcel: Sensitivity Analysis with data tables
Excel: Sensitivity Analysis with data tablesStefania Borchia
 
6.6 Creating Calculated Controls
6.6 Creating Calculated Controls6.6 Creating Calculated Controls
6.6 Creating Calculated ControlsPyi Soe
 

What's hot (20)

1c s4 i using runcharts final
1c s4 i using runcharts final1c s4 i using runcharts final
1c s4 i using runcharts final
 
ABCi Charts - Runcharts Tool user guide
ABCi Charts - Runcharts Tool user guide ABCi Charts - Runcharts Tool user guide
ABCi Charts - Runcharts Tool user guide
 
Quality Control KPI Dashboard Showing Defects And Downtime
Quality Control KPI Dashboard Showing Defects And DowntimeQuality Control KPI Dashboard Showing Defects And Downtime
Quality Control KPI Dashboard Showing Defects And Downtime
 
Performance Indicators Percentage Circle
Performance Indicators Percentage CirclePerformance Indicators Percentage Circle
Performance Indicators Percentage Circle
 
Scenarios
ScenariosScenarios
Scenarios
 
MS Excel Pivot Table Reports & Charts
MS Excel Pivot Table Reports & ChartsMS Excel Pivot Table Reports & Charts
MS Excel Pivot Table Reports & Charts
 
Graphs, pareto
Graphs, paretoGraphs, pareto
Graphs, pareto
 
Straight-Line Depreciation System by Excel
Straight-Line Depreciation System by ExcelStraight-Line Depreciation System by Excel
Straight-Line Depreciation System by Excel
 
Scatter diagram and control chart
Scatter diagram and control chartScatter diagram and control chart
Scatter diagram and control chart
 
MS-Excel Working with Pivot Table
MS-Excel Working with Pivot TableMS-Excel Working with Pivot Table
MS-Excel Working with Pivot Table
 
WorldCat Local Lists for Serials Reporting
WorldCat Local Lists for Serials ReportingWorldCat Local Lists for Serials Reporting
WorldCat Local Lists for Serials Reporting
 
Creating a Worksheet in Calc
Creating a Worksheet in CalcCreating a Worksheet in Calc
Creating a Worksheet in Calc
 
Straight-Line Depreciation System by Excel (MS Word Texs)
Straight-Line Depreciation System by Excel (MS Word Texs)Straight-Line Depreciation System by Excel (MS Word Texs)
Straight-Line Depreciation System by Excel (MS Word Texs)
 
Downloaded open data
Downloaded open dataDownloaded open data
Downloaded open data
 
Working with Pivot Tables
Working with Pivot TablesWorking with Pivot Tables
Working with Pivot Tables
 
Excel tips: How to use Conditional Formatting Tables
Excel tips: How to use Conditional Formatting TablesExcel tips: How to use Conditional Formatting Tables
Excel tips: How to use Conditional Formatting Tables
 
Kpi Executive Dashboard
Kpi Executive DashboardKpi Executive Dashboard
Kpi Executive Dashboard
 
Excel test review
Excel test reviewExcel test review
Excel test review
 
Excel: Sensitivity Analysis with data tables
Excel: Sensitivity Analysis with data tablesExcel: Sensitivity Analysis with data tables
Excel: Sensitivity Analysis with data tables
 
6.6 Creating Calculated Controls
6.6 Creating Calculated Controls6.6 Creating Calculated Controls
6.6 Creating Calculated Controls
 

Similar to Data analysis scenarios

Sheet1ASSIGNMENTBeeGee Company, operating at full capacity, sold 1.docx
Sheet1ASSIGNMENTBeeGee Company, operating at full capacity, sold 1.docxSheet1ASSIGNMENTBeeGee Company, operating at full capacity, sold 1.docx
Sheet1ASSIGNMENTBeeGee Company, operating at full capacity, sold 1.docxbagotjesusa
 
qc-tools.ppt
qc-tools.pptqc-tools.ppt
qc-tools.pptAlpharoot
 
Empowerment Technology Lesson 4
Empowerment Technology Lesson 4Empowerment Technology Lesson 4
Empowerment Technology Lesson 4alicelagajino
 
Lesson 18 Creating Pivot Tables
Lesson 18 Creating Pivot TablesLesson 18 Creating Pivot Tables
Lesson 18 Creating Pivot Tablesguevarra_2000
 
Solved Practice questions for Microsoft Querying Data with Transact-SQL 70-76...
Solved Practice questions for Microsoft Querying Data with Transact-SQL 70-76...Solved Practice questions for Microsoft Querying Data with Transact-SQL 70-76...
Solved Practice questions for Microsoft Querying Data with Transact-SQL 70-76...KarenMiner
 
MAT 240 Random Sampling in Excel Tutorial This tutorial wi
MAT 240 Random Sampling in Excel Tutorial This tutorial wiMAT 240 Random Sampling in Excel Tutorial This tutorial wi
MAT 240 Random Sampling in Excel Tutorial This tutorial wiAbramMartino96
 
MAT 240 Random Sampling in Excel Tutorial This tutorial wi
MAT 240 Random Sampling in Excel Tutorial This tutorial wiMAT 240 Random Sampling in Excel Tutorial This tutorial wi
MAT 240 Random Sampling in Excel Tutorial This tutorial wiAbramMartino96
 
Elementary Data Analysis with MS Excel_Day-4
Elementary Data Analysis with MS Excel_Day-4Elementary Data Analysis with MS Excel_Day-4
Elementary Data Analysis with MS Excel_Day-4Redwan Ferdous
 
MAT 240 Creating Histograms in Excel This tutorial wil
MAT 240 Creating Histograms in Excel   This tutorial wilMAT 240 Creating Histograms in Excel   This tutorial wil
MAT 240 Creating Histograms in Excel This tutorial wilAbramMartino96
 
MAT 240 Creating Histograms in Excel This tutorial wil
MAT 240 Creating Histograms in Excel   This tutorial wilMAT 240 Creating Histograms in Excel   This tutorial wil
MAT 240 Creating Histograms in Excel This tutorial wilAbramMartino96
 
Basic Analytics Module for Sponsors
Basic Analytics Module for SponsorsBasic Analytics Module for Sponsors
Basic Analytics Module for SponsorsDee Daley
 
STAT 3309SOS 3312 Excel AssignmentUsing the Excel file ST.docx
STAT 3309SOS 3312 Excel AssignmentUsing the Excel file ST.docxSTAT 3309SOS 3312 Excel AssignmentUsing the Excel file ST.docx
STAT 3309SOS 3312 Excel AssignmentUsing the Excel file ST.docxdessiechisomjj4
 
Chap13 intro to multiple regression
Chap13 intro to multiple regressionChap13 intro to multiple regression
Chap13 intro to multiple regressionUni Azza Aunillah
 

Similar to Data analysis scenarios (20)

Sheet1ASSIGNMENTBeeGee Company, operating at full capacity, sold 1.docx
Sheet1ASSIGNMENTBeeGee Company, operating at full capacity, sold 1.docxSheet1ASSIGNMENTBeeGee Company, operating at full capacity, sold 1.docx
Sheet1ASSIGNMENTBeeGee Company, operating at full capacity, sold 1.docx
 
Training Module
Training ModuleTraining Module
Training Module
 
qc-tools.ppt
qc-tools.pptqc-tools.ppt
qc-tools.ppt
 
Chapter.08
Chapter.08Chapter.08
Chapter.08
 
Empowerment Technology Lesson 4
Empowerment Technology Lesson 4Empowerment Technology Lesson 4
Empowerment Technology Lesson 4
 
Lesson 18 Creating Pivot Tables
Lesson 18 Creating Pivot TablesLesson 18 Creating Pivot Tables
Lesson 18 Creating Pivot Tables
 
Solved Practice questions for Microsoft Querying Data with Transact-SQL 70-76...
Solved Practice questions for Microsoft Querying Data with Transact-SQL 70-76...Solved Practice questions for Microsoft Querying Data with Transact-SQL 70-76...
Solved Practice questions for Microsoft Querying Data with Transact-SQL 70-76...
 
The Suitcase Case
The Suitcase CaseThe Suitcase Case
The Suitcase Case
 
MAT 240 Random Sampling in Excel Tutorial This tutorial wi
MAT 240 Random Sampling in Excel Tutorial This tutorial wiMAT 240 Random Sampling in Excel Tutorial This tutorial wi
MAT 240 Random Sampling in Excel Tutorial This tutorial wi
 
MAT 240 Random Sampling in Excel Tutorial This tutorial wi
MAT 240 Random Sampling in Excel Tutorial This tutorial wiMAT 240 Random Sampling in Excel Tutorial This tutorial wi
MAT 240 Random Sampling in Excel Tutorial This tutorial wi
 
CHAPTER 7.pptx
CHAPTER 7.pptxCHAPTER 7.pptx
CHAPTER 7.pptx
 
Elementary Data Analysis with MS Excel_Day-4
Elementary Data Analysis with MS Excel_Day-4Elementary Data Analysis with MS Excel_Day-4
Elementary Data Analysis with MS Excel_Day-4
 
MAT 240 Creating Histograms in Excel This tutorial wil
MAT 240 Creating Histograms in Excel   This tutorial wilMAT 240 Creating Histograms in Excel   This tutorial wil
MAT 240 Creating Histograms in Excel This tutorial wil
 
MAT 240 Creating Histograms in Excel This tutorial wil
MAT 240 Creating Histograms in Excel   This tutorial wilMAT 240 Creating Histograms in Excel   This tutorial wil
MAT 240 Creating Histograms in Excel This tutorial wil
 
Notes Chapter 3.pptx
Notes Chapter 3.pptxNotes Chapter 3.pptx
Notes Chapter 3.pptx
 
50 MS Excel Tips and Tricks
50 MS Excel Tips and Tricks 50 MS Excel Tips and Tricks
50 MS Excel Tips and Tricks
 
Basic Analytics Module for Sponsors
Basic Analytics Module for SponsorsBasic Analytics Module for Sponsors
Basic Analytics Module for Sponsors
 
7 qc tools
7 qc tools7 qc tools
7 qc tools
 
STAT 3309SOS 3312 Excel AssignmentUsing the Excel file ST.docx
STAT 3309SOS 3312 Excel AssignmentUsing the Excel file ST.docxSTAT 3309SOS 3312 Excel AssignmentUsing the Excel file ST.docx
STAT 3309SOS 3312 Excel AssignmentUsing the Excel file ST.docx
 
Chap13 intro to multiple regression
Chap13 intro to multiple regressionChap13 intro to multiple regression
Chap13 intro to multiple regression
 

More from Ilgar Zarbaliyev

Calculating Bank Withdrawal Interest and Time A Helpful Template.pdf
Calculating Bank Withdrawal Interest and Time A Helpful Template.pdfCalculating Bank Withdrawal Interest and Time A Helpful Template.pdf
Calculating Bank Withdrawal Interest and Time A Helpful Template.pdfIlgar Zarbaliyev
 
Row, Column, Index, Match, Offset Functions. Excel Tutorial
Row, Column, Index, Match, Offset Functions. Excel TutorialRow, Column, Index, Match, Offset Functions. Excel Tutorial
Row, Column, Index, Match, Offset Functions. Excel TutorialIlgar Zarbaliyev
 
New Dynamic Array Functions. Excel Tutorial
New Dynamic Array Functions. Excel TutorialNew Dynamic Array Functions. Excel Tutorial
New Dynamic Array Functions. Excel TutorialIlgar Zarbaliyev
 
Fill series. Data validation. Excel Tutorial
Fill series. Data validation. Excel TutorialFill series. Data validation. Excel Tutorial
Fill series. Data validation. Excel TutorialIlgar Zarbaliyev
 
Sales Analysis Power BI Dashboard
Sales Analysis Power BI DashboardSales Analysis Power BI Dashboard
Sales Analysis Power BI DashboardIlgar Zarbaliyev
 
What if-analysis scenarios
What if-analysis scenariosWhat if-analysis scenarios
What if-analysis scenariosIlgar Zarbaliyev
 
Dynamic Amortization Schedule
Dynamic Amortization ScheduleDynamic Amortization Schedule
Dynamic Amortization ScheduleIlgar Zarbaliyev
 
Static Amortization Schedule
Static Amortization ScheduleStatic Amortization Schedule
Static Amortization ScheduleIlgar Zarbaliyev
 
Casings Transactions Spreadsheet
Casings Transactions SpreadsheetCasings Transactions Spreadsheet
Casings Transactions SpreadsheetIlgar Zarbaliyev
 
Credit or investment calculation template
Credit or investment calculation templateCredit or investment calculation template
Credit or investment calculation templateIlgar Zarbaliyev
 
Moving average and linear forecast 6
Moving average and linear forecast 6Moving average and linear forecast 6
Moving average and linear forecast 6Ilgar Zarbaliyev
 
Excel shortcuts formula related
Excel shortcuts formula relatedExcel shortcuts formula related
Excel shortcuts formula relatedIlgar Zarbaliyev
 

More from Ilgar Zarbaliyev (20)

Calculating Bank Withdrawal Interest and Time A Helpful Template.pdf
Calculating Bank Withdrawal Interest and Time A Helpful Template.pdfCalculating Bank Withdrawal Interest and Time A Helpful Template.pdf
Calculating Bank Withdrawal Interest and Time A Helpful Template.pdf
 
Row, Column, Index, Match, Offset Functions. Excel Tutorial
Row, Column, Index, Match, Offset Functions. Excel TutorialRow, Column, Index, Match, Offset Functions. Excel Tutorial
Row, Column, Index, Match, Offset Functions. Excel Tutorial
 
New Dynamic Array Functions. Excel Tutorial
New Dynamic Array Functions. Excel TutorialNew Dynamic Array Functions. Excel Tutorial
New Dynamic Array Functions. Excel Tutorial
 
Fill series. Data validation. Excel Tutorial
Fill series. Data validation. Excel TutorialFill series. Data validation. Excel Tutorial
Fill series. Data validation. Excel Tutorial
 
HR Insights
HR InsightsHR Insights
HR Insights
 
Sales Analysis Power BI Dashboard
Sales Analysis Power BI DashboardSales Analysis Power BI Dashboard
Sales Analysis Power BI Dashboard
 
SUPPLIERS INSIGHTS
SUPPLIERS INSIGHTSSUPPLIERS INSIGHTS
SUPPLIERS INSIGHTS
 
What if-analysis scenarios
What if-analysis scenariosWhat if-analysis scenarios
What if-analysis scenarios
 
Recipe
RecipeRecipe
Recipe
 
Dynamic Amortization Schedule
Dynamic Amortization ScheduleDynamic Amortization Schedule
Dynamic Amortization Schedule
 
Static Amortization Schedule
Static Amortization ScheduleStatic Amortization Schedule
Static Amortization Schedule
 
Casings Transactions Spreadsheet
Casings Transactions SpreadsheetCasings Transactions Spreadsheet
Casings Transactions Spreadsheet
 
Credit or investment calculation template
Credit or investment calculation templateCredit or investment calculation template
Credit or investment calculation template
 
Moving average and linear forecast 6
Moving average and linear forecast 6Moving average and linear forecast 6
Moving average and linear forecast 6
 
Migration Tornado Chart
Migration Tornado ChartMigration Tornado Chart
Migration Tornado Chart
 
Dynamic diagram
Dynamic diagramDynamic diagram
Dynamic diagram
 
Sales dashboard
Sales  dashboardSales  dashboard
Sales dashboard
 
Excel shortcuts formula related
Excel shortcuts formula relatedExcel shortcuts formula related
Excel shortcuts formula related
 
Excel olympics conference
Excel olympics conferenceExcel olympics conference
Excel olympics conference
 
Cell references
Cell referencesCell references
Cell references
 

Recently uploaded

20240419 - Measurecamp Amsterdam - SAM.pdf
20240419 - Measurecamp Amsterdam - SAM.pdf20240419 - Measurecamp Amsterdam - SAM.pdf
20240419 - Measurecamp Amsterdam - SAM.pdfHuman37
 
Customer Service Analytics - Make Sense of All Your Data.pptx
Customer Service Analytics - Make Sense of All Your Data.pptxCustomer Service Analytics - Make Sense of All Your Data.pptx
Customer Service Analytics - Make Sense of All Your Data.pptxEmmanuel Dauda
 
From idea to production in a day – Leveraging Azure ML and Streamlit to build...
From idea to production in a day – Leveraging Azure ML and Streamlit to build...From idea to production in a day – Leveraging Azure ML and Streamlit to build...
From idea to production in a day – Leveraging Azure ML and Streamlit to build...Florian Roscheck
 
Data Science Jobs and Salaries Analysis.pptx
Data Science Jobs and Salaries Analysis.pptxData Science Jobs and Salaries Analysis.pptx
Data Science Jobs and Salaries Analysis.pptxFurkanTasci3
 
Indian Call Girls in Abu Dhabi O5286O24O8 Call Girls in Abu Dhabi By Independ...
Indian Call Girls in Abu Dhabi O5286O24O8 Call Girls in Abu Dhabi By Independ...Indian Call Girls in Abu Dhabi O5286O24O8 Call Girls in Abu Dhabi By Independ...
Indian Call Girls in Abu Dhabi O5286O24O8 Call Girls in Abu Dhabi By Independ...dajasot375
 
꧁❤ Greater Noida Call Girls Delhi ❤꧂ 9711199171 ☎️ Hard And Sexy Vip Call
꧁❤ Greater Noida Call Girls Delhi ❤꧂ 9711199171 ☎️ Hard And Sexy Vip Call꧁❤ Greater Noida Call Girls Delhi ❤꧂ 9711199171 ☎️ Hard And Sexy Vip Call
꧁❤ Greater Noida Call Girls Delhi ❤꧂ 9711199171 ☎️ Hard And Sexy Vip Callshivangimorya083
 
VIP High Profile Call Girls Amravati Aarushi 8250192130 Independent Escort Se...
VIP High Profile Call Girls Amravati Aarushi 8250192130 Independent Escort Se...VIP High Profile Call Girls Amravati Aarushi 8250192130 Independent Escort Se...
VIP High Profile Call Girls Amravati Aarushi 8250192130 Independent Escort Se...Suhani Kapoor
 
Call Girls In Mahipalpur O9654467111 Escorts Service
Call Girls In Mahipalpur O9654467111  Escorts ServiceCall Girls In Mahipalpur O9654467111  Escorts Service
Call Girls In Mahipalpur O9654467111 Escorts ServiceSapana Sha
 
04242024_CCC TUG_Joins and Relationships
04242024_CCC TUG_Joins and Relationships04242024_CCC TUG_Joins and Relationships
04242024_CCC TUG_Joins and Relationshipsccctableauusergroup
 
Ukraine War presentation: KNOW THE BASICS
Ukraine War presentation: KNOW THE BASICSUkraine War presentation: KNOW THE BASICS
Ukraine War presentation: KNOW THE BASICSAishani27
 
(PARI) Call Girls Wanowrie ( 7001035870 ) HI-Fi Pune Escorts Service
(PARI) Call Girls Wanowrie ( 7001035870 ) HI-Fi Pune Escorts Service(PARI) Call Girls Wanowrie ( 7001035870 ) HI-Fi Pune Escorts Service
(PARI) Call Girls Wanowrie ( 7001035870 ) HI-Fi Pune Escorts Serviceranjana rawat
 
Call Girls In Noida City Center Metro 24/7✡️9711147426✡️ Escorts Service
Call Girls In Noida City Center Metro 24/7✡️9711147426✡️ Escorts ServiceCall Girls In Noida City Center Metro 24/7✡️9711147426✡️ Escorts Service
Call Girls In Noida City Center Metro 24/7✡️9711147426✡️ Escorts Servicejennyeacort
 
Low Rate Call Girls Bhilai Anika 8250192130 Independent Escort Service Bhilai
Low Rate Call Girls Bhilai Anika 8250192130 Independent Escort Service BhilaiLow Rate Call Girls Bhilai Anika 8250192130 Independent Escort Service Bhilai
Low Rate Call Girls Bhilai Anika 8250192130 Independent Escort Service BhilaiSuhani Kapoor
 
dokumen.tips_chapter-4-transient-heat-conduction-mehmet-kanoglu.ppt
dokumen.tips_chapter-4-transient-heat-conduction-mehmet-kanoglu.pptdokumen.tips_chapter-4-transient-heat-conduction-mehmet-kanoglu.ppt
dokumen.tips_chapter-4-transient-heat-conduction-mehmet-kanoglu.pptSonatrach
 
VIP Call Girls Service Miyapur Hyderabad Call +91-8250192130
VIP Call Girls Service Miyapur Hyderabad Call +91-8250192130VIP Call Girls Service Miyapur Hyderabad Call +91-8250192130
VIP Call Girls Service Miyapur Hyderabad Call +91-8250192130Suhani Kapoor
 
RA-11058_IRR-COMPRESS Do 198 series of 1998
RA-11058_IRR-COMPRESS Do 198 series of 1998RA-11058_IRR-COMPRESS Do 198 series of 1998
RA-11058_IRR-COMPRESS Do 198 series of 1998YohFuh
 
Beautiful Sapna Vip Call Girls Hauz Khas 9711199012 Call /Whatsapps
Beautiful Sapna Vip  Call Girls Hauz Khas 9711199012 Call /WhatsappsBeautiful Sapna Vip  Call Girls Hauz Khas 9711199012 Call /Whatsapps
Beautiful Sapna Vip Call Girls Hauz Khas 9711199012 Call /Whatsappssapnasaifi408
 
Industrialised data - the key to AI success.pdf
Industrialised data - the key to AI success.pdfIndustrialised data - the key to AI success.pdf
Industrialised data - the key to AI success.pdfLars Albertsson
 
Full night 🥵 Call Girls Delhi New Friends Colony {9711199171} Sanya Reddy ✌️o...
Full night 🥵 Call Girls Delhi New Friends Colony {9711199171} Sanya Reddy ✌️o...Full night 🥵 Call Girls Delhi New Friends Colony {9711199171} Sanya Reddy ✌️o...
Full night 🥵 Call Girls Delhi New Friends Colony {9711199171} Sanya Reddy ✌️o...shivangimorya083
 
Brighton SEO | April 2024 | Data Storytelling
Brighton SEO | April 2024 | Data StorytellingBrighton SEO | April 2024 | Data Storytelling
Brighton SEO | April 2024 | Data StorytellingNeil Barnes
 

Recently uploaded (20)

20240419 - Measurecamp Amsterdam - SAM.pdf
20240419 - Measurecamp Amsterdam - SAM.pdf20240419 - Measurecamp Amsterdam - SAM.pdf
20240419 - Measurecamp Amsterdam - SAM.pdf
 
Customer Service Analytics - Make Sense of All Your Data.pptx
Customer Service Analytics - Make Sense of All Your Data.pptxCustomer Service Analytics - Make Sense of All Your Data.pptx
Customer Service Analytics - Make Sense of All Your Data.pptx
 
From idea to production in a day – Leveraging Azure ML and Streamlit to build...
From idea to production in a day – Leveraging Azure ML and Streamlit to build...From idea to production in a day – Leveraging Azure ML and Streamlit to build...
From idea to production in a day – Leveraging Azure ML and Streamlit to build...
 
Data Science Jobs and Salaries Analysis.pptx
Data Science Jobs and Salaries Analysis.pptxData Science Jobs and Salaries Analysis.pptx
Data Science Jobs and Salaries Analysis.pptx
 
Indian Call Girls in Abu Dhabi O5286O24O8 Call Girls in Abu Dhabi By Independ...
Indian Call Girls in Abu Dhabi O5286O24O8 Call Girls in Abu Dhabi By Independ...Indian Call Girls in Abu Dhabi O5286O24O8 Call Girls in Abu Dhabi By Independ...
Indian Call Girls in Abu Dhabi O5286O24O8 Call Girls in Abu Dhabi By Independ...
 
꧁❤ Greater Noida Call Girls Delhi ❤꧂ 9711199171 ☎️ Hard And Sexy Vip Call
꧁❤ Greater Noida Call Girls Delhi ❤꧂ 9711199171 ☎️ Hard And Sexy Vip Call꧁❤ Greater Noida Call Girls Delhi ❤꧂ 9711199171 ☎️ Hard And Sexy Vip Call
꧁❤ Greater Noida Call Girls Delhi ❤꧂ 9711199171 ☎️ Hard And Sexy Vip Call
 
VIP High Profile Call Girls Amravati Aarushi 8250192130 Independent Escort Se...
VIP High Profile Call Girls Amravati Aarushi 8250192130 Independent Escort Se...VIP High Profile Call Girls Amravati Aarushi 8250192130 Independent Escort Se...
VIP High Profile Call Girls Amravati Aarushi 8250192130 Independent Escort Se...
 
Call Girls In Mahipalpur O9654467111 Escorts Service
Call Girls In Mahipalpur O9654467111  Escorts ServiceCall Girls In Mahipalpur O9654467111  Escorts Service
Call Girls In Mahipalpur O9654467111 Escorts Service
 
04242024_CCC TUG_Joins and Relationships
04242024_CCC TUG_Joins and Relationships04242024_CCC TUG_Joins and Relationships
04242024_CCC TUG_Joins and Relationships
 
Ukraine War presentation: KNOW THE BASICS
Ukraine War presentation: KNOW THE BASICSUkraine War presentation: KNOW THE BASICS
Ukraine War presentation: KNOW THE BASICS
 
(PARI) Call Girls Wanowrie ( 7001035870 ) HI-Fi Pune Escorts Service
(PARI) Call Girls Wanowrie ( 7001035870 ) HI-Fi Pune Escorts Service(PARI) Call Girls Wanowrie ( 7001035870 ) HI-Fi Pune Escorts Service
(PARI) Call Girls Wanowrie ( 7001035870 ) HI-Fi Pune Escorts Service
 
Call Girls In Noida City Center Metro 24/7✡️9711147426✡️ Escorts Service
Call Girls In Noida City Center Metro 24/7✡️9711147426✡️ Escorts ServiceCall Girls In Noida City Center Metro 24/7✡️9711147426✡️ Escorts Service
Call Girls In Noida City Center Metro 24/7✡️9711147426✡️ Escorts Service
 
Low Rate Call Girls Bhilai Anika 8250192130 Independent Escort Service Bhilai
Low Rate Call Girls Bhilai Anika 8250192130 Independent Escort Service BhilaiLow Rate Call Girls Bhilai Anika 8250192130 Independent Escort Service Bhilai
Low Rate Call Girls Bhilai Anika 8250192130 Independent Escort Service Bhilai
 
dokumen.tips_chapter-4-transient-heat-conduction-mehmet-kanoglu.ppt
dokumen.tips_chapter-4-transient-heat-conduction-mehmet-kanoglu.pptdokumen.tips_chapter-4-transient-heat-conduction-mehmet-kanoglu.ppt
dokumen.tips_chapter-4-transient-heat-conduction-mehmet-kanoglu.ppt
 
VIP Call Girls Service Miyapur Hyderabad Call +91-8250192130
VIP Call Girls Service Miyapur Hyderabad Call +91-8250192130VIP Call Girls Service Miyapur Hyderabad Call +91-8250192130
VIP Call Girls Service Miyapur Hyderabad Call +91-8250192130
 
RA-11058_IRR-COMPRESS Do 198 series of 1998
RA-11058_IRR-COMPRESS Do 198 series of 1998RA-11058_IRR-COMPRESS Do 198 series of 1998
RA-11058_IRR-COMPRESS Do 198 series of 1998
 
Beautiful Sapna Vip Call Girls Hauz Khas 9711199012 Call /Whatsapps
Beautiful Sapna Vip  Call Girls Hauz Khas 9711199012 Call /WhatsappsBeautiful Sapna Vip  Call Girls Hauz Khas 9711199012 Call /Whatsapps
Beautiful Sapna Vip Call Girls Hauz Khas 9711199012 Call /Whatsapps
 
Industrialised data - the key to AI success.pdf
Industrialised data - the key to AI success.pdfIndustrialised data - the key to AI success.pdf
Industrialised data - the key to AI success.pdf
 
Full night 🥵 Call Girls Delhi New Friends Colony {9711199171} Sanya Reddy ✌️o...
Full night 🥵 Call Girls Delhi New Friends Colony {9711199171} Sanya Reddy ✌️o...Full night 🥵 Call Girls Delhi New Friends Colony {9711199171} Sanya Reddy ✌️o...
Full night 🥵 Call Girls Delhi New Friends Colony {9711199171} Sanya Reddy ✌️o...
 
Brighton SEO | April 2024 | Data Storytelling
Brighton SEO | April 2024 | Data StorytellingBrighton SEO | April 2024 | Data Storytelling
Brighton SEO | April 2024 | Data Storytelling
 

Data analysis scenarios

  • 1. Data Analysis Data Analysis is the application of tools and techniques to organize, study, reach conclusions and sometimes also make predictions about a specific collection of information. (Paul McFedries, Excel Pivot Table & Pivot Charts) Different kinds of people including Sales Managers, Scientists, Family Members, etc. may use data analysis to get the necessary information beginning from trend determination through studying experimental findings to making retirement plans. Raw Data is the necessary item that is needed in Data Analysis. Microsoft Excel offers a number of tools to meet the most demanding needs regarding Data Analysis. What – If Analysis What-If Analysis is the process of changing the values in cells to see how those changes will affect the outcome of formulas on the worksheet. Four kinds of What-If Analysis tools come with Excel: Scenarios, Goal Seek, Solver, and Data Tables. Scenarios and Data tables take sets of input values and determine possible results. (https://support.office.com/en-us/article/introduction-to-what-if-analysis-22bffa5f-e891-4acc-bf7a-e4645c446fb4
  • 2. Scenarios: It is a collection of input values that are placed in formulas to get a result. Goal Seek: It is used to find desired result by changing an input value. Solver: It is used to find optimal solutions for all kind of decision issues. Data Table: It is a range of cells where one column consists of a series of values, called input cells ( Let’s have a look at Examples: Scenarios: Let’s imagine that different percentage of sold items quantities have been sold at highest price and make scenarios for these percentages including 60%, 70% and 80%.
  • 3. Stores 1-Oct 2-Oct 3-Oct 4-Oct 5-Oct 6-Oct 7-Oct Total Store P 437 94 531 Higest Price Mid Price Lowest Price Store E 56 29 49 46 49 70 43 342 % of sold idems 60% 22% 18% Store H 52 35 42 52 60 28 18 287 Store C 36 46 38 29 55 58 22 284 Store G 14 56 28 23 55 32 31 239 Store I 22 23 13 30 62 53 29 232 Unit Profit Number of Sold Items Store K 25 26 26 24 40 35 36 212 Higest Price 55 ₼ 60% Store F 14 17 43 17 41 41 17 190 Mid Price 39 ₼ 22% Store J 18 17 9 19 31 23 31 148 Lowest Price 25 ₼ 18% Store A 22 20 19 29 33 11 12 146 Store M 23 13 18 13 17 27 11 122 Store D 16 19 15 7 19 13 33 122 Total Revenue 144,414.72 ₼ Store N 14 10 17 16 24 20 17 118 Store B 13 6 7 13 15 3 10 67 Store L 5 4 12 6 8 5 6 46 Store O 4 8 13 3 1 6 35 Store Q 1 2 4 3 3 13 Total 771 330 351 425 510 422 325 3,134
  • 4. 1. On the Data tab, in the Forecast group, click What-If Analysis 2. Click Scenario Manager 3. Add a scenario by clicking on Add
  • 5. 4. Type a name (80% highest), select cell L3 (% sold for the highest price) for the Changing cells and click on OK
  • 6. 5. Enter the corresponding value 0.8 and click on OK again 6. Next, add 2 other scenarios (70% and 60%)
  • 7. Finally, your Scenario Manager should be consistent with the picture below: Note: To see the result of a scenario, select the scenario and click on the Show button. Excel will change the value of cell L3 accordingly for you to see the corresponding result on the sheet. Scenario Summary To easily compare the results of these scenarios, execute the following steps
  • 8. 1. Click the Summary button in the Scenario Manager 2. Next, select cell L13 (Total Revenue) for the result cell and click on OK Result:
  • 9. Conclusion: if you sell 80% for the highest price, you obtain a total revenue of 158 392.36 AZN, if you sell 70% for the mid price, you obtain a total revenue of 151 403.54 AZN, and if you sell 60% for the lowest price you obtain a total revenue 144 414.72 AZN. Here We Excel with what-if analysis (Scenarios) in Excel. To be continued…