Taguchi Method Optimizes Solar Still Performance

This paper represent the performance of operating parameter of solar still. In this paper optimizing the four parameter with the help of Taguchi method. This four parameters (glass cover angle, Water temperature ,glass cover temperature, Average spacing between water and glass cover) influence on the total distill output. The present paper optimize the Taguchi method to optimize the operating parameter for higher yield for a passive single slope solar distillation system. The main objective of the present study was to apply the Taguchi method to establish the optimal set of parameters for passive slope solar still. The Taguchi method is employed to determine the optimal combination of design parameter .This paper present new optimize parameter using Taguchi method in the case of passive solar still.

Recommended
Recommended
More Related Content
What's hot
What's hot (18)
Viewers also liked
Viewers also liked (20)
Similar to Taguchi Method Optimizes Solar Still Performance
Similar to Taguchi Method Optimizes Solar Still Performance (20)
More from IOSR Journals
Recently uploaded
Recently uploaded (20)
Taguchi Method Optimizes Solar Still Performance
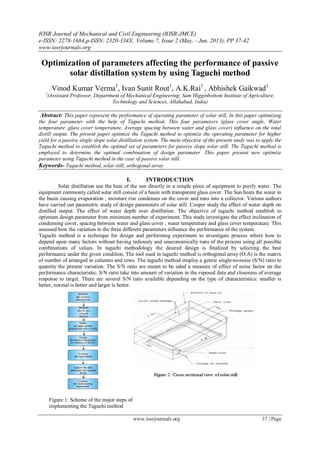
- 1. IOSR Journal of Mechanical and Civil Engineering (IOSR-JMCE) e-ISSN: 2278-1684,p-ISSN: 2320-334X, Volume 7, Issue 2 (May. - Jun. 2013), PP 37-42 www.iosrjournals.org www.iosrjournals.org 37 | Page Optimization of parameters affecting the performance of passive solar distillation system by using Taguchi method Vinod Kumar Verma1 , Ivan Sunit Rout1 , A.K.Rai1 , Abhishek Gaikwad1 1 (Assistant Professor, Department of Mechanical Engineering, Sam Higginbottom Institute of Agriculture, Technology and Sciences, Allahabad, India) Abstract: This paper represent the performance of operating parameter of solar still. In this paper optimizing the four parameter with the help of Taguchi method. This four parameters (glass cover angle, Water temperature ,glass cover temperature, Average spacing between water and glass cover) influence on the total distill output. The present paper optimize the Taguchi method to optimize the operating parameter for higher yield for a passive single slope solar distillation system. The main objective of the present study was to apply the Taguchi method to establish the optimal set of parameters for passive slope solar still. The Taguchi method is employed to determine the optimal combination of design parameter .This paper present new optimize parameter using Taguchi method in the case of passive solar still. Keywords- Taguchi method, solar still, orthogonal array I. INTRODUCTION Solar distillation use the heat of the sun directly in a simple piece of equipment to purify water. The equipment commonly called solar still consist of a basin with transparent glass cover. The Sun heats the water in the basin causing evaporation , moisture rise condenses on the cover and runs into a collector. Various authors have carried out parametric study of design parameters of solar still. Cooper study the effect of water depth on distilled output. The effect of water depth over distillation. The objective of taguchi method establish to optimum design parameter from minimum number of experiment. This study investigate the effect inclination of condensing cover, spacing between water and glass cover , water temperature and glass cover temperature. This assessed how the variation in the three different parameters influence the performance of the system. Taguchi method is a technique for design and performing experiment to investigate process where how to depend upon many factors without having tediously and uneconomically runs of the process using all possible combinations of values. In taguchi methodology the desired design is finalized by selecting the best performance under the given condition. The tool used in taguchi method is orthogonal array (O.A) is the matrix of number of arranged in columns and rows. The taguchi method employ a genric single-to-noise (S/N) ratio to quantity the present variation. The S/N ratio are meant to be uded a measure of effect of noise factor on the performance characteristic. S/N ratio take into amount of variation in the reposed data and closeness of average response to target. There are several S/N ratio available depending on the type of characteristics: smaller is better, normal is better and larger is better. Figure 1: Scheme of the major steps of implementing the Taguchi method
- 2. Optimization of parameters affecting the performance of passive solar distillation system by using www.iosrjournals.org 38 | Page II. EXPERIMENTAL SET UP A constant temperature bath filled with water used as a basin for the distillation unit. In this work taken the indoor solar distillation system and find out the water distillation (mw), with the help of mw we found out C and N experimental with the help of formulas and regression analysis and then help of computer programming C+ we find out water distillation theoretically. In this experiment taken four parameter: inclination of glass cover (200 , 300 and 400 ), water temperature (400 C, 500 C and 600 C), glass cover temperature (280 C, 320 C and 380 C), characteristic length or average spacing between water and glass cover (0.59 cm, 0.87cm and 1.26cm). Then with the help of taguchi method find out the 27 results with the help of in this four parameters and three level of the experimental number of set up used L9 Anova tables. III. Experimental Design The experimental using Taguchi method on the operating parameter in solar still. Table1 .Shows four factors and three levels used in the experiment. If three levels were assigned to each of these factors and a factorial experimental design to each of these factors and a factorial experimental design was employed using each of these values, number of permutations would be 34 . The fractional factorial factorial design reduced the number of experiment to nine. The orthogonal array of L9 type was used and is represented in table2. This design requires nine experiments with four parameters at three levels of each. The interactions were neglected. The water distillation in the solar distillation system should be maximized. Table1 Level of process parameters: Level Symbol Factor 1 2 3 A glass cover angle(θ) 20 30 40 B Water temperature(tw) 40 50 60 C Glass cover temperature(Tg) 28 32 38 D Average spacing between water 0.59 0.87 1.26 and glass cover(df) in cm. Table 2 Taguchi L9 (34 ) orthogonal array Factor Standard order A (0 C) B(0 C) C(0 C) D (cm) 1 20 40 28 0.59 2 20 50 32 0.87 3 20 60 38 1.26 4 30 40 32 1.26 5 30 50 38 0.59 6 30 60 28 0.87 7 40 40 38 0.87 8 40 50 28 1.26 9 40 60 32 0.59 IV. Result And Discussion Nine different experiments were performed using the design parameter combinations in the specified orthogonal array table. Three specimens were fabricated for each of the parameter combinations. The completed response table for these data appears in Table 3. In order to estimate the effect of factor A (glass cover angle) on the average value of response variable, were summed together three observed response at level 1of factor A. Then the sum was divided by 3 to obtain the average response at level of factor A. The average responses at level 2and 3 was obtained in the similar manner. The estimated effects are presented graphically in Fig. 3. The range of average responses at the bottom Table 3, over the three levels of each experimental factor, is: - for glass cover angel (θ) = 48.81, - for water temperature(tw) =1465.19, - for glass temperature = 453.74, - for characteristic length = 346.62,
- 3. Optimization of parameters affecting the performance of passive solar distillation system by using www.iosrjournals.org 39 | Page In particular, factor A (glass cover angel (θ)) , factor B (water temperature), factor C (glass cover temperature) and factor D (average spacing between water and glass cover) for factor A level 3 (400 C), factor B level 3(600 C), factor C level 1(280 C) and factor D level 3 (1.26cm). For this is the optimize parameter found out with the help of taguchi method in the case of passive solar still. 4.1 Estimated factor effect: Table .3 Experimental data and sample statistics Experimental Observed response values Mean S.D. Log of S.D. S/N Ratio for mass of distilled output(g) Number 1 72.80 250.09 197.85 173.58 91.10 1.96 41.15 2 162.90 824.96 812.18 600.01 378.60 2.58 48.70 3 293.98 2097.60 2492.34 1627.95 471.99 2.67 64.12 4 40.96 221.93 226.91 163.27 105.95 2.05 36.74 5 120.30 416.03 330.48 288.94 152.18 2.18 52.83 6 425.60 2478.62 2668.17 1857.46 1243.65 3.09 69.24 7 8.26 24.26 17.47 16.63 7.98 0.90 7.79 8 179 1258.80 1485.57 974.81 697.66 2.84 64.48 9 412. 1778.62 1600.09 1263.67 742.69 2.87 65.93 4.2 Average mean graph A1= 800.51, B1= 117.83, C1= 1098.24, D1= 575. 39, A2 = 769.89, B2 = 621.25, C2= 675.65, D2= 824.70, A3= 751.70, B3= 1583.02, C3= 644.50, D3= 922.01, The standard deviation was calculated for each tube in five steps. First, y was subtracted from each measurement in the sample (sample mean), then the square differences obtained prior were calculated. Next, the squared obtained differences were and was divide the sum by the sample size minus one (s2). Finally obtain the square root of s2 . The sample variance is written as formula [1]: S2 = ∑(y-yˉ )2 /(n-1) …………….(1) S = √s2 …………….(2) The estimated log s effects from Table 3 are plotted in Fig.4.Both factor A and C again affect the tensile strength variability. In order to minimize variability: 4.3 Log graph A1=2.40, B1= 1.63, C1= 2.64, D1= 2.34, A2= 2.44, B2= 2.53, C2= 2.50, D2= 2.19, A3= 2.20, B3= 2.87, C3= 1.92, D3= 2.52, 4.4 S/N Ratio graph A1= 51.32 B1= 35.23 C1= 58.77 D1= 53.30 A2= 52.94 B2= 55.34 C2= 50.45 D2= 48.57 A3= 53.73 B3= 66.43 C3= 57.20 D3= 55.11
- 4. Optimization of parameters affecting the performance of passive solar distillation system by using www.iosrjournals.org 40 | Page Overall mean S/N Ratio: TABLE-4 Level Average S/N Ratio by factor Overall mean S/N Ratio Level A B C D T 1 51.32 35.23 58.29 53.30 52.33 2 52.94 55.34 50.46 48.57 3 52.73 66.43 48.25 55.11 In order to maximize the S/N ratio, the following assignments were done: factor A (glass cover angle) –negligible, factor B (water temperature) –level-3, factor C (glass cover temperature) - level -1, factor D(depth of water) – level-3. Figure 5(S/N RATIO GRAPH), indicates that factor B,C and D have a strong effect on average S/N ratio response. Factor B is the next most significant. The above analyses of Table 4 and Table 5 are summarized in Table 5. In that table the levels of key factors which are optimizing the response are listed. Some significant levels are shown on Fig. 3, 4,5. Keep in mind that the objective is to maximize the response average, reduce log s, and maximize the S/N Ratio. There are three ´´conflicts´´ in the levels recommended in Table 5. For factor B (water temperature), level 3 for maximize average and maximize the S/N Ratio, but level 1 for minimize log s. In this case, however, the reduction in log s does not appear to be significant, but the average and S/N Ratio do appear to be relatively large. For factor C-glass cover temperature the situation is(level-1for average and S/N Ratio and level-3 for response logs) in factor D (level 3 for average and S/N Ratio, and level 2 for response logs). 4.5 Results: - factor A, glass cover angle, level -2 (300 c) - factor B, water temperature, level-3 (600 c) - factor C, temperature of glass cover, level-1 (280 c) - factor D, Average spacing between water and glass cover , level -3 (1.26cm.) In this work, the better distillation of water(mw) is the indication of better performance. Therefore, the larger- is-better for the solar distillation was selected for obtaining optimum solar still performance characteristics. The following S/N ratios for the larger-is-better case could be calculated by given formula: S/N Ratio = -10 log(∑(1/y2 )/n) For example, average response of B (water temperature, average response of B (water temperature) at level 3 was obtained from the results of experiments 3, 6, 9 since level 3 of parameter B was used in these experiments. So, average response for this = S/N Ratio3 + S/N Ratio6 + S/N Ratio9 = 66.43. Similar calculations were performed for the another factors and levels. The average responses for all parameters are given in Table 5 with Overall mean S/N Ratio. TABLE -5 Summary table analyses of factor effects Level which was optimized Factor y (average) log s S/N Ratio A 1 3 3 B 3 1 3 C 1 3 1 D 3 2 3 In this study factor B, C and D three factors are dominant. These final optimized parameter values are: Glass cover angle (θ)- not significant Water temperature (tw) – level -3 Glass covers temperature (tg) – level-1 Average spacing between water and glass cover (df)- level -3
- 5. Optimization of parameters affecting the performance of passive solar distillation system by using www.iosrjournals.org 41 | Page V. Figures Figure 3: Average Mean Graph Figure 4: Log Graph Figure 5: S/N Ratio Graph VI. Summary And Conclusion The above analyses were summarized in Table 4. The objective is to maximize the response average, reducing the log s, and maximizing the S/N ratio. In order to maximize the S/N ratio, the following assignments were done. Factor A (condensing cover inclination) – negligible, Factor B (Water Temperature) – level 3, Factor C ( glass cover Temperature) – level 1. Factor D (average spacing) – level 3. Figure 6 indicates that factor B have a strong effect on the average S/N ratio response. Factor C is the next most significant. The above analysis of Table 4 and table 5 are summarized in the Table 4. In that table the levels of key factors which are optimizing the response are listed. Some significant levels are shown on figure 3, 4 and 5. Keeping in mind the objective is to maximize the response average, reducing the log s, and maximizing the S/N ratio. There are three conflicts in the levels recommended in table 6.For factor B (Water Temperature) – level 3 for maximize average and maximize the S/N ratio. But level 1 for minimizes log s. In this case, however, reduction in log s does not appear to be significant, but the average and S/N ratio do appear to be relatively large. For Factor C (glass cover Temperature) – level 1 for for maximize average and maximize the S/N ratio. But level 3 for minimises log s. For Factor D (average spacing) – level 3 for maximize average and maximize the S/N ratio. But level 2 to minimize log s.
- 6. Optimization of parameters affecting the performance of passive solar distillation system by using www.iosrjournals.org 42 | Page In this study factors B, and C were two dominant. These final optimized parameter values are : Condensing cover inclination - level 3 (400 ) Water temperature – level 3 (600 C) Glass Temperature – level 1 (280 C) Average spacing – level 3 (1.26 cm) For the experimental design of single slop passive solar still in the indoor simulation applied Taguchi approach. Uses a special design of orthogonal array, only nine experiments where needed to determine the optimum condition for the finding the best operating parameter in single slope passive solar still in indoor simulation. The experiment conducted with the Taguchi method has demonstrated that water temperature .( tw) is very important . The most advantageous for the single slope solar the water temperature 600 C is most significant condition. In this set of experiment the temperature of glass cover is 280 C is preferable condition and the average spacing between water and the glass cover taken 1.26 cm. In this experiment, inclination of glass cover on the solar still has not the significant influence on the distillate output; however the optimum inclination is 30 degree. Acknowledgements The authors are thankful to God Almighty for pouring out blessings in completing this work. The authors are grateful to Er James Peter, HOD, Mechanical Engineering, SHIATS, allahabad, India for his constant encouragement for the work. The authors are thankful to Dr A.K.Rai, Assistant Professor, Department of Mechanical Engineering, SHIATS, Allahabad, India for his support and guidance. The authors are debted to the Editorial board of Journal of Mechanical and Civil Engineering for appreciating this paper. REFERENCES [1] Baum V.A. and Baranov K, Heat and Mass Transfer Process in solar stills of hot box type,(solar energy volume 8(3)pp 78-82, 1964) [2]. Cooper M.I., Digital simulation of experimental solar still data,(Solar energy,pp14-75, 1973) [3]. Dunkle R. V.,SOLAR WATER distillation, the roof type still and a multiple effect diffusion still ( international developments In heat transfer ,ASME ,Proc. International heat transfer, partv,university of Colorado,895pp, 1961) [4]. Dunkle R. V., SOLAR WATER distillation, the roof type still and a multiple effect diffusion still, (international developments In heat transfer, ASME,Proc. International heat transfer, partv,university of Colorado,895-992 pp, 1961) [5]. G N Tiwari ,J.M. Thomas,Imran Khan, the maximum efficiency of single effect solar still,(solar energy, pp205-214, 1995) [6] Y.H. Chen, S.C. Tam, W.L. Chen, H.Z. Zheng, Application of Taguchi metod in the optimization of laser microengraving of photomasks, International Journal of Materials & Product Technology 11 (1996) 333-344. [7] L.A. Dobrzaski, Fundamentals of Materials Science and Physical Metallurgy. ( WNT, Warszawa, 2006 in Polish). [8] L.A. Dobrzañski , J. Domaga, J.F. Silva, Application of Taguchi method in the optimisation of filament winding of thermoplastic composites ,(Archives of Materials Science and Engineering , Volume 28 Issue 3 March 2007 Pages 133-140). [9] Ajeet Kumar Rai, Ashish Kumar, Vinod Kumar Verma, Effect of water depth and still orientation on productivity of passive solar still, (Internationational journal of mechanical engineering and technology, Volume 3 Issue 2 May-August 2012 Pages 740-753). [10] Ajeet Kumar Rai, Vinay Tripathi, Vinod Kumar Verma, Prediction of mass transfer rates in solar still, (NCREEM-2011, national conference on renewable energy management, Jhansi, Uttar Pradesh, India)