SlideShare a Scribd company logo
1 of 15
Download to read offline
International Journal of Modern Research in Engineering & Management (IJMREM)
||Volume|| 1||Issue|| 8 ||Pages|| 07-21 || August 2018|| ISSN: 2581-4540
www.ijmrem.com IJMREM Page 7
Strategies for Considerations Requirement Sample Size in
Different Clinical Trials
Altaiyb Omer Ahmed*1
– Babiker Gafar Yousif2
-Amani Babiker Mohamed3
-
Salma Mustafa Alnaier4
1,2,3,4
Sudan University of science and technology – department of statistics
-------------------------------------------------------ABSTRACT ---------------------------------------------------
Usually the main problem face any investigation it how to determent a sample size, however, some
considerations required in sample size to conduct the efficacy and make realistic well-researched before began
study. This study aimed to determine the maximum possible sample size at different phases of clinical trials and
attempt to achieve the best accuracy of the results. To achieve that the maximum sample size in different phases
we found that the maximum sample size of phase I was (75) relies on largest response rate 20% and the minimal
clinically important difference (MCID) 15%, and because the participants are healthy often that means 15%
enough to show positive results of the transition to the second phase. for the phase II clinical trials; the
maximum sample size was (388) depend on the error 5% and largest response rate 50% when the response rate
should not be less than 20% according to the design used in this phase. Depend on the endpoint and hazard
ratio in phase III clinical trials when the probability of survival of the treatment group equal to median of the
probability of survival 50% we found that the maximum sample size (4796). For the phase IV the maximum
sample size in different phases of clinical trials does not affect whatever the large of the population size and
remains constant as large as possible size.
KEYWORDS: Sample Size, Survival, Phases, Hazard Ratio, Drugs, Clinical Trials
---------------------------------------------------------------------------------------------------------------------------------------
Date of Submission: Date, 10 February 2018 Date of Accepted: 20 March 2018
---------------------------------------------------------------------------------------------------------------------------------------
I. INTRODUCTION
Clinical trials are scientific investigations that examine and evaluate the safety and efficacy of new drugs or
therapeutic procedures using human subjects. The results that these studies generate are considered to be the
most valued data in the area of evidence-based medicine. Understanding the principles behind clinical trials
enables an appreciation of the validity and reliability of their results.  1 When designing a clinical trial, the
objective is to select a sample of patients with the disease or condition under investigation. Sample size
calculations should be based on the way the data will be analyzed. But, even if more complex methods of
analysis will be used ultimately, it is easier and usually sufficient to estimate the sample size assuming a simpler
method of analysis, such as the t-test or two means or chi-square test of two proportions. Consideration should
be given to the source of the patients, the investigators who are going to recruit them, disease status, and any
ethical issues surrounding participation. A set of carefully defined eligibility criteria is essential. This should
ensure that the study findings have ‘external validity’ or, in other words, are generalizable for the treatment of
future patients with the same disease or condition. In this chapter, we discuss some of the important issues to
consider when selecting patients for clinical trials. The aim of a well-designed clinical trial is to ask an
important question about the effectiveness or safety of a treatment andto provide a reliable answer by
performing statistical analysisand assessing whether an observed treatment difference isdue to chance. The
reliability of the answer is determined bythe sample size of the trial: the larger a trial, the less likelywe are to
miss a real difference between treatments by chance, we review the issues that determinean appropriate sample
size for a randomized controlled trial.Theaim clinical trials and attempt to achieve the best accuracy of the
results the statistical power of a study and a study with inadequate power is unethical unless being conducted as
a safety and feasibility study. However, the calculation of sample size is not an exact science. It is therefore
important to make realistic and well-researched assumptions before choosing an appropriate sample size. This
sample size should account for dropouts, and there should be a consideration for interim analyses to be
performed during the study, which can be used to amend the final sample size.
Strategies for Considerations Requirement Sample Size…
www.ijmrem.com IJMREM Page 8
II. CLINICAL TRIALS
Clinical trials are medical research studies to test whether different treatments are safe and how well they work.
Some trials involve healthy members of the public, and others involve patients who may be offered the option of
taking part in a trial during their care and treatment  2 .
Also Clinical trials define as an experiments or observations done in clinical research
Such prospective biomedical or behavioral research studies on human participants are designed to answer
specific questions about biomedical or behavioral interventions, including new treatments (such as
novel vaccines, drugs, dietary choices, dietary supplements, and medical devices) and known interventions that
warrant further study and comparison. Clinical trials generate data on safety and efficacy 3 . They are
conducted only after they have received health authority/ethics committee approval in the country where
approval of the therapy is sought. These authorities are responsible for vetting the risk/benefit ratio of the trial –
their approval does not mean that the therapy is 'safe' or effective, only that the trial may be conducted. it
explore how a treatment reacts in the human body and are designed to ensure a drug is tolerated and effective
before it is licensed by regulatory authorities and made available for use by doctors. Studies vary in their
primary goal or endpoint (i.e. the most important outcome of the trial), the number of patients involved, and the
specifics of the study design. However, all clinical studies conform to a strict set of criteria to protect the
patients involved and to ensure rigorous evaluation of the drug.  4 . Many clinical trials to develop new
interventions are conducted in phases. In the early phases, the new intervention is tested in a small number of
participants to assess safety and effectiveness. If the intervention is promising, it may move to later phases of
testing where the number of participants is increased to collect more information on effectiveness and possible
side effects.
A clinical trial evaluates the effect of a new drug (or device or procedure) on human volunteers. These trials can
be used to evaluate the safety of a new drug in healthy human volunteers, or to assess treatment benefits in
patients with a specific disease. Clinical trials can compare a new drug against existing drugs or against dummy
medications (placebo) or they may not have a comparison arm  85 −
TRIALS OF DRUGS : Some clinical trials involve healthy subjects with no pre-existing medical conditions.
Other clinical trials pertain to patients with specific health conditions who are willing to try an experimental
treatment.Usually pilot experiments are conducted to gain insights for design of the clinical trial to follow.There
are two goals to testing medical treatments: to learn whether they work well enough, called "efficacy" or
"effectiveness"; and to learn whether they are safe enough, called "safety". Neither is an absolute criterion; both
safety and efficacy are evaluated relative to how the treatment is intended to be used, what other treatments are
available, and the severity of the disease or condition. The benefits must outweigh the risks  109 − . For
example, many drugs to treat cancer have severe side effects that would not be acceptable for an over-the-
counter pain medication, yet the cancer drugs have been approved since they are used under a physician's care,
and are used for a life-threatening condition  11 . Compounds, no matter how promising or impassioned the
pleas for use, have to go through a series oftests in animals before they can be tested in humans.Those
considered to lack promise after animal testingdo not come to testing in humans  12 .Typically, the testing in
humans is done in a timeordered sequence, as suggested by the phase labelaffixed to trials as defined below.
However, in truth, adjoining phases overlap in purpose. Hence, the label, at best, serves only as a rough
indicator of the stage of testing, especially when, as is often the case, drugsponsors, at any given point in time,
may have severaltrials under way carrying different phase labels.
PHASES OF CLINICAL TRIALS : The phases of clinical trials are the steps in which scientists do
experiments with a health intervention in an attempt to find enough evidence for a process which would be
useful as a medical treatment. In the case of pharmaceutical study, the phases start with drug design and drug
discovery then proceed on to animal testing. If this is successful, they begin the clinical phase of development
by testing for safety in a few human subjects and expand to test in many study participants to determine if the
treatment is effective.  13 Clinical trials are usually conducted in phases that build on one another. Each phase
is designed to answer certain questions. Knowing the phase of the clinical trial is important because it can give
you some idea about how much is known about the treatment being studied. There are pros and cons to taking
part in each phase of a clinical trial. Four phases of clinical trials and medicine development exist and are
Strategies for Considerations Requirement Sample Size…
www.ijmrem.com IJMREM Page 9
defined below. Each of these definitions is a functional one and the terms are not defined on a strict
chronological basis. An investigational medicine is often evaluated in tow or more phases simultaneously in
different clinical trials.  1714−
PHASE 0 CLINICAL TRIALS : Even though phase 0 studies are done in humans, this type of study isn’t like
the other phases of clinical trials. The purpose of this phase is to help speed up and streamline the drug approval
process. Phase 0 studies are exploratory studies that often use only a few small doses of a new drug in a few
patients. They might test whether the drug reaches the tumor, how the drug acts in the human body, and how
cancer cells in the human body respond to the drug. The patients in these studies might need extra tests such as
biopsies, scans, and blood samples as part of the study process. The biggest difference between phase 0 and the
later phases of clinical trials is that there’s almost no chance the volunteer will benefit by taking part in a phase
0 trial – the benefit will be for other people in the future. Because drug doses are low, there’s also less risk to the
patient in phase 0 studies compared to phase I studies. Phase 0 studies help researchers find out whether the
drugs do what they’re expected to do. If there are problems with the way the drug is absorbed or acts in the
body, this should become clear very quickly in a phase 0 clinical trials. This process may help avoid the delay
and expense of finding out years later in phase II or even phase III clinical trials that the drug doesn’t act as
expected to base on lab studies. Phase 0 studies aren’t used widely, and there are some drugs for which they
wouldn’t be helpful. Phase 0 studies are very small, often with fewer than 15 people, and the drug is given only
for a short time. They’re not a required part of testing a new drug.
PHASE 1 CLINICAL TRIALS : Phase I studies of a new drug are usually the first that involve people. The
main reason for doing it is to find the highest dose of the new treatment that can be given safely without serious
side effects. Although the treatment has been tested in lab and animal studies, the side effects in people can’t
always be predicted. These studies also help to decide on the best way to give the new treatment. Researchers
test an experimental drug or treatment in a small group of people Key points of phase I clinical trials observed
such as: The first few people in the study often get a very low dose of the treatment and are watched very
closely. If there are only minor side effects, the next few participants may get a higher dose. This process
continues until doctors find a dose that’s most likely to work while having an acceptable level of side effects.
Safety is the main concern at this point. Doctors keep a close eye on the people and watch for any serious side
effects. Because of the small numbers of people in phase I studies, rare side effects may not be seen until later.
Placebos are not part of phase I trials. These studies usually include a small number of people (typically up to a
few dozen) and are not designed to find out if the new treatment works against disease. In Overall, phase I trials
are the ones with the most potential risk.
PHASE II CLINICAL TRIALS : If a new treatment is found to be reasonably safe in Phase I clinical trials, it
can then be tested in a phase II clinical trial to find out if it works. The type of benefit or response the doctors
look for depends on the goal of the treatment. It may mean the disease shrinks or disappears. Or it might mean
there’s an extended period of time where the disease doesn’t get any bigger, or there’s a longer time before the
disease comes back. In some studies, the benefit may be an improved quality of life. Many studies look to see if
people getting the new treatment live longer than they would have been expected to without the treatment. Also
Key points of phase II clinical trials must be concentrations: Usually, a group of 25 to 100 patients with the
same type of disease get the new treatment in a phase II study. They’re treated using the dose and method found
to be the safest and most effective in phase I studies. In a phase II clinical trial, all the volunteers usually get the
same dose. But some phase II studies randomly assign participants to different treatment groups. These groups
may get different doses or get the treatment in different ways to see which provides the best balance of safety
and effectiveness. No placebo is used. Phase II studies are often done at major disease centers, but may also be
done in community hospitals or even doctors’ offices. Larger numbers of patients get the treatment in phase II
studies, so there’s a better chance that less common side effects may be seen. If enough patients benefit from the
treatment, and the side effects aren’t too bad, the treatment is allowed to go on to a phase III clinical trial. Along
with watching for responses, the research team keeps looking for any side effects.
Phase IIa: Pilot clinical trials to evaluate efficacy (and safety) in selected populationsof patients with the disease
or condition to be treated, diagnosed, or prevented. Objectives may focus on dose-response, type of patient,
frequency of dosing, ornumerous other characteristics of safety and efficacy. Phase IIb: Well controlled trials to
evaluate efficacy (and safety) in patients with the disease or condition to be treated, diagnosed, or prevented.
These clinical trialsusually represent the most rigorous demonstration of a medicine's efficacy. Sometimes
referred to as pivotal trials. Some Phase II trials are designed as case series, demonstrating a drug's safety and
Strategies for Considerations Requirement Sample Size…
www.ijmrem.com IJMREM Page 10
activity in a selected group of patients. Other Phase II trials are designed as randomized controlled trials, where
some patients receive the drug/device and others receive placebo/standard treatment. Randomized Phase II trials
have far fewer patients than randomized Phase III trials.  18
PHASE III CLINICAL TRIALS : Treatments that have been shown to work in phase II studies usually must
succeed in one more phase of testing before they’re approved for general use. Phase III clinical trials compare
the safety and effectiveness of the new treatment against the current standard treatment. Because doctors do not
yet know which treatment is better, study participants are often picked at random to get either the standard
treatment or the new treatment. When possible, neither the doctor nor the patient knows which of the treatments
the patient is getting. This type of study is called a double-blind study. Randomization and blinding are
discussed in more detail later. Key points of phase III clinical trials: Most phase III clinical trials have a large
number of patients, at least several hundred. These studies are often done in many places across the country (or
even around the world) at the same time. Phase III clinical trials are more likely to be offered by community-
based oncologists. These studies tend to last longer than phase I and II studies. Placebos may be used in some
phase III studies, but they’re never used alone if there’s a treatment available that works. As with other studies,
patients in phase III clinical trials are watched closely for side effects, and treatment is stopped if they’re too
bad.
Phase IIIa: Trials conducted after efficacy of the medicine is demonstrated, but priorto regulatory submission of
a New Drug Application (NDA) or other dossier. These clinical trials are conducted in patient populations for
which the medicine is eventually intended. Phase IIIa clinical trials generate additional data on both safety
and efficacy in relatively large numbers of patients in both controlled and
uncontrolled trials. Clinical trials are also conducted in special groups of patients (e.g., renal failure patients), or
under special conditions dictated by the nature ofthe medicine and disease. These trials often provide much of
the information neededfor the package insert and labeling of the medicine.
Phase IIIb: Clinical trials conducted after regulatory submission of an NDA or other dossier, but prior to the
medicine's approval and launch. These trials maysupplement earlier trials, complete earlier trials, or may be
directed toward newtypes of trials (e.g., quality of life, marketing) or Phase IV evaluations. This is theperiod
between submission and approval of a regulatory dossier for marketing authorization.  19
PHASE IV CLINICAL TRIALS : Drugs approved by food and drug administration (FDA) are often watched
over a long period of time in phase IV studies. Even after testing a new medicine on thousands of people, the
full effects of the treatment may not be known. Some questions may still need to be answered. For example, a
drug may get FDA approval because it was shown to reduce the risk of cancer coming back after treatment. But
does this mean that those who get it are more likely to live longer? Are there rare side effects that haven’t been
seen yet, or side effects that only show up after a person has taken the drug for a long time? These types of
questions may take many more years to answer, and are often addressed in phase IV clinical trials. This is
typically the safest type of clinical trial because the treatment has already been studied a lot and might have
already been used in many people. Phase IV studies look at safety over time. These studies may also look at
other aspects of the treatment, such as quality of life or cost effectiveness  20 . Studies or trials conducted after
a medicine is marketed to provide additional details about the medicine's efficacy or safety profile. Different
formulations, dosages, durations of treatment, medicine interactions, and other medicine comparisons may be
evaluated. New age groups, races, and other types of patients can be studied. Detection and definition of
previously unknown or inadequately quantified adverse reactions and related risk factors are an important aspect
of many Phase IV studies. If a marketed medicine is to be evaluated for another (i.e., new) indication, then those
clinical trials are considered Phase II clinical trials. The term post-marketing surveillance is frequently used to
describe those clinical studies in Phase IV (i.e., the period following marketing) that are primarily observational
or non-experimental in nature, to distinguish them from well controlled Phase IV clinical trials or marketing
studies 21 . You can get the drugs used in a phase IV trial without enrolling in a study. And the care you would
get in a phase IV study is very much like the care you could expect if you were to get the treatment outside of a
clinical trial. But in phase IV studies you’re helping researchers learn more about the treatment and doing a
service to future patients.
Strategies for Considerations Requirement Sample Size…
www.ijmrem.com IJMREM Page 11
III. GENERAL CONSIDERATIONS
Calculation of sample size requires precise specification of the primary hypothesis of the study and the method
of analysis. In classical statistical terms, one selects a null hypothesis a long with its associated type I error rate,
an alternative hypothesis a long with its associated statistical power, and the test statistic one intends to use to
distinguish between the two hypotheses. Sample size calculation becomes an exercise in determining the
number of participants required to achieve simultaneously the desired type I error rate and the desired power.
For test statistics with well known distributional properties, one may use a standard formula for sample size.
Controlled trials often involve deviations from assumptions such that the test statistic has more complicated
behavior than a simple formula allows. Loss to follow-up, incomplete compliance with therapy, heterogeneity of
the patient population, or variability inconcomitant treatment among centers of a multicenter trialmay require
modifications of standard formulas  22 . In some situations, however, the anticipated complexities of a given
trial may render all available formulas inadequate. In such cases, the investigator can simulate the trial using an
adequate numberof randomly generated outcomes and select the sample size on the basis of those computer
simulations.Complicated studies often benefit from a three-step strategy in calculating sample size. First, one
may use a simple formula to approximate the necessary size over a range of parameters of interest under a set of
ideal assumptions (e.g., no loss to follow-up, full compliance, homogeneity of treatment effect). This calculation
allows a rough projection of the resources necessary. Having established the feasibilityof the trial and having
further discussed the likely deviations from assumptions, one may then use more refined calculations. Finally, a
trial that includes highly specialized features may benefit from simulation for selection of a more appropriate
size
IV. GEHAN'S TWO – STAGE DESIGN
Discarding ineffective treatments early: If it is unlikely that a treatment will achieve some minimal level of
response or efficacy, we may want to stop the trial as early as possible. For example, suppose that a 20%
response rate is the lowest response rate that is considered acceptable for a new treatment. If we get no
responses in n patients, with n sufficiently large, then we may feel confident that the treatment is ineffective.
Statistically, this may be posed as follows: How large must n be so that if there are 0 responses among
n patients we are relatively confident that the response rate is not 20% or better? If X ∼b(n, π), and if π ≥ .2,
then Pπ(X = 0) Choose n so that .8n
= .05 or n ln(.8) = ln(.05). This
leads to n ≈ 14 (rounding up). Thus, with 14 patients, it is unlikely (≤ .05) that no one would respond if the true
response rate was greater than 20%. Thus 0 patients responding among 14 might be used as evidence to stop the
phase II trial and declare the treatment a failure  23 . This is the logic behind Gehan’s two-stage design. Gehan
suggested the following strategy:
If the minimal acceptable response rate is π0, then choose the first stage with n0 patients such that (1 - π0)n0
=
.05; n0 =
If at least one response is observed in first 14 patients then a second stage of accrual is carried out to obtain an
estimate of the response rate. The number of patients to accrue in the second stage depends on the number of
response observed in the first stage and the precision desired for the final estimate of response rate. If the first
stage consist 14 patients the second stage will consist of:
Between 1 and 11 patients, if a standard error of 10% is desired
Between 45 and 86 patients, if a standard error of 5% is desired
A problem of Gehan’s design is it may allow a very poor drug to move to the second stage. for example, if a
drug has a response rate of only 5% , there exists at 51% chance of obtaining at least one response among the
first 14 patients consequently ,the first stage 14 patients would not effectively screen inactive drugs.
Assume that X is random variable follow the binomial distribution Bin ( )
Let response rate 20%
=
=
Strategies for Considerations Requirement Sample Size…
www.ijmrem.com IJMREM Page 12
Then the sample size is:
)1(
)1log(
)log(


−
=n
Stage1: To determine the sample size in stage 1 used the following formula
)2(
)1log(
)1log(
1


−
−
=
n
n
Where
Response rate
Stage2: The sample size in stage2 calculate with  24
)3(
)1(
2
2
2

 −
=
Z
n
Where
Minimal clinical different
STRATEGIES TO OBTAIN QUALITY SAMPLE
1- Focus your study. Ensure that the research question is feasible and the study answers a question with clear
variables.
2- Find a representative sample. Determine the essential inclusion and exclusion criteria for the study
population such that findings can accurately generalize or specify results to the target group.  25
3- Determine a recruitment strategy. Specify a plan to identify and enroll study participants. This may involve
screening or establishing criteria for number, location, and sampling method.
4- Consult with the community to identify and recruit potential participants. Examine existing infrastructure to
find venues of contacting appropriate samples.
5- To avoid selection bias, it is also necessary to recruit an appropriate comparison group.
6- Do not give up after the first attempt to recruit a potential participant. Follow-up using various
communication strategies, including personal, written, or electronic messaging. “The significance of
personal contact should not be underestimated.  26
7- Allow for flexibility in the process. If current recruitment strategies are resulting in “inadequate enrollment”
or modifications are made in criteria of participants, the solution may be to alter the sampling plan.
SAMPLE SIZE CALCULATION FOR TESTING A HYPOTHESIS
In this kind of research design researcher wants to see the effect of an intervention. Suppose a researcher want to
see the effect of an antihypertensive drug so he will select two groups, one group will be given antihypertensive
drug and another group will be give placebo. After giving these drugs for a fixed time period blood pressure of
both groups will be measured and mean blood pressure of both groups will be compared to see if difference is
significant or not. Complex formulae are used for this type of studies and we want to advise readers to use
statistical software for calculation of exact sample size. The procedure for calculation of sample size in clinical
trials/intervention studies involving two groups is mentioned here. In the case of only two groups method of
calculation is mentioned here but if design involves more than two groups then statistical software like G Power
should be used for sample size calculation. But understanding of various prerequisites which are needed for
sample size calculation is very important  2827−
BASIC REQUIREMENT FOR ESTIMATION OF SAMPLE SIZE IN CT
Following are the basic considerations for estimating sample size for a CT
Study Design : In CT, different statistical study designs are available to achieve objectives. Typical designs that
may be employed are parallel group design; crossover design etc.For sample size estimation study design should
be explicitly defined in the objective of the trial. A cross over design will have different approach and formula
for sample size estimation as compared to parallel group design.
Strategies for Considerations Requirement Sample Size…
www.ijmrem.com IJMREM Page 13
Hypothesis Testing :This is another critical parameter needed for sample size estimation, which describes aim
of a CT. The aim can be equality, non-inferiority, superiority or equivalence.Equality and equivalence trials are
two-sided trials where as non-inferiority and superiority trials are one-sided trials.Superiority or non-inferiority
trials can be conducted only if there is prior information available about the test drug on a specific end point.
Primary Study End Point : The sample size calculation depends on primary end point of a CT. The description
of primary study end point should cover whether it is discrete or continuous or time-to-event. Sample size is
estimated differently for each of these end points. Sample size is adjusted if primary end point involves multiple
comparisons.
Expected Response Test vs. Control :The information about expected response is usually obtained from
previous trials done on the test drug. If this information is not available, it could be obtained from previous
published literature. The important information required is:
a. Response expected with test drug (mean expected score / proportion of subjects achieving success.)
b. Response expected with control drug (mean expected score / proportion of subjects achieving success.)
c. Variability (standard deviation.)
Clinical Important/Meaningful Difference/Margin : This is one of most critical and one of most challenging
parameters. The challenge here is to define a difference between test and reference which can be considered
clinically meaningful. To put it in plain English, this is the difference which will make your family doctor to
give you new medication over and above the existing gold standard which he is prescribing for last 10 – 20
years. This threshold figure is at times not easily available and should be decided based on clinical judgment.
Level of Significance : This is typically assumed as 5% or lesser. Type I error is inversely proportional to
sample size.
Power : As per guideline power should not be less that 80%. Type II error is directly proportional to sample
size.  3129−
Margin of error: The margin of error is the level of precision you require. This is the plus or minus number
that is often reported with an estimated proportion and is also called the confidence interval. It is the range in
which the true population proportion is estimated to be and is often expressed in percentage points (e.g., ±2%).
Note that the actual precision achieved after you collect your data will be more or less than this target amount,
because it will be based on the proportion estimated from the data and not your expected sample proportion.
Confidence level : The confidence level is the probability that the margin of error contains the true proportion.
If the study was repeated and the range calculated each time, you would expect the true value to lie within these
ranges on 95% of occasions. The higher the confidence level the more certain you can be that the interval
contains the true proportion.
Population size: This is the total number of distinct individuals in your population. In this formula we use a
finite population correction to account for sampling from populations that are small. If your population is large,
but you don’t know how large you can conservatively use 100,000. The sample size doesn’t change much for
populations larger than 100,000.
Sample proportion : The sample proportion is what you expect the results to be. This can often be determined
by using the results from a previous survey, or by running a small pilot study. If you are unsure, use 50%, this is
conservative and gives the largest sample size. Note that this sample size calculation uses the Normal
approximation to the Binomial distribution. If, the sample proportion is close to 0 or 1 then this approximation
is not valid and you need to consider an alternative sample size calculation method. Any major mistake in the
sample size calculation will affect the power and value of a study. “Common sample size mistakes include not
performing any calculations, making unrealistic assumptions, failing to account for potential losses during the
study and failing to investigate sample size over a range of assumptions. Reasons for inadequately sized studies
that do not achieve statistical significance include failing to perform sample size calculations, selecting sample
Strategies for Considerations Requirement Sample Size…
www.ijmrem.com IJMREM Page 14
size based on convenience, failing to secure sufficient funding for the project, and not using the available
funding efficiently 32 .
THE END POINT: A clinical trial end point is defined as a measure that allow us to decide whether the null
hypothesis of a clinical trial should be accepted or rejected .in a clinical trial, the null hypothesis states that there
is no statistically significant difference between two treatments or strategies being compared with respect to the
endpoint measure chosen an endpoint can be composed of a single outcome measure –such as death due to the
disease –or a combination of outcome measure, such as death or hospitalization due to the disease. Clinical trial
endpoint can be classified as primary or secondary endpoints. Primary endpoint measure outcome that will
answer the primary (or most important) question being asked by a trial ,such as whether a new treatment is
better at preventing the disease –related death than the standard therapy. in this case ,the primary endpoint
would be based on the occurrence of disease –related deaths during the duration of the trial .Secondary
endpoints ask other questions about the same study; for example , whether there is also a reduction in disease
measures other than death.Occasionally, secondary endpoints are as important as the primary endpoints ,in
which case they are considered to be co-primary endpoints. When secondary endpoint is also important then the
trial must be sufficiently powered to detect a difference in both endpoints, and expert statistical and design
advice might be needed  33 .
SURVIVAL ANALYSIS : In many clinical trials, the outcome is not just whether an event occurs, but also the
time it takes for the event to occur. For example, in a cancer study comparing the relative merits of surgery and
chemotherapy treatments, the outcome measured could be the time from the start of therapy to the death of the
subject. In this case the event of interest is death, but in other situations it might be the end of a period spent in
remission from cancer spread, relief of symptoms, or a further admission to hospital. These types of data are
generally referred to as time-to-event data or survival data, even when the endpoint or the event being studied is
something other than the death of a subject. The term survival analysis encompasses the methods and models
for analyzing such data representing timefree from events of interest.
V. BASIC CONCEPTS IN SURVIVAL ANALYSIS
CENSORING: In survival analysis, not all subjects are involved in the study for the same length of time due to
censoring. This term denotes when information on the outcome status of a subject stops being available. This
can be because the patient is lost to follow-up (eg, they have moved away) or stops participating in the study, or
because the end of the study observation period is reached without the subject having an event. Censoring is a
nearly universal feature of survival data.
SURVIVAL FUNCTION AND HAZARD FUNCTION : In survival analysis, two functions are of central
interest, namely survival function and hazard function. The survival function, S(t), is the probability that the
survival time of an individual is greater than or equal to time t. Since S(t) is the probability of surviving (or
remaining event-free) to time t, 1 – S(t) is the probability of experiencing an event by time t. Put simply, as t
gets larger, the probability of an event increases and therefore S(t) decreases. Plotting a graphof probability
against time produces a survival curve, which is a useful component in the analysis of such data. Since S(t) is a
probability, its value must be ≥0 but ≤1.When t = 0, S(0) = 1, indicating that all patients are event-free at the
start of study. Within these restrictions, the S(t) curve can have a wide variety of shapes.The hazard function,
h(t), represents the instantaneous event rate at time t for an individual surviving to time t and, in the case of the
pancreatic cancer trial, it represents the instantaneous death rate. With regard to numerical magnitude, the
hazard is a quantity that has the form of ‘number of events per time. For this reason, the hazard is sometimes
interpreted as an incidence rate. To interpret the value of the hazard, we must know the unit in which time is
measured. Assume we plan a RCT aiming at comparing a new treatment (drug) with an old one (control). Such a
comparison can be made in terms of the hazard ratio or some function of this. Let d stand for the drug and c for
control
In the sequel we describe the sample size required to demonstrate that the drug is better than the control
treatment. This will be made under some assumptions in two steps
Strategies for Considerations Requirement Sample Size…
www.ijmrem.com IJMREM Page 15
Step 1: specify the number of events needed
In what follows we will use the notation below to give a formula specifying the number of events needed to
have a certain asymptotic power in many different cases like.The log-rank test – the score test – parametric tests
based on the exponential distribution – etc.
)4(
)(
2
2


pq
ZC
d
power+
=
Where
the proportion of individual receiving the new drug
the upper quintile of the standard normal distribution
It is not clear how d should estimate. The difficulty lies in the fact that this depends on the exact situation at
hand.
Step 2: specify the number of patients needed to obtain the “the right” number of events.
In what follows we consider how we can specify the number of patients needed to get the “right” number of
events needed to have a certain asymptotic power. In general this will depend on
1-The length of the recruitment period T
2-The recruitment rate R
3- The follow up time F
4-The survival function for the control group
d = 2N x P(event) )2N => d/P(event)
P(event) is a function of the length of total follow-up at time of analysis and the average hazard rate.
In clinical research an end point is often the time to the occurrence of some particular event, such as the death of
patient. These types of data known as survival data. In this section the outcome variable is a time-to-event, for
example when (people are followed until death). In practice, not everyone can be observed until death; some
people will die during the study, while others can be followed until the end of the study period. If these
individuals are still alive at the end of the study; we call their observed follow-up times ‘censored’. Thus the
length of follow-up may vary between individuals and the outcome is dichotomous (event ‘yes’ or ‘no’)  34 . In
survival analysis, two function are of central interest, namely survival functions S(t) and hazard function
h(t). The survival function is the probability that the survival time of an individual is greater than or equal to
time t. the hazard function represent the instantaneous event (death) rate at time t for an individual’s surviving to
time t. To compare two groups of individuals with respect to their follow-up times on two different treatments
(for example a control treatment C and an experimental treatment E), a log-rank test is used. The power of the
log-rank test depends on the total number of events in the study, rather than on the number of individuals
enrolled in the study. Therefore sample size and study duration are determined in two steps. First the number of
events d is estimated as a function of the type I error α, the type II error β (or the power 1-β) and the treatment
effect δ0. The treatment effect δ0 is characterized by the ratio of the hazard rates (i.e. the risks of the occurrence
of the event in the two groups). It is assumed that this hazard ratio does not change with follow-up
time 4135− . The total number of events can be determined by:
)5()()
1
1
(
0
0



ZZd +
−
+
=
Strategies for Considerations Requirement Sample Size…
www.ijmrem.com IJMREM Page 16
Where is equal to the hazard ratio (HR)
)6(
)log(
)log(
0
c
e
P
P
=
the estimated survival probability in the control group
the estimated survival probability in experimental group after a certain follow-up time T.
Next the necessary total number of patients' n can be determined based on the estimated number of events d and
the estimated survival probabilities in the two treatment groups:
)7(
2
2
ec PP
d
n
−−
=
In the other hand when we want to estimate the sample size to compare two responses rate we should use the
formulae as below:
( ) ( )
)8(
)(
))1(1(
021
2211
2


−−
−+−+
=
ZZ
n
SAMPLE SIZE TO ESTIMATE A PROPORTION : When one wants to investigate the presence of disease,
we are dealing with a presence/absence (binomial) situation because each selected element is either infected or
not infected  4642− . One property of the Binomial distribution is that the variance equals p * (1 - p), where p
is expressed as a proportion (or it is p * (100 - p), when p is expressed as a percentage). Of course, the standard
deviation is the square root of p * (1 -p). We can then use the following formula to determine the samples size.
)9(
ˆˆ)1(ˆ
ˆˆ
ˆ
ˆˆ
2
2
2/1
2
2/1
QPZNE
QPNZ
E
QPZ
n


+−
= −−
n = estimated sample size for the study.
Z1-α/2 = value of Z which provides α/2 in each tail of normal curve
Pˆ = the best guess of the prevalence of the disease in the population.
Qˆ = 1− Pˆ
E = allowable error or required precision.
N = population size. If the population size is large, this is irrelevant (equivalent to sampling with replacement).
A property of the variance of a proportion is that it is symmetric around its maximum at p = 0.5 (or 50%).
Hence, the sample size is maximal when p is estimated to be 50%, and this value should be used when there is
no idea of the actual proportion. Be careful with the value you select for E, especially at low or high prevalence.
SAMPLE SIZE TO ESTIMATE DIFFERENCES BETWEEN PROPORTIONS : Suppose you want to
compare two antibiotics. Two groups of animals are infected with an appropriate pathogen and the percentages
of recovery in both groups are compared. How many animals should be included in each group? The following
formula can be used 47 :
 
 
)10(
2
2
2
12/1
ce
ccee
PP
QPQPZQPZ
n
−
++
=
−
n = estimated sample size for each of the exposed and unexposed groups.
Z1-α/2 = value of Z which provides α/2 in each tail of normal curve.
Strategies for Considerations Requirement Sample Size…
www.ijmrem.com IJMREM Page 17
Z1-β = value of Z which provides β in the tail of normal curve. β specifies the probability of declaring a
difference to be statistically no significant when there is a real difference in the population.
Pe = estimate of response rate in exposed group or exposure rate in cases.
Pc = estimate of response rate in unexposed group or exposure rate in control.
P = (Pe + Pc) / 2
PQ −=1
SAMPLE SIZE TO DETECT A DISEASE IN A POPULATION : Suppose one is interested in the
percentage of farms that are infected with a pathogen X (prevalence based on whether or not the pathogen is
present at a farm). A farm is considered to be infected when at least one of its animals is infected. First the
appropriate number of farms as units of concern is randomly chosen and secondly the status of the farm
(infected or not) is determined. The proportion of infected animals per farm is not of major interest. Ideally, we
would screen all the animals on a farm, but often this is not necessary. Suppose that it is known that if the
disease is present, about 50% of the animals are likely to be positive. By sampling one animal you have a 50%
probability of correctly concluding that a truly positive farm is positive. In general, one aims at a higher
probability to classify a positive farm correctly (e.g., 95%). By selecting 2 animals, the probability is increased
up to 75% (25% of drawings show two negatives), 3 animals yield 87.5%, 4 animals 93.75% and 5 animals
96.875%. Thus, between 4 and 5 animals should be sampled to detect positive farms with a probability of 95%,
if 50% of the animals are truly diseased. The calculations can be put into a general formula  48 :
)11()
2
)1(
(*))1(1(
1
−
−−−=
d
Npn d
n = sample size
p = probability of finding at least one case ( confidence level, e.g., 0.95)
d = number of (detectable) cases in the population
N = population size
If the test that is used to evaluate the status of the animals is not 100% sensitive, d is equal to the number of
diseased or infected animals multiplied by the sensitivity of the test. It is assumed that no false-positives are
present or that they are ruled out by confirmatory tests.
SAMPLE SIZE FORMULA TO ESTIMATE A MEAN
To calculate sample sizes for a mean obtained from a Normal distribution, we need to estimate both the mean
and its standard deviation (S). Secondly, we need to define an interval L, indicating that with a probability of (1
- α)% the true population mean will be within the interval of the sample mean ± L. This interval is therefore an
indication of the precision of the estimate. Thirdly, we have to decide on (1 - α). There is no general rule for this
decision, but 95 are commonly used. From this we can determine the corresponding number of units (Z) of S.
For example, if (1 - α)= 95 then the significance level is 5% and Z0.05 = 1.96. This value indicates that that 95%
of all the observations will fall within the interval: mean ± 1.96*S / √n. The confidence interval (CI) for a mean,
obtained by drawing elements from a Normal distribution, can be written as:
)12(
*2/1
n
SZ
XCI −
=
If the part after the ± sign is denoted as E, n is then calculated as:
)13(
ˆ*
2
22
2/1
E
SZ
n −
=
n = sample size.
Z1-α/2 = value of Z which provides α/2 in each tail of normal curve.
S ˆ = estimate of standard deviation in the population.
E = allowable error or required precision.
SAMPLE SIZE TO ESTIMATE DIFFERENCES BETWEEN MEANS : Sometimes an investigator is
interested in differences between groups of animals. Now we can perform a one-tailed test. This has an impact
on the value of Z1-α: the one-sided value of Z0.05 is equal to the two-sided Z0.10. In order to make the sample size
calculation we need: an estimation of the difference between both groups Xe − Xc = δ the standard deviation of
the trait, the significance level α, the power of the test, i.e., the probability (1-β) of obtaining a significant result
if the true, difference equals Xe − Xc . The sample size formula is written as:
Strategies for Considerations Requirement Sample Size…
www.ijmrem.com IJMREM Page 18
( )
( )
)14(
*
*2
2
12/1






−
+
=
−−
ce XX
SZZ
n

n = estimated sample size for each of the exposed and unexposed groups.
Z1-α/2 = value of Z which provides α/2 in each tail of normal curve.
Z1-β = value of Z which provides β in the tail of normal curve. β specifies the probability of declaring a
difference to be statistically no significant when there is a real difference in the population.
S = estimate of standard deviation common to both exposed and unexposed groups.
eX = estimate of mean outcome in exposed group or cases.
cX = estimate of mean outcome in unexposed group or control.
The constant, 2, in the formula arises from the assumption that the S is equal in both groups. The calculated
sample size is the number of individuals per group.  49
VI. CONCLUSION
Determining the sample size usually depends mainly on the quality and purpose of study, some assumptions
required conducting the whole sample such as type I and type II error also the power of test and some
considerations, and a study with inadequate power is unethical unless being conducted as a safety and feasibility
study. It should be done at the time of planning a study, based on the type of the research question and study
design it is therefore important to make realistic and well-researched assumptions before choosing an
appropriate sample size. Clinical trials are very important issue in medical fields specially in the early stage
which need small group of people to assess safety by looking for other any side effects, and later stage involve
large numbers of people to take part and it is depends on the differences between the effects of two treatments
whether large or small. So large numbers of people are needed to find out reliably whether one treatment is
better than another. Statisticians give expert guidance to help the researchers make sure a trial includes enough
people to give reliable results. And not like other fields such as psychological or educational programmers
which needed to assessment of investigator to how determinant a sample size. Finally, can say that the sample
size calculations are only guidelines to how many units should be investigated. It is not a strict number as the
assumptions underlying the calculations will almost never exactly mirror the true values.
REFRENCES
1. Duolao Wang and Ameet Bakhai, - clinical trails a practical guide to design, analysis, and reporting.
Remedica London, 2006
2. National institute for health research- understanding clinical trials version 2 2010 UK
3. World Medical Association Declaration of Helsinki. Ethical Principles for Medical Research Involving
Human Subjects. Available from: www.wma.net/e/policy/b3.htm. Accessed May 6, 2005
4. F. Hoffmann-La Roche Ltd GPS Public Affairs 4070, Basel, Switzerland 2013
5. https://www.australianclinicaltrials.gov.au/what-clinical-trial/phases-clinical-trials
6. World Medical Association Declaration of Helsinki. Ethical Principles for Medical Research Involving
Human Subjects. Available from: www.wma.net/e/policy/b3.htm. Accessed May 6, 2005.
7. Altman DG, Schulz KF, Moher D, et al. The revised CONSORT statement for reporting randomized
trials: explanation and elaboration. Ann Intern Med 2001;134:663–94.
Moher D, Schulz KF, Altman DG. The CONSORT statement: revised recommendations for improving
the quality of reports of parallel-group randomized clinical trials. Lancet 2001;357:1191–4
8. Jump up^ FDA Page last updated 25 April 2014 FDA's Drug Review Process: Continued
9. Jump up^ PhRMA. February 2007 Drug Discovery and Development
10. Jump up^ Merck Manual. Last full review/revision October 2013 by Daniel A. Hussar, PhD Overview of
Over-the-Counter Drugs
11. Glaucoma Laser Trial Research Group (1991). The Glaucoma Laser Trial (GLT): 3. Design and methods,
Controlled Clinical Trials 12, 504–524.
12. Duolao, W & Dorothea N & Ameet B. Clinical Trials -A Practical Guide to Design, Analysis, and
Reporting Published by Remedica, London WC1A 1NU, UK, Chicago, IL 60606, USA – 2006, 3-12
13. Pocock SJ. Clinical Trials: A Practical Approach. New York: John Wiley & Sons, 1983.
14. Chow SC, Liu JP. Design and Analysis of Clinical Trials: Concept and Methodologies. New York: John
Wiley & Sons, 1998.
Strategies for Considerations Requirement Sample Size…
www.ijmrem.com IJMREM Page 19
15. Friedman LM, Furberg CD, Demets D. Fundamentals of Clinical Trials, 3rd edition. New York:
Springer-Verlag, 1998.
16. Matthews JNS. An Introduction to Randomized Controlled Clinical Trials. London: Arnold, 2000.
17. 1-^ Jump up to:a b c d e f g h i j k DeMets, D.,Friedman, L., and Furberg, C. (2010). Fundamentals of
Clinical Trials (4th ed.). Springer. ISBN 978-1-4419-1585-6.
18. Spilker, Bert. Guide to Clinical Trials, Raven Press, 1984. Page XXii-Xxiii.
19. http://www.clinicaltrials.gov/ct2/info/understand
20. http://www.dddmag.com/the-cost-of-clinical-trials.aspx
21. Janet wittes 2002, Sample Size Calculations for Randomized Controlled trails, johns Hopkins Bloomberg
school of public health VOL 24, NO 1, USA, 39 -53
22. Gehan EA, Schneiderman MA: Historical and methodological developments in clinical trials at the
national cancer institute’s .Stat .Med 9:871-1990.
23. Daowen Zhang Department of Statistics North Carolina State University c 2009 by Anastasios A. Tsiatis
and Daowen Zhang
24. Scott smith, Determining Sample Size: How to Ensure You Get the Correct Sample Size 2013
25. Patel, M., Doku, V., and Tennakoon, L. “Challenges in recruitment of research participants.”Advances in
Psychiatric Treatment. 9. (2003) Accessed on 22 June 2011.
26. Kasiulevicius V, Sapoka V, Filipaviciute R. Sample size calculation in epidemiological
studies. Gerontology. 2006;7:225–31.
27. Cai J, Zeng D. Sample size/power calculation for case-cohort studies. Biometrics. 2004;60:1015–
24. [PubMed]
28. Shein-Shung C, Jun S, Hansheng W. Sample Size Calculation in Clinical Trial. New York: Marcel
Dekker Inc; 2003. Chapter 1, page 11, section 1.2.3.
29. ICH Topic E 9, Statistical Principal for Clinical Trials Step 4, Consensus guideline, 05Feb1998 Note for
Guidance On Statistical Principles For Clinical Trial. Available viahttp://www.ich.org .
30. Tushar Vijay Sakpal, (2010) "Sample Size Estimation in Clinical Trial" Perspect Clin Res,
PMCID: PMC3148614 PP 67-69
31. Fosgate GT. Practical sample size calculations for surveillance and diagnostic investigations. J Vet Diagn
Invest. 2009;21:3–14. [PubMed]
32. Temple RJ.A regulatory authority’s opinion about Surrogate endpoint. In: Nimmo WS, Tuker GT, editor
.clinical Measurement in Drug Evaluation. New York: John Wiley and sons, 1995: 3-22. 2) Fleming TR,
DeMets DL .Surrgate endpoint in clinical trials :are we
33. Ziad Taib lectures note in Biostatistics Astra Zeneca, Chalmers University of technology- Goteborg
March 12, 2008
34. Ingeborg van der Tweel, Sample size determination Intern report Julius Center for Health Sciences and
Primary Care, October, 2006
35. Collett D. Modelling Survival Data in Medical Research, 2nd edition. London: Chapman and Hall, 2003.
Cox DR, Oakes D. Analysis of Survival Data. London: Chapman and Hall, 1984.
Pocock SJ, Clayton TC, Altman DG. Survival plots of time-to-event outcomes in clinical trials: good
practice and pitfalls. Lancet 2002;359:1686–9.
36. Bland JM, Altman DG. Survival probabilities (the Kaplan–Meier method).BMJ 1998;317:1572.
Kirkwood B, Sterne J. Essential Medical Statistics, 2nd edition. Oxford: Blackwell Publishing, 2003.
http://biostat.mc.vanderbilt.edu/twiki/bin/view/Main/PowerSampleSiz
37. Todd S et al., Interim analyses and sequential designs in phase III studies. Br J ClinPharmacol, 2001, 51:
394-399.
38. Donner A. Approaches to sample size estimation in the design of clinical trials- a review. Statistics in
Medicine, 1984, 9: 199-214
39. Friedman LM, CD Furberg, DL DeMets. Fundamentals of clinical trials (3d ed.). Springer Verlag, New
York (1998).
40. Greenland S. Power, sample size and smallest detectable effect determination for
multivariate studies. Statistics in Medicine, 1985, 4: 117-127.
41. Lachin JM. Introduction to sample size determination and power analysis for clinical trials. Contr Clin
Trials, 1981, 2: 93-113.
42. Fleiss JL. Statistical Methods for Rates and Proportions. 2nd Ed. New York: Wiley; 1981.
43. Cannon, R.M. and Roe, R.T. (1982). Livestock Disease Surveys. A Field Manual for Veterinarians.
Bureau of Resource Science, Department of Primary Industry. Aust. Gov. Publ. Serv. Canberra, 35.
44. Ludbrook J. Interim analyses of data as they accumulate in laboratory experimentation. BMC Medical
research Methodology, 2003, 3: 15.
Strategies for Considerations Requirement Sample Size…
www.ijmrem.com IJMREM Page 20
FIGURES AND TABLES
The numeric result and plots : To determinant the best sample size for each formula; firstly we determine the
elements such as phase clinical trial, type I error, type II error and the margin of error, and after that we must
applied in varies formula to get the sample size. Each of them respect to limited situation and according to
formula mentioned previously.
Table (1): Samples size of phase 1 clinical trial if type I error =5%, type II error =10% with = 15%
Margin of error
0.05 0.10 36 0.16
0.05 0.15 30 0.18
0.05 0.20 24 0.21
0.10 0.15 57 0.12
0.10 0.20 37 0.16
0.15 0.20 75 0.10
Figure (1)
Figure1. Sample size and error of phase I
Table (2): Sample size in phase II clinical trials
Sample  Stage 1 Stage 2 Total Power
1 0.2 14 246 260 0.05
2 0.3 8 323 331 0.845
3 0.4 6 369 375 0.9998
4 0.5 4 384 388 0.9999
Strategies for Considerations Requirement Sample Size…
www.ijmrem.com IJMREM Page 21
Figure 2:
Figure 2: sample size and power for two stage in phase II
Table (3) sample size in phase III clinical trials:
d n
0.10 0.15 1168 1335
0.15 0.20 1726 2093
0.20 0.25 1917 2474
0.25 0.30 2162 2982
0.30 0.35 2471 3661
0.35 0.40 2469 3950
0.40 0.45 2473 4300
0.45 0.50 2163 4120
0.50 0.55 2178 4796
0.55 0.60 1713 4031
0.60 0.65 1550 4133
0.65 0.70 1281 3942
0.70 0.75 997 3625
0.75 0.80 703 3124
0.80 0.85 432 2471
0.85 0.90 233 1864
0.90 0.95 89 1187

More Related Content

What's hot

Learning about drug use problem
Learning about drug use problemLearning about drug use problem
Learning about drug use problemSohani Ali
 
One size does not fit all unique study management challenges for diagnostic ...
One size does not fit all  unique study management challenges for diagnostic ...One size does not fit all  unique study management challenges for diagnostic ...
One size does not fit all unique study management challenges for diagnostic ...Lyssa Friedman
 
Understanding Clinical Trials
Understanding Clinical TrialsUnderstanding Clinical Trials
Understanding Clinical TrialsBartsMSBlog
 
FDA 2013 Clinical Investigator Training Course: Issues in Clinical Trial Desi...
FDA 2013 Clinical Investigator Training Course: Issues in Clinical Trial Desi...FDA 2013 Clinical Investigator Training Course: Issues in Clinical Trial Desi...
FDA 2013 Clinical Investigator Training Course: Issues in Clinical Trial Desi...MedicReS
 
Medical Students 2011 - J.B. Vermorken - INTRODUCTION TO CANCER TREATMENT - I...
Medical Students 2011 - J.B. Vermorken - INTRODUCTION TO CANCER TREATMENT - I...Medical Students 2011 - J.B. Vermorken - INTRODUCTION TO CANCER TREATMENT - I...
Medical Students 2011 - J.B. Vermorken - INTRODUCTION TO CANCER TREATMENT - I...European School of Oncology
 
Developing the Reimbursement Story 2016-03-10
Developing the Reimbursement Story 2016-03-10Developing the Reimbursement Story 2016-03-10
Developing the Reimbursement Story 2016-03-10Lyssa Friedman
 
Protocol Design & Development: What You Need to Know to Ensure a Successful S...
Protocol Design & Development: What You Need to Know to Ensure a Successful S...Protocol Design & Development: What You Need to Know to Ensure a Successful S...
Protocol Design & Development: What You Need to Know to Ensure a Successful S...Brook White, PMP
 
DSMB - The Medical Perspective
DSMB - The Medical PerspectiveDSMB - The Medical Perspective
DSMB - The Medical PerspectiveBBCR Consulting
 
Bioequivalence of Highly Variable Drug Products
Bioequivalence of Highly Variable Drug ProductsBioequivalence of Highly Variable Drug Products
Bioequivalence of Highly Variable Drug ProductsBhaswat Chakraborty
 
Clinical Trial Protocol Review for Study Feasibility Analysis
Clinical Trial Protocol Review for Study Feasibility AnalysisClinical Trial Protocol Review for Study Feasibility Analysis
Clinical Trial Protocol Review for Study Feasibility AnalysisYing Lu
 
Prescription event monitoring and record linkage system
Prescription event monitoring and record linkage systemPrescription event monitoring and record linkage system
Prescription event monitoring and record linkage systemVineetha Menon
 
Adaptive Clinical Trials
Adaptive Clinical TrialsAdaptive Clinical Trials
Adaptive Clinical TrialsJay1818mar
 
Real effectiveness medicine pursuing best effectiveness in the ordinary care ...
Real effectiveness medicine pursuing best effectiveness in the ordinary care ...Real effectiveness medicine pursuing best effectiveness in the ordinary care ...
Real effectiveness medicine pursuing best effectiveness in the ordinary care ...Malmivaara Antti
 
Reasons for conducting clinical trials
Reasons for conducting clinical trialsReasons for conducting clinical trials
Reasons for conducting clinical trialsJohn Douglas
 
NELC-POCT20120930a
NELC-POCT20120930aNELC-POCT20120930a
NELC-POCT20120930aMark Gusack
 
Medpace late phase_white_paper_final
Medpace late phase_white_paper_finalMedpace late phase_white_paper_final
Medpace late phase_white_paper_finalMedpace
 
Educating the Next Generation Pharmacist for Industry. The Panjab University ...
Educating the Next Generation Pharmacist for Industry. The Panjab University ...Educating the Next Generation Pharmacist for Industry. The Panjab University ...
Educating the Next Generation Pharmacist for Industry. The Panjab University ...Ajaz Hussain
 

What's hot (19)

Learning about drug use problem
Learning about drug use problemLearning about drug use problem
Learning about drug use problem
 
One size does not fit all unique study management challenges for diagnostic ...
One size does not fit all  unique study management challenges for diagnostic ...One size does not fit all  unique study management challenges for diagnostic ...
One size does not fit all unique study management challenges for diagnostic ...
 
Understanding Clinical Trials
Understanding Clinical TrialsUnderstanding Clinical Trials
Understanding Clinical Trials
 
FDA 2013 Clinical Investigator Training Course: Issues in Clinical Trial Desi...
FDA 2013 Clinical Investigator Training Course: Issues in Clinical Trial Desi...FDA 2013 Clinical Investigator Training Course: Issues in Clinical Trial Desi...
FDA 2013 Clinical Investigator Training Course: Issues in Clinical Trial Desi...
 
Medical Students 2011 - J.B. Vermorken - INTRODUCTION TO CANCER TREATMENT - I...
Medical Students 2011 - J.B. Vermorken - INTRODUCTION TO CANCER TREATMENT - I...Medical Students 2011 - J.B. Vermorken - INTRODUCTION TO CANCER TREATMENT - I...
Medical Students 2011 - J.B. Vermorken - INTRODUCTION TO CANCER TREATMENT - I...
 
Developing the Reimbursement Story 2016-03-10
Developing the Reimbursement Story 2016-03-10Developing the Reimbursement Story 2016-03-10
Developing the Reimbursement Story 2016-03-10
 
Protocol Design & Development: What You Need to Know to Ensure a Successful S...
Protocol Design & Development: What You Need to Know to Ensure a Successful S...Protocol Design & Development: What You Need to Know to Ensure a Successful S...
Protocol Design & Development: What You Need to Know to Ensure a Successful S...
 
DSMB - The Medical Perspective
DSMB - The Medical PerspectiveDSMB - The Medical Perspective
DSMB - The Medical Perspective
 
Bioequivalence of Highly Variable Drug Products
Bioequivalence of Highly Variable Drug ProductsBioequivalence of Highly Variable Drug Products
Bioequivalence of Highly Variable Drug Products
 
Clinical Trial Protocol Review for Study Feasibility Analysis
Clinical Trial Protocol Review for Study Feasibility AnalysisClinical Trial Protocol Review for Study Feasibility Analysis
Clinical Trial Protocol Review for Study Feasibility Analysis
 
Modern quality management
Modern quality managementModern quality management
Modern quality management
 
Prescription event monitoring and record linkage system
Prescription event monitoring and record linkage systemPrescription event monitoring and record linkage system
Prescription event monitoring and record linkage system
 
Adaptive Clinical Trials
Adaptive Clinical TrialsAdaptive Clinical Trials
Adaptive Clinical Trials
 
Real effectiveness medicine pursuing best effectiveness in the ordinary care ...
Real effectiveness medicine pursuing best effectiveness in the ordinary care ...Real effectiveness medicine pursuing best effectiveness in the ordinary care ...
Real effectiveness medicine pursuing best effectiveness in the ordinary care ...
 
ADAPTIVE PATHWAYS
ADAPTIVE PATHWAYSADAPTIVE PATHWAYS
ADAPTIVE PATHWAYS
 
Reasons for conducting clinical trials
Reasons for conducting clinical trialsReasons for conducting clinical trials
Reasons for conducting clinical trials
 
NELC-POCT20120930a
NELC-POCT20120930aNELC-POCT20120930a
NELC-POCT20120930a
 
Medpace late phase_white_paper_final
Medpace late phase_white_paper_finalMedpace late phase_white_paper_final
Medpace late phase_white_paper_final
 
Educating the Next Generation Pharmacist for Industry. The Panjab University ...
Educating the Next Generation Pharmacist for Industry. The Panjab University ...Educating the Next Generation Pharmacist for Industry. The Panjab University ...
Educating the Next Generation Pharmacist for Industry. The Panjab University ...
 

Similar to Strategies for Considerations Requirement Sample Size in Different Clinical Trials

CLINICAL DATA MANAGEMENT SAS CDM Online Learning
CLINICAL DATA MANAGEMENT SAS CDM Online LearningCLINICAL DATA MANAGEMENT SAS CDM Online Learning
CLINICAL DATA MANAGEMENT SAS CDM Online Learningshanmukha rao dondapati
 
ich guidelines for clinical trials, scientific approach ppt.pptx
ich guidelines for clinical trials, scientific approach ppt.pptxich guidelines for clinical trials, scientific approach ppt.pptx
ich guidelines for clinical trials, scientific approach ppt.pptxJyotshnaDevi4
 
Clinical research basic things
Clinical research basic thingsClinical research basic things
Clinical research basic thingsSRIJIL SREEDHARAN
 
Clinical reaserch 112070804001
Clinical reaserch 112070804001Clinical reaserch 112070804001
Clinical reaserch 112070804001Patel Parth
 
Clinical reaserch 112070804001
Clinical reaserch 112070804001Clinical reaserch 112070804001
Clinical reaserch 112070804001Patel Parth
 
Beyond the Horizon: Navigating Late Phase Clinical Trials
Beyond the Horizon: Navigating Late Phase Clinical TrialsBeyond the Horizon: Navigating Late Phase Clinical Trials
Beyond the Horizon: Navigating Late Phase Clinical TrialsRuchi Vahi
 
Clinical trial design, Trial Size, and Study Population
Clinical trial design, Trial Size, and Study Population Clinical trial design, Trial Size, and Study Population
Clinical trial design, Trial Size, and Study Population Shubham Chinchulkar
 
Clinical Solutions White Paper
Clinical Solutions White PaperClinical Solutions White Paper
Clinical Solutions White PaperMichael Passanante
 
Clinical trails overview
 Clinical trails overview Clinical trails overview
Clinical trails overviewshashi sinha
 
1670327194_887_Research_with_human_participation.pptx
1670327194_887_Research_with_human_participation.pptx1670327194_887_Research_with_human_participation.pptx
1670327194_887_Research_with_human_participation.pptxVelmaPranayReddy
 
Clinical Trials Introduction
Clinical Trials IntroductionClinical Trials Introduction
Clinical Trials Introductionbiinoida
 
Randomized clinical trials
Randomized clinical trialsRandomized clinical trials
Randomized clinical trialsAhmed Nouri
 
Different phases of clinical trials
Different phases of clinical trialsDifferent phases of clinical trials
Different phases of clinical trialsAzad Singh
 

Similar to Strategies for Considerations Requirement Sample Size in Different Clinical Trials (20)

Clinical Trials in biomedical engineering
Clinical Trials in biomedical engineeringClinical Trials in biomedical engineering
Clinical Trials in biomedical engineering
 
SDTM Fnal Detail Training
SDTM Fnal Detail TrainingSDTM Fnal Detail Training
SDTM Fnal Detail Training
 
CLINICAL DATA MANAGEMENT SAS CDM Online Learning
CLINICAL DATA MANAGEMENT SAS CDM Online LearningCLINICAL DATA MANAGEMENT SAS CDM Online Learning
CLINICAL DATA MANAGEMENT SAS CDM Online Learning
 
3.clinical trials
3.clinical trials3.clinical trials
3.clinical trials
 
Clinical trials
Clinical trialsClinical trials
Clinical trials
 
ich guidelines for clinical trials, scientific approach ppt.pptx
ich guidelines for clinical trials, scientific approach ppt.pptxich guidelines for clinical trials, scientific approach ppt.pptx
ich guidelines for clinical trials, scientific approach ppt.pptx
 
Clinical research
Clinical research Clinical research
Clinical research
 
Clinical research basic things
Clinical research basic thingsClinical research basic things
Clinical research basic things
 
Clinical reaserch 112070804001
Clinical reaserch 112070804001Clinical reaserch 112070804001
Clinical reaserch 112070804001
 
Clinical reaserch 112070804001
Clinical reaserch 112070804001Clinical reaserch 112070804001
Clinical reaserch 112070804001
 
Beyond the Horizon: Navigating Late Phase Clinical Trials
Beyond the Horizon: Navigating Late Phase Clinical TrialsBeyond the Horizon: Navigating Late Phase Clinical Trials
Beyond the Horizon: Navigating Late Phase Clinical Trials
 
Clinical trial design, Trial Size, and Study Population
Clinical trial design, Trial Size, and Study Population Clinical trial design, Trial Size, and Study Population
Clinical trial design, Trial Size, and Study Population
 
Clinical Solutions White Paper
Clinical Solutions White PaperClinical Solutions White Paper
Clinical Solutions White Paper
 
Randomized Controlled Trial
Randomized Controlled TrialRandomized Controlled Trial
Randomized Controlled Trial
 
Clinical trails overview
 Clinical trails overview Clinical trails overview
Clinical trails overview
 
1670327194_887_Research_with_human_participation.pptx
1670327194_887_Research_with_human_participation.pptx1670327194_887_Research_with_human_participation.pptx
1670327194_887_Research_with_human_participation.pptx
 
CLINICAL TRIALS.pptx
CLINICAL TRIALS.pptxCLINICAL TRIALS.pptx
CLINICAL TRIALS.pptx
 
Clinical Trials Introduction
Clinical Trials IntroductionClinical Trials Introduction
Clinical Trials Introduction
 
Randomized clinical trials
Randomized clinical trialsRandomized clinical trials
Randomized clinical trials
 
Different phases of clinical trials
Different phases of clinical trialsDifferent phases of clinical trials
Different phases of clinical trials
 

More from IJMREMJournal

Anti-Smog Radar Application for Vehicles
Anti-Smog Radar Application for VehiclesAnti-Smog Radar Application for Vehicles
Anti-Smog Radar Application for VehiclesIJMREMJournal
 
IoT based Environmental Monitoring and Control System
IoT based Environmental Monitoring and Control SystemIoT based Environmental Monitoring and Control System
IoT based Environmental Monitoring and Control SystemIJMREMJournal
 
Analysis and Implementation of Solid-State Relays in Industrial application F...
Analysis and Implementation of Solid-State Relays in Industrial application F...Analysis and Implementation of Solid-State Relays in Industrial application F...
Analysis and Implementation of Solid-State Relays in Industrial application F...IJMREMJournal
 
MIM (Mobile Instant Messaging) Classification using Term Frequency-Inverse Do...
MIM (Mobile Instant Messaging) Classification using Term Frequency-Inverse Do...MIM (Mobile Instant Messaging) Classification using Term Frequency-Inverse Do...
MIM (Mobile Instant Messaging) Classification using Term Frequency-Inverse Do...IJMREMJournal
 
Is Lean Management applicable to the hospital and for which results?
Is Lean Management applicable to the hospital and for which results?Is Lean Management applicable to the hospital and for which results?
Is Lean Management applicable to the hospital and for which results?IJMREMJournal
 
Fabrication and Performance Analysis of Solar Tracking System by Using By-Pas...
Fabrication and Performance Analysis of Solar Tracking System by Using By-Pas...Fabrication and Performance Analysis of Solar Tracking System by Using By-Pas...
Fabrication and Performance Analysis of Solar Tracking System by Using By-Pas...IJMREMJournal
 
Reactivity Feedback Effect on the Reactor Behaviour during SBLOCA in a 4-loop...
Reactivity Feedback Effect on the Reactor Behaviour during SBLOCA in a 4-loop...Reactivity Feedback Effect on the Reactor Behaviour during SBLOCA in a 4-loop...
Reactivity Feedback Effect on the Reactor Behaviour during SBLOCA in a 4-loop...IJMREMJournal
 
Lyapunov-type inequalities for a fractional q, -difference equation involvin...
Lyapunov-type inequalities for a fractional q, -difference equation involvin...Lyapunov-type inequalities for a fractional q, -difference equation involvin...
Lyapunov-type inequalities for a fractional q, -difference equation involvin...IJMREMJournal
 
The Policies of Government Intervention as Third-Party for Conflict in Bike-S...
The Policies of Government Intervention as Third-Party for Conflict in Bike-S...The Policies of Government Intervention as Third-Party for Conflict in Bike-S...
The Policies of Government Intervention as Third-Party for Conflict in Bike-S...IJMREMJournal
 
Epidemiological study for Trichomonas Vaginalis for Discrete time model and C...
Epidemiological study for Trichomonas Vaginalis for Discrete time model and C...Epidemiological study for Trichomonas Vaginalis for Discrete time model and C...
Epidemiological study for Trichomonas Vaginalis for Discrete time model and C...IJMREMJournal
 
Energy Conservation through Smart Building and Smart Lighting System
Energy Conservation through Smart Building and Smart Lighting SystemEnergy Conservation through Smart Building and Smart Lighting System
Energy Conservation through Smart Building and Smart Lighting SystemIJMREMJournal
 
The Effect of Workplace Relationship toward Job Satisfaction of Divine Word C...
The Effect of Workplace Relationship toward Job Satisfaction of Divine Word C...The Effect of Workplace Relationship toward Job Satisfaction of Divine Word C...
The Effect of Workplace Relationship toward Job Satisfaction of Divine Word C...IJMREMJournal
 
Semi-automatic Picture Book Generation based on Story Model and Agent-based S...
Semi-automatic Picture Book Generation based on Story Model and Agent-based S...Semi-automatic Picture Book Generation based on Story Model and Agent-based S...
Semi-automatic Picture Book Generation based on Story Model and Agent-based S...IJMREMJournal
 
Efficiency Evaluation of Thailand Gross Domestic Product Using DEA
Efficiency Evaluation of Thailand Gross Domestic Product Using DEAEfficiency Evaluation of Thailand Gross Domestic Product Using DEA
Efficiency Evaluation of Thailand Gross Domestic Product Using DEAIJMREMJournal
 
Predicting Trade Conflict Outcomes using a Third-Party Intervention Model
Predicting Trade Conflict Outcomes using a Third-Party Intervention ModelPredicting Trade Conflict Outcomes using a Third-Party Intervention Model
Predicting Trade Conflict Outcomes using a Third-Party Intervention ModelIJMREMJournal
 
Proposed Framework for Effective Management of End-User Stakeholders’ in Publ...
Proposed Framework for Effective Management of End-User Stakeholders’ in Publ...Proposed Framework for Effective Management of End-User Stakeholders’ in Publ...
Proposed Framework for Effective Management of End-User Stakeholders’ in Publ...IJMREMJournal
 
Fresh and Hardened Properties of Ground Granulated Blast Furnace Slag Made Co...
Fresh and Hardened Properties of Ground Granulated Blast Furnace Slag Made Co...Fresh and Hardened Properties of Ground Granulated Blast Furnace Slag Made Co...
Fresh and Hardened Properties of Ground Granulated Blast Furnace Slag Made Co...IJMREMJournal
 
Design and Evaluation of Open Graded Hot Mix Asphalt Using Cement as A Grout...
 Design and Evaluation of Open Graded Hot Mix Asphalt Using Cement as A Grout... Design and Evaluation of Open Graded Hot Mix Asphalt Using Cement as A Grout...
Design and Evaluation of Open Graded Hot Mix Asphalt Using Cement as A Grout...IJMREMJournal
 
Design of Cold Recycled Emulsified Asphalt Mixtures Using Portland Cement as ...
Design of Cold Recycled Emulsified Asphalt Mixtures Using Portland Cement as ...Design of Cold Recycled Emulsified Asphalt Mixtures Using Portland Cement as ...
Design of Cold Recycled Emulsified Asphalt Mixtures Using Portland Cement as ...IJMREMJournal
 
Thermodynamic Analysis of Cooling Tower with Air to Air Heat Exchanger for Re...
Thermodynamic Analysis of Cooling Tower with Air to Air Heat Exchanger for Re...Thermodynamic Analysis of Cooling Tower with Air to Air Heat Exchanger for Re...
Thermodynamic Analysis of Cooling Tower with Air to Air Heat Exchanger for Re...IJMREMJournal
 

More from IJMREMJournal (20)

Anti-Smog Radar Application for Vehicles
Anti-Smog Radar Application for VehiclesAnti-Smog Radar Application for Vehicles
Anti-Smog Radar Application for Vehicles
 
IoT based Environmental Monitoring and Control System
IoT based Environmental Monitoring and Control SystemIoT based Environmental Monitoring and Control System
IoT based Environmental Monitoring and Control System
 
Analysis and Implementation of Solid-State Relays in Industrial application F...
Analysis and Implementation of Solid-State Relays in Industrial application F...Analysis and Implementation of Solid-State Relays in Industrial application F...
Analysis and Implementation of Solid-State Relays in Industrial application F...
 
MIM (Mobile Instant Messaging) Classification using Term Frequency-Inverse Do...
MIM (Mobile Instant Messaging) Classification using Term Frequency-Inverse Do...MIM (Mobile Instant Messaging) Classification using Term Frequency-Inverse Do...
MIM (Mobile Instant Messaging) Classification using Term Frequency-Inverse Do...
 
Is Lean Management applicable to the hospital and for which results?
Is Lean Management applicable to the hospital and for which results?Is Lean Management applicable to the hospital and for which results?
Is Lean Management applicable to the hospital and for which results?
 
Fabrication and Performance Analysis of Solar Tracking System by Using By-Pas...
Fabrication and Performance Analysis of Solar Tracking System by Using By-Pas...Fabrication and Performance Analysis of Solar Tracking System by Using By-Pas...
Fabrication and Performance Analysis of Solar Tracking System by Using By-Pas...
 
Reactivity Feedback Effect on the Reactor Behaviour during SBLOCA in a 4-loop...
Reactivity Feedback Effect on the Reactor Behaviour during SBLOCA in a 4-loop...Reactivity Feedback Effect on the Reactor Behaviour during SBLOCA in a 4-loop...
Reactivity Feedback Effect on the Reactor Behaviour during SBLOCA in a 4-loop...
 
Lyapunov-type inequalities for a fractional q, -difference equation involvin...
Lyapunov-type inequalities for a fractional q, -difference equation involvin...Lyapunov-type inequalities for a fractional q, -difference equation involvin...
Lyapunov-type inequalities for a fractional q, -difference equation involvin...
 
The Policies of Government Intervention as Third-Party for Conflict in Bike-S...
The Policies of Government Intervention as Third-Party for Conflict in Bike-S...The Policies of Government Intervention as Third-Party for Conflict in Bike-S...
The Policies of Government Intervention as Third-Party for Conflict in Bike-S...
 
Epidemiological study for Trichomonas Vaginalis for Discrete time model and C...
Epidemiological study for Trichomonas Vaginalis for Discrete time model and C...Epidemiological study for Trichomonas Vaginalis for Discrete time model and C...
Epidemiological study for Trichomonas Vaginalis for Discrete time model and C...
 
Energy Conservation through Smart Building and Smart Lighting System
Energy Conservation through Smart Building and Smart Lighting SystemEnergy Conservation through Smart Building and Smart Lighting System
Energy Conservation through Smart Building and Smart Lighting System
 
The Effect of Workplace Relationship toward Job Satisfaction of Divine Word C...
The Effect of Workplace Relationship toward Job Satisfaction of Divine Word C...The Effect of Workplace Relationship toward Job Satisfaction of Divine Word C...
The Effect of Workplace Relationship toward Job Satisfaction of Divine Word C...
 
Semi-automatic Picture Book Generation based on Story Model and Agent-based S...
Semi-automatic Picture Book Generation based on Story Model and Agent-based S...Semi-automatic Picture Book Generation based on Story Model and Agent-based S...
Semi-automatic Picture Book Generation based on Story Model and Agent-based S...
 
Efficiency Evaluation of Thailand Gross Domestic Product Using DEA
Efficiency Evaluation of Thailand Gross Domestic Product Using DEAEfficiency Evaluation of Thailand Gross Domestic Product Using DEA
Efficiency Evaluation of Thailand Gross Domestic Product Using DEA
 
Predicting Trade Conflict Outcomes using a Third-Party Intervention Model
Predicting Trade Conflict Outcomes using a Third-Party Intervention ModelPredicting Trade Conflict Outcomes using a Third-Party Intervention Model
Predicting Trade Conflict Outcomes using a Third-Party Intervention Model
 
Proposed Framework for Effective Management of End-User Stakeholders’ in Publ...
Proposed Framework for Effective Management of End-User Stakeholders’ in Publ...Proposed Framework for Effective Management of End-User Stakeholders’ in Publ...
Proposed Framework for Effective Management of End-User Stakeholders’ in Publ...
 
Fresh and Hardened Properties of Ground Granulated Blast Furnace Slag Made Co...
Fresh and Hardened Properties of Ground Granulated Blast Furnace Slag Made Co...Fresh and Hardened Properties of Ground Granulated Blast Furnace Slag Made Co...
Fresh and Hardened Properties of Ground Granulated Blast Furnace Slag Made Co...
 
Design and Evaluation of Open Graded Hot Mix Asphalt Using Cement as A Grout...
 Design and Evaluation of Open Graded Hot Mix Asphalt Using Cement as A Grout... Design and Evaluation of Open Graded Hot Mix Asphalt Using Cement as A Grout...
Design and Evaluation of Open Graded Hot Mix Asphalt Using Cement as A Grout...
 
Design of Cold Recycled Emulsified Asphalt Mixtures Using Portland Cement as ...
Design of Cold Recycled Emulsified Asphalt Mixtures Using Portland Cement as ...Design of Cold Recycled Emulsified Asphalt Mixtures Using Portland Cement as ...
Design of Cold Recycled Emulsified Asphalt Mixtures Using Portland Cement as ...
 
Thermodynamic Analysis of Cooling Tower with Air to Air Heat Exchanger for Re...
Thermodynamic Analysis of Cooling Tower with Air to Air Heat Exchanger for Re...Thermodynamic Analysis of Cooling Tower with Air to Air Heat Exchanger for Re...
Thermodynamic Analysis of Cooling Tower with Air to Air Heat Exchanger for Re...
 

Recently uploaded

Biology for Computer Engineers Course Handout.pptx
Biology for Computer Engineers Course Handout.pptxBiology for Computer Engineers Course Handout.pptx
Biology for Computer Engineers Course Handout.pptxDeepakSakkari2
 
Past, Present and Future of Generative AI
Past, Present and Future of Generative AIPast, Present and Future of Generative AI
Past, Present and Future of Generative AIabhishek36461
 
Application of Residue Theorem to evaluate real integrations.pptx
Application of Residue Theorem to evaluate real integrations.pptxApplication of Residue Theorem to evaluate real integrations.pptx
Application of Residue Theorem to evaluate real integrations.pptx959SahilShah
 
Software and Systems Engineering Standards: Verification and Validation of Sy...
Software and Systems Engineering Standards: Verification and Validation of Sy...Software and Systems Engineering Standards: Verification and Validation of Sy...
Software and Systems Engineering Standards: Verification and Validation of Sy...VICTOR MAESTRE RAMIREZ
 
Arduino_CSE ece ppt for working and principal of arduino.ppt
Arduino_CSE ece ppt for working and principal of arduino.pptArduino_CSE ece ppt for working and principal of arduino.ppt
Arduino_CSE ece ppt for working and principal of arduino.pptSAURABHKUMAR892774
 
Decoding Kotlin - Your guide to solving the mysterious in Kotlin.pptx
Decoding Kotlin - Your guide to solving the mysterious in Kotlin.pptxDecoding Kotlin - Your guide to solving the mysterious in Kotlin.pptx
Decoding Kotlin - Your guide to solving the mysterious in Kotlin.pptxJoão Esperancinha
 
Introduction-To-Agricultural-Surveillance-Rover.pptx
Introduction-To-Agricultural-Surveillance-Rover.pptxIntroduction-To-Agricultural-Surveillance-Rover.pptx
Introduction-To-Agricultural-Surveillance-Rover.pptxk795866
 
Gurgaon ✡️9711147426✨Call In girls Gurgaon Sector 51 escort service
Gurgaon ✡️9711147426✨Call In girls Gurgaon Sector 51 escort serviceGurgaon ✡️9711147426✨Call In girls Gurgaon Sector 51 escort service
Gurgaon ✡️9711147426✨Call In girls Gurgaon Sector 51 escort servicejennyeacort
 
GDSC ASEB Gen AI study jams presentation
GDSC ASEB Gen AI study jams presentationGDSC ASEB Gen AI study jams presentation
GDSC ASEB Gen AI study jams presentationGDSCAESB
 
Risk Assessment For Installation of Drainage Pipes.pdf
Risk Assessment For Installation of Drainage Pipes.pdfRisk Assessment For Installation of Drainage Pipes.pdf
Risk Assessment For Installation of Drainage Pipes.pdfROCENODodongVILLACER
 
Concrete Mix Design - IS 10262-2019 - .pptx
Concrete Mix Design - IS 10262-2019 - .pptxConcrete Mix Design - IS 10262-2019 - .pptx
Concrete Mix Design - IS 10262-2019 - .pptxKartikeyaDwivedi3
 
What are the advantages and disadvantages of membrane structures.pptx
What are the advantages and disadvantages of membrane structures.pptxWhat are the advantages and disadvantages of membrane structures.pptx
What are the advantages and disadvantages of membrane structures.pptxwendy cai
 
VICTOR MAESTRE RAMIREZ - Planetary Defender on NASA's Double Asteroid Redirec...
VICTOR MAESTRE RAMIREZ - Planetary Defender on NASA's Double Asteroid Redirec...VICTOR MAESTRE RAMIREZ - Planetary Defender on NASA's Double Asteroid Redirec...
VICTOR MAESTRE RAMIREZ - Planetary Defender on NASA's Double Asteroid Redirec...VICTOR MAESTRE RAMIREZ
 
Architect Hassan Khalil Portfolio for 2024
Architect Hassan Khalil Portfolio for 2024Architect Hassan Khalil Portfolio for 2024
Architect Hassan Khalil Portfolio for 2024hassan khalil
 
Study on Air-Water & Water-Water Heat Exchange in a Finned Tube Exchanger
Study on Air-Water & Water-Water Heat Exchange in a Finned Tube ExchangerStudy on Air-Water & Water-Water Heat Exchange in a Finned Tube Exchanger
Study on Air-Water & Water-Water Heat Exchange in a Finned Tube ExchangerAnamika Sarkar
 
Call Girls Delhi {Jodhpur} 9711199012 high profile service
Call Girls Delhi {Jodhpur} 9711199012 high profile serviceCall Girls Delhi {Jodhpur} 9711199012 high profile service
Call Girls Delhi {Jodhpur} 9711199012 high profile servicerehmti665
 
pipeline in computer architecture design
pipeline in computer architecture  designpipeline in computer architecture  design
pipeline in computer architecture designssuser87fa0c1
 

Recently uploaded (20)

Biology for Computer Engineers Course Handout.pptx
Biology for Computer Engineers Course Handout.pptxBiology for Computer Engineers Course Handout.pptx
Biology for Computer Engineers Course Handout.pptx
 
Past, Present and Future of Generative AI
Past, Present and Future of Generative AIPast, Present and Future of Generative AI
Past, Present and Future of Generative AI
 
Application of Residue Theorem to evaluate real integrations.pptx
Application of Residue Theorem to evaluate real integrations.pptxApplication of Residue Theorem to evaluate real integrations.pptx
Application of Residue Theorem to evaluate real integrations.pptx
 
🔝9953056974🔝!!-YOUNG call girls in Rajendra Nagar Escort rvice Shot 2000 nigh...
🔝9953056974🔝!!-YOUNG call girls in Rajendra Nagar Escort rvice Shot 2000 nigh...🔝9953056974🔝!!-YOUNG call girls in Rajendra Nagar Escort rvice Shot 2000 nigh...
🔝9953056974🔝!!-YOUNG call girls in Rajendra Nagar Escort rvice Shot 2000 nigh...
 
Software and Systems Engineering Standards: Verification and Validation of Sy...
Software and Systems Engineering Standards: Verification and Validation of Sy...Software and Systems Engineering Standards: Verification and Validation of Sy...
Software and Systems Engineering Standards: Verification and Validation of Sy...
 
Arduino_CSE ece ppt for working and principal of arduino.ppt
Arduino_CSE ece ppt for working and principal of arduino.pptArduino_CSE ece ppt for working and principal of arduino.ppt
Arduino_CSE ece ppt for working and principal of arduino.ppt
 
Decoding Kotlin - Your guide to solving the mysterious in Kotlin.pptx
Decoding Kotlin - Your guide to solving the mysterious in Kotlin.pptxDecoding Kotlin - Your guide to solving the mysterious in Kotlin.pptx
Decoding Kotlin - Your guide to solving the mysterious in Kotlin.pptx
 
Introduction-To-Agricultural-Surveillance-Rover.pptx
Introduction-To-Agricultural-Surveillance-Rover.pptxIntroduction-To-Agricultural-Surveillance-Rover.pptx
Introduction-To-Agricultural-Surveillance-Rover.pptx
 
Gurgaon ✡️9711147426✨Call In girls Gurgaon Sector 51 escort service
Gurgaon ✡️9711147426✨Call In girls Gurgaon Sector 51 escort serviceGurgaon ✡️9711147426✨Call In girls Gurgaon Sector 51 escort service
Gurgaon ✡️9711147426✨Call In girls Gurgaon Sector 51 escort service
 
GDSC ASEB Gen AI study jams presentation
GDSC ASEB Gen AI study jams presentationGDSC ASEB Gen AI study jams presentation
GDSC ASEB Gen AI study jams presentation
 
Risk Assessment For Installation of Drainage Pipes.pdf
Risk Assessment For Installation of Drainage Pipes.pdfRisk Assessment For Installation of Drainage Pipes.pdf
Risk Assessment For Installation of Drainage Pipes.pdf
 
Exploring_Network_Security_with_JA3_by_Rakesh Seal.pptx
Exploring_Network_Security_with_JA3_by_Rakesh Seal.pptxExploring_Network_Security_with_JA3_by_Rakesh Seal.pptx
Exploring_Network_Security_with_JA3_by_Rakesh Seal.pptx
 
Concrete Mix Design - IS 10262-2019 - .pptx
Concrete Mix Design - IS 10262-2019 - .pptxConcrete Mix Design - IS 10262-2019 - .pptx
Concrete Mix Design - IS 10262-2019 - .pptx
 
What are the advantages and disadvantages of membrane structures.pptx
What are the advantages and disadvantages of membrane structures.pptxWhat are the advantages and disadvantages of membrane structures.pptx
What are the advantages and disadvantages of membrane structures.pptx
 
VICTOR MAESTRE RAMIREZ - Planetary Defender on NASA's Double Asteroid Redirec...
VICTOR MAESTRE RAMIREZ - Planetary Defender on NASA's Double Asteroid Redirec...VICTOR MAESTRE RAMIREZ - Planetary Defender on NASA's Double Asteroid Redirec...
VICTOR MAESTRE RAMIREZ - Planetary Defender on NASA's Double Asteroid Redirec...
 
Architect Hassan Khalil Portfolio for 2024
Architect Hassan Khalil Portfolio for 2024Architect Hassan Khalil Portfolio for 2024
Architect Hassan Khalil Portfolio for 2024
 
Study on Air-Water & Water-Water Heat Exchange in a Finned Tube Exchanger
Study on Air-Water & Water-Water Heat Exchange in a Finned Tube ExchangerStudy on Air-Water & Water-Water Heat Exchange in a Finned Tube Exchanger
Study on Air-Water & Water-Water Heat Exchange in a Finned Tube Exchanger
 
Call Girls Delhi {Jodhpur} 9711199012 high profile service
Call Girls Delhi {Jodhpur} 9711199012 high profile serviceCall Girls Delhi {Jodhpur} 9711199012 high profile service
Call Girls Delhi {Jodhpur} 9711199012 high profile service
 
pipeline in computer architecture design
pipeline in computer architecture  designpipeline in computer architecture  design
pipeline in computer architecture design
 
young call girls in Green Park🔝 9953056974 🔝 escort Service
young call girls in Green Park🔝 9953056974 🔝 escort Serviceyoung call girls in Green Park🔝 9953056974 🔝 escort Service
young call girls in Green Park🔝 9953056974 🔝 escort Service
 

Strategies for Considerations Requirement Sample Size in Different Clinical Trials

  • 1. International Journal of Modern Research in Engineering & Management (IJMREM) ||Volume|| 1||Issue|| 8 ||Pages|| 07-21 || August 2018|| ISSN: 2581-4540 www.ijmrem.com IJMREM Page 7 Strategies for Considerations Requirement Sample Size in Different Clinical Trials Altaiyb Omer Ahmed*1 – Babiker Gafar Yousif2 -Amani Babiker Mohamed3 - Salma Mustafa Alnaier4 1,2,3,4 Sudan University of science and technology – department of statistics -------------------------------------------------------ABSTRACT --------------------------------------------------- Usually the main problem face any investigation it how to determent a sample size, however, some considerations required in sample size to conduct the efficacy and make realistic well-researched before began study. This study aimed to determine the maximum possible sample size at different phases of clinical trials and attempt to achieve the best accuracy of the results. To achieve that the maximum sample size in different phases we found that the maximum sample size of phase I was (75) relies on largest response rate 20% and the minimal clinically important difference (MCID) 15%, and because the participants are healthy often that means 15% enough to show positive results of the transition to the second phase. for the phase II clinical trials; the maximum sample size was (388) depend on the error 5% and largest response rate 50% when the response rate should not be less than 20% according to the design used in this phase. Depend on the endpoint and hazard ratio in phase III clinical trials when the probability of survival of the treatment group equal to median of the probability of survival 50% we found that the maximum sample size (4796). For the phase IV the maximum sample size in different phases of clinical trials does not affect whatever the large of the population size and remains constant as large as possible size. KEYWORDS: Sample Size, Survival, Phases, Hazard Ratio, Drugs, Clinical Trials --------------------------------------------------------------------------------------------------------------------------------------- Date of Submission: Date, 10 February 2018 Date of Accepted: 20 March 2018 --------------------------------------------------------------------------------------------------------------------------------------- I. INTRODUCTION Clinical trials are scientific investigations that examine and evaluate the safety and efficacy of new drugs or therapeutic procedures using human subjects. The results that these studies generate are considered to be the most valued data in the area of evidence-based medicine. Understanding the principles behind clinical trials enables an appreciation of the validity and reliability of their results.  1 When designing a clinical trial, the objective is to select a sample of patients with the disease or condition under investigation. Sample size calculations should be based on the way the data will be analyzed. But, even if more complex methods of analysis will be used ultimately, it is easier and usually sufficient to estimate the sample size assuming a simpler method of analysis, such as the t-test or two means or chi-square test of two proportions. Consideration should be given to the source of the patients, the investigators who are going to recruit them, disease status, and any ethical issues surrounding participation. A set of carefully defined eligibility criteria is essential. This should ensure that the study findings have ‘external validity’ or, in other words, are generalizable for the treatment of future patients with the same disease or condition. In this chapter, we discuss some of the important issues to consider when selecting patients for clinical trials. The aim of a well-designed clinical trial is to ask an important question about the effectiveness or safety of a treatment andto provide a reliable answer by performing statistical analysisand assessing whether an observed treatment difference isdue to chance. The reliability of the answer is determined bythe sample size of the trial: the larger a trial, the less likelywe are to miss a real difference between treatments by chance, we review the issues that determinean appropriate sample size for a randomized controlled trial.Theaim clinical trials and attempt to achieve the best accuracy of the results the statistical power of a study and a study with inadequate power is unethical unless being conducted as a safety and feasibility study. However, the calculation of sample size is not an exact science. It is therefore important to make realistic and well-researched assumptions before choosing an appropriate sample size. This sample size should account for dropouts, and there should be a consideration for interim analyses to be performed during the study, which can be used to amend the final sample size.
  • 2. Strategies for Considerations Requirement Sample Size… www.ijmrem.com IJMREM Page 8 II. CLINICAL TRIALS Clinical trials are medical research studies to test whether different treatments are safe and how well they work. Some trials involve healthy members of the public, and others involve patients who may be offered the option of taking part in a trial during their care and treatment  2 . Also Clinical trials define as an experiments or observations done in clinical research Such prospective biomedical or behavioral research studies on human participants are designed to answer specific questions about biomedical or behavioral interventions, including new treatments (such as novel vaccines, drugs, dietary choices, dietary supplements, and medical devices) and known interventions that warrant further study and comparison. Clinical trials generate data on safety and efficacy 3 . They are conducted only after they have received health authority/ethics committee approval in the country where approval of the therapy is sought. These authorities are responsible for vetting the risk/benefit ratio of the trial – their approval does not mean that the therapy is 'safe' or effective, only that the trial may be conducted. it explore how a treatment reacts in the human body and are designed to ensure a drug is tolerated and effective before it is licensed by regulatory authorities and made available for use by doctors. Studies vary in their primary goal or endpoint (i.e. the most important outcome of the trial), the number of patients involved, and the specifics of the study design. However, all clinical studies conform to a strict set of criteria to protect the patients involved and to ensure rigorous evaluation of the drug.  4 . Many clinical trials to develop new interventions are conducted in phases. In the early phases, the new intervention is tested in a small number of participants to assess safety and effectiveness. If the intervention is promising, it may move to later phases of testing where the number of participants is increased to collect more information on effectiveness and possible side effects. A clinical trial evaluates the effect of a new drug (or device or procedure) on human volunteers. These trials can be used to evaluate the safety of a new drug in healthy human volunteers, or to assess treatment benefits in patients with a specific disease. Clinical trials can compare a new drug against existing drugs or against dummy medications (placebo) or they may not have a comparison arm  85 − TRIALS OF DRUGS : Some clinical trials involve healthy subjects with no pre-existing medical conditions. Other clinical trials pertain to patients with specific health conditions who are willing to try an experimental treatment.Usually pilot experiments are conducted to gain insights for design of the clinical trial to follow.There are two goals to testing medical treatments: to learn whether they work well enough, called "efficacy" or "effectiveness"; and to learn whether they are safe enough, called "safety". Neither is an absolute criterion; both safety and efficacy are evaluated relative to how the treatment is intended to be used, what other treatments are available, and the severity of the disease or condition. The benefits must outweigh the risks  109 − . For example, many drugs to treat cancer have severe side effects that would not be acceptable for an over-the- counter pain medication, yet the cancer drugs have been approved since they are used under a physician's care, and are used for a life-threatening condition  11 . Compounds, no matter how promising or impassioned the pleas for use, have to go through a series oftests in animals before they can be tested in humans.Those considered to lack promise after animal testingdo not come to testing in humans  12 .Typically, the testing in humans is done in a timeordered sequence, as suggested by the phase labelaffixed to trials as defined below. However, in truth, adjoining phases overlap in purpose. Hence, the label, at best, serves only as a rough indicator of the stage of testing, especially when, as is often the case, drugsponsors, at any given point in time, may have severaltrials under way carrying different phase labels. PHASES OF CLINICAL TRIALS : The phases of clinical trials are the steps in which scientists do experiments with a health intervention in an attempt to find enough evidence for a process which would be useful as a medical treatment. In the case of pharmaceutical study, the phases start with drug design and drug discovery then proceed on to animal testing. If this is successful, they begin the clinical phase of development by testing for safety in a few human subjects and expand to test in many study participants to determine if the treatment is effective.  13 Clinical trials are usually conducted in phases that build on one another. Each phase is designed to answer certain questions. Knowing the phase of the clinical trial is important because it can give you some idea about how much is known about the treatment being studied. There are pros and cons to taking part in each phase of a clinical trial. Four phases of clinical trials and medicine development exist and are
  • 3. Strategies for Considerations Requirement Sample Size… www.ijmrem.com IJMREM Page 9 defined below. Each of these definitions is a functional one and the terms are not defined on a strict chronological basis. An investigational medicine is often evaluated in tow or more phases simultaneously in different clinical trials.  1714− PHASE 0 CLINICAL TRIALS : Even though phase 0 studies are done in humans, this type of study isn’t like the other phases of clinical trials. The purpose of this phase is to help speed up and streamline the drug approval process. Phase 0 studies are exploratory studies that often use only a few small doses of a new drug in a few patients. They might test whether the drug reaches the tumor, how the drug acts in the human body, and how cancer cells in the human body respond to the drug. The patients in these studies might need extra tests such as biopsies, scans, and blood samples as part of the study process. The biggest difference between phase 0 and the later phases of clinical trials is that there’s almost no chance the volunteer will benefit by taking part in a phase 0 trial – the benefit will be for other people in the future. Because drug doses are low, there’s also less risk to the patient in phase 0 studies compared to phase I studies. Phase 0 studies help researchers find out whether the drugs do what they’re expected to do. If there are problems with the way the drug is absorbed or acts in the body, this should become clear very quickly in a phase 0 clinical trials. This process may help avoid the delay and expense of finding out years later in phase II or even phase III clinical trials that the drug doesn’t act as expected to base on lab studies. Phase 0 studies aren’t used widely, and there are some drugs for which they wouldn’t be helpful. Phase 0 studies are very small, often with fewer than 15 people, and the drug is given only for a short time. They’re not a required part of testing a new drug. PHASE 1 CLINICAL TRIALS : Phase I studies of a new drug are usually the first that involve people. The main reason for doing it is to find the highest dose of the new treatment that can be given safely without serious side effects. Although the treatment has been tested in lab and animal studies, the side effects in people can’t always be predicted. These studies also help to decide on the best way to give the new treatment. Researchers test an experimental drug or treatment in a small group of people Key points of phase I clinical trials observed such as: The first few people in the study often get a very low dose of the treatment and are watched very closely. If there are only minor side effects, the next few participants may get a higher dose. This process continues until doctors find a dose that’s most likely to work while having an acceptable level of side effects. Safety is the main concern at this point. Doctors keep a close eye on the people and watch for any serious side effects. Because of the small numbers of people in phase I studies, rare side effects may not be seen until later. Placebos are not part of phase I trials. These studies usually include a small number of people (typically up to a few dozen) and are not designed to find out if the new treatment works against disease. In Overall, phase I trials are the ones with the most potential risk. PHASE II CLINICAL TRIALS : If a new treatment is found to be reasonably safe in Phase I clinical trials, it can then be tested in a phase II clinical trial to find out if it works. The type of benefit or response the doctors look for depends on the goal of the treatment. It may mean the disease shrinks or disappears. Or it might mean there’s an extended period of time where the disease doesn’t get any bigger, or there’s a longer time before the disease comes back. In some studies, the benefit may be an improved quality of life. Many studies look to see if people getting the new treatment live longer than they would have been expected to without the treatment. Also Key points of phase II clinical trials must be concentrations: Usually, a group of 25 to 100 patients with the same type of disease get the new treatment in a phase II study. They’re treated using the dose and method found to be the safest and most effective in phase I studies. In a phase II clinical trial, all the volunteers usually get the same dose. But some phase II studies randomly assign participants to different treatment groups. These groups may get different doses or get the treatment in different ways to see which provides the best balance of safety and effectiveness. No placebo is used. Phase II studies are often done at major disease centers, but may also be done in community hospitals or even doctors’ offices. Larger numbers of patients get the treatment in phase II studies, so there’s a better chance that less common side effects may be seen. If enough patients benefit from the treatment, and the side effects aren’t too bad, the treatment is allowed to go on to a phase III clinical trial. Along with watching for responses, the research team keeps looking for any side effects. Phase IIa: Pilot clinical trials to evaluate efficacy (and safety) in selected populationsof patients with the disease or condition to be treated, diagnosed, or prevented. Objectives may focus on dose-response, type of patient, frequency of dosing, ornumerous other characteristics of safety and efficacy. Phase IIb: Well controlled trials to evaluate efficacy (and safety) in patients with the disease or condition to be treated, diagnosed, or prevented. These clinical trialsusually represent the most rigorous demonstration of a medicine's efficacy. Sometimes referred to as pivotal trials. Some Phase II trials are designed as case series, demonstrating a drug's safety and
  • 4. Strategies for Considerations Requirement Sample Size… www.ijmrem.com IJMREM Page 10 activity in a selected group of patients. Other Phase II trials are designed as randomized controlled trials, where some patients receive the drug/device and others receive placebo/standard treatment. Randomized Phase II trials have far fewer patients than randomized Phase III trials.  18 PHASE III CLINICAL TRIALS : Treatments that have been shown to work in phase II studies usually must succeed in one more phase of testing before they’re approved for general use. Phase III clinical trials compare the safety and effectiveness of the new treatment against the current standard treatment. Because doctors do not yet know which treatment is better, study participants are often picked at random to get either the standard treatment or the new treatment. When possible, neither the doctor nor the patient knows which of the treatments the patient is getting. This type of study is called a double-blind study. Randomization and blinding are discussed in more detail later. Key points of phase III clinical trials: Most phase III clinical trials have a large number of patients, at least several hundred. These studies are often done in many places across the country (or even around the world) at the same time. Phase III clinical trials are more likely to be offered by community- based oncologists. These studies tend to last longer than phase I and II studies. Placebos may be used in some phase III studies, but they’re never used alone if there’s a treatment available that works. As with other studies, patients in phase III clinical trials are watched closely for side effects, and treatment is stopped if they’re too bad. Phase IIIa: Trials conducted after efficacy of the medicine is demonstrated, but priorto regulatory submission of a New Drug Application (NDA) or other dossier. These clinical trials are conducted in patient populations for which the medicine is eventually intended. Phase IIIa clinical trials generate additional data on both safety and efficacy in relatively large numbers of patients in both controlled and uncontrolled trials. Clinical trials are also conducted in special groups of patients (e.g., renal failure patients), or under special conditions dictated by the nature ofthe medicine and disease. These trials often provide much of the information neededfor the package insert and labeling of the medicine. Phase IIIb: Clinical trials conducted after regulatory submission of an NDA or other dossier, but prior to the medicine's approval and launch. These trials maysupplement earlier trials, complete earlier trials, or may be directed toward newtypes of trials (e.g., quality of life, marketing) or Phase IV evaluations. This is theperiod between submission and approval of a regulatory dossier for marketing authorization.  19 PHASE IV CLINICAL TRIALS : Drugs approved by food and drug administration (FDA) are often watched over a long period of time in phase IV studies. Even after testing a new medicine on thousands of people, the full effects of the treatment may not be known. Some questions may still need to be answered. For example, a drug may get FDA approval because it was shown to reduce the risk of cancer coming back after treatment. But does this mean that those who get it are more likely to live longer? Are there rare side effects that haven’t been seen yet, or side effects that only show up after a person has taken the drug for a long time? These types of questions may take many more years to answer, and are often addressed in phase IV clinical trials. This is typically the safest type of clinical trial because the treatment has already been studied a lot and might have already been used in many people. Phase IV studies look at safety over time. These studies may also look at other aspects of the treatment, such as quality of life or cost effectiveness  20 . Studies or trials conducted after a medicine is marketed to provide additional details about the medicine's efficacy or safety profile. Different formulations, dosages, durations of treatment, medicine interactions, and other medicine comparisons may be evaluated. New age groups, races, and other types of patients can be studied. Detection and definition of previously unknown or inadequately quantified adverse reactions and related risk factors are an important aspect of many Phase IV studies. If a marketed medicine is to be evaluated for another (i.e., new) indication, then those clinical trials are considered Phase II clinical trials. The term post-marketing surveillance is frequently used to describe those clinical studies in Phase IV (i.e., the period following marketing) that are primarily observational or non-experimental in nature, to distinguish them from well controlled Phase IV clinical trials or marketing studies 21 . You can get the drugs used in a phase IV trial without enrolling in a study. And the care you would get in a phase IV study is very much like the care you could expect if you were to get the treatment outside of a clinical trial. But in phase IV studies you’re helping researchers learn more about the treatment and doing a service to future patients.
  • 5. Strategies for Considerations Requirement Sample Size… www.ijmrem.com IJMREM Page 11 III. GENERAL CONSIDERATIONS Calculation of sample size requires precise specification of the primary hypothesis of the study and the method of analysis. In classical statistical terms, one selects a null hypothesis a long with its associated type I error rate, an alternative hypothesis a long with its associated statistical power, and the test statistic one intends to use to distinguish between the two hypotheses. Sample size calculation becomes an exercise in determining the number of participants required to achieve simultaneously the desired type I error rate and the desired power. For test statistics with well known distributional properties, one may use a standard formula for sample size. Controlled trials often involve deviations from assumptions such that the test statistic has more complicated behavior than a simple formula allows. Loss to follow-up, incomplete compliance with therapy, heterogeneity of the patient population, or variability inconcomitant treatment among centers of a multicenter trialmay require modifications of standard formulas  22 . In some situations, however, the anticipated complexities of a given trial may render all available formulas inadequate. In such cases, the investigator can simulate the trial using an adequate numberof randomly generated outcomes and select the sample size on the basis of those computer simulations.Complicated studies often benefit from a three-step strategy in calculating sample size. First, one may use a simple formula to approximate the necessary size over a range of parameters of interest under a set of ideal assumptions (e.g., no loss to follow-up, full compliance, homogeneity of treatment effect). This calculation allows a rough projection of the resources necessary. Having established the feasibilityof the trial and having further discussed the likely deviations from assumptions, one may then use more refined calculations. Finally, a trial that includes highly specialized features may benefit from simulation for selection of a more appropriate size IV. GEHAN'S TWO – STAGE DESIGN Discarding ineffective treatments early: If it is unlikely that a treatment will achieve some minimal level of response or efficacy, we may want to stop the trial as early as possible. For example, suppose that a 20% response rate is the lowest response rate that is considered acceptable for a new treatment. If we get no responses in n patients, with n sufficiently large, then we may feel confident that the treatment is ineffective. Statistically, this may be posed as follows: How large must n be so that if there are 0 responses among n patients we are relatively confident that the response rate is not 20% or better? If X ∼b(n, π), and if π ≥ .2, then Pπ(X = 0) Choose n so that .8n = .05 or n ln(.8) = ln(.05). This leads to n ≈ 14 (rounding up). Thus, with 14 patients, it is unlikely (≤ .05) that no one would respond if the true response rate was greater than 20%. Thus 0 patients responding among 14 might be used as evidence to stop the phase II trial and declare the treatment a failure  23 . This is the logic behind Gehan’s two-stage design. Gehan suggested the following strategy: If the minimal acceptable response rate is π0, then choose the first stage with n0 patients such that (1 - π0)n0 = .05; n0 = If at least one response is observed in first 14 patients then a second stage of accrual is carried out to obtain an estimate of the response rate. The number of patients to accrue in the second stage depends on the number of response observed in the first stage and the precision desired for the final estimate of response rate. If the first stage consist 14 patients the second stage will consist of: Between 1 and 11 patients, if a standard error of 10% is desired Between 45 and 86 patients, if a standard error of 5% is desired A problem of Gehan’s design is it may allow a very poor drug to move to the second stage. for example, if a drug has a response rate of only 5% , there exists at 51% chance of obtaining at least one response among the first 14 patients consequently ,the first stage 14 patients would not effectively screen inactive drugs. Assume that X is random variable follow the binomial distribution Bin ( ) Let response rate 20% = =
  • 6. Strategies for Considerations Requirement Sample Size… www.ijmrem.com IJMREM Page 12 Then the sample size is: )1( )1log( )log(   − =n Stage1: To determine the sample size in stage 1 used the following formula )2( )1log( )1log( 1   − − = n n Where Response rate Stage2: The sample size in stage2 calculate with  24 )3( )1( 2 2 2   − = Z n Where Minimal clinical different STRATEGIES TO OBTAIN QUALITY SAMPLE 1- Focus your study. Ensure that the research question is feasible and the study answers a question with clear variables. 2- Find a representative sample. Determine the essential inclusion and exclusion criteria for the study population such that findings can accurately generalize or specify results to the target group.  25 3- Determine a recruitment strategy. Specify a plan to identify and enroll study participants. This may involve screening or establishing criteria for number, location, and sampling method. 4- Consult with the community to identify and recruit potential participants. Examine existing infrastructure to find venues of contacting appropriate samples. 5- To avoid selection bias, it is also necessary to recruit an appropriate comparison group. 6- Do not give up after the first attempt to recruit a potential participant. Follow-up using various communication strategies, including personal, written, or electronic messaging. “The significance of personal contact should not be underestimated.  26 7- Allow for flexibility in the process. If current recruitment strategies are resulting in “inadequate enrollment” or modifications are made in criteria of participants, the solution may be to alter the sampling plan. SAMPLE SIZE CALCULATION FOR TESTING A HYPOTHESIS In this kind of research design researcher wants to see the effect of an intervention. Suppose a researcher want to see the effect of an antihypertensive drug so he will select two groups, one group will be given antihypertensive drug and another group will be give placebo. After giving these drugs for a fixed time period blood pressure of both groups will be measured and mean blood pressure of both groups will be compared to see if difference is significant or not. Complex formulae are used for this type of studies and we want to advise readers to use statistical software for calculation of exact sample size. The procedure for calculation of sample size in clinical trials/intervention studies involving two groups is mentioned here. In the case of only two groups method of calculation is mentioned here but if design involves more than two groups then statistical software like G Power should be used for sample size calculation. But understanding of various prerequisites which are needed for sample size calculation is very important  2827− BASIC REQUIREMENT FOR ESTIMATION OF SAMPLE SIZE IN CT Following are the basic considerations for estimating sample size for a CT Study Design : In CT, different statistical study designs are available to achieve objectives. Typical designs that may be employed are parallel group design; crossover design etc.For sample size estimation study design should be explicitly defined in the objective of the trial. A cross over design will have different approach and formula for sample size estimation as compared to parallel group design.
  • 7. Strategies for Considerations Requirement Sample Size… www.ijmrem.com IJMREM Page 13 Hypothesis Testing :This is another critical parameter needed for sample size estimation, which describes aim of a CT. The aim can be equality, non-inferiority, superiority or equivalence.Equality and equivalence trials are two-sided trials where as non-inferiority and superiority trials are one-sided trials.Superiority or non-inferiority trials can be conducted only if there is prior information available about the test drug on a specific end point. Primary Study End Point : The sample size calculation depends on primary end point of a CT. The description of primary study end point should cover whether it is discrete or continuous or time-to-event. Sample size is estimated differently for each of these end points. Sample size is adjusted if primary end point involves multiple comparisons. Expected Response Test vs. Control :The information about expected response is usually obtained from previous trials done on the test drug. If this information is not available, it could be obtained from previous published literature. The important information required is: a. Response expected with test drug (mean expected score / proportion of subjects achieving success.) b. Response expected with control drug (mean expected score / proportion of subjects achieving success.) c. Variability (standard deviation.) Clinical Important/Meaningful Difference/Margin : This is one of most critical and one of most challenging parameters. The challenge here is to define a difference between test and reference which can be considered clinically meaningful. To put it in plain English, this is the difference which will make your family doctor to give you new medication over and above the existing gold standard which he is prescribing for last 10 – 20 years. This threshold figure is at times not easily available and should be decided based on clinical judgment. Level of Significance : This is typically assumed as 5% or lesser. Type I error is inversely proportional to sample size. Power : As per guideline power should not be less that 80%. Type II error is directly proportional to sample size.  3129− Margin of error: The margin of error is the level of precision you require. This is the plus or minus number that is often reported with an estimated proportion and is also called the confidence interval. It is the range in which the true population proportion is estimated to be and is often expressed in percentage points (e.g., ±2%). Note that the actual precision achieved after you collect your data will be more or less than this target amount, because it will be based on the proportion estimated from the data and not your expected sample proportion. Confidence level : The confidence level is the probability that the margin of error contains the true proportion. If the study was repeated and the range calculated each time, you would expect the true value to lie within these ranges on 95% of occasions. The higher the confidence level the more certain you can be that the interval contains the true proportion. Population size: This is the total number of distinct individuals in your population. In this formula we use a finite population correction to account for sampling from populations that are small. If your population is large, but you don’t know how large you can conservatively use 100,000. The sample size doesn’t change much for populations larger than 100,000. Sample proportion : The sample proportion is what you expect the results to be. This can often be determined by using the results from a previous survey, or by running a small pilot study. If you are unsure, use 50%, this is conservative and gives the largest sample size. Note that this sample size calculation uses the Normal approximation to the Binomial distribution. If, the sample proportion is close to 0 or 1 then this approximation is not valid and you need to consider an alternative sample size calculation method. Any major mistake in the sample size calculation will affect the power and value of a study. “Common sample size mistakes include not performing any calculations, making unrealistic assumptions, failing to account for potential losses during the study and failing to investigate sample size over a range of assumptions. Reasons for inadequately sized studies that do not achieve statistical significance include failing to perform sample size calculations, selecting sample
  • 8. Strategies for Considerations Requirement Sample Size… www.ijmrem.com IJMREM Page 14 size based on convenience, failing to secure sufficient funding for the project, and not using the available funding efficiently 32 . THE END POINT: A clinical trial end point is defined as a measure that allow us to decide whether the null hypothesis of a clinical trial should be accepted or rejected .in a clinical trial, the null hypothesis states that there is no statistically significant difference between two treatments or strategies being compared with respect to the endpoint measure chosen an endpoint can be composed of a single outcome measure –such as death due to the disease –or a combination of outcome measure, such as death or hospitalization due to the disease. Clinical trial endpoint can be classified as primary or secondary endpoints. Primary endpoint measure outcome that will answer the primary (or most important) question being asked by a trial ,such as whether a new treatment is better at preventing the disease –related death than the standard therapy. in this case ,the primary endpoint would be based on the occurrence of disease –related deaths during the duration of the trial .Secondary endpoints ask other questions about the same study; for example , whether there is also a reduction in disease measures other than death.Occasionally, secondary endpoints are as important as the primary endpoints ,in which case they are considered to be co-primary endpoints. When secondary endpoint is also important then the trial must be sufficiently powered to detect a difference in both endpoints, and expert statistical and design advice might be needed  33 . SURVIVAL ANALYSIS : In many clinical trials, the outcome is not just whether an event occurs, but also the time it takes for the event to occur. For example, in a cancer study comparing the relative merits of surgery and chemotherapy treatments, the outcome measured could be the time from the start of therapy to the death of the subject. In this case the event of interest is death, but in other situations it might be the end of a period spent in remission from cancer spread, relief of symptoms, or a further admission to hospital. These types of data are generally referred to as time-to-event data or survival data, even when the endpoint or the event being studied is something other than the death of a subject. The term survival analysis encompasses the methods and models for analyzing such data representing timefree from events of interest. V. BASIC CONCEPTS IN SURVIVAL ANALYSIS CENSORING: In survival analysis, not all subjects are involved in the study for the same length of time due to censoring. This term denotes when information on the outcome status of a subject stops being available. This can be because the patient is lost to follow-up (eg, they have moved away) or stops participating in the study, or because the end of the study observation period is reached without the subject having an event. Censoring is a nearly universal feature of survival data. SURVIVAL FUNCTION AND HAZARD FUNCTION : In survival analysis, two functions are of central interest, namely survival function and hazard function. The survival function, S(t), is the probability that the survival time of an individual is greater than or equal to time t. Since S(t) is the probability of surviving (or remaining event-free) to time t, 1 – S(t) is the probability of experiencing an event by time t. Put simply, as t gets larger, the probability of an event increases and therefore S(t) decreases. Plotting a graphof probability against time produces a survival curve, which is a useful component in the analysis of such data. Since S(t) is a probability, its value must be ≥0 but ≤1.When t = 0, S(0) = 1, indicating that all patients are event-free at the start of study. Within these restrictions, the S(t) curve can have a wide variety of shapes.The hazard function, h(t), represents the instantaneous event rate at time t for an individual surviving to time t and, in the case of the pancreatic cancer trial, it represents the instantaneous death rate. With regard to numerical magnitude, the hazard is a quantity that has the form of ‘number of events per time. For this reason, the hazard is sometimes interpreted as an incidence rate. To interpret the value of the hazard, we must know the unit in which time is measured. Assume we plan a RCT aiming at comparing a new treatment (drug) with an old one (control). Such a comparison can be made in terms of the hazard ratio or some function of this. Let d stand for the drug and c for control In the sequel we describe the sample size required to demonstrate that the drug is better than the control treatment. This will be made under some assumptions in two steps
  • 9. Strategies for Considerations Requirement Sample Size… www.ijmrem.com IJMREM Page 15 Step 1: specify the number of events needed In what follows we will use the notation below to give a formula specifying the number of events needed to have a certain asymptotic power in many different cases like.The log-rank test – the score test – parametric tests based on the exponential distribution – etc. )4( )( 2 2   pq ZC d power+ = Where the proportion of individual receiving the new drug the upper quintile of the standard normal distribution It is not clear how d should estimate. The difficulty lies in the fact that this depends on the exact situation at hand. Step 2: specify the number of patients needed to obtain the “the right” number of events. In what follows we consider how we can specify the number of patients needed to get the “right” number of events needed to have a certain asymptotic power. In general this will depend on 1-The length of the recruitment period T 2-The recruitment rate R 3- The follow up time F 4-The survival function for the control group d = 2N x P(event) )2N => d/P(event) P(event) is a function of the length of total follow-up at time of analysis and the average hazard rate. In clinical research an end point is often the time to the occurrence of some particular event, such as the death of patient. These types of data known as survival data. In this section the outcome variable is a time-to-event, for example when (people are followed until death). In practice, not everyone can be observed until death; some people will die during the study, while others can be followed until the end of the study period. If these individuals are still alive at the end of the study; we call their observed follow-up times ‘censored’. Thus the length of follow-up may vary between individuals and the outcome is dichotomous (event ‘yes’ or ‘no’)  34 . In survival analysis, two function are of central interest, namely survival functions S(t) and hazard function h(t). The survival function is the probability that the survival time of an individual is greater than or equal to time t. the hazard function represent the instantaneous event (death) rate at time t for an individual’s surviving to time t. To compare two groups of individuals with respect to their follow-up times on two different treatments (for example a control treatment C and an experimental treatment E), a log-rank test is used. The power of the log-rank test depends on the total number of events in the study, rather than on the number of individuals enrolled in the study. Therefore sample size and study duration are determined in two steps. First the number of events d is estimated as a function of the type I error α, the type II error β (or the power 1-β) and the treatment effect δ0. The treatment effect δ0 is characterized by the ratio of the hazard rates (i.e. the risks of the occurrence of the event in the two groups). It is assumed that this hazard ratio does not change with follow-up time 4135− . The total number of events can be determined by: )5()() 1 1 ( 0 0    ZZd + − + =
  • 10. Strategies for Considerations Requirement Sample Size… www.ijmrem.com IJMREM Page 16 Where is equal to the hazard ratio (HR) )6( )log( )log( 0 c e P P = the estimated survival probability in the control group the estimated survival probability in experimental group after a certain follow-up time T. Next the necessary total number of patients' n can be determined based on the estimated number of events d and the estimated survival probabilities in the two treatment groups: )7( 2 2 ec PP d n −− = In the other hand when we want to estimate the sample size to compare two responses rate we should use the formulae as below: ( ) ( ) )8( )( ))1(1( 021 2211 2   −− −+−+ = ZZ n SAMPLE SIZE TO ESTIMATE A PROPORTION : When one wants to investigate the presence of disease, we are dealing with a presence/absence (binomial) situation because each selected element is either infected or not infected  4642− . One property of the Binomial distribution is that the variance equals p * (1 - p), where p is expressed as a proportion (or it is p * (100 - p), when p is expressed as a percentage). Of course, the standard deviation is the square root of p * (1 -p). We can then use the following formula to determine the samples size. )9( ˆˆ)1(ˆ ˆˆ ˆ ˆˆ 2 2 2/1 2 2/1 QPZNE QPNZ E QPZ n   +− = −− n = estimated sample size for the study. Z1-α/2 = value of Z which provides α/2 in each tail of normal curve Pˆ = the best guess of the prevalence of the disease in the population. Qˆ = 1− Pˆ E = allowable error or required precision. N = population size. If the population size is large, this is irrelevant (equivalent to sampling with replacement). A property of the variance of a proportion is that it is symmetric around its maximum at p = 0.5 (or 50%). Hence, the sample size is maximal when p is estimated to be 50%, and this value should be used when there is no idea of the actual proportion. Be careful with the value you select for E, especially at low or high prevalence. SAMPLE SIZE TO ESTIMATE DIFFERENCES BETWEEN PROPORTIONS : Suppose you want to compare two antibiotics. Two groups of animals are infected with an appropriate pathogen and the percentages of recovery in both groups are compared. How many animals should be included in each group? The following formula can be used 47 :     )10( 2 2 2 12/1 ce ccee PP QPQPZQPZ n − ++ = − n = estimated sample size for each of the exposed and unexposed groups. Z1-α/2 = value of Z which provides α/2 in each tail of normal curve.
  • 11. Strategies for Considerations Requirement Sample Size… www.ijmrem.com IJMREM Page 17 Z1-β = value of Z which provides β in the tail of normal curve. β specifies the probability of declaring a difference to be statistically no significant when there is a real difference in the population. Pe = estimate of response rate in exposed group or exposure rate in cases. Pc = estimate of response rate in unexposed group or exposure rate in control. P = (Pe + Pc) / 2 PQ −=1 SAMPLE SIZE TO DETECT A DISEASE IN A POPULATION : Suppose one is interested in the percentage of farms that are infected with a pathogen X (prevalence based on whether or not the pathogen is present at a farm). A farm is considered to be infected when at least one of its animals is infected. First the appropriate number of farms as units of concern is randomly chosen and secondly the status of the farm (infected or not) is determined. The proportion of infected animals per farm is not of major interest. Ideally, we would screen all the animals on a farm, but often this is not necessary. Suppose that it is known that if the disease is present, about 50% of the animals are likely to be positive. By sampling one animal you have a 50% probability of correctly concluding that a truly positive farm is positive. In general, one aims at a higher probability to classify a positive farm correctly (e.g., 95%). By selecting 2 animals, the probability is increased up to 75% (25% of drawings show two negatives), 3 animals yield 87.5%, 4 animals 93.75% and 5 animals 96.875%. Thus, between 4 and 5 animals should be sampled to detect positive farms with a probability of 95%, if 50% of the animals are truly diseased. The calculations can be put into a general formula  48 : )11() 2 )1( (*))1(1( 1 − −−−= d Npn d n = sample size p = probability of finding at least one case ( confidence level, e.g., 0.95) d = number of (detectable) cases in the population N = population size If the test that is used to evaluate the status of the animals is not 100% sensitive, d is equal to the number of diseased or infected animals multiplied by the sensitivity of the test. It is assumed that no false-positives are present or that they are ruled out by confirmatory tests. SAMPLE SIZE FORMULA TO ESTIMATE A MEAN To calculate sample sizes for a mean obtained from a Normal distribution, we need to estimate both the mean and its standard deviation (S). Secondly, we need to define an interval L, indicating that with a probability of (1 - α)% the true population mean will be within the interval of the sample mean ± L. This interval is therefore an indication of the precision of the estimate. Thirdly, we have to decide on (1 - α). There is no general rule for this decision, but 95 are commonly used. From this we can determine the corresponding number of units (Z) of S. For example, if (1 - α)= 95 then the significance level is 5% and Z0.05 = 1.96. This value indicates that that 95% of all the observations will fall within the interval: mean ± 1.96*S / √n. The confidence interval (CI) for a mean, obtained by drawing elements from a Normal distribution, can be written as: )12( *2/1 n SZ XCI − = If the part after the ± sign is denoted as E, n is then calculated as: )13( ˆ* 2 22 2/1 E SZ n − = n = sample size. Z1-α/2 = value of Z which provides α/2 in each tail of normal curve. S ˆ = estimate of standard deviation in the population. E = allowable error or required precision. SAMPLE SIZE TO ESTIMATE DIFFERENCES BETWEEN MEANS : Sometimes an investigator is interested in differences between groups of animals. Now we can perform a one-tailed test. This has an impact on the value of Z1-α: the one-sided value of Z0.05 is equal to the two-sided Z0.10. In order to make the sample size calculation we need: an estimation of the difference between both groups Xe − Xc = δ the standard deviation of the trait, the significance level α, the power of the test, i.e., the probability (1-β) of obtaining a significant result if the true, difference equals Xe − Xc . The sample size formula is written as:
  • 12. Strategies for Considerations Requirement Sample Size… www.ijmrem.com IJMREM Page 18 ( ) ( ) )14( * *2 2 12/1       − + = −− ce XX SZZ n  n = estimated sample size for each of the exposed and unexposed groups. Z1-α/2 = value of Z which provides α/2 in each tail of normal curve. Z1-β = value of Z which provides β in the tail of normal curve. β specifies the probability of declaring a difference to be statistically no significant when there is a real difference in the population. S = estimate of standard deviation common to both exposed and unexposed groups. eX = estimate of mean outcome in exposed group or cases. cX = estimate of mean outcome in unexposed group or control. The constant, 2, in the formula arises from the assumption that the S is equal in both groups. The calculated sample size is the number of individuals per group.  49 VI. CONCLUSION Determining the sample size usually depends mainly on the quality and purpose of study, some assumptions required conducting the whole sample such as type I and type II error also the power of test and some considerations, and a study with inadequate power is unethical unless being conducted as a safety and feasibility study. It should be done at the time of planning a study, based on the type of the research question and study design it is therefore important to make realistic and well-researched assumptions before choosing an appropriate sample size. Clinical trials are very important issue in medical fields specially in the early stage which need small group of people to assess safety by looking for other any side effects, and later stage involve large numbers of people to take part and it is depends on the differences between the effects of two treatments whether large or small. So large numbers of people are needed to find out reliably whether one treatment is better than another. Statisticians give expert guidance to help the researchers make sure a trial includes enough people to give reliable results. And not like other fields such as psychological or educational programmers which needed to assessment of investigator to how determinant a sample size. Finally, can say that the sample size calculations are only guidelines to how many units should be investigated. It is not a strict number as the assumptions underlying the calculations will almost never exactly mirror the true values. REFRENCES 1. Duolao Wang and Ameet Bakhai, - clinical trails a practical guide to design, analysis, and reporting. Remedica London, 2006 2. National institute for health research- understanding clinical trials version 2 2010 UK 3. World Medical Association Declaration of Helsinki. Ethical Principles for Medical Research Involving Human Subjects. Available from: www.wma.net/e/policy/b3.htm. Accessed May 6, 2005 4. F. Hoffmann-La Roche Ltd GPS Public Affairs 4070, Basel, Switzerland 2013 5. https://www.australianclinicaltrials.gov.au/what-clinical-trial/phases-clinical-trials 6. World Medical Association Declaration of Helsinki. Ethical Principles for Medical Research Involving Human Subjects. Available from: www.wma.net/e/policy/b3.htm. Accessed May 6, 2005. 7. Altman DG, Schulz KF, Moher D, et al. The revised CONSORT statement for reporting randomized trials: explanation and elaboration. Ann Intern Med 2001;134:663–94. Moher D, Schulz KF, Altman DG. The CONSORT statement: revised recommendations for improving the quality of reports of parallel-group randomized clinical trials. Lancet 2001;357:1191–4 8. Jump up^ FDA Page last updated 25 April 2014 FDA's Drug Review Process: Continued 9. Jump up^ PhRMA. February 2007 Drug Discovery and Development 10. Jump up^ Merck Manual. Last full review/revision October 2013 by Daniel A. Hussar, PhD Overview of Over-the-Counter Drugs 11. Glaucoma Laser Trial Research Group (1991). The Glaucoma Laser Trial (GLT): 3. Design and methods, Controlled Clinical Trials 12, 504–524. 12. Duolao, W & Dorothea N & Ameet B. Clinical Trials -A Practical Guide to Design, Analysis, and Reporting Published by Remedica, London WC1A 1NU, UK, Chicago, IL 60606, USA – 2006, 3-12 13. Pocock SJ. Clinical Trials: A Practical Approach. New York: John Wiley & Sons, 1983. 14. Chow SC, Liu JP. Design and Analysis of Clinical Trials: Concept and Methodologies. New York: John Wiley & Sons, 1998.
  • 13. Strategies for Considerations Requirement Sample Size… www.ijmrem.com IJMREM Page 19 15. Friedman LM, Furberg CD, Demets D. Fundamentals of Clinical Trials, 3rd edition. New York: Springer-Verlag, 1998. 16. Matthews JNS. An Introduction to Randomized Controlled Clinical Trials. London: Arnold, 2000. 17. 1-^ Jump up to:a b c d e f g h i j k DeMets, D.,Friedman, L., and Furberg, C. (2010). Fundamentals of Clinical Trials (4th ed.). Springer. ISBN 978-1-4419-1585-6. 18. Spilker, Bert. Guide to Clinical Trials, Raven Press, 1984. Page XXii-Xxiii. 19. http://www.clinicaltrials.gov/ct2/info/understand 20. http://www.dddmag.com/the-cost-of-clinical-trials.aspx 21. Janet wittes 2002, Sample Size Calculations for Randomized Controlled trails, johns Hopkins Bloomberg school of public health VOL 24, NO 1, USA, 39 -53 22. Gehan EA, Schneiderman MA: Historical and methodological developments in clinical trials at the national cancer institute’s .Stat .Med 9:871-1990. 23. Daowen Zhang Department of Statistics North Carolina State University c 2009 by Anastasios A. Tsiatis and Daowen Zhang 24. Scott smith, Determining Sample Size: How to Ensure You Get the Correct Sample Size 2013 25. Patel, M., Doku, V., and Tennakoon, L. “Challenges in recruitment of research participants.”Advances in Psychiatric Treatment. 9. (2003) Accessed on 22 June 2011. 26. Kasiulevicius V, Sapoka V, Filipaviciute R. Sample size calculation in epidemiological studies. Gerontology. 2006;7:225–31. 27. Cai J, Zeng D. Sample size/power calculation for case-cohort studies. Biometrics. 2004;60:1015– 24. [PubMed] 28. Shein-Shung C, Jun S, Hansheng W. Sample Size Calculation in Clinical Trial. New York: Marcel Dekker Inc; 2003. Chapter 1, page 11, section 1.2.3. 29. ICH Topic E 9, Statistical Principal for Clinical Trials Step 4, Consensus guideline, 05Feb1998 Note for Guidance On Statistical Principles For Clinical Trial. Available viahttp://www.ich.org . 30. Tushar Vijay Sakpal, (2010) "Sample Size Estimation in Clinical Trial" Perspect Clin Res, PMCID: PMC3148614 PP 67-69 31. Fosgate GT. Practical sample size calculations for surveillance and diagnostic investigations. J Vet Diagn Invest. 2009;21:3–14. [PubMed] 32. Temple RJ.A regulatory authority’s opinion about Surrogate endpoint. In: Nimmo WS, Tuker GT, editor .clinical Measurement in Drug Evaluation. New York: John Wiley and sons, 1995: 3-22. 2) Fleming TR, DeMets DL .Surrgate endpoint in clinical trials :are we 33. Ziad Taib lectures note in Biostatistics Astra Zeneca, Chalmers University of technology- Goteborg March 12, 2008 34. Ingeborg van der Tweel, Sample size determination Intern report Julius Center for Health Sciences and Primary Care, October, 2006 35. Collett D. Modelling Survival Data in Medical Research, 2nd edition. London: Chapman and Hall, 2003. Cox DR, Oakes D. Analysis of Survival Data. London: Chapman and Hall, 1984. Pocock SJ, Clayton TC, Altman DG. Survival plots of time-to-event outcomes in clinical trials: good practice and pitfalls. Lancet 2002;359:1686–9. 36. Bland JM, Altman DG. Survival probabilities (the Kaplan–Meier method).BMJ 1998;317:1572. Kirkwood B, Sterne J. Essential Medical Statistics, 2nd edition. Oxford: Blackwell Publishing, 2003. http://biostat.mc.vanderbilt.edu/twiki/bin/view/Main/PowerSampleSiz 37. Todd S et al., Interim analyses and sequential designs in phase III studies. Br J ClinPharmacol, 2001, 51: 394-399. 38. Donner A. Approaches to sample size estimation in the design of clinical trials- a review. Statistics in Medicine, 1984, 9: 199-214 39. Friedman LM, CD Furberg, DL DeMets. Fundamentals of clinical trials (3d ed.). Springer Verlag, New York (1998). 40. Greenland S. Power, sample size and smallest detectable effect determination for multivariate studies. Statistics in Medicine, 1985, 4: 117-127. 41. Lachin JM. Introduction to sample size determination and power analysis for clinical trials. Contr Clin Trials, 1981, 2: 93-113. 42. Fleiss JL. Statistical Methods for Rates and Proportions. 2nd Ed. New York: Wiley; 1981. 43. Cannon, R.M. and Roe, R.T. (1982). Livestock Disease Surveys. A Field Manual for Veterinarians. Bureau of Resource Science, Department of Primary Industry. Aust. Gov. Publ. Serv. Canberra, 35. 44. Ludbrook J. Interim analyses of data as they accumulate in laboratory experimentation. BMC Medical research Methodology, 2003, 3: 15.
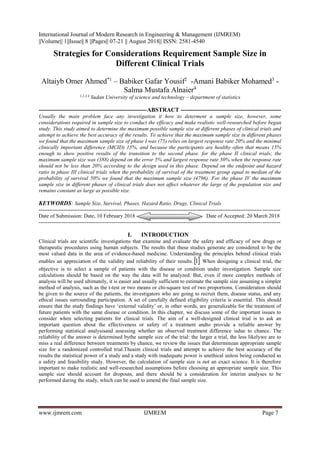
  • 14. Strategies for Considerations Requirement Sample Size… www.ijmrem.com IJMREM Page 20 FIGURES AND TABLES The numeric result and plots : To determinant the best sample size for each formula; firstly we determine the elements such as phase clinical trial, type I error, type II error and the margin of error, and after that we must applied in varies formula to get the sample size. Each of them respect to limited situation and according to formula mentioned previously. Table (1): Samples size of phase 1 clinical trial if type I error =5%, type II error =10% with = 15% Margin of error 0.05 0.10 36 0.16 0.05 0.15 30 0.18 0.05 0.20 24 0.21 0.10 0.15 57 0.12 0.10 0.20 37 0.16 0.15 0.20 75 0.10 Figure (1) Figure1. Sample size and error of phase I Table (2): Sample size in phase II clinical trials Sample  Stage 1 Stage 2 Total Power 1 0.2 14 246 260 0.05 2 0.3 8 323 331 0.845 3 0.4 6 369 375 0.9998 4 0.5 4 384 388 0.9999
  • 15. Strategies for Considerations Requirement Sample Size… www.ijmrem.com IJMREM Page 21 Figure 2: Figure 2: sample size and power for two stage in phase II Table (3) sample size in phase III clinical trials: d n 0.10 0.15 1168 1335 0.15 0.20 1726 2093 0.20 0.25 1917 2474 0.25 0.30 2162 2982 0.30 0.35 2471 3661 0.35 0.40 2469 3950 0.40 0.45 2473 4300 0.45 0.50 2163 4120 0.50 0.55 2178 4796 0.55 0.60 1713 4031 0.60 0.65 1550 4133 0.65 0.70 1281 3942 0.70 0.75 997 3625 0.75 0.80 703 3124 0.80 0.85 432 2471 0.85 0.90 233 1864 0.90 0.95 89 1187