The International Journal of Computer Science and Information Security (IJCSIS) invites submissions for its January-December 2018 issues, covering diverse topics in computer science and information security. The journal is indexed in major databases and aims to provide high-quality research, surveys, and review articles to promote academic growth. The editorial board consists of esteemed professionals from reputable institutions worldwide.


![IJCSIS
ISSN (online): 1947-5500
Please consider to contribute to and/or forward to the appropriate groups the following opportunity to submit and publish
original scientific results.
CALL FOR PAPERS
International Journal of Computer Science and Information Security (IJCSIS)
January-December 2018 Issues
The topics suggested by this issue can be discussed in term of concepts, surveys, state of the art, research,
standards, implementations, running experiments, applications, and industrial case studies. Authors are invited
to submit complete unpublished papers, which are not under review in any other conference or journal in the
following, but not limited to, topic areas.
See authors guide for manuscript preparation and submission guidelines.
Indexed by Google Scholar, DBLP, CiteSeerX, Directory for Open Access Journal (DOAJ), Bielefeld
Academic Search Engine (BASE), SCIRUS, Scopus Database, Cornell University Library, ScientificCommons,
ProQuest, EBSCO and more.
Deadline: see web site
Notification: see web site
Revision: see web site
Publication: see web site
For more topics, please see web site https://sites.google.com/site/ijcsis/
For more information, please visit the journal website (https://sites.google.com/site/ijcsis/)
Context-aware systems
Networking technologies
Security in network, systems, and applications
Evolutionary computation
Industrial systems
Evolutionary computation
Autonomic and autonomous systems
Bio-technologies
Knowledge data systems
Mobile and distance education
Intelligent techniques, logics and systems
Knowledge processing
Information technologies
Internet and web technologies, IoT
Digital information processing
Cognitive science and knowledge
Agent-based systems
Mobility and multimedia systems
Systems performance
Networking and telecommunications
Software development and deployment
Knowledge virtualization
Systems and networks on the chip
Knowledge for global defense
Information Systems [IS]
IPv6 Today - Technology and deployment
Modeling
Software Engineering
Optimization
Complexity
Natural Language Processing
Speech Synthesis
Data Mining](https://image.slidesharecdn.com/journalofcomputerscienceijcsisjuly2018fullvolume-180915043348/75/Journal-of-computer-science-ijcsis-july-2018-full-volume-5-2048.jpg)


![IJCSIS EDITORIAL BOARD
IJCSIS Editorial Board IJCSIS Guest Editors / Associate Editors
Dr. Shimon K. Modi [Profile]
Director of Research BSPA Labs,
Purdue University, USA
Dr Riktesh Srivastava [Profile]
Associate Professor, Information Systems,
Skyline University College, Sharjah, PO 1797,
UAE
Professor Ying Yang, PhD. [Profile]
Computer Science Department, Yale University, USA
Dr. Jianguo Ding [Profile]
Norwegian University of Science and Technology
(NTNU), Norway
Professor Hamid Reza Naji, PhD. [Profile]
Department of Computer Enigneering, Shahid
Beheshti University, Tehran, Iran
Dr. Naseer Alquraishi [Profile]
University of Wasit, Iraq
Professor Yong Li, PhD. [Profile]
School of Electronic and Information Engineering,
Beijing Jiaotong University,
P. R. China
Dr. Kai Cong [Profile]
Intel Corporation,
& Computer Science Department, Portland State
University, USA
Professor Mokhtar Beldjehem, PhD. [Profile]
Sainte-Anne University, Halifax, NS, Canada
Dr. Omar A. Alzubi [Profile]
Al-Balqa Applied University (BAU), Jordan
Professor Yousef Farhaoui, PhD.
Department of Computer Science, Moulay Ismail
University, Morocco
Dr. Jorge A. Ruiz-Vanoye [Profile]
Universidad Autónoma del Estado de Morelos,
Mexico
Dr. Alex Pappachen James [Profile]
Queensland Micro-nanotechnology center, Griffith
University, Australia
Prof. Ning Xu,
Wuhan University of Technology, China
Professor Sanjay Jasola [Profile]
Gautam Buddha University
Dr . Bilal Alatas [Profile]
Department of Software Engineering, Firat
University, Turkey
Dr. Siddhivinayak Kulkarni [Profile]
University of Ballarat, Ballarat, Victoria, Australia
Dr. Ioannis V. Koskosas,
University of Western Macedonia, Greece
Dr. Reza Ebrahimi Atani [Profile]
University of Guilan, Iran
Dr Venu Kuthadi [Profile]
University of Johannesburg, Johannesburg, RSA
Dr. Dong Zhang [Profile]
University of Central Florida, USA
Dr. Zhihan lv [Profile]
Chinese Academy of Science, China
Dr. Vahid Esmaeelzadeh [Profile]
Iran University of Science and Technology
Prof. Ghulam Qasim [Profile]
University of Engineering and Technology,
Peshawar, Pakistan
Dr. Jiliang Zhang [Profile]
Northeastern University, China
Prof. Dr. Maqbool Uddin Shaikh [Profile]
Preston University, Islamabad, Pakistan
Dr. Jacek M. Czerniak [Profile]
Casimir the Great University in Bydgoszcz, Poland
Dr. Musa Peker [Profile]
Faculty of Technology, Mugla Sitki Kocman
University, Turkey
Dr. Binh P. Nguyen [Profile]
National University of Singapore
Dr. Wencan Luo [Profile]
University of Pittsburgh, US
Professor Seifeidne Kadry [Profile]
American University of the Middle East, Kuwait
Dr. Ijaz Ali Shoukat [Profile]
King Saud University, Saudi Arabia
Dr. Riccardo Colella [Profile]
University of Salento, Italy
Dr. Yilun Shang [Profile]
Tongji University, Shanghai, China
Dr. Sedat Akleylek [Profile]
Ondokuz Mayis University, Turkey
Dr. Sachin Kumar [Profile]
Indian Institute of Technology (IIT) Roorkee](https://image.slidesharecdn.com/journalofcomputerscienceijcsisjuly2018fullvolume-180915043348/75/Journal-of-computer-science-ijcsis-july-2018-full-volume-8-2048.jpg)
![Dr Basit Shahzad [Profile]
King Saud University, Riyadh - Saudi Arabia
Dr. Mohd. Muntjir [Profile]
Taif University
Kingdom of Saudi Arabia
Dr. Sherzod Turaev [Profile]
International Islamic University Malaysia
Dr. Bohui Wang [Profile]
School of Aerospace Science and Technology,
Xidian University, P. R. China
Dr. Kelvin LO M. F. [Profile]
The Hong Kong Polytechnic University, Hong Kong
Dr. Man Fung LO [Profile]
The Hong Kong Polytechnic University
ISSN 1947 5500 Copyright © IJCSIS, USA.](https://image.slidesharecdn.com/journalofcomputerscienceijcsisjuly2018fullvolume-180915043348/75/Journal-of-computer-science-ijcsis-july-2018-full-volume-9-2048.jpg)
![TABLE OF CONTENTS
1. PaperID 30061815: A Survey of Cyber Security Countermeasures Using Hardware Performance Counters
(pp. 1-9)
James Christopher Foreman, Department of Engineering Fundamentals, University of Louisville, Louisville, KY.
USA
Full Text: PDF [Academia.edu | Scopus | Scribd | Archive | ProQuest]
2. PaperID 30061802: Factors of Cloud Computing Adoption by Small and Medium Size Enterprises (SMEs)
(pp. 10-13)
Fahd Nasser (1) & Sundresan Perumal (2),
(1) Post Graduate Centre, Limkokwing University of Creative Technology
(2) Faculty of Science and Technology, University Sains Islam Malaysia, darul Khusus, Malaysia,
Full Text: PDF [Academia.edu | Scopus | Scribd | Archive | ProQuest]
3. PaperID 30061809: Development of a Predictive Model for Audio Quality of Service in Nigeria (pp. 14-20)
Mebawondu J.O., Department of Computer Sci. FUTA, Nigeria;
Adewale O.S., Department of Computer Sci. FUTA, Nigeria;
Dahunsi F.M., Department of Electrical Electronic Engineering FUTA, Nigeria;
Alese B.K., Department of Computer Sci. FUTA;
Full Text: PDF [Academia.edu | Scopus | Scribd | Archive | ProQuest]
4. PaperID 30061810: Thinging for Software Engineers (pp. 21-29)
Sabah S. Al-Fedaghi, Computer Engineering Department, Kuwait University, Kuwait
Full Text: PDF [Academia.edu | Scopus | Scribd | Archive | ProQuest]
5. PaperID 30061817: A Service Differentiation Aware Dynamic Random Early Detection and Optimized Fuzzy
Proportional Integral Derivative for Active Queue Management Congestion Control in Mobile Wireless Sensor
Network (pp. 30-40)
Monisha V. (1) & Dr Ranganayaki T. (2)
(1) Ph.D Research Scholar, (2) Associate Professor
Department of Computer Science, Erode Arts & Science College, Erode, Tamil Nadu, India
Full Text: PDF [Academia.edu | Scopus | Scribd | Archive | ProQuest]
6. PaperID 30061821: Medical Image Segmentation Based On Generalized Gamma Distribution for Effective
Identification of Diseases in Brain (pp. 41-45)
K. Srinivas (1), P.V.G.D. Prasad Reddy (2), G.P.S. Varma (3)
(1) Research Scholar, Dept. of CS&SE, Andhra University, Visakhapatnam, A.P-India.](https://image.slidesharecdn.com/journalofcomputerscienceijcsisjuly2018fullvolume-180915043348/75/Journal-of-computer-science-ijcsis-july-2018-full-volume-10-2048.jpg)
![(2) Prof & HOD, Dept. of CS&SE, Andhra University, Visakhapatnam, A.P-India.
(3) Principal, SRKR Engineering College, Bhimavaram, A.P-India.
Full Text: PDF [Academia.edu | Scopus | Scribd | Archive | ProQuest]
7. PaperID 30061823: Using Safety Case to Automotive and IoT Systems (pp. 46-65)
Hiroyuki Utsunomiya, Nagoya University, Furo-cho Chikusa-ku, Nagoya Aichi, Japan
Nobuhide Kobayashi, DENSO CREATE INC., 3-1-1 Sakae Naka-ku, Nagoya Aichi, Japan
Shuichiro Yamamoto, Nagoya University, Furo-cho Chikusa-ku, Nagoya Aichi, Japan
Full Text: PDF [Academia.edu | Scopus | Scribd | Archive | ProQuest]
8. PaperID 30061825: Perceived Usability Using Arabic System Usability Scale (A-SUS): Student Perspective
of Smart PAAET App (pp. 66-78)
Bareeq A. AlGhannam, Computer Science and Information Systems Department, College of Business Studies, The
Public Authority for Applied Education and Training Kuwait, Kuwait.
Manal Alsuwaidi, Computer Science and Information Systems Department, College of Business Studies, The Public
Authority for Applied Education and Training Kuwait, Kuwait.
Waheeda Almayyan, Computer Science and Information Systems Department, College of Business Studies, The
Public Authority for Applied Education and Training Kuwait, Kuwait.
Full Text: PDF [Academia.edu | Scopus | Scribd | Archive | ProQuest]
9. PaperID 30061837: Evaluating the Proposed Public Budget Ontological Model (pp. 79-91)
Y. M. Helmy, Faculty of Commerce and Business Administration, Helwan University, Egypt
S. A. Ali, Faculty of Commerce and Business Administration, Helwan University, Egypt
M. M.A. Abd Ellatif, Faculty of Information Systems, Jeddah University, KSA and Helwan University, Egypt
Full Text: PDF [Academia.edu | Scopus | Scribd | Archive | ProQuest]
10. PaperID 30061840: Reliable Multicast Notification System on Mobile Location Indexing (pp. 92-96)
Thu Thu Zan, Cloud Computing Lab, University of Computer Studies, Yangon, Yangon, Myanmar
Sabai Phyu, Cloud Computing Lab, University of Computer Studies, Yangon, Yangon, Myanmar
Full Text: PDF [Academia.edu | Scopus | Scribd | Archive | ProQuest]
11. PaperID 30061843: Building an Effective Intrusion Detection System using Genetic Algorithm based
Feature Selection (pp. 97-110)
(1) Mr. Prakash N Kalavadekar, Research Scholar; (2) Dr. Shirish S. Sane
K.K. Wagh Institute of Engineering Education & Research, Nashik Savitribai Phule Pune University, India
Full Text: PDF [Academia.edu | Scopus | Scribd | Archive | ProQuest]
12. PaperID 30061844: Master-Slave Clustering Technique for High Density Traffic in Urban VANET Scenario
(pp. 111-116)](https://image.slidesharecdn.com/journalofcomputerscienceijcsisjuly2018fullvolume-180915043348/75/Journal-of-computer-science-ijcsis-july-2018-full-volume-11-2048.jpg)
![Rifat Tasnim Anannya, Md. Abdullah Al Faruk, Md. Manirul Islam
Department Of Computer Science, American International University-Bangladesh, Dhaka, Bangladesh
Full Text: PDF [Academia.edu | Scopus | Scribd | Archive | ProQuest]
13. PaperID 30061846: Prediction of Suicidal Case Poisoning by Modeling and Simulation of Time Series (pp.
117-128)
Mohammed Kaicer (a*) , Siham Mahir (b), Wafae Elelem (c), Abdelmajid Soulaymani (b), Rachida Soumlaymani
(d), Latifa Amiar (e), Rachid Hmimou (d)
(a)(b) Genetic & Biometric laboratory Tofail university, 242, Kenitra - Maroc
(c) Laboratory of study and research in applied mathematics, EMI, Med 5 university, United Nations Avenue, Agdal,
Rabat Morocco B.P: 8007.N.U
(d) PPCM, Faculty of Medicine, Med 5 University, United Nations Avenue, Agdal, Rabat Morocco B.P: 8007.N.U
(e) Faculty of Sciences and Technology, Old street of Aeroport, Km 10, Ziaten. 416. Tangier - Morocco
Full Text: PDF [Academia.edu | Scopus | Scribd | Archive | ProQuest]
14. PaperID 30061848: A New Communication Architecture Model for Smart Grid (pp. 129-143)
Zahid Soufiane, Institut National des Postes et Télécommunications, Morocco
En-Nouaary Abdeslam, Institut National des Postes et Télécommunications, Morocco
BAH Slimane, Ecole Mohammadia d'Ingénieurs, Morocco
Full Text: PDF [Academia.edu | Scopus | Scribd | Archive | ProQuest]
15. PaperID 30061849: An Improved Logic Design Simulator (pp. 144-150)
Adewale, F.O; Adegbile, A.A; Olanrewaju, O.T.; Togun, A.O; Dada, T.O
Department of Computer Science, FCAH&PT, Apata, Ibadan, Nigeria
Osunade O., Department of Computer Science, University of Ibadan, Nigeria
Full Text: PDF [Academia.edu | Scopus | Scribd | Archive | ProQuest]
16. PaperID 30061850: Education Game for Teaching Stack and Link- List as an Aspect of Data Structure and
Algorithm (pp. 151-157)
Olanrewaju, O.T; Adegbile, A.A; Ogunbade, A.O; Dada, T.O; Adewale, F.O; Aguda O.O.;
Department of Computer Science, FCAH&PT, Apata, Ibadan, Nigeria
Osunade O., Department of Computer Science, University of Ibadan, Nigeria
Full Text: PDF [Academia.edu | Scopus | Scribd | Archive | ProQuest]
17. PaperID 30061851: Design and Implementation of a Virtual Project Repository System (A Case Study of
Federal College of Animal Health and Production Technology) (pp. 158-161)
Adegbile, A.A.; Ayobiolaja, S.P.; Olanrewaju, O.T.; Togun, O.A.; Nwufoh, C.V.
Department of Computer Science, FCAH&PT, Moor Plantation Apata, Ibadan, Nigeria
Osunade, O.; Department of Computer Science, University of Ibadan, Nigeria](https://image.slidesharecdn.com/journalofcomputerscienceijcsisjuly2018fullvolume-180915043348/75/Journal-of-computer-science-ijcsis-july-2018-full-volume-12-2048.jpg)
![Full Text: PDF [Academia.edu | Scopus | Scribd | Archive | ProQuest]
18. PaperID 30061855: Anonymous Safe Routing Scheme for Compromised Network Environment (pp. 162-
168)
William Asiedu, Department of information Technology Education, University of Education, Winneba, Kumasi
Campus, Ghana
Dr. Rajan John, College of Computer Science, Jazan University, Jazan, Kingdom of Saudi Arabia
Full Text: PDF [Academia.edu | Scopus | Scribd | Archive | ProQuest]
19. PaperID 30061789: A Multi-metric and Multi-deme Multiagent System Applied on Some Multiobjective
Optimization Problems (pp. 169-178)
Jamshid Tamouk & Adnan Acan,
Eastern Mediterranean University, Computer Engineering Department, Gazimagusa, TRNC, 99628, Turkey
Full Text: PDF [Academia.edu | Scopus | Scribd | Archive | ProQuest]
20. PaperID 31051826: Spasmodic Watermarking Of Comparative Images Using Discrete Wavelet Transform
(DWT) and Histogram Changing (pp. 179-188)
S. Venkatesh, Research Scholar, Faculty of Computer Science and Engineering, Sathyabama University, Chennai,
Tamilnadu.
Dr. M. A. Dorairangaswamy, Professor and Registrar, St Peter’s University, Avadi Chennai, Tamilnadu.
Full Text: PDF [Academia.edu | Scopus | Scribd | Archive | ProQuest]
21. PaperID 31051838: The Role of ICT on E-Governance Framework in Nigerian Aviation Industry (pp. 189-
197)
Eleberi Ebele Leticia, Department of Computer Science, Imo State University, PMB 2000, Owerri Nigeria
Full Text: PDF [Academia.edu | Scopus | Scribd | Archive | ProQuest]
22. PaperID 30061803: Integration and Combination of Cryptographic Algorithm for Data Security in Cloud
(pp. 198-203)
Kiran Huma, Muhammad Sheraz Arshad Malik, Sadaf Safdar, Bakhtawar Jabeen, Department of Information
technology, Government College University, Faisalabad, Pakistan
Rizwan Arshad, School of Mechanical and Manufacturing Engineering, National University of Sciences and
Technology, Islamabad, Pakistan
Full Text: PDF [Academia.edu | Scopus | Scribd | Archive | ProQuest]
23. PaperID 31071818: RFID Reader Collision Avoidance Using CSMA/CA With Fibonacci Backoff Algorithm
(pp. 204-210)
(1) Olanrewaju, B. S.; (2) Thanni, A. M.; (3) Deji-Akinpelu, O.O.; (4) Olanrewaju, O. T., (5) Osunade, O.
(1) Dept of Computer Science, Wellspring University, Benin City, Nigeria](https://image.slidesharecdn.com/journalofcomputerscienceijcsisjuly2018fullvolume-180915043348/75/Journal-of-computer-science-ijcsis-july-2018-full-volume-13-2048.jpg)
![(2, 3, 5) Dept of Computer Science, University of Ibadan, Nigeria
(4) Dept of Computer Science, Federal College of Animal Health and Production Technology, Moor Plantation,
Ibadan, Nigeria
Full Text: PDF [Academia.edu | Scopus | Scribd | Archive | ProQuest]](https://image.slidesharecdn.com/journalofcomputerscienceijcsisjuly2018fullvolume-180915043348/75/Journal-of-computer-science-ijcsis-july-2018-full-volume-14-2048.jpg)
![A Survey of Cyber Security Countermeasures Using
Hardware Performance Counters
James Christopher Foreman #1
#
Department of Engineering Fundamentals, University of Louisville
Louisville, KY. USA 1
jcfore01@louisville.edu
Abstract—Cyber attacks and malware are now more prevalent
than ever and the trend is ever upward. There have been
several approaches to attack detection including resident software
applications at the root or user level, e.g., virus detection, and
modifications to the OS, e.g., encryption, application signing, etc.
Some approaches have moved to lower level detection and preven-
tion, e.g., Data Execution Prevention. An emerging approach in
countermeasure development is the use of hardware performance
counters existing in the micro-architecture of modern processors.
These are at the lowest level, implemented in processor hardware,
and the wealth of data collected by these counters affords some
very promising countermeasures with minimal overhead as well
as protection from being sabotaged themselves by attackers. Here,
we conduct a survey of recent techniques in realizing effective
countermeasures for cyber attack detection from these hardware
performance counters.
I. INTRODUCTION
Cyber security has been at the forefront of mainstream media
for several years now as a critical problem for our society to
overcome. Attackers are increasingly motivated and enabled
to compromise software and computing infrastructure. Cyber
security countermeasures are of prime interest in mitigating
such attacks and associated malware.
There are many types of countermeasures that are built as
software applications, e.g., virus checkers, based on control-
ling physical access, e.g., biometrics, or enforced as policies,
etc. Our investigation is to survey the state of the art in the
utilization of Hardware Performance Counters (HPC) to build
cyber security countermeasures. HPCs are a promising new
resource to address the limitations of typical software, and
other countermeasures.
Hardware performance counters are special purpose registers
and logic incorporated in the micro-architecture of modern
processors and CPUs. They are typically used as debugging
tools that run at the lowest level, i.e., on chip, for performance
tuning and analysis by collecting information on processor
events and the running processes. As the name implies, HPCs
are used to count events, such as cache misses, and aid in
timing events, such as counting CPU cycles per unit time.
This information that is typically used to debug software can
now also be used to detect cyber attacks. Their residence in
micro-architecture, i.e., in silicon, is a safeguard against their
tampering.
A. Recent Related Surveys
Several related surveys have been performed, e.g., [1] exam-
ines the feasibility of using HPCs to detect malware with
several specific examples of HPC data triggers and detection
techniques, and others that focus on Control Flow Integrity[2]
(CFI), hardware trojans[3], and side-channel timing attacks[4].
Our survey updates the current state of knowledge and focuses
on HPCs in particular, examining several examples and cate-
gorizing them by method and attack vector.
B. Using Hardware Performance Counters as Countermea-
sures
Hardware performance counters afford a highly granular and
low footprint method of detecting anomalous behavior. HPCs
reside on the processor chip, implemented in dedicated hard-
ware, so they typically consume minimal resources from
the processor. Their inclusion by major processor vendors
alleviates the need to develop custom IP cores for cyber attack
detection. HPCs collect a wealth of information such as cache
misses, event timing, branch mis/predictions, etc. about the
running processes. They also execute at the kernel/hardware
privilege level, and are difficult to spoof or sabotage by attack-
ers due to their physical persistence in the micro-architecture.
Table #1 lists some of the commonly used HPCs. Many
additional HPCs are available depending on the processor
manufacturer, e.g., Intel[5]. This table is more thoroughly
discussed with supporting data collected from anomaly testing
in [6].
The perf utility in Linux is an example method of access.
Direct access through machine coding, e.g., inline in C, and
custom monitoring software are possible as well. Software
development tools should allow HPCs to be activated without
source code modification or in some cases rebuilding. In this
case, HPCs are in contrast to code instrumentation as they exist
to passively and externally monitor the processor behavior.
The wealth of data from HPCs lends itself to the discovery of
anomalous behavior that is an indicator of a potential attack.
International Journal of Computer Science and Information Security (IJCSIS),
Vol. 16, No. 7, July 2018
1 https://sites.google.com/site/ijcsis/
ISSN 1947-5500](https://image.slidesharecdn.com/journalofcomputerscienceijcsisjuly2018fullvolume-180915043348/75/Journal-of-computer-science-ijcsis-july-2018-full-volume-15-2048.jpg)
![TABLE I
TYPICAL HARDWARE PERFORMANCE COUNTERS, adapted from [6].
cpu-cycles L1-dcache-loads dTLB-loads
branches L1-dcache-stores iTLB-loads
instructions L1-icache-loads dTLB-load-misses
branch-misses L1-icache-load-misses iTLB-load-misses
branch-loads LLC-loads dTLB-stores
branch-load-misses LLC-load-misses dTLB-store-misses
cache-references LLC-stores
cache-misses LLC-store-misses
ref-cycles
bus-cycles
HPCs employ one or more of the approaches in detecting
attacks.
1) Signature based: HPCs collect information about the
suspect process and determine if this information cor-
responds to either known attacks, e.g., blacklist, or
known safe applications, e.g., whitelist. This is similar
to approaches used by many virus scanning applications.
The whitelist, if practical, has the added benefit of
denying any activity that has not been validated, thus
mitigating unknown and zero day attacks.
2) Heuristic based: HPCs monitor the suspect process to
determine if behavior is anomalous, such as if there are
a high number of cache misses or a high number of
branch mis-predictions (above a heuristic threshold) to
indicate a potential attack.
3) Advanced approaches: HPC data are analyzed and used
in more advanced statistical analysis, machine learning,
or other artificial intelligence approaches with super-
vised or unsupervised learning.
4) Hybrid approaches: A combination of one or more of
these, possibly also in cooperation with other security
countermeasures.
5) Context sensitivity: In addition to monitoring blacklist,
whitelist, and heuristic behavior, the context in which the
application is running can be part of the classification.
This can be realized when the countermeasure creates a
Control Flow Graph (CFG) during initial configuration
and then monitors when syntactically-correct, though
functionally invalid, paths are attempted, such as during
code reuse attacks.
The selection of an approach depends on the application and
environment. Forming signatures requires specific knowledge
of the attack to form a blacklist, or knowledge of all valid (ac-
ceptable) applications to form a whitelist. Heuristics are used
when this knowledge is less specific, and general knowledge
of trends are available through monitoring of the system to
set guidelines, e.g., thresholds. Machine learning becomes a
better alternative when the system needs to adapt to unknown
threats or the execution environment is too dynamic to predict
anomalous behavior.
C. Notes for IoT and Embedded Systems
Embedded systems and systems that comprise the Internet
of Things (IoT) usually have the characteristics of limited
resources, such as memory, processing power, and network
bandwidth. IoT specifically may also include high deploy-
ment where many devices are managed. The use of HPCs
for countermeasures are still a viable alternative for these,
perhaps more so due to the low overhead of HPCs, though
the following points should be considered.
1) Some embedded systems may have limited HPCs avail-
able, especially in custom or application specific imple-
mentations.
2) The use of black/white lists may require too much
storage and the use of machine learning algorithms
may require too much processing power. Heuristic ap-
proaches tend to work best, though when used alone
they may not provide adequate protection.
3) In deployments with many devices, a centralized
database or machine learning engine may be able to
offset some of the local limitations to provide good pro-
tection, providing that network bandwidth is available.
Distributed approaches may alleviate limitations when a
centralized authority is not practical.
4) Many embedded systems only run a limited selection
of applications and/or have static configurations. A
whitelist may be more practical and effective in these
cases.
D. Notes for Cloud Usage
Cloud usage and usage in Virtual Machines (VM) should be
possible as most VM hypervisors have the option of enabling
virtual HPCs. Cloud providers would need to enable this func-
tionality as it is usually not enabled by default. Otherwise, the
use of HPCs for countermeasures should be largely transparent
to the cloud provider and users. When HPCs are enabled in
VMs, it should be ensured that the HPC values presented to the
VM OS are only for that VM’s activities, which is usually the
case and again, managed by the hypervisor. Cloud providers
may choose to enable these methods rather than rely on users’
requests.
E. Structure of this Paper
Section I introduces the topic of cyber attack detection via
HPCs, discusses similar surveys, and includes notes on specific
application areas. Section II discusses the types of attacks, i.e.
attack categories, including their capabilities and how they
are carried out. Section III analyzes several example cyber
attack countermeasures using HPCs, categorizing these by
countermeasure approach. Section IV provides a summary of
this analysis with insights into countermeasure characteris-
tics, implementation, and hybridization of multiple counter-
measures that may be utilized for more complete detection
coverage while mitigating false positives and false negatives.
International Journal of Computer Science and Information Security (IJCSIS),
Vol. 16, No. 7, July 2018
2 https://sites.google.com/site/ijcsis/
ISSN 1947-5500](https://image.slidesharecdn.com/journalofcomputerscienceijcsisjuly2018fullvolume-180915043348/75/Journal-of-computer-science-ijcsis-july-2018-full-volume-16-2048.jpg)
![Finally, Section V discusses future directions for HPC-based
countermeasures.
II. TYPES OF CYBER ATTACKS AND ATTACK VECTORS
The types of cyber attacks possible have been well covered in
the literature. A brief summary of cyber attack categories is
provided in Fig. #1.
Code Reuse Attacks (CRA) that compromise control flow
integrity seek to alter the normal control flow of a software
application to perform malicious activities. Examples include
Return Oriented Programming (ROP), in which the attacker
gains control of the call stack to rewrite the return address
from a function call, and Jump Oriented Programming (JOP),
in which the attacker maliciously uses the jump instruction
to piece together malicious code fragments. The attack uses
existing instructions in executable code or resident libraries
that are chained together to form gadgets. These gadgets are
similar to functions, i.e., sets of instructions, that are used to
perform the malicious activity of the attacker. In most cases,
the attacker needs to know the executable code and libraries
from which to select gadgets. For commodity operating sys-
tems and applications, these are known to the attacker. Address
space layout randomization, e.g., code randomization, is an
effort to make this more difficult. Also, side channel leaks
may allow an attacker to uncover enough information from
which to build useful gadgets anyway. Such CRA mitigation
has been a primary focus of HPC-based countermeasures as
the HPC information collected, such as cache misses, branch
mis-predictions, etc., are good heuristic indicators of CRA
where control flow becomes detectably anomalous.
False Code Injection (FCI) and modification attacks seek
to inject a malicious software payload or overwrite existing
application code with such a payload to perform malicious
activities. Many of these are done via buffer overflows, and
may be performed by other various means. In some cases,
false data may be injected to alter program behavior, such as
false sensor readings in process control systems. The goals
of such attacks may be to seize control, sabotage, or to
damage the system being attacked so as to interfere with
the performance of its mission. HPC countermeasures for
these generally look for anomalous behavior, i.e., contrary to
the valid functioning of the application software. Depending
on the code overwritten, the counts for various errors may
dramatically increase in a short time, e.g., buffer overflow
events.
Information leakage attacks seek to steal information from the
target system. Usually, these are passwords or other secrets,
and may be executable code fragments in preparation for a
code reuse attack. Side channel leakage is the most common
vector using cache operation attacks such as flush+reload[7],
evict+time, prime+probe, and evict+reload. HPCs can detect
these from excessive cache misses. HPCs may also monitor
event counts for correlation with secret keys when attackers
seek to employ HPCs in side channel attacks. Due to the high
level of detail HPCs can provide, some attackers may exploit
HPCs, for example, to leak the secret key when encryption
operations are performed. Martin et al. [8] have proposed
disabling or adding noise to HPCs to reduce their accuracy
and subsequent efficacy in an effort to prevent attackers from
leveraging these.
In other scenarios, more specific hardware events such as
memory corruption by rowhammer, which repeatedly accesses
(hammers) RAM in a very atypical manner to induce errors in
adjacent memory cells, may occur and be detected by HPCs
acting as hardware monitors based on RAM access. Some
Denial of Service (DoS) attacks may also be detected by
HPCs noting that most event counts for normal operation often
differ greatly from operation during a DoS, which is typically
characterized by extremely high activity.
III. APPROACHES TO ATTACK DETECTION
From the list of approaches for attack detection in the previous
section, several specific examples are examined to establish the
current state of the art in HPC cyber security countermeasures.
A. Signature Based Examples
Three signature based examples, SIGDROP[9], ConFirm[10],
[11], and another by Chiappetta et al.[12] are examined in their
use of HPCs to detect cyber attacks. SIGDROP focuses on
detecting Return Oriented Programming (ROP) attacks using
two characteristics of such attacks. The first is a high level of
mis-prediction by the Return Address Stack (RAS) due to the
attackers mis-direction in returns. The second characteristic
is that of calls to functions that are very short in instruction
length, i.e., gadgets, that are artificially crafted from existing
code to perform attack functions. Many such gadgets must
be chained together to perform useful work for the attack,
thus long chains of very short functions are another signature.
Recent studies show that most ROP gadgets have fewer than
6 instructions [13], [14], [15] and may require chaining of
dozens to hundreds of gadgets to perform an attack function.
SIGDROP configures hardware performance counters to count
if the number of consecutive return address predictor misses is
above a threshold, TM , and compares this to the total number
of return instructions, NR. If these are nearly equal, then the
return address predictor is missing almost all the time, which
is one of the characteristics of a ROP attack. A HPC is also
configured to count total instructions executed, NI, to check
the average number of instructions per missed return address
prediction. Noting that the typical number of instructions per
gadget or per return is TI ≤ 6 for ROP attacks, the second
signature is found by NI ≤ (TI × TM ), which is true when
the total number of instructions is less than or equal to the
typical ROP gadget length times the number of return address
predictor misses. Thus, SIGDROP is an example of a blacklist
signature approach. The blacklist behavior is determined by
comparison against known attacks.
International Journal of Computer Science and Information Security (IJCSIS),
Vol. 16, No. 7, July 2018
3 https://sites.google.com/site/ijcsis/
ISSN 1947-5500](https://image.slidesharecdn.com/journalofcomputerscienceijcsisjuly2018fullvolume-180915043348/75/Journal-of-computer-science-ijcsis-july-2018-full-volume-17-2048.jpg)
![Fig. 1. Types of cyber attack.
ConFirm[10], [11] uses hardware performance counters to
detect malicious software either injected into firmware or by
performing CRAs using firmware code. ConFirm is a whitelist
signature approach since firmware is known in advance and
rarely changes. ConFirm performs HPC checks at various
points in the firmware code execution process to determine
if configured HPCs are at typical values. Since the same code
always executes under normal circumstances, these should be
very consistent. An attack would introduce new operations and
thus change the HPCs. The whitelist behavior is determined
by profiling the valid code (firmware) prior to deployment
(offline) to collect good HPC values and determine optimal
checkpoints.
Chiappetta et al.[12] proposed using HPCs to detect side
channel attacks, specifically on cache memory to compromise
encryption through information leakage, such as flush+reload.
The countermeasure employs a utility, quickhpc, that allows
the HPC to be queried much faster, at microsecond resolution.
Under normal circumstances, the encryption process would
be expected to benefit from the cache for a significant por-
tion of the process time. However, when under attack the
encryption process never benefits from the cache, because
the flush+reload side channel attack is constantly flushing the
cache and timing the reload to determine program flow of the
encryption process. These cache misses are collected by the
HPC which can signal anomalous operation. If using simple
threshold heuristics, there could be many false positives, so
Chiappetta employs simple machine learning to determine a
signature for the encryption process. This is another example
of a whitelist approach that uses unsupervised training.
B. Heuristic Based Examples
Heuristic based examples, such as ANVIL[16],
CacheShield[17], by Lui et al.[18], by Torres et al.[19],
and Eunomia[20], provide direct detection of attacks when
certain events count past preset thresholds, either individually
or in some combination. These tend to perform better when the
effects of attacks are more generally known, e.g., when jump
oriented attacks result in high branch mis-predictions. These
may result in a higher number of false positives depending on
the process being executed, especially when there is a wide
range of potentially valid processes. However, they are simple
to implement and can act as a pre-filter for more advanced
and resource consuming detection approaches. ANVIL
is a Linux-based kernel module to mitigate rowhammer
attacks, specifically new forms of rowhammer that seek
to evade simple rowhammer countermeasures that DRAM
manufacturers are now employing, such as on-DRAM caches.
ANVIL works by monitoring the locality of DRAM row
accesses out of the LLC misses (LONGEST LAT CACHE.MISS).
Once a preset threshold of LLC misses is exceeded, a second
stage of detection samples virtual addresses for a time
duration using Load Latency (MEM TRANS RETIRED.LOAD
LATENCY) and Precise Store (MEM TRANS RETIRED.PRECISE
STORE) events to determine locality. Once an attack is
detected, the rows adjacent to the rows being attacked are
refreshed through a read operation. This is only performed
as needed so that false positives have very little effect on
the system. Thresholds can be determined by observation of
bit flips, and may also be empirically set based on DRAM
specifications.
International Journal of Computer Science and Information Security (IJCSIS),
Vol. 16, No. 7, July 2018
4 https://sites.google.com/site/ijcsis/
ISSN 1947-5500](https://image.slidesharecdn.com/journalofcomputerscienceijcsisjuly2018fullvolume-180915043348/75/Journal-of-computer-science-ijcsis-july-2018-full-volume-18-2048.jpg)
![CacheShield[17] is designed to be a user-level tool, with
low performance impact for legacy systems, that specifically
targets cache attacks. Cache misses, a common symptom of
cache attacks, are counted using various cache miss HPCs.
CacheShield is configured by monitoring known valid and
malicious applications to determine cache miss thresholds for
detection, and selects the specific HPCs that are most affected
for the application. The example given in the paper was for
OpenSSL and the L3 cache. A cache attack is detected when
an abrupt change in the statistical distribution of cache misses
occurs.
Lui et al.[18] developed a countermeasure to stack buffer
overflow attacks used to compromise control flow integrity. A
two-level approach is used with the first level being a heuristic
pre-filter to facilitate low overhead on embedded systems.
Stack buffer overflow attacks redirect control flow through
dynamically overwriting the return address of a procedure,
which results in instruction cache misses and mis-prediction of
return addresses. Anomalous behavior is detected when these
occur above an established threshold.
Torres et al.[19] investigated if data-only exploits could be
detected at runtime with HPCs. Examples of data oriented at-
tacks are SQL injections or any other mis-information whereby
malformed data sent to a host causes the host to disclose secret
information. The Heartbleed attack, studied specifically in this
work, uses an overestimate of the size of keep-alive packets
that keep secure channels open, causing the host to respond
with extra data, which contain sensitive information.
Eunomia[20] is another example of earlier work that is similar
to these where deviations in PMU-event counts signal mali-
cious activity versus valid processes. This paper includes a
good quantitive discussion of HPC deviation values in general
under attack scenarios for reference.
C. Examples of Machine Learning and Context Sensitivity
Machine learning includes most approaches in the area of
artificial intelligence. Learning may be supervised, such as
training HPC data against known valid and known malicious
applications. This learning is usually offline, i.e., the classi-
fication engine for detecting malicious behavior is developed
before runtime or deployment. Learning may also be unsu-
pervised, such as online during runtime based on accumulated
information, e.g., information from HPCs. Security policy may
still be specified for unsupervised learning and the classi-
fication engine will learn violations to this policy. Context
sensitivity implies knowledge of the operating environment
or application. This knowledge may include information from
the source or binary code such as the proper execution paths,
e.g., control flow graph verification, or mathematical rules,
such as those extracted from the code or based in physics
for physical processes, to validate proper operation of the
compiled application. Instrumentation of the binary may be
performed to provide checkpoints within the application to
facilitate these checks. Knowledge of the user environment
may be used to detect deviation from expected user behaviors,
or even the behaviors of the machine hardware.
The goal of machine learning is to provide a more advanced
detection scheme that eliminates the false positives from
simple signatures and heuristics as well as eliminating the false
negatives when sophisticated attacks are launched that use
valid code fragments and other seemingly valid approaches.
Machine learning is typically of much higher processing over-
heads and is often deployed as a second layer to a signature
or heuristic first layer, which acts as a pre-filter to minimize
the performance impact.
Torres et al.[19] performed a survey of approaches that were
essentially intelligent outlier rejection. The desired approach
characteristic was unsupervised learning by using collected
HPC data only, i.e., a data-driven approach. Cache misses
and branch mis-predictions were common variables studied.
During runtime, HPC data was collected for specific intervals
(1ms, 10ms, 100ms) with the assumption that valid activity
was more common (normal) and that invalid activity (attacks)
would be statistical outliers to the HPC data. The counter-
measure behaved similarly to heuristic analysis without the
necessity of pre-determining heuristic thresholds. The machine
learning portion would build a model in memory of the valid
state space as the statistical norm.
HPCMalHunter[21] dynamically monitors HPC data to clas-
sify malicious behavior. This approach uses supervised learn-
ing and offline pre-training to build a database for classi-
fication. The HPC data assembled into vectors (monitored)
in the example were: Branch instructions retired (BIR), load
instructions retired (LIR), store instructions retired (SIR), and
mis-predicted branch instructions (MBI). The database is a
matrix and HPC event data is formatted as a vector input for
classification, similar to an artificial neural network except by
a Support Vector Machine[22] (SVM) in this case. As HPC
data are typically very sparse, the SVM matrix is optimized by
Single Value Decomposition (SVD) to reduce its dimension-
ality and reduce storage and processing overheads resulting in
the final classification engine. This particular countermeasure
examined HPC data in blocks of 100,000 machine instructions,
and the span of examining multiple HPC data (BIR, LIR, SIR,
MBI) facilitated a very low false positive rate.
Nomani et al.[23] developed an Artificial Neural Network
(ANN) classifier to determine the phase of a running applica-
tion as a countermeasure against side channel attacks. Here,
side channel attacks refer to attacks that attempt to capture
secret information or perform malicious activities on shared
resources. Phase refers to the types of resources and functional
units that are utilized at that time, such as a memory phase
during high memory accesses, a floating point phase during
floating point operations, an integer phase, etc. When multiple
applications, or an application and a malicious program, share
resources, the potential for an attack is much higher[24], and
thus monitoring should be more vigilant. The ANN provides a
International Journal of Computer Science and Information Security (IJCSIS),
Vol. 16, No. 7, July 2018
5 https://sites.google.com/site/ijcsis/
ISSN 1947-5500](https://image.slidesharecdn.com/journalofcomputerscienceijcsisjuly2018fullvolume-180915043348/75/Journal-of-computer-science-ijcsis-july-2018-full-volume-19-2048.jpg)
![black-box approach to determining the phase in which running
applications reside or are in transition and purposely influences
the OS scheduler to avoid scheduling other applications on the
same processor using the same functional resources. Contrary
to increasing overhead, the countermeasure on average reduced
resource load by as much as 25% in some cases as a side
benefit. Once trained via supervised learning, the ANN was
able to perform classification well under the average time
between context switches allowing the scheduler sufficient
time to recalculate thread scheduling in most cases.
Alam et al.[25] developed a countermeasure that employed two
novel methods. The first was consideration that lots of HPC
data were known or could be generated for valid applications,
while HPC data for attacks were rare or would be unknown
due to zero-day attacks. Therefore, a single-class SVM was
developed to only classify valid behavior. The failure to
classify valid behavior determined potential invalid (malicious)
behavior. The behavior was further analyzed to select the
most likely HPC variables for attack classification based on
how the anomalous behavior deviated from valid behavior.
The second novel method used in the countermeasure was
Dynamic Time Warping[26] (DTW). HPC data represent time
series of various event counts, such as cache misses. A side
channel attack may seek to exploit HPCs by superimposing the
secret key or other sensitive information on these time series
through seemingly benign operations to exfiltrate the sensitive
information. Therefore, these time series (HPC events) are
monitored and correlated with sensitive information to see if
there is a match. The DTW algorithm allows detection even
when the time series is compressed, stretched, or scaled with
respect to the sensitive information pattern.
BehavioR based Adaptive Intrusion detection in Networks[27]
(BRAIN) is a countermeasure for distributed Denial of Ser-
vice (DoS) attacks in networks. Most network-based DoS
countermeasures use heuristics on network traffic by exam-
ining packets for attack signatures or specific attack behavior.
BRAIN enhances this by adding HPC data in the analysis of
DoS attacks under the assumption that processors also behave
differently during such attacks. BRAIN is trained during idle
and normal operation as well as during known DoS attacks,
i.e., supervised and online. Network heuristics from traditional
approaches are combined with BRAIN’s HPC-based informa-
tion via unsupervised K-means clustering that is then used to
form a SVM for final classification. Claimed results are zero
false positives with 99.8% true positive detection, conditional
on the span of the DoS attack scenarios used in training.
FlowGuard[28] is a countermeasure approach worth men-
tioning here although it does not use HPCs. It does, how-
ever, utilize Intel Processor Trace[29], a debugging tool also
implemented in micro-architecture. FlowGuard uses machine
learning of control flow paths to form a valid Control Flow
Graph (CFG). It then compresses the CFG information in the
same format as that supplied by Intel Processor Trace to allow
rapid, direct comparison of runtime control flow with these
learned valid paths. Paths are ranked with the most common
paths ranked highest. During runtime, deviation from valid
paths will indicate an anomaly and potential attack that can
then be examined with additional analysis, such as a hybrid
approach with HPCs.
IV. COMPARISON OF COUNTERMEASURE APPROACHES
In this section, a comparison of countermeasures approaches
as exemplified in Section III is given. Table II tabulates
the examples given in Section III with respect to name and
citation, HPCs utilized, the general category also from Section
III, and the types of attacks for which that example is good
for detecting. Table III provides a comparison of the general
categories with respect to characteristics of countermeasures
within that category and application notes that fit that cate-
gory. Figure 2 illustrates the process flow of countermeasure
categories and how multiple approaches may be used in hybrid
configurations.
The following terms are used in Table II. Branch instructions
retired (BIR), load instructions retired (LIR), store instructions
retired (SIR), and mis-predicted branch instructions (MBI),
Processor Management Unit events (PMU), Code Reuse At-
tacks (CRA), Machine Learning (ML), self-directed Outlier
Rejection (OR), Support Vector Machine (SVM), Single value
Decomposition (SVD), Artificial Neural Network (ANN), Dy-
namic Time Warping (DTW), Control Flow Graph (CFG),
and Return Oriented Programming (ROP). General attack
effectiveness, usually in machine learning, implies the coun-
termeasure is used to detect general attack behavior versus a
specific class. Chooses by learning implies the countermeasure
selects HPCs that are best suited, i.e. most affected, by the
attack class to be detected.
†Torres et al. incorporates both heuristic and machine learning
aspects to its approach.
In Fig. 2, attacks of all types, as denoted in Fig. 1, enter
the target system. Signature countermeasures, Section III-A
scan attack activity in various HPCs for specific patterns.
The assumption is that known attacks impact various counters
in a predictable and repeatable manner. Another approach
may be the use of heuristics, Section III-B. Heuristics look
for anomalous activity in HPCs as the exceeding a preset
threshold. These are usually quick and simple in implemen-
tation. Machine learning approaches, Section III-C, may be
utilized through any number of more advanced approaches.
Any one of these may be used as a first layer of detection
of cyber attack. Hybrid approaches will use one or more
of these as a pre-filter in combination with one or more of
these at a second layer of detection in an effort to mitigate
false positives/negatives, incorporate intelligent approaches,
and minimize resource requirements by reserving complex
countermeasure activities only after passing through simpler
pre-filtering. A typical hybrid approach would be using a
heuristic as a pre-filter at the first layer and (&) using machine
learning for further analysis at the second layer.
International Journal of Computer Science and Information Security (IJCSIS),
Vol. 16, No. 7, July 2018
6 https://sites.google.com/site/ijcsis/
ISSN 1947-5500](https://image.slidesharecdn.com/journalofcomputerscienceijcsisjuly2018fullvolume-180915043348/75/Journal-of-computer-science-ijcsis-july-2018-full-volume-20-2048.jpg)
![TABLE II
EXAMPLES OF HPC COUNTERMEASURES.
Name Category HPCs used Attacks targeted
SIGDROP [9] signature return address predictor misses, total
number of return instructions
ROP and other CRAs
ConFirm [10],
[11]
signature various HPCs, code instrumentation
via checkpoints
malicious software injected into
firmware or CRAs using firmware
Chiappetta et al.
[12]
signature cache misses and high speed HPC
query
side channel attacks, cache memory,
information leakage, e.g., flush+reload
ANVIL [16] heuristic LLC misses, Load Latency, Precise
Store
rowhammer
CacheShield [17] heuristic various cache misses cache attacks on legacy systems
Lui et al. [18] heuristic instruction cache misses and
mis-prediction
stack buffer overflow attacks
Torres et al. [19] † heuristic Cache misses and branch
mis-predictions
general, anything outside the norm,
Heartbleed
Eunomia [20] heuristic PMU events general
Torres et al. [19] † ML, OR Cache misses and branch
mis-predictions
general, anything outside the norm,
Heartbleed
HPCMal-
Hunter[21]
ML, SVM, SVD BIR, LIR, SIR, MBI general
Nomani et al. [23] ML, ANN HPCs by resource (memory, floating
point, integer, etc.)
general
Alam et al. [25] ML, SVM, DTW chooses HPCs from learning general
BRAIN [27] ML, k-means,
SVM
chooses HPCs from learning distributed denial of service
FlowGuard [28] ML, CFG Intel Processor Trace ROP and others that alter process flow
TABLE III
COMPARISON OF HPC COUNTERMEASURE CATEGORIES.
Category Characteristics/requirements Application (Use cases)
Signature memory intensive, not adaptive, training of signatures,
simple
specific/known attacks and apps, black-
list/whitelist
Heuristic minimal footprint, generally quickest, tuning of thresh-
olds, false posi/negatives may be higher
when general behaviors are known, attack
exceeds some threshold
Machine learn-
ing
generally largest footprint, potentially best with minimal
false posi/negatives, context sensitivity
dynamic/unknown attack and app behaviors,
deep attacks, zero day attacks
Hybrid large footprint offset by filtering (multi-layer), minimal
impact with minimal false posi/negatives
when the combined features of two or more
countermeasure layers is beneficial
V. FUTURE DIRECTIONS
From this survey, hardware performance counters have already
been used in a variety of cyber attack countermeasure ap-
proaches. In most cases, they are an existing resource and
implemented in on-chip in separate hardware, thus minimizing
their impact both on application performance and in applica-
tion development.
The motivations for including HPCs in micro-architecture
have been towards improved debugging and application sta-
bility. If additional micro-architectural features are incorpo-
rated that have cyber security as a primary mission, more
approaches may be possible in the near future. Additional
micro-architectural approaches already available include ex-
ecution and information flow monitoring, e.g., Intel Processor
Trace[29], built in self tests, subroutines from Joint Test Action
Group (JTAG) interfaces, and others. Also of note are the in-
creasing reliance on cloud systems and computing as a service.
In the same method of using micro-architectural approaches,
hypervisor based approaches should also be examined. Re-
search should continue in such approaches as an additional
front in the prevention of cyber attacks, especially noting the
International Journal of Computer Science and Information Security (IJCSIS),
Vol. 16, No. 7, July 2018
7 https://sites.google.com/site/ijcsis/
ISSN 1947-5500](https://image.slidesharecdn.com/journalofcomputerscienceijcsisjuly2018fullvolume-180915043348/75/Journal-of-computer-science-ijcsis-july-2018-full-volume-21-2048.jpg)
![Fig. 2. Summary of HPC countermeasures.
ever increasing footprint of software based approaches. As the
number and complexity of attacks increases, these applications
utilize more resources and become more difficult to develop
and manage.
While cyber attacks are increasing in number and sophisti-
cation, the vast majority of these are still not able to per-
form much malicious activity without leaving basic hardware
signatures, such as missed branch predictions, cache misses,
hammering of rows, etc. HPC based countermeasures need to
move out of research and into to the mainstream of attack
detection software as quickly as possible. In cases where a
hardware/software system configuration is completely known,
HPCs could theoretically detect most any direct attack. In
many cases, side channels can be detected as well, e.g.,
Dynamic Time Warping.
A. Special Note Meltdown and Spectre
Currently, the cyber attacks of Meltdown and Spectre [30]
have emerged at the micro-architectural level. In Meltdown, an
attack attempts an unauthorized read of privileged memory, to
which it is not allowed access. Though the processor will even-
tually deny access to this memory, it will still fetch and in most
cases perform some processing, i.e., speculative processing,
with this memory. The attacker then attempts to intercept this
information or the result prior to failing the privilege check, or
in some cases as a residual after the privilege check. HPCs that
count privilege check violations, if developed, might indicate
this attack. Spectre is a more generalized class of vulnera-
bilities similar to Meltdown, focusing on branch prediction.
In speculative execution schemes, both branch options may
be followed until the correct branch is finally determined.
The processor would then discard the mis-predicted branch,
though side effects of this would remain and encourage a
side channel attack. These types of branch mis-predictions are
common whether the attack is present or not, i.e., the attack
does not cause these mis-predictions. Some mitigations involve
preventing out of order execution for vulnerable processes, but
this carries significant performance impacts. Perhaps future
work in HPCs as cyber attack countermeasures could employ
multiple event counts to selectively classify Meltdown and
Spectre attacks since HPCs work at the micro-architectural
level with these attacks.
REFERENCES
[1] J. Demme, M. Maycock, J. Schmitz, A. Tang, A. Waksman, S. Sethu-
madhavan, and S. Stolfo, “On the feasibility of online malware detection
with performance counters,” in ACM SIGARCH Computer Architecture
News, vol. 41, no. 3. ACM, 2013, pp. 559–570.
[2] R. de Clercq and I. Verbauwhede, “A survey of hardware-based control
flow integrity (cfi),” arXiv preprint arXiv:1706.07257, 2017.
[3] S. Bhunia, M. S. Hsiao, M. Banga, and S. Narasimhan, “Hardware trojan
attacks: threat analysis and countermeasures,” Proceedings of the IEEE,
vol. 102, no. 8, pp. 1229–1247, 2014.
[4] Q. Ge, Y. Yarom, D. Cock, and G. Heiser, “A survey of microarchitec-
tural timing attacks and countermeasures on contemporary hardware,”
Journal of Cryptographic Engineering, pp. 1–27, 2016.
[5] “Intel 64 and ia-32 architectures software developers manual volume 3,
chapter 17, 18, and 19,” 2016.
[6] A. Garcia-Serrano, “Anomaly detection for malware identification us-
ing hardware performance counters,” arXiv preprint arXiv:1508.07482,
2015.
[7] Y. Yarom and K. Falkner, “FLUSH+RELOAD: A High Resolution, Low
Noise, L3 Cache Side-Channel Attack.” in USENIX Security, vol. 2014,
2014, pp. 719–732.
[8] R. Martin, J. Demme, and S. Sethumadhavan, “Timewarp: rethinking
timekeeping and performance monitoring mechanisms to mitigate side-
International Journal of Computer Science and Information Security (IJCSIS),
Vol. 16, No. 7, July 2018
8 https://sites.google.com/site/ijcsis/
ISSN 1947-5500](https://image.slidesharecdn.com/journalofcomputerscienceijcsisjuly2018fullvolume-180915043348/75/Journal-of-computer-science-ijcsis-july-2018-full-volume-22-2048.jpg)
![channel attacks,” ACM SIGARCH Computer Architecture News, vol. 40,
no. 3, pp. 118–129, 2012.
[9] X. Wang and J. Backer, “Sigdrop: Signature-based rop detection us-
ing hardware performance counters,” arXiv preprint arXiv:1609.02667,
2016.
[10] X. Wang, C. Konstantinou, M. Maniatakos, and R. Karri, “Confirm:
Detecting firmware modifications in embedded systems using hard-
ware performance counters,” in Computer-Aided Design (ICCAD), 2015
IEEE/ACM International Conference on. IEEE, 2015, pp. 544–551.
[11] X. Wang, C. Konstantinou, M. Maniatakos, R. Karri, S. Lee, P. Robison,
P. Stergiou, and S. Kim, “Malicious firmware detection with hardware
performance counters,” IEEE Transactions on Multi-Scale Computing
Systems, vol. 2, no. 3, pp. 160–173, 2016.
[12] M. Chiappetta, E. Savas, and C. Yilmaz, “Real time detection of
cache-based side-channel attacks using hardware performance counters,”
Applied Soft Computing, vol. 49, pp. 1162–1174, 2016.
[13] V. Pappas, M. Polychronakis, and A. D. Keromytis, “Transparent rop
exploit mitigation using indirect branch tracing.” in USENIX Security,
vol. 30, 2013, p. 38.
[14] Y. Cheng, Z. Zhou, Y. Miao, X. Ding, H. DENG et al., “Ropecker:
A generic and practical approach for defending against rop attack,”
Proceedings of the 21th Annual Network and Distributed System Security
Symposium (NDSS14), 2014.
[15] M. Kayaalp, T. Schmitt, J. Nomani, D. Ponomarev, and N. Abu-
Ghazaleh, “Scrap: Architecture for signature-based protection from
code reuse attacks,” in High Performance Computer Architecture
(HPCA2013), 2013 IEEE 19th International Symposium on. IEEE,
2013, pp. 258–269.
[16] Z. B. Aweke, S. F. Yitbarek, R. Qiao, R. Das, M. Hicks, Y. Oren,
and T. Austin, “Anvil: Software-based protection against next-generation
rowhammer attacks,” ACM SIGPLAN Notices, vol. 51, no. 4, pp. 743–
755, 2016.
[17] S. Briongos, G. Irazoqui, P. Malag´on, and T. Eisenbarth, “Cacheshield:
Protecting legacy processes against cache attacks,” arXiv preprint
arXiv:1709.01795, 2017.
[18] C. Liu, C. Yang, and Y. Shen, “Leveraging microarchitectural side chan-
nel information to efficiently enhance program control flow integrity,”
in Hardware/Software Codesign and System Synthesis (CODES+ ISSS),
2014 International Conference on. IEEE, 2014, pp. 1–9.
[19] G. Torres and C. Liu, “Can data-only exploits be detected at runtime
using hardware events?: A case study of the heartbleed vulnerability,”
in Proceedings of the Hardware and Architectural Support for Security
and Privacy 2016. ACM, 2016, p. 2.
[20] L. Yuan, W. Xing, H. Chen, and B. Zang, “Security breaches as pmu
deviation: detecting and identifying security attacks using performance
counters,” in Proceedings of the Second Asia-Pacific Workshop on
Systems. ACM, 2011, p. 6.
[21] M. B. Bahador, M. Abadi, and A. Tajoddin, “Hpcmalhunter: Behavioral
malware detection using hardware performance counters and singular
value decomposition,” in Computer and Knowledge Engineering (IC-
CKE), 2014 4th International eConference on. IEEE, 2014, pp. 703–
708.
[22] W. contributors, “Support vector machine — wikipedia, the free en-
cyclopedia,” https://en.wikipedia.org/w/index.php?title=Support vector
machine&oldid=826949511, 2018, [Online; accessed 25-February-
2018].
[23] J. Nomani and J. Szefer, “Predicting program phases and defending
against side-channel attacks using hardware performance counters,” in
Proceedings of the Fourth Workshop on Hardware and Architectural
Support for Security and Privacy. ACM, 2015, p. 9.
[24] Y. Zhang, A. Juels, M. K. Reiter, and T. Ristenpart, “Cross-vm side
channels and their use to extract private keys,” in Proceedings of
the 2012 ACM conference on Computer and communications security.
ACM, 2012, pp. 305–316.
[25] M. Alam, S. Bhattacharya, D. Mukhopadhyay, and S. Bhattacharya,
“Performance counters to rescue: A machine learning based safe-
guard against micro-architectural side-channel-attacks,” IACR Cryptol-
ogy ePrint Archive, 2017.
[26] W. contributors, “Dynamic time warping — wikipedia, the free en-
cyclopedia,” https://en.wikipedia.org/w/index.php?title=Dynamic time
warping&oldid=822466906, 2018, [Online; accessed 25-February-
2018].
[27] V. Jyothi, X. Wang, S. K. Addepalli, and R. Karri, “Brain: Behavior
based adaptive intrusion detection in networks: Using hardware perfor-
mance counters to detect ddos attacks,” in VLSI Design and 2016 15th
International Conference on Embedded Systems (VLSID), 2016 29th
International Conference on. IEEE, 2016, pp. 587–588.
[28] Y. Liu, P. Shi, X. Wang, H. Chen, B. Zang, and H. Guan, “Transpar-
ent and efficient cfi enforcement with intel processor trace,” in High
Performance Computer Architecture (HPCA), 2017 IEEE International
Symposium on. IEEE, 2017, pp. 529–540.
[29] J. R. and I. Corporation, “Processor tracing,” https://software.intel.com/
en-us/blogs/2013/09/18/processor-tracing, 2013, [Online; published 18-
September-2013].
[30] U.-C. U. S. C. E. R. Team, “Meltdown and spectre side-channel
vulnerabilities,” https://www.us-cert.gov/ncas/current-activity/2018/01/
03/Meltdown-and-Spectre-Side-Channel-Vulnerabilities, 2018, [Online;
published 03-January-2018].
International Journal of Computer Science and Information Security (IJCSIS),
Vol. 16, No. 7, July 2018
9 https://sites.google.com/site/ijcsis/
ISSN 1947-5500](https://image.slidesharecdn.com/journalofcomputerscienceijcsisjuly2018fullvolume-180915043348/75/Journal-of-computer-science-ijcsis-july-2018-full-volume-23-2048.jpg)
![Abstract— The main objective of this study is to determine
the factors influencing cloud computing adoption by Small
and Medium-sized Enterprises (SMEs). Based on two
dominant theories in the field of diffusion of innovation, a
conceptual model is proposed. In order to test the model
empirically, an online survey was designed and launched.
Decision makers of 101 SMEs agreed to participate in this
survey. In order to evaluate the internal, convergent, and
discriminant validity of the instrument, factor analysis and
reliability tests were performed. Logistic regression is
employed to test our hypotheses. The results of regression
reveal that decision maker’s knowledge about cloud
computing is the main influential factor in decision making
about its adoption.
Keywords: Cloud computing, SMEs, adoption
I. INTRODUCTION
Small and Medium-sized Enterprises (SMEs) significantly
contribute to each nation’s Gross Domestic Product (GDP)
and its labour market. Therefore, proposing strategies and
developing new systems are not only beneficial for SMEs, but
also for the economy as a whole. According to Tan et al. [1],
using appropriate Information and Communication
Technologies (ICT) helps SMEs become more efficient and
productive; however, SMEs do not have access to enough
resources (e.g. financial resources). Cloud computing, which
is an alternative to deploying applications and systems on-
premises, helps SMEs tackle many issues such as the high cost
and risk that are involved in IT projects. According to [5]
cloud computing has four advantages: 1) Data storage are
secure; the teams of the backend Cloud are so professional
that manage data also protect them from different attacks of
viruses and cracks. 2) The different application can be
supported by cloud computing. 3). The share of data and
applications are easy. 4) Thousands of servers exist in Cloud,
which has strong storage and computing ability. By
considering the advantages and key challenges of cloud
computing adoption, it is clear that cloud computing adoption
is still as a question for some organization. The organization
avoiding adopting cloud computing but due to advantages,
they are in favour to move cloud computing adoption.
Amazon, Google, Microsoft, IBM contributing in terms of
cloud computing. According to International Data Corporation
(IDC) 53% of Asian organizations already applying some of
the cloud computing services, and remaining 47% of the
organizations have decided to adopt Cloud services [9].
II. Literature review
SMEs are vital players of each market. One strategy which has
been proven to enhance SMEs’ ability to compete against
larger companies is the use of appropriate Information and
Communication Technologies (ICT) [1]. Although adopting
new technologies helps SMEs gain a competitive advantage, it
usually involves high costs. Cloud computing, as a new
computing paradigm, offers many advantages to companies,
especially smaller ones. Flexibility, scalability, and reduced
cost are just some of many advantages that cloud computing
offers to SMEs. To date, there is no universal definition for
cloud computing. Perhaps the most accurate definition of
cloud computing is the one offered by the National Institute of
Standards and Technology (NIST). They de- defined cloud
computing as “a model for enabling ubiquitous, convenient,
on-demand network access to a shared pool of configurable
computing resources (e.g., networks, servers, storage,
applications, and services) that can be rapidly provisioned and
released with minimal management effort or service provider
interaction. This cloud model is composed of five essential
characteristics, three service models, and four deployment
models.” [2] Following the success of cloud computing, the
new cloud-based delivery model of cloud computing has
emerged. These cloud computing solutions are market to offer
similar functionality as their on-premise counterparts, but the
infrastructure (software, computational power, hardware etc.)
is provide on-demand by the vendors in a pay-per-use model.
As with cloud computing, this new cloud computing delivery
model gains success increasingly growing its market share.
Most companies at least consider a cloud-cloud computing
solution and this trend were illustrates by [11] where
approximately 70 per cent of the CFOs stated that they would
consider using a Cloud-based version of their cloud
computing. Cloud computing Report quantifies the momentum
of cloud-cloud computing as it revealed that the market share
Factors of Cloud Computing Adoption by Small
and Medium Size Enterprises (SMEs)
Fahad1
, Sundresan Perumal2
1
Post Graduate Centre, Limkokwing University of Creative Technology
fahd.badr.nasser12@gmail.com
2
Faculty of Science and Technology, University Sains Islam Malaysia, darul Khusus, Malaysia,
sundresan.p@usim.edu.my
International Journal of Computer Science and Information Security (IJCSIS),
Vol. 16, No. 7, July 2018
10 https://sites.google.com/site/ijcsis/
ISSN 1947-5500](https://image.slidesharecdn.com/journalofcomputerscienceijcsisjuly2018fullvolume-180915043348/75/Journal-of-computer-science-ijcsis-july-2018-full-volume-24-2048.jpg)
![of cloud-based cloud computing systems has grown from 6
percent to 18 percent just in one year, from 2011 to 2012
(Panorama Consulting) [10]. As the market moves to a cloud
environment, traditional cloud computing providers are also
force to develop their own cloud-based solutions, otherwise
they risk losing market shares to the emerging Cloud
computing software vendors such as Netsuite and Plex.
However, a question that still appears to lack a clear answer is
whether cloud computing is a viable solution for companies of
all sizes.
III. Theory Review
The conceptual framework that is proposed in this research
originated from two well-known theoretical frameworks in
this field of study, which are Diffusion of Innovation (DOI)
theory developed by Rogers [30-31] and the Technology,
Organization, Environment (TOE) framework proposed by
Tornatzky and Fleischer [32]. Diffusion of Innovation Theory
(DOI) is a theory that tries to discover the factors that
influence the spread of a new idea or technology in a society
[31]. Rogers [30] defined diffusion of innovation as “the
process by which an innovation is communicated through
certain channels over time among the members of a social
system”. Any idea, process, product, or technology constitutes
an innovation, as long as it is perceived as new by individuals.
Rogers [30] argues that each innovation has different
attributes that influence its diffusion in society. Relative
advantage, compatibility, complexity, trialability, and
observability are the five key attributes of innovation. DOI
does not take into account the environmental and
organizational aspects of the context; therefore, in this study, I
used the Technology Organization Environment (TOE)
framework, which takes into account other aspects of
enterprises’ context.
IV. Research Model and Hypotheses
In order to study the adoption of cloud computing by SMEs, a
conceptual model is proposed. According to this model,
twelve variables influence the decision to adopt cloud
computing, which is depicted in Figure 1. All factors except
complexity have a positive influence on the adoption of cloud
computing. A very important study by Tornatzky and Klein
[33] reveals that relative advantage, complexity, and
compatibility are the characteristics of innovation that have
the most influence on the adoption of an innovation.
Hypotheses
Based on the model, 12 different hypotheses have been
proposed. Chau and Hui [34] argue that the size and structure
of SMEs force them to rely on external parties. In this context,
external support is defined as “The perceived importance of
support offered by cloud providers”. The first hypothesis is:
H1: Higher levels of perceived external support from cloud
providers positively affects the likelihood of cloud computing
adoption by SMEs
Competitive pressure is the level of competition among firms
within the specific industry in which the company operates
[35]. The following hypothesis is developed:
H2: Businesses that operate in more competitive environments
are more likely to adopt cloud computing.
Having enough knowledge about an innovation is the first step
in the adoption process. Therefore, in the context of cloud
computing, the following hypotheses have been developed:
H3: Decision Makers’ knowledge about cloud computing is
positively related to the decision to adopt cloud computing.
H4: Employees’ knowledge about cloud computing is
positively related to the adoption of cloud computing
Innovativeness is defined as “the level of decision-makers’
preference to try solutions that have not been tried out; and
therefore, are risky” [34]. Hypothesis 5 is:
H5: Decision Makers’ innovativeness is positively related to
the adoption of cloud computing.
According to Thong [35], information intensity is defined as
“the degree to which information is present in the product or
service of a business”. The following hypothesis is related to
this construct:
H6: Information intensity is positively related to the adoption
of cloud computing
An advantageous technology is one that enables companies to
perform their tasks more quickly, easily, and efficiently.
Moreover, it improves the quality, productivity, and
performance of the company. The following hypothesis below
is formulated: H7: Decision makers’ perception of the relative
advantage of using cloud computing is positively related to
cloud adoption
A technology that is difficult to understand, and whose use is
considered to be complex, is less likely to be successfully
adopted. Therefore, the following hypothesis is developed:
H8: The perceived level of complexity of the cloud computing
has a negative impact on the adoption of cloud computing.
In this research, compatibility is defined as “the degree to
which cloud computing is perceived as consistent with the
existing values, past experience, and needs of companies”.
The related hypothesis is as follows:
H9: High levels of compatibility between cloud computing
and a company’s norms and technologies have a positive
influence on cloud adoption.
We believe that the opportunity to use cloud computing on a
trial basis positively influences the adoption of cloud
computing; therefore, the next hypothesis is:
H10: a Higher level of trialability has a positive influence on
the adoption of cloud computing
In this study, the cost of cloud computing is defined as “the
degree to which decision makers perceive the total cost of
using cloud computing to be lower than other computing
paradigms”. In the context of cloud computing the next
hypothesis is:
H11. Decision makers who perceive cloud computing as being
less costly than other computing paradigms are more likely to
adopt cloud computing
In the context of cloud computing, security is defined as the
security of the service, data centres, and media. It also takes
into account the privacy and confidentiality of the companies’
data. Therefore, in the context of cloud computing:
H12: The more secure that decision makers perceive cloud
computing to be, the more they are willing to adopt cloud
computing.
International Journal of Computer Science and Information Security (IJCSIS),
Vol. 16, No. 7, July 2018
11 https://sites.google.com/site/ijcsis/
ISSN 1947-5500](https://image.slidesharecdn.com/journalofcomputerscienceijcsisjuly2018fullvolume-180915043348/75/Journal-of-computer-science-ijcsis-july-2018-full-volume-25-2048.jpg)
![V. Research Methodology
Data collection procedure of this research is based on a
survey. We developed a questionnaire which was reviewed
and modified by a panel of experts, consisting of three ITM
professors and four PhD students. We used Qualtrics to
develop our online questionnaire. The responses to our
questions were captured on a 5-point Likert-type scale. The
survey was sent to more than 500 decision makers. The
response rate of 20% left us with 101 completed
questionnaires. Both adopter and non-adopter companies were
asked to participate in this survey. In order to assure the
quality of the responses, several quality assurance (QA)
questions were added to the questionnaire. The questions
asked of participants were adapted mainly from papers already
published in this field. In addition to the standard questions,
we also developed some questions that are specific to the
context of cloud computing.
VI. Limitations and Future Studies
This research has some limitations, because of which the
results cannot be generalized to all SMEs. Our main limitation
is related to sample size. Sample size becomes problematic
because, in order to get significant results, there should be at
least 10 observations per each group of the dependent
variable. Having eight different variables, our ideal sample
size is 160, which is well beyond our actual sample size.
Moreover, our sample is selected from North American
companies. The results of this research are thus only
applicable to SMEs located in North America. Moreover, the
data is not restricted to a specific industry; this is problematic
because each industry has its own characteristics and
requirements. Performing further research in this field is
highly recommended. Cloud computing is a new phenomenon;
not many studies have been conducted in this field. The same
study may be replicated using larger sample sizes and in
different industries. Performing a longitudinal study would
also prove useful.
VII. Conclusion
Similar to any innovation, the diffusion of cloud computing
depends on various factors. In this research, we not only study
the technical aspects of cloud computing, but also others such
as environmental, organizational, and managerial factors. For
this purpose, a conceptual model is proposed and empirically
tested. The proposed model is developed based on two well-
known theoretical frameworks in the field of technology
adoption, which is: DOI developed by Rogers [30], and the
TOE framework developed by Tornatzky and Fleischer [32].
Based on the research model, a set of hypotheses were
proposed. In order to empirically test the model, we asked
decision makers of SMEs to participate in an online survey.
After the internal validity of the items was checked, factor
analysis was performed. At this stage, some of the items were
deleted. Removing these items left us with nine different
factors.
REFERENCES
[1] Lian, J. W. 2015. Critical factors for cloud-based e-invoice service
adoption in Taiwan: An empirical study. International Journal of
Information Management. Vol. 35, pp. 98-109.
[2] Yang, Z., Sun, J., Zhang, Y., and Wang, Y. 2015. Understanding SaaS
adoption from the perspective of organizational users: A tripod readiness
model. Computers in Human Behavior. Vol. 45, pp. 254-264.
[3] Picoto, W. Crespo. N. Kahn. F. 2013. Cloud Computing Usage and
Organizational Mobility An Empirical Assessment.
[4] Borgman, H. P., Bahli, B., Heier, H., and Schewski, F. 2013. Cloud rise:
exploring cloud computing adoption and governance with the TOE
framework. In System Sciences (HICSS), 46th Hawaii International
Conference on pp. 4425-4435.
[5] Kuiper, E., Van Dam, F., Reiter, A., and Janssen, M. 2014. Factors
influencing the adoption of and business case for Cloud computing in
the public sector. In eChallenges e-2014Conference. pp. 1-10.
[6] Sulaiman, H., and Maguire, A. I. 2014. Factors affecting the adoption of
integrated cloud-based e-health record in healthcare organizations: a
case study of Jordan. In Information Technology and Multimedia
(ICIMU), 2014 International Conference, IEEE. pp.102-107.
[7] N. Alkhater, R. Walters, and G. Wills. 2014. An investigation of factors
influencing an organization’s intention to adopt cloud computing,
International Conference on Information Society (i-Society 2014). pp.
337–338.
[8] N. Alkhater, R. Walters, and G. Wills. 2014. An investigation of factors
influencing an organization’s intention to adopt cloud computing,
International Conference on Information Society (i-Society 2014). pp.
337–338.
[9] Gangwar, H., Date, H., and Ramaswamy, R. 2015. Understanding
determinants of cloud computing adoption using an integrated TAM-
TOE
[10] Low, C., Chen, Y., and Wu, M. 2011. Understanding the determinants of
cloud computing adoption. Industrial management & data systems. Vol.
111, pp. 1006-1023
[11] Lin, A., and Chen, N. C. 2012. Cloud computing as an innovation:
Perception, attitude, and adoption. International Journal of Information
Management. Vol. 32, pp. 533-540.
[12] Lian, J. W., Yen, D. C., and Wang, Y. T. 2014. An exploratory study to
understand the critical factors affecting the decision to adopt cloud
computing in Taiwan hospital. International Journal of Information
Management. Vol. 34, pp 28-36.
[13] Asatiani, Aleksandre, "Why Cloud? - A Review of Cloud Adoption
Determinants in Organizations" (2015). ECIS 2015 Completed Research
Papers. Paper 13. ISBN 978-3-00-050284-2 h
p://aisel.aisnet.org/ecis2015_cr/13
[14] Nicholas A. Ogunde and join Mehnen. 2013. Factors affecting cloud
technology adoption: Potential user’s perspective. Pp 77-88.
10.1007/978-1-4471-4935-4_4
[15] Jlelaty and Monzer, 2012. Cloud computing adoption. The University of
Lund, Department of informatics.
https://lup.lub.lu.se/luur/download?func=downloadFile&recordOId=279
6971&fileOId=2796982
[16] Yeboah-Boateng, EO & Essandoh, KA 2014, 'Factors Influencing the
Adoption of Cloud Computing by Small and Medium Enterprises
(SMEs) in Developing Economies' International Journal of Emerging
Science and Engineering (IJESE), vol 2, no. 4, 4, pp. 13-20.
[17] Khamis Haji Salum, and Mohd Zaidi Abd Rozan. 2016. Exploring the
challenge impacted SMEs to Adopt cloud ERP. Indian Journal of
Science and Technology, Vol 9(45), DOI:
10.17485/ijst/2016/v9i45/100452.
[18] Zhong and Rohde, 2014. Cloud computing and ERP. Australasian
conference on information systems.
http://aut.researchgateway.ac.nz/bitstream/handle/10292/8108/acis20140
_submission_63.pdf?sequence=1
[19] Bjorn Johansson and Pedro Ruivo. Exploring factors for adoption ERP
as SaaS. Association for Promotion and Dissemination of Scientific
Knowledge. doi: 10.1016/j.protcy.2013.12.010
[20] Adnan Mustafa AlBar, Md Rakibul Hoque. 2015. Determinants of
Cloud ERP Adoption in Saudi Arabia: An Empirical Study. International
Conference on Cloud computing.
10.1109/CLOUDCOMP.2015.7149637
[21] Shima Ramezani Tehrani and Farid Shirazi. 2014. Conference: the 16th
International Conference on Human-Computer (HCII-2014), Volume:
Crete: Greece. 10.1007/978-3-319-07863-2_60
[22] S.M. Salleh, Z. Bohari, and L.Y. Khedi. 2013. Factors influencing the
adoption of cloud computing; A review of the literature.
[23] Mathews Z. Nkhoma, and Duy P.T. Dang. 2013. Contributing factors of
cloud computing Adoption: A Technology-Organizational-
Environmental Framework Approach. International journal of
International Journal of Computer Science and Information Security (IJCSIS),
Vol. 16, No. 7, July 2018
12 https://sites.google.com/site/ijcsis/
ISSN 1947-5500](https://image.slidesharecdn.com/journalofcomputerscienceijcsisjuly2018fullvolume-180915043348/75/Journal-of-computer-science-ijcsis-july-2018-full-volume-26-2048.jpg)
![information systems and engineering(IJSE) Vol 1, No 1. ISSN: 2289-
3709
[24] Fasil Alemeye and Fukada Getahun. 2014. Cloud Readiness assessment
framework and recommendation system.
http://www.hilcoe.net/docs/papers/Volume2N2/V2N2Paper4.pdf
[25] Khamis Haji Salum, and Mohd Zaidi Abd Rozan. 2015. Barriers and
drivers in cloud ERP adoption among SMEs. Journal of Information
Systems Research and Innovation. 9(1), 9-20,
[26] Alshamaila, Y., Papagiannidis, S., & Li, F. (2013). Cloud computing
adoption by SMEs in the north east of England: A multi-perspective
framework. Journal of Enterprise Information Management, 26(3), 250-
275. doi:10.1108/17410391311325225
[27] Oliveira, T., Thomas, M., & Espadanal, M. (2014). Assessing the
determinants of cloud computing adoption: An analysis of the
manufacturing and services sectors. Information & Management, 51,
497-510. doi:10.1016/j.im.2014.03.006
[28] Chin-Sheng Chena, Wen-Yau Liangb, & Hui-Yu Hsu. (2014). A cloud
computing platform for ERP applications.
http://dx.doi.org/10.1016/j.asoc.2014.11.009
[29] Saudi, Amin and Iahad, Noorminshah A., "An Integrated Theoretical
Framework for Cloud Computing Adoption by Small and Medium-Sized
Enterprises" (2013). PACIS 2013 Proceedings. Paper 48.
http://aisel.aisnet.org/pacis2013/48
[30] Ali, Omar; Soar, Jeffrey; McClymont, Hoda; Yong, Jianming; and
Biswas, Jit, "Anticipated Benefits of Cloud Computing Adoption in
Australian Regional Municipal Governments: An Exploratory Study"
(2015). PACIS 2015 Proceedings. Paper 209.
http://aisel.aisnet.org/pacis2015/209
[31] Mayank Yuvaraj, (2016)," Determining factors for the adoption of cloud
computing in developing countries A case study of Indian academic
libraries ", The Bottom Line, Vol. 29 Iss 4 pp. 259 – 272 Permanent
links to this document: http://dx.doi.org/10.1108/BL-02-2016-0009
[32] Garverick, Michael L., "Motives and Barriers to Cloud ERP Selection
for SMEs: A Survey of Value Added Resellers (VAR) Perspectives."
Dissertation, Georgia State University, 2014.
http://scholarworks.gsu.edu/bus_admin_diss/36
[33] Father M. O. I. Norafida Ithnin, (2016),"Factors influencing cloud
computing adoption for e-government implementation in developing
countries: instrument development", Journal of Systems and Information
Technology, Vol. 18 Iss 3 pp. -Permanent link to this document:
http://dx.doi.org/10.1108/JSIT-01-2016-0001
[34] Usman, U.M.Z., Ahmad, M.N. & Zakariya, N.H., 2016. Factors
influencing cloud enterprise resource planning adoption in SMEs. In K.
J. Kim & N. Joukov, eds. Lecture Notes in Electrical Engineering.
Singapore: Springer Singapore, pp. 235–245. Available at:
http://dx.doi.org/10.1007/978-981-10-0557-2_24
[35] Prashant Guptaa, A. Seetharamana, & John Rudolph Rajb. (2013). The
usage and adoption of cloud computing by small and medium
businesses. International Journal of Information Management 33 861–
874
[36] Jiunn W. Liana,1, David C. Yenb, &Yen-Ting Wangaa (2013). An
exploratory study to understand the critical factors affecting the
decision to adopt cloud computing in Taiwan hospital
International Journal of Computer Science and Information Security (IJCSIS),
Vol. 16, No. 7, July 2018
13 https://sites.google.com/site/ijcsis/
ISSN 1947-5500](https://image.slidesharecdn.com/journalofcomputerscienceijcsisjuly2018fullvolume-180915043348/75/Journal-of-computer-science-ijcsis-july-2018-full-volume-27-2048.jpg)
![Abstract—The unavailability of user-based data for audio
quality of service and user’s complaint about services rendered
by mobile network providers are on the increase. The concern
about the poor quality of service (QoS), especially for voice
callers, motivated this work. The objective of this research is to
develop a predictive model using decision tree algorithm and
Fuzzy logic derived for the mobile telecommunication users and
evaluates the performance of the model. The study proposed a
predictive model; the model can enhance monitoring of the
quality of service delivery.
Keywords: Quality of Service, classification, voice calls,
prediction, C4.5 and ID3 decision trees
Index Terms—Enter key words or phrases in alphabetical
order, separated by commas.
I. BACKGROUND OF THE STUDY
They are numerous advantages the citizen enjoyed with the
deployment of cellular network (CN) services into any
developing economy. The CN services in the mobile
telecommunication sector have some challenges. The numbers
of services and subscribers of CN increases drastically, and
that also increases the worry of users about QoS rendered [1].
NCC sanctions some mobile network operators (MNO) in
Nigeria namely MNO_3, MNO_4, MNO_2 and MNO_1 due
to the poor quality of service. Also, the National Assembly in
Nigeria debated on the citizen complaints of poor quality of
services in the sector. The second challenge is the need to
document and analyze the past and present data with the aim
of predicting future trends. The GSM providers in Nigeria are
far from providing reliable services to their clients [2, 3, 4, 5].
In this work, KPIs in cellular network data were captured for
21 out of 36 states in the country using crowdsourcing
paradigm. The call success rate (CSSR), call drop rate (CDR),
congestion rate (TCHR) and received signal strength (RSS)
parameters used for this work. So concerned about the poor
quality of service especially for voice callers justify or
motivated this work. This research work focused on voice
service. This work has five sections. Section two discusses
literature review, section three is about methodology, and
section four and five discuss results and conclusion
respectively.
II. LITERATURE REVIEW
The data collection is very crucial for any meaningful
analysis. Incidentally, telecommunication data are classified
data which make data collection a difficult task. The other
older methods of data collections have their shortcomings. The
new emerging technique called crowdsourcing is considered
appropriate for this work. In [4], Crowdsourcing Application
for Cellular Network voice QoS analysis and Evaluation using
mobile devices is reported. The development of an android
application that measured some KPIs, using Java
programming language on Android smartphones reported. The
work succeeded in measuring KPIs using subscriber’s mobile
devices (used in accessing the network). However, the app
could not successfully measure KPIs on the server.
The aim of this study is to access GSM services in Nigeria
[6]. Secondary data was collected and used for the analysis.
Theories of Performance tools were employed. The
work reported that GSM services performed below
expectation. The limitation of the work is that the researcher
used secondary data. Given the mass data generated from
mobile telecommunication industry, data mining technique is
used to analyze the captured data. The data mining tools are
used to determine various models, summaries and derived
values from a given large collection of data. There are
other different approaches to mine data such as clustering,
Decision tree/rules, Genetic algorithm/programming,
statistical method, Neural Network, Support Vector Machine,
Fuzzy logic. The aim of data mining is either to classify,
model evaluate and predict. The DM tools applied to several
sectors. An example is its application to medical field. Idowu
et al., (2015) applied one of the tools to depict changes in the
model used in the management of one of the deadly disease in
the medical sector. The management of deadly disease in
medical line is similar to management of poor quality of
service in telecommunication. The objectives of this research
are to analyze the QoS of CN based on crowd sourced data;
develop a platform to group captured data using decision tree
DEVELOPMENT OF A PREDICTIVE
MODEL FOR AUDIO QUALITY OF
SERVICE IN NIGERIA
1
Mebawondu J.O., 2
Adewale O.S, 3
Dahunsi F.M., 4
Alese B.K.
1,2,4
Department of Computer Sci. FUTA, Nigeria; 3
Department of Electrical Electronic Engineering FUTA,
Nigeria
1
mebawondu1010@gmail.com, 2
adewale@futa.edu.ng, 3
fmdahunsi@gmail.com, 4
bkalese@futa.edu.ng
International Journal of Computer Science and Information Security (IJCSIS),
Vol. 16, No. 7, July 2018
14 https://sites.google.com/site/ijcsis/
ISSN 1947-5500](https://image.slidesharecdn.com/journalofcomputerscienceijcsisjuly2018fullvolume-180915043348/75/Journal-of-computer-science-ijcsis-july-2018-full-volume-28-2048.jpg)
![algorithm in predicting user-based voice QoS for the mobile
telecommunication users
III METHODOLOGY
This section explained the method used to achieve the
objective of this work. The first step is the collection of
datasets from the crowd sourced data; the next step is
preprocessing of data and the formulation of the desired model
using the decision trees algorithms (C4.5 and ID3). Finally,
the Fuzzy logic tool used for the modeling [7, 8, 9].
Decision Trees Algorithm
The rules used by DT algorithm are inducted by definition
from each respective node to branch leaf. Given a set of j
number of cases, the decision trees algorithm grows an initial
tree using the divide-and-conquer algorithm
ID3 and C4.5 algorithms used for audio QoS modeling. C4.5
is superior due to its ability to: handle different types of
variables; handle missing values; handle attributes with
differing costs; and prune trees after creation. Equation (1)
used in determining which attribute is used to split the dataset,
which of the selected attribute split is most useful in splitting
the dataset after attribute selection by equation (1).
Let Xij be a dataset containing records of i numbers of
attributes alongside their respective level of QoS. Xij is a set
of attributes of j numbers of cases, Xi is a single attribute with
two or more outcome. Hk assumes values H1for poor, H2 for
fair and H3 for good. T is the set of values for a given
attributes Xi. IG is the information gain. Split (T) is
introduced to avoid bias.
( ) = ( ) −
| |
. ( ) (1)
Where:
( ) = −
| |
.
| , |
( )
= −
| |
.
| |
(2)
T is the set of values for a given attribute.
Fuzzy Logic Model
Fuzzy Logic using triangular membership function was used
for the modeling [10]:
v= {(x, µv(x))|x ϵ V, µv(x) ϵ [0,1] (3)
where µv(x) is the membership function of xv and µv is the
degree of membership of xv in the interval of [0, 1].
Data Pre-processing:
Input Variables: Input parameters collected are the Call Set-
up Success Rate (CSSR), the TCH Congestion (TCHCR), the
Received Signal Strength Indicator (RSS) and the Call Drop
Rate (CDR). Good, fair and poor are represented by 0,1.2
respectively. Table 1 shows the description of input variables
used.
TABLE 1: INPUT DATA TRANSFORMATION
S/
No.
Input
Variable
Input
Variable
Codes
Domain
Values
Normalized
Values
1 Received
Signal
Strength
(RSS)dMb X < 1 4
14<=X<20
20<=X<=31
0
1
2
2 Call Setup
Success Rate
KPI – CSSR
(X1)%
X 1 < 9 0
90<=X1<=95.9
X 1 > = 9 6
0
1
2
3 Call drop rate KPI – CSSR
(X2)%
X 2 > 5
2 < X 2 < = 5
X 2 < = 2 %
0
1
2
4 Congestion
rate
KPI – CSSR
(X3)%
X 3 > 5 %
2 < X 3 < = 5
X 3 = < 2
0
1
2
TABLE 2: PERFORMANCE OF VOICE CALL QOS OUTPUT
OUTPUT VARIABLE DOMAIN
S/
NO
VALUES NORMALISED QoS
VALUES
1 Excellent QoS 08 – 09 2 (Excellent)
2 Moderate QoS 06 – 7.9 1 (Moderate)
3 Poor QoS 0.0 – 5.9 0 (Poor)
The output variable represents the performance of voice call
QoS. The output make use of three levels grading systems,
detail is shown in Table 2.
(i) Data Identification
In this study, the needed variables to measure QoS of mobile
telecommunications companies identified by experts. KPIs
selected based on the review of related works concerning the
quality of service of mobile telecommunications companies.
Based on the feature selection, the considered variables for
this work were received signal strength (RSS), congestion rate
(TCHR), call success rate (CSSR) and the call drop rate
(CDR).
(ii) Data Collection-
For this study, data were collected from156,180 voice calls
using crowdsourcing technique the captured data cut across
21 states and Federal Capital Territory in Nigeria. The
information collected from the sites was collected in the cloud
and downloaded into a spreadsheet application – Microsoft
Excel of the Microsoft Office 2016. Information collected
from the sites contained the explanatory variables alongside
QoS of the mobile telecommunications companies.
(iii) Data-Preprocessing
Following the collection of data, the 156,180 voice calls pre-
processed [11] into dataset file that contained 4280 records
alongside the ten (10) attributes, the data collected was
processed for the presence of an error in data entry including
misspellings and missing data. The data stored in the comma
separated variable (.csv) format was transformed into the
attribute file format (.arff). Figure 1 depicts format of the .arff
used for model development – a light-weight java application
composed of supervised and unsupervised machine learning
tools. The tariff file is composed of three parts, namely:
International Journal of Computer Science and Information Security (IJCSIS),
Vol. 16, No. 7, July 2018
15 https://sites.google.com/site/ijcsis/
ISSN 1947-5500](https://image.slidesharecdn.com/journalofcomputerscienceijcsisjuly2018fullvolume-180915043348/75/Journal-of-computer-science-ijcsis-july-2018-full-volume-29-2048.jpg)
![a. The relation name section which contains the tag
@QoS-data, that contains the data needed for
simulation;
b. The attribute names section which contains the tag
@attribute attribute_name label was used to identify
the attributes that describe the dataset stored in the
.arff file needed for simulation.; and
c. The primary data is in tag @data
The crowd-sourced data can be found in QoS-data.arff while
the number of attributes listed in the attribute section was 9
including the target attribute. Following this, the result dataset
contains 4280 records preprocessed after downloading.
3.4 Model Formulation
Supervised machine learning algorithms make it possible to
assign a set of records (input variables of QoS) to a target
class – the measure of QoS (Poor, Fair and Good). Supervised
machine learning algorithms are Black-boxed models, thus it
is not possible to give an exact description of the mathematical
relationship existing among the independent variables (input
variables) to the target variable (output variable – a measure of
QoS). Cost functions are used by supervised machine learning
algorithms to estimate the error in prediction during the
training of data for model development. The decision trees
algorithm is a white-boxed model owing to its ability to be
interpreted as a tree-structure. The tree structure was extended
to support the construction of IF-THEN statements using the
edges (attributes) of the decision trees.
IV RESULTS
Figure 1depicts DT constructed with the aid of a C4.5
algorithm. The tree indicates size 40 (edges) present while the
number of leaves is 27.The parameters with the highest
information used in DT construction, the results used to
estimate QoS of Nigerian Mobile Network Operators. The
parameters are TCHR, CSSR, RSS and the CDR in order of
importance based on the hierarchical position on the tree.
Samples of the rules derived from DT as containing in Figure
1 are as follows:
a. IF (CSSR = “Poor”) AND (TCHR=”Poor”) AND
(RSS=”Poor”) AND (CDR=”Poor”) THEN (QOS =
Poor) [rule 1]
b. IF (CSSR = “Poor”) AND (TCHR=”Fair”) AND
(RSS=”Poor”) AND (CDR=”Fair”) THEN (QOS =
Poor) [rule 5]
c. IF (CSSR = “Poor”) AND (TCHR=”Fair”) AND
(RSS=”Fair”) AND (CDR=”Fair”) THEN (QOS =
Poor) [rule 32]
d. IF (CSSR = “Poor”) AND (TCHR=”Fair”) AND
(RSS=”Good”) AND (CDR=”Fair”) THEN (QOS =
Poor). [rule 59]
e. IF (CSSR = “Poor”) AND (TCHR=”Fair”) AND
(RSS=”Good”) AND (CDR=”Good”) THEN (QOS
= Moderate). [rule 60]
f. IF (CSSR = “Fair”) AND (RSS=”Fair”) AND
(TCHR=”Fair”) AND (CDR=”Fair”) THEN (QOS
= Moderate). [rule 41]
g. IF (CSSR = “Good”) AND (TCHR=”Good”) AND
(RSS=”Poor”) AND (CDR=”Fair”) THEN (QOS =
Moderate). [rule 26]
h. IF (CSSR = “Good”) AND (TCHR=”Good”) AND
(RSS=”Fair”) AND (CDR=”Good”) THEN (QOS =
Excellent). So [rule 54]
IF (CSSR = “Good”) AND (TCHR=”Good”) AND
(RSS=”Good”) AND (CDR=”Good”) THEN (QOS =
Excellent). [rule 81]
Figure 1: C4.5 Decision Trees for QOS
The decision trees generated with the aid of ID3 decision
trees algorithm displayed in Figure 2. The tree has a size of 39
edges present while there are 26 leaves. The parameters with
the highest information used in DT construction, the results
used to estimate QoS of Nigeria Mobile Network Operators.
The parameters are TCHR, CSSR, RSS and the CDR in order
of importance based on the hierarchical position on the tree.
The ID3 decision trees algorithm has differences at certain
nodes as shown in Figure 2. IDE was unable to decode the
following rules:
a. IF (CSSR=” Fair”) AND (RSS=” Fair”) AND
(TCHR=” Good”) AND (CDR=”Poor”)[rule 43 of
id3]
b. IF (CSSR=”Poor”) AND (RSS=”Fair”) AND
(TCHR=”Good”) AND (CDR=”Poor”) and [rule 34
of id3]
c. IF (CSSR=”Fair”) AND (RSS=”Fair”) AND
(TCHR=”Good”) AND (CDR=”Fair”) [rule 45].
The extra rules that could be determined by the ID3
presented as follows:
a. IF (CSSR = “Poor”) AND (TCHR=”Poor”) AND
(RSS=”Poor”) AND (CDR=”Fair”) THEN (QOS =
Poor) [rule 2]
b. IF (CSSR = “Fair”) AND (TCHR=”Good”) AND
(RSS=”Poor”) AND (CDR=”Poor”) THEN (QOS =
Poor) [rule 16]
c. IF (CSSR = “Good”) AND (TCHR=”Fair”) AND
(RSS=”Fair”) AND (CDR=”Fair”) THEN (QOS =
Moderate). [rule 50]
d. IF (CSSR = “Fair”) AND (RSS=”Fair”) AND
(TCHR=”Fair”) AND (CDR=”Good”) THEN (QOS
= Moderate). [rule 42]
e. IF (CSSR = “Good”) AND (TCHR=”Fair”) AND
(RSS=”Good”) AND (CDR=”Good”) THEN (QOS
= Excellent). And [rule 78]
International Journal of Computer Science and Information Security (IJCSIS),
Vol. 16, No. 7, July 2018
16 https://sites.google.com/site/ijcsis/
ISSN 1947-5500](https://image.slidesharecdn.com/journalofcomputerscienceijcsisjuly2018fullvolume-180915043348/75/Journal-of-computer-science-ijcsis-july-2018-full-volume-30-2048.jpg)
![f. IF (CSSR = “Good”) AND (TCHR=”Good”) AND
(RSS=”Good”) AND (CDR=”Fair”) THEN (QOS =
Excellent). [rule 80]
Figure 2: ID3 Decision Trees for QOS
So the combination of C4.5 and ID3 rules are used as rules
for the fuzzy logic. The combination of the two algorithms
makes the Fuzzy to be robust.
Fuzzy Logic Interface and Output
The membership function interface displayed in figure 3.
The figure 3 displays the four variables used with the output.
Supplying different values of input parameters will generate
equivalent output. The other outputs of different relationships
demonstrated in figures 4 to 7.
Figure 3: Membership Function interface
Figure 3 is an interface where the rules for voice calls
QoS captured in the editor mode. The parameters specified in
this section.
Figure 4: Surface view of QoS showing
the relationship between RSS against TCHR
Figure 5: Surface view of QoS showing
the relationship between TCHR against CSSR
Figure 4 shows the surface diagram of the relationship
between received signal strength (RSS) and congestion rate
(THCR). This diagram shows that whenever the RSS is good
(2) and the TCHR is good (2) then the QoS is excellent else it
is moderate.
Figure 5 shows the surface diagram of the relationship
between congestion rate (THCR) and call set up success rate
(CSSR).This diagram shows that whenever the (THCR) is
good (2) and the CSSR is good (2) then the QoS is excellent
else it is moderate.
Figure 6: Surface view of QoS showing the relationship between TCHR
against CDR
International Journal of Computer Science and Information Security (IJCSIS),
Vol. 16, No. 7, July 2018
17 https://sites.google.com/site/ijcsis/
ISSN 1947-5500](https://image.slidesharecdn.com/journalofcomputerscienceijcsisjuly2018fullvolume-180915043348/75/Journal-of-computer-science-ijcsis-july-2018-full-volume-31-2048.jpg)
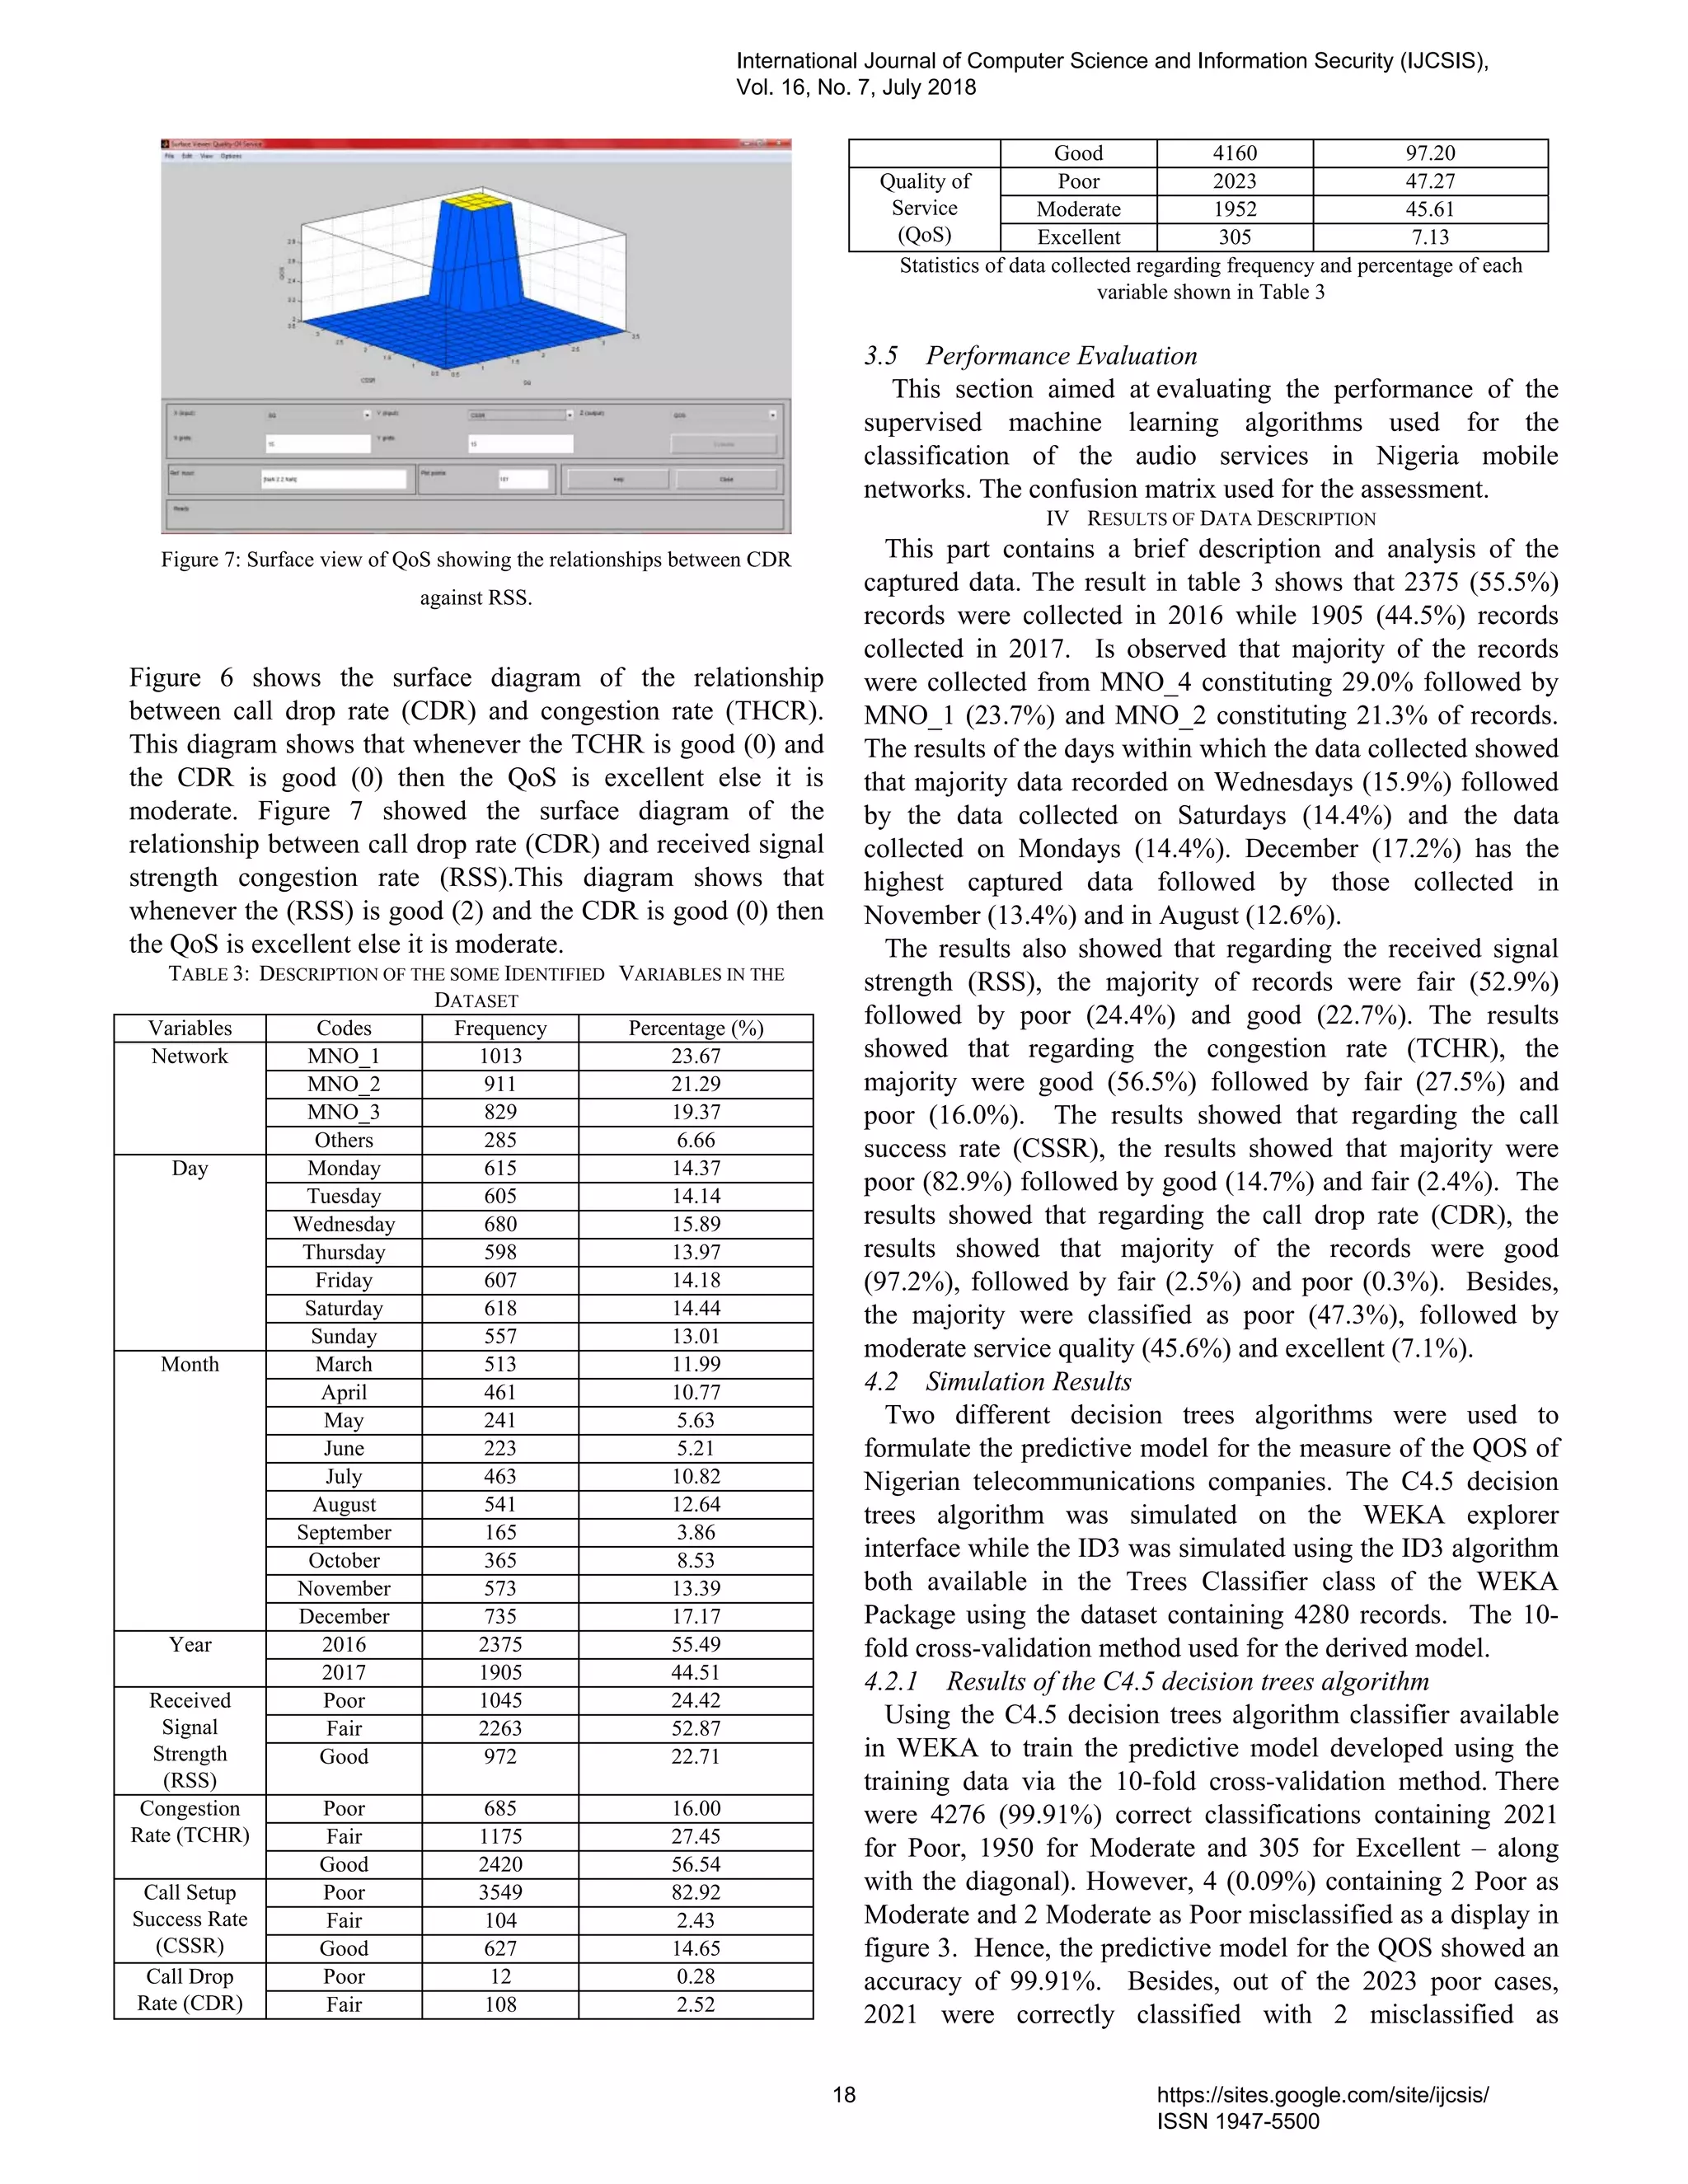
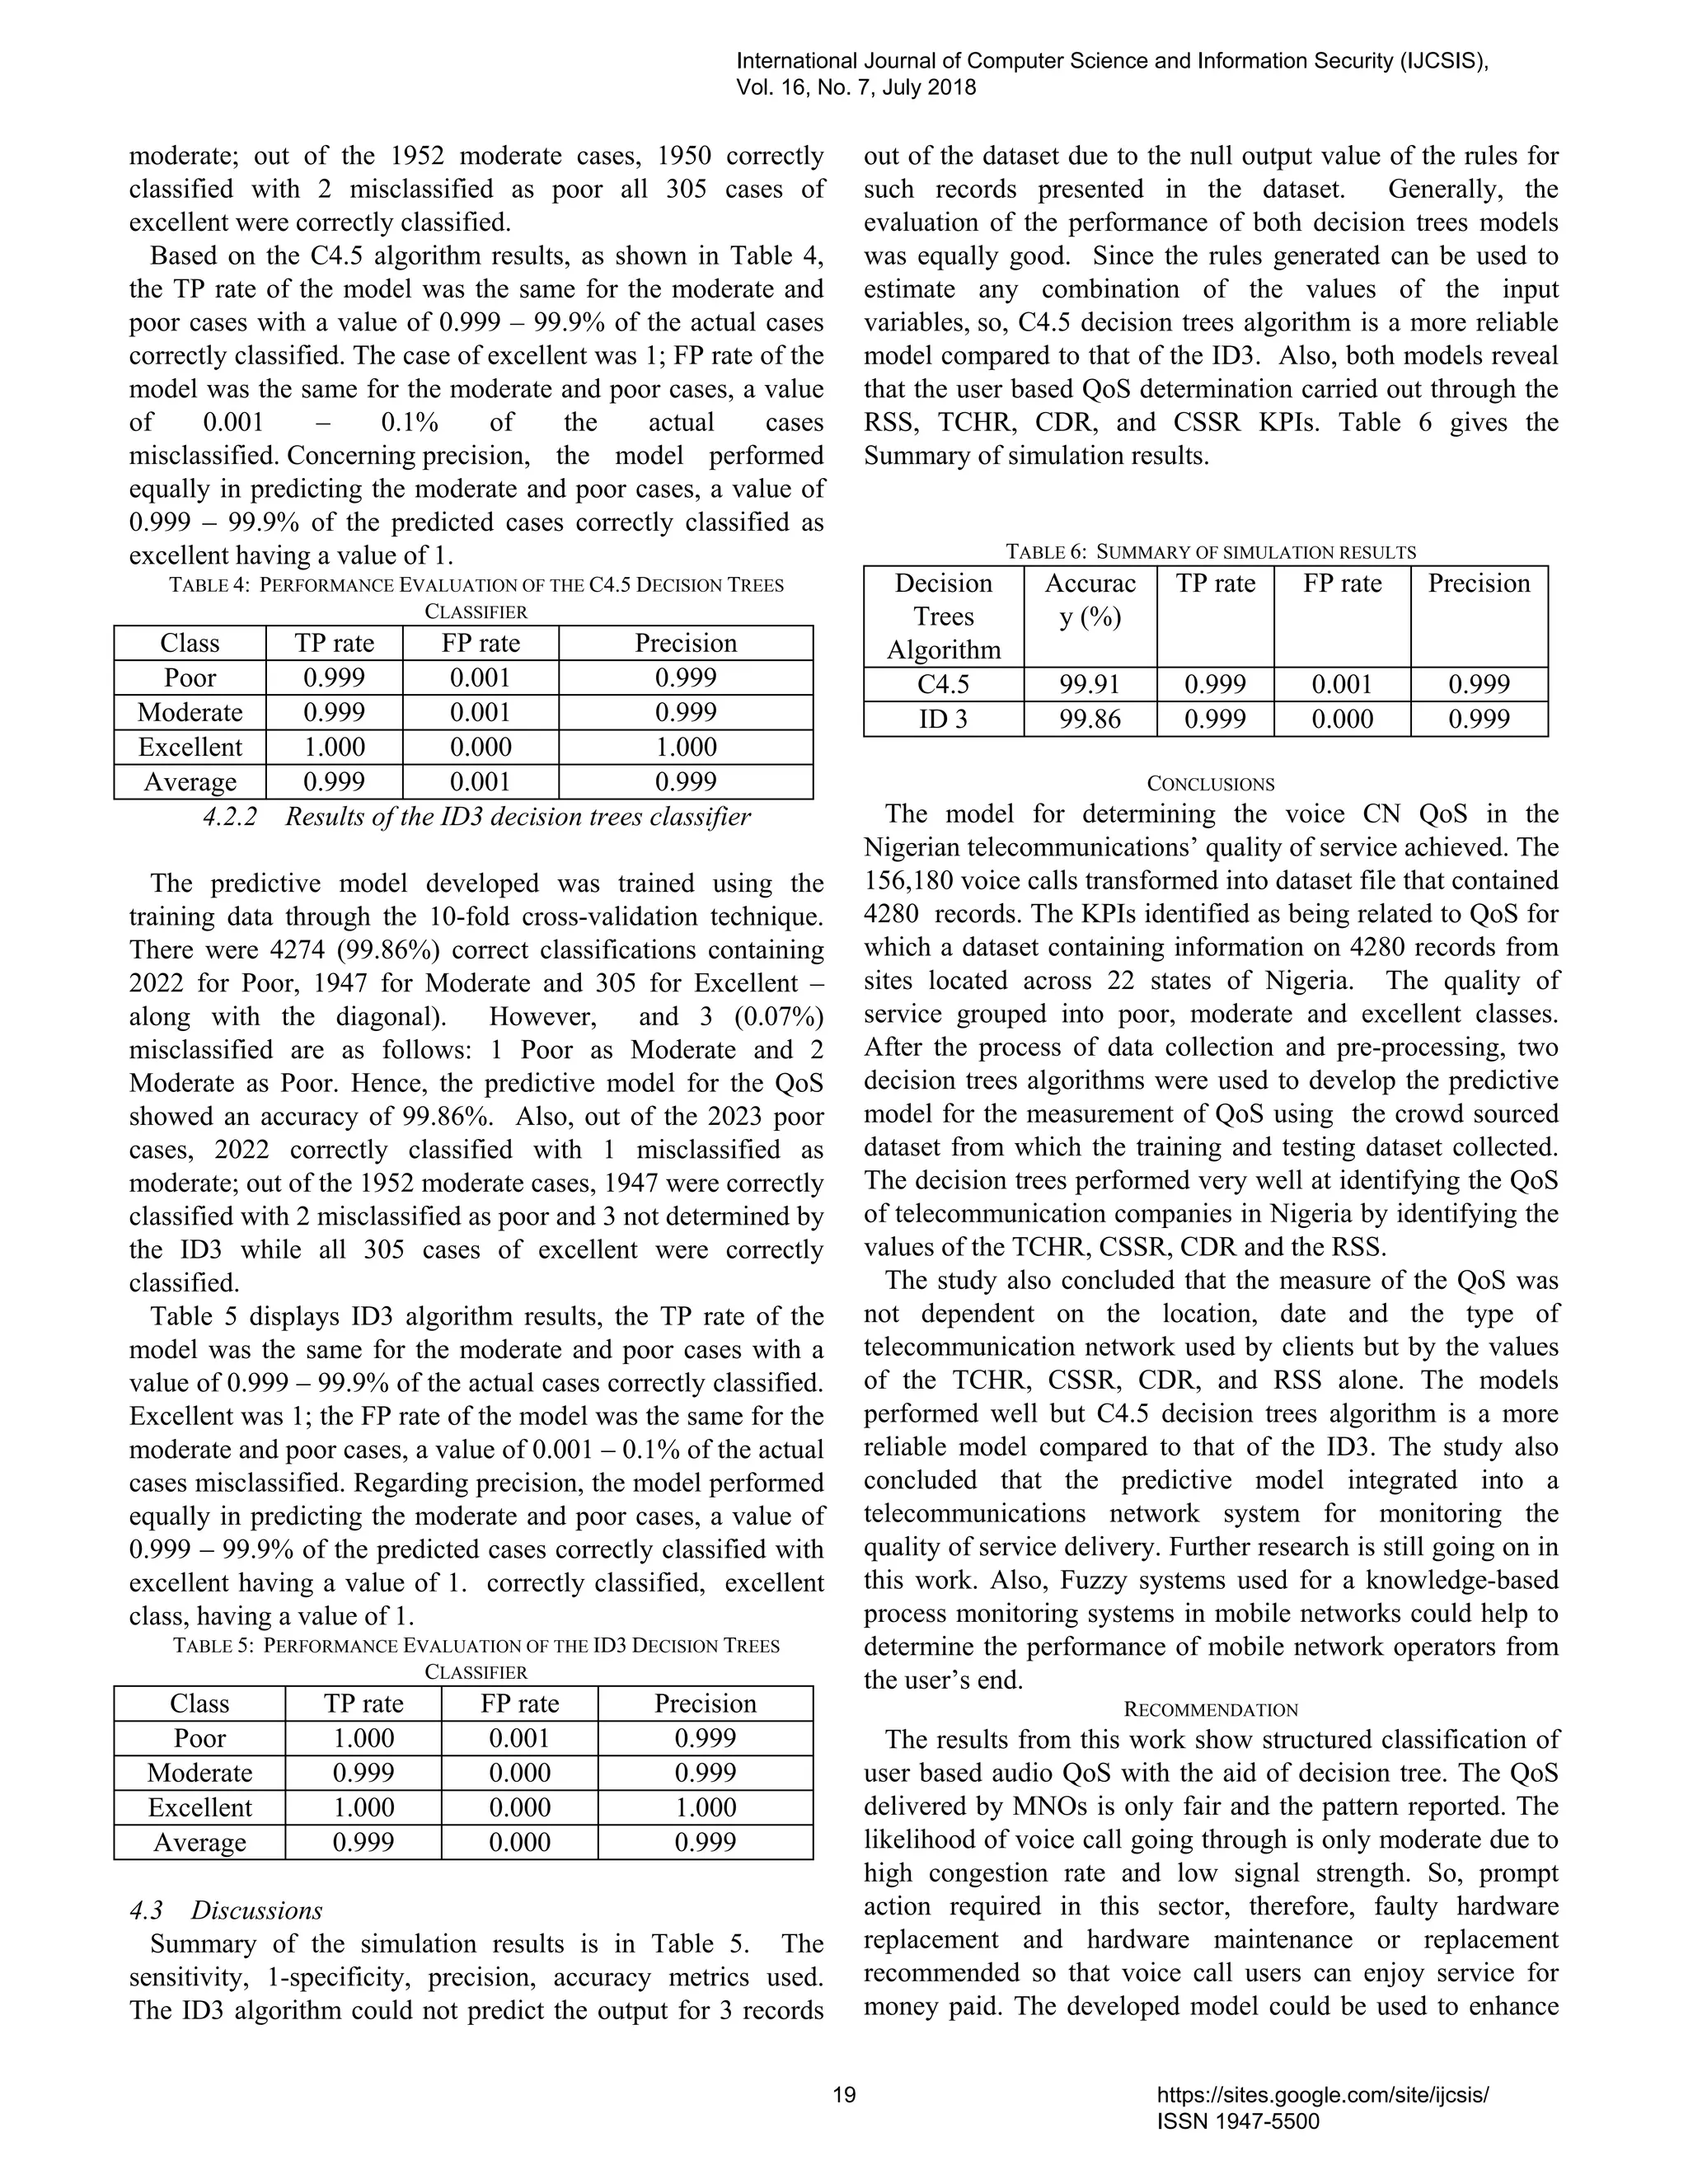
![management of the audio QoS in mobile telecommunication
networks system. Further research is going on this work.
REFERENCE
[1] Nigerian Communication Commission.. QoS (Technical) Benchmarks
for Mobile Services, http://www.ncc.gov.ng, 2017, retrieved March 15,
2018
[2] B. M. Kuboye, B. K. Alese, O. Fajuyigbe, and O. S. Adewale ,
Development of Models for Managing Network Congestion on Global
System for Mobile Communication (GSM) in Nigeria Journal of
Wireless Networking and Communications; 1(1): 2012, pp8-15
[3] F. M. Dahunsi and G. Kolawole, Participatory Analysis of Cellular
Network Quality of Service. International Journal of Computing and
ICT Research, Vol. 9, Issue 1, 2015, pp 25 - 4
[4] G.S. Kolawole. Crowd Sourcing Application for Cellular Network
Voice QoS Analysis and Evaluation using Mobile Devices BTech
Computer Science Thesis, FUTA, Akure, 2014
[5] O. N. Emuoyibofarhe, J. A. Awokola, K. Oyetunji, and A. E. Oladeji.,
Performance Analysis of Traffic Control Congestion Management In
Mobile Wireless communication In South West Of Nigeria, Journal of
Multidisciplinary Engineering Science and Technology (JMEST) ISSN:
3159-0040 Vol. 2 Issue 7, 2015
[6] Adekitan and Rasheed, Performance Evaluation of Global System for
Mobile Telecommunication Networks in Nigeria, SCSR Journal of
Business and Entrepreneurship (SCSR-JBE) Volume 1, Issue 1
(February, 2014), pp 09 – 21, www. scsrjournals@scholarconsult.com,
2014, retrieved on 20th
April, 2018
[7] J. D. Delgado and M. Zafrullah, Neuro-Fuzzy clustering a Key
Performance Indicator for QoS assessment in Terrestrial Trunked Radio
(TETRA) Network approach (self-organizing maps algorithms,
International Journal of Mobile Network Communications and
Telematics (IJMNCT) Vol. 3, 2013, pg.6.
[8] M. K. Choudhury and N. Barunah and K. C. Monish. A Fuzzy Logic
Based Expert System for determination of Health Risk Level of Patient.
International Journal of Research in Engineering and Technology 4(5),
2015, pgs. 261 – 267.
[9] A. Uyar. A Predictive modeling of implantation outcome in an in vitro
fertilization setting: and an application of machine learning method,
medical decision making, 2014
[10] P.A. Idowu, S.O. Ajibola, and J.A. Balogun, Development of a Fuzzy
Logic Based Model for Monitoring Cardiovascular Risk, 36th
International Journal of Health Information System and Information
10(4), 2015. pp. 36-53.
[11] B.A. Onyekwelu, B.K. Alese, and A.O. Adetunmbi. Pre-Processing of
University Web server Log Files for Intrusion Detection, I. J. Computer
Network,and Information Security, Published Online January 2017 in
MECS, http://www
.mecs-press.org, 2017, retrieved on 16/4/2018
International Journal of Computer Science and Information Security (IJCSIS),
Vol. 16, No. 7, July 2018
20 https://sites.google.com/site/ijcsis/
ISSN 1947-5500](https://image.slidesharecdn.com/journalofcomputerscienceijcsisjuly2018fullvolume-180915043348/75/Journal-of-computer-science-ijcsis-july-2018-full-volume-34-2048.jpg)
![Thinging for Software Engineers
Sabah S. Al-Fedaghi
Computer Engineering Department
Kuwait University
Kuwait
sabah.alfedaghi@ku.edu.kw
Abstract—The aim of this paper is to promote the terms thing and
thinging (which refers to the act of defining a boundary around
some portion of reality and labeling it with a name) as valued
notions that play an important role in software engineering
modeling. Additionally, we attempt to furnish operational
definitions for terms thing, object, process, and thinging. The
substantive discussion is based on the conception of an (abstract)
machine, named the Thinging Machine (TM), used in several
research works. The TM creates, processes, receives, releases,
and transfers things. Accordingly, a diagrammatic representation
of the TM is used to model reality. In the discussion section, this
paper clarifies interesting issues related to conceptual modeling
in software engineering. The substance of this paper and its
conclusion suggest that thinging should be more meaningfully
emphasized as a valuable research and teaching topic, at least in
the requirement analysis phase of the software development
cycle.
Keywords-conceptual modeling; thing vs. object; thinging;
diagrammatic representation
I. INTRODUCTION
The current norm in software engineering is the object
model, in which object orientation has become the standard for
the analysis and design phases of the software development
process. This model “in object-oriented analysis and design
provides a more realistic representation, which an end user can
more readily understand” [1]. The model has assimilated
ontological issues that explicitly specify the conceptualization
of the domain of concern, for which the term object represents
a fundamental notion in the object-orientation paradigm. This
paper is oriented toward modeling the domain of interest with
things, a notion that is more general than that of objects. Thing
is interchangeable with entity and is applicable to any item that
is acknowledged by a system, whether that item be particular,
universal, abstract, or concrete [2].
A. Specific Aim of This Paper
Several papers submitted to software engineering journals
and conferences have advanced objections to the use of the
term thing as “a vague and empty word [that lacks] any
definition.” One purpose of writing this paper is to defend this
term and demonstrate that thing specifically and thinging in
general are as “celebrated” [3] as the terms object and class.
Thinging refers to “defining a boundary around some portion of
reality separating it from everything else and then labeling that
portion of reality with a name” [4]. According to Heidegger, to
understand the thingness of things, one needs to reflect on the
power of things to “gather” space and time [5]. Thinging
expresses how a “thing things”, which he explained as
“gathering”, uniting, or tying together its constituents. Uniting
here can be illustrated by the bridge that makes the
environment (banks, stream, and landscape) into a unified
whole.
According to Fry [6], “The thingly character of the thing
does not consist in its being a represented object, nor can it be
defined in any way in terms of the objectness, the over-
againstness, of the object.” “Things” are irreducible to
“objects” [7], and the two notions are “incommensurable” [8].
The notions of thing and thinging play an important role in
modeling contending with the salience of the widely acclaimed
significance of the word object, the term currently in vogue
among most software engineers.
In computer science, interest in things and thing-orientation
[9] dates back to ThingLab (1979) and Self (1987), the
programming languages. More recently, Water, a prototype-
based language, has linked every XML tag with its top-level
ancestor, a “Thing”. Imbusch et al. [9] noted that “Thing-
oriented programming is the art of creating software composed
of Things.”
This article is about modeling thinging. Additionally, this
paper unpacks philosophical issues that inform the world of
computing.
Philosophers attempt to find the essential or deeper meanings
of . . . words that refer to important concepts that we use to
guide us in making important decisions . . . [and] to a large
extent, is to organize these meanings into coherent
frameworks that help us make sense out of the world around
us. [10]
That being said, a similar value is attached to the potential
insights from recognizing the capacity of computers and
information technology to shed new light on philosophical
issues and pose questions that cannot readily be approached
within traditional philosophical frameworks [11].
Specifically, this paper discusses the ontological status of
objects and related notions, such as processes and events. Many
research works use the term entity, but “there is little, in the
texts, to differentiate between entities and objects” [12]. Most
of the time, an entity is defined in terms of a thing (e.g., in
Chen’s [13] description of an entity, it is a thing that can be
distinctly identified).
The substantive discussion is based on the conception of an
(abstract) machine (an assemblage) named the Thinging
Machine (TM), which has been used in several research works
International Journal of Computer Science and Information Security (IJCSIS),
Vol. 16, No. 7, July 2018
21 https://sites.google.com/site/ijcsis/
ISSN 1947-5500](https://image.slidesharecdn.com/journalofcomputerscienceijcsisjuly2018fullvolume-180915043348/75/Journal-of-computer-science-ijcsis-july-2018-full-volume-35-2048.jpg)
![[14-23]. The main motivation is to justify adopting a
terminology that relies more on the notion of things than it does
on objects, particularly in the context of the TM.
B. What Is an Object?
In the object-orientation literature, an object is described in
terms of having an identity, state, behavior, and properties, as
well as a specified set of operations. Objects, here, include
virtual objects (e.g., a web page), ordinary physical objects,
(e.g., a building), and institutional entities [24] (e.g., the act of
buying). “The world being modelled is made up of objects . . .
objects are just there for the picking!” [25]. “Identifying objects
is pretty easy to do. Start out by focusing on the problem at
hand and ask yourself ‘what are the things [italics mine] in this
problem?’” [26]. Objects have a dual nature that turns on their
two sets of properties: functional properties and structural
properties [27]. Functional properties are related to what an
object does (e.g., a car is used for transportation) and its
structural properties pertain to its physical makeup (e.g., the car
is red and has white seats) [28].
In object-oriented analysis and design, an object models some
unity [italics mine] that exists in physical or conceptual space,
or some new unity [italics mine] that could be realized in the
physical space because someone has thought it out. [12]
Many descriptions of objects may oftentimes include
examples of relevant things that fit into an object’s category
[9]. According to Maciaszek [29], “an object is an instance of a
‘thing’,” and “a generic description of a ‘thing’ is called a
class.” All the objects common to everyday life, such as paper
clips, tablets, and dog collars, are intentionally produced things
[28]. Interestingly, in image analysis studies, an object is
defined as “a set of regions located near the center of the
image, which has significant color distribution compared with
its surrounding (or background) region” [30]. Thus, an empty
beach at sunset, with red sky, blue sea, and gray sand, has no
object but certainly is a (beautiful) thing.
According to Atkins [31], to objectify a thing is to reduce it,
to break it down into increasingly smaller parts instead of
taking it holistically as it is. An object consists of its universal
form with shared particular qualities (e.g., its color, shape, size,
and texture are accidental or unnecessary).
What separates an object from any ordinary “thing” is its
phenomena of perception as conjured by a subject. Thus,
objects are entities that a subject projects desire and
necessity, supporting the theory of objectivity and
establishing objecthood. [32]
C. What Is a Thing?
According to Edwards [33], a thing is surely among the
most colorless of English words. Almost anything can be
labeled with the word thing—a word that seems simultaneously
essential and empty—and is essential because of its very
emptiness. Thing is “a banal term we use for designating what
is out there, unquestionably . . . what lies out of any dispute,
out of language” [3].
Heidegger [5] distinguished between objects and things:
“The handmade jug can be a thing, while the industrially made
can of Coke remains an object” [3]. For Heidegger [5], things
have unique “thingy Qualities” [3] that are related to reality and
therefore not typically found in industrially generated objects.
According to Heidegger [5], a thing is self-sustained, self-
supporting, or independent—something that stands on its own.
The condition of being self-supporting transpires by means of
producing the thing.
The TM, which is based on the concept of thinging, is an
abstract machine that creates, processes, and exchanges things.
Although, as noted above, several works have described the
TM, the following section provides an interpretation of it from
a novel perspective.
II. THINGING MACHINE
Thinging signifies the following:
Forming, molding, shaping, and refining the “clay-like stuff”
of reality to generate things: diverse pieces have their own
identities and different compositions, in terms of parts and
wholes. The resultant (so-called mereological) universe
consists of conceptualized things that we refer to as
components of a system.
The flow of these things in terms of five stages: creation,
processing, receiving, transferring, and releasing. “Not only
do things exist in the world, but stuff happens to them, There
are occurrences. There is movement” [31].
Thinging, from our perspective—which deviates from the
Heideggerrian thought—is a thing forming itself in the world
as a machine. A thinging machine (this term is taken from [34])
generates and handles the thing and its constituent subthings
(e.g., an object is a machine and its qualities are submachines).
The machine (human and non-human) can craft things.
Accordingly, this (abstract) machine is defined in terms of its
functions to create, process (change), receive, release, and
transfer things, as shown in Fig. 1. Additionally, the TM model
utilizes triggering (denoted by a dashed arrow) to establish
connection with other machines that have different type of
things. The machine is the building block of that what things.
A machine that crafts things is itself a thing that is crafted
by other machines. For example, a human being is a machine
that includes sensory and cognitive submachines and so forth;
simultaneously, a human being is a thing in other larger
machines such as social machinery (see Fig. 2). Thus, every
“thing” is a machine (environment/place) of thinging other
things.
Going by the function of a TM, we define a thing as
follows:
A thing (material and immaterial) is what manifests itself in
creation, processing, receiving, releasing, and transferring
stages of a thinging machine.
Figure 1. Thinging machine.
Create
Receive
Transfer
Release
Process
Accept Arrive
Output Input
International Journal of Computer Science and Information Security (IJCSIS),
Vol. 16, No. 7, July 2018
22 https://sites.google.com/site/ijcsis/
ISSN 1947-5500](https://image.slidesharecdn.com/journalofcomputerscienceijcsisjuly2018fullvolume-180915043348/75/Journal-of-computer-science-ijcsis-july-2018-full-volume-36-2048.jpg)
![Examples of things include numbers, time, events, and data.
A TM is the “context” of a thing. For example, according to
Grigg [35], “The rain, of course, must be raining because it can
do nothing else. The ‘rain’ is its ‘raining’, just as a ‘thing’ is its
‘thinging.’” The rain is not to be separated from its context and
made a static “thing”; rather, it is an operating, dynamic
machine (Grigg [35] calls it a PROCESS), through which rain
is created (in the atmosphere), released, and transferred, to be
received by Earth.
Accordingly, instead of “the thing things”, in a TM, we
have five kinds of thingings: the thing emerges, changes,
arrives, transfers, and waits (for departure). Thinging is the
emergence, changing, arriving, departing, and transferring of
things. Heidegger’s fourfold concerns the creation type of
thing.
Heidegger’s notion of thinging has influenced thinking in
many scientific fields (e.g., design thinking [36], information
services [37], and organization/management studies [38]). The
utilization of thinging in this paper is not about the
philosophical issues related to the ontology of things and their
nature; rather, it concerns the representation of things in
software engineering modeling. This representation is utilized
in documentation and in the early phases of building software
systems.
In several papers submitted to software engineering
journals and conferences, some referees rejected the use of the
term thing. According to one referee, “the system is badly
described and many terms are not well defined (e.g., ‘thing’).”
Another referee stated:
“Things can be concepts, actions, or information.” This is a
very fuzzy explanation. First of all, concepts are independent
of space and time, though things are closely related to
processes, which are in space and time.
However, the sentence “Things can be concepts, actions, or
information” furnishes examples of what can be created,
processed, received, released, and transferred. For instance, a
concept is created, or generated, in the brain; it is processed to
create a corresponding proposition; it is received by a listener
or reader after being embedded into a speech; it is released in
the form of a linguistic expression; and it is transferred from
one person to another.
According to Malafouris [39], we are creative “thingers” in
the sense that “We make new things that scaffold the ecology
of our minds, shape the boundaries of our thinking and form
new ways to engage and make sense of the world.” The
aforementioned referees’ comments show little appreciation for
thinging and the issue of “defining boundaries around portions
of reality” [4] or a significant disregard to the difficulty of
defining the problem of what a thing is. This is an important
aspect to consider with regard to the TM. Lacking a clear
description of the most basic term in the model would
undermine the potential viability of judging its research value.
We claim that the definition—a thing is what can be created,
processed, received, released, and transferred—is of some
worth in making the term more well-defined and less fuzzy.
Malfouris [39] explains:
The notion of thinging seeks to encapsulate the major
phenomenological ingredients . . . , shifting our attention
away from the sphere of isolated and fixed categories
(objects, artefacts, etc.) to the sphere of the fluid and
relational transactions . . . [39]
Current approaches to things are somewhat limited in
comparison to TM. Heidegger [5] emphasized only the
ontological thinging of a thing (producing [5] – creation in
the TM) in response to “what is – ness”. Heidegger’s “thing”
is the name we give to a discrete yet unspecifiable entity [7].
The TM’s definition of thing broadens its characterization by
including other secondary aspects: process-ness, receive-
ness, transfer-ness, and release-ness. All four features form
possible “thingy Qualities” [3] after production (creation). In
a TM, “things” take the characteristics of “objects” as
discrete specifiable entities.
A thing that has been created refers to a thing that has been
born, is acknowledged, exists, appears, and emerges as a
separate item in reality and with respect to other things. A
black swan was acknowledged as a metaphor based on a pre-
1697 observation that all swans are white. In this case, a black
swan was created as a metaphorical thing before 1697. This
metaphor was processed and communicated among people at
that time. It is the black swan machine. In 1697, a black swan
was created in the sphere of knowledge by the appearance of
the physical thing. The black swan machine is now a machine
that consists of the metaphor and the bird. Note that a thing is a
machine and vice versa. A factory can be a thing that is
constructed and inspected as well as a machine that receives
other things (e.g., materials) to create products. A factory is a
thing when it processed (e.g., created), and it is a machine
when it is processing things (e.g., creating products).
Is there a thing in a machine—or world—that is not
created? Here, creation may refer to physical things (e.g., the
sky or an animal), social things (e.g., a society or a
celebration), mental things, (e.g., a thought, a feeling, or
literature), and nonphysical things (e.g., music). Note that some
machines are only processors, receivers, releasers, and/or
transferors of a thing. Thus, processing, receiving, releasing,
and transferring are important in defining a thing in a
noncreating machine.
It is clear why we have opted to use the term thing instead
of object, which, in Heidegger’s [5] view, is a manufactured
thing, such as a computational artifact (e.g., computer-oriented,
Create
Receive
Transfe
r
Releas
e
Process
Accept Arrive
Output Input
Figure 2. A human being is a thing and a machine.
Create
Receive
Transfer
Release
Process
Accept
Arrive
Output Input
International Journal of Computer Science and Information Security (IJCSIS),
Vol. 16, No. 7, July 2018
23 https://sites.google.com/site/ijcsis/
ISSN 1947-5500](https://image.slidesharecdn.com/journalofcomputerscienceijcsisjuly2018fullvolume-180915043348/75/Journal-of-computer-science-ijcsis-july-2018-full-volume-37-2048.jpg)
![manufactured data). A thing can be created, processed,
received, released, and/or transferred.
Create a thing means that it comes about and this implies
the possibility of its un-thinging within a machine. A collection
of machines of a thing forms a larger machine. The stomach
machine is a food-processing machine in the digestive
machine. The digestive system is one machine in the human
being machine, with respect to the thing, food, which is
digested (processed) to create waste. A human being is a thing
in a school machine.
Processing indicates a type of change that a machine
performs on a thing without turning it into a new thing (e.g., a
car is processed when its color is changed).
Receiving is the flow of a thing to a machine from an
outside machine. Releasing is exporting a thing outside the
machine. It stays as a released thing if the exporting channel is
not available. Transferring is the released thing departing to
outside the machine.
Note that the relevant purpose involves thinging machines
that are relevant for this purpose. After all, a machine is a thing.
For example, in a hospital, a human being includes broken or
nonfunctioning machines or infectious machines (viral or
bacterial machines), and other characteristics used to represent
a human thing (machine).
The world of a TM consists of an arrangement of machines,
wherein each thing has its own unique stream of flow. TM
modeling puts together all of the things/machines required to
assemble a system (a grand machine).
The example below illustrates these concepts in terms of
the software engineering sphere.
III. EXAMPLE
Deitel and Deitel’s book C++ How to Program [40] gives
an object-oriented program that uses the class Time:
Functions:
void setTime(int, int, int); // set hour, minute, second
void printUniversal(); // print universal-time format
void printStandard(); // print standard-time format
The attributes: int hour, int minute, and int second.
The main program includes such statements as:
Time t; // instantiate object t of class Time
t.printUniversal(); // 00:00:00
t.printStandard(); // 12:00:00 AM
t.setTime(13, 27, 6); // change time
Fig. 3 shows the TM’s static (independent of time)
representation of this program. Note that in the following
discussion Time denotes the class Time, while time denotes the
notion of time as generally understood and used.
In the figure, the Time machine (circle 1) includes the hour
(2), minute (3), and second (4) submachines. All Time
submachines are fed by the integer machine (5). When an
integer is created, it is processed to verify its constraints (e.g.,
the second must be is between 0 and 60). The created Time
thing (instance) is processed (6 and 7) in the Time machine to
either convert it to the standard or universal format, after which
it will flow (8) to the printer to be printed (9).
Fig. 3 represents the program’s static description, which we
call the machine. To specify the behavior of the C++ program’s
execution, we identify different possible events and their
chronologies.
An event is a machine in a TM that contains at least three
submachines: the time, the region, and the event itself. The
region is where the event takes place or site of its unfolding.
We can bring here Heidegger’s notion of gathering, in the
sense that the event brings into presence the value
(meaningfulness) of the region that was previously hidden.
Thus, the event (as a machine) emerges as a thing by gathering
(enclosing) the time and region (and other things). Such
dwelling (Heidegger’s term) can be applied to all phases of the
TM modeling, but we want to emphasize engineering here, not
philosophical thought.
Fig. 4 shows the representation of the event: Create the
constructor of the class Time. It includes the three machines:
the region of the event (circle 1), which is a subdiagram of Fig.
3; the (real) time submachine (2); and the event submachine
itself (3).
Create
Create
Hour
Minute
Second
Create
Receive
Receive
Receive
Time
Create
Integer
Release
Release
Release
zero
zero
zero
Process: convert
to universal
Process: convert
to Standard Process:
print
TransferProcess Transfer
TransferProcess
Process Transfer
Printer
Transfer
Transfer
Release Transfer Transfer Receive
1
2
3
4
5
6
7
8
9
Figure 3. The TM representation of the class Time.
Create Process
Hour
Minute
Second
Create
Receive
Receive
Receive
Time
Integer
Release
Release
Release
zero
zero
zero
TransferTransfer
Transfer
TransferTransfer
Region
Transfer
Transfer TransferReleaseProcessReceive
Time
Event itself
Figure 4. The event creating the constructor.
Event: Create the constructor of the class Time
1
2
3
4
5
International Journal of Computer Science and Information Security (IJCSIS),
Vol. 16, No. 7, July 2018
24 https://sites.google.com/site/ijcsis/
ISSN 1947-5500](https://image.slidesharecdn.com/journalofcomputerscienceijcsisjuly2018fullvolume-180915043348/75/Journal-of-computer-science-ijcsis-july-2018-full-volume-38-2048.jpg)
![Note that, in general, an event may have other features, such as
its intensity. In the figure, the processing of time (4) reflects the
consumption of time, whereas the processing of the event (5)
indicates that the event is taking its course. For the sake of
simplification, we will represent an event only by its region.
Accordingly, we identify the following four events:
Event 1 (E1): Create the constructor of the class Time (Fig. 4);
Event 2 (E2): Set Time (Fig. 5);
Event 3 (E3): Print Time in standard form (Fig. 6); and
Event 4 (E4): Print Time in universal form (Fig. 7).
Fig. 8 shows the chronology of execution of these events. Fig.
9 represents the execution of Deitel and Deitel’s program [40].
In philosophical language, this chronology of events is an
ordering setting-up, through which “enframing” (gathering
things/machines together) is applied to all submachines to
enable the program machine to “reveal” itself.
IV. PROCESS VERSUS MACHINE
What is the difference between a machine and a
PROCESS? The term PROCESS, written in capital letters to
avoid confusion with Process (change) in the TM machine,
denotes what is typically defined as a sequence of operations
that transforms input into output. According to Tanaka [41],
PROCESS is “a collection of steps taking place in a prescribed
manner and leading to an objective.”
A. An Example from the PROCESS Specification Language
In the PROCESS specification language (PSL), a standard
exchange language for PROCESSing information in the
manufacturing industry [42-43]. “Most PROCESS models
support the notions of input and output, which are data or
objects provided to a behavior execution before it starts, and
data produced when it finishes, respectively” [44].
Bock and Gruninger [44] use Fig. 10 to show an example of
a PROCESS change in a car’s color using one of the UML 2
notations for object flow. According to Bock and Gruninger
[44],
[The figure] is ambiguous not because it is graphical,
textual languages have the same problem, but because it is
specifying execution with constructs that only implicitly
refer to runtime, rather than explicitly. For example, the
nodes labeled ChangeColor, Paint, and Dry will be executed
many times in many situations, and the diagram does not
clarify which executions are referred to, or how the
graphical nesting and arcs constrain them.
In addition, Bock and Gruninger [44] use Fig. 11, called the
occurrence tree, to demonstrate a runtime execution of an
activity: “It has no analog in UML, because UML does not
have a direct model of runtime execution yet” [44].
Create
Create
Hour
Minute
Second
Create
Receive
Receive
Receive
Time
Transfer
Integer
Release
Release
Release
TransferProcess Transfer
TransferProcess
Process TransferTransfer
Transfer
2
3
4
Figure 5. The setting of Time.
Time
Process: convert
to universal
Process:
print
Printer
Release Transfer Transfer Receive
Figure 6. The event Print Time in standard form.
Time
Process: convert
to Standard
Process:
print
Printer
Release Transfer
Transfer Receive
Figure 7. The event Print Time in universal form.
E1
E2
E3 E4
Figure 8. Chronology of the execution.
int main(){
Time t;
t.printUniversal();
t.printStandard();
t.setTime( 13, 27, 6 );
t.printUniversal();
t.printStandard();
t.setTime( 99, 99, 99 );
t.printUniversal();
t.printStandard();
return 0; }
E1
E2
E3
E4
E4
E3
E2
E4
E3
Figure 9. A sample C++ program and its events.
ChangeColor
Color Dry
Figure 10. Example UML 2 (redrawn from Bock and Gruninger [44]).
Paint
Dry
Figure 11. PSL occurrence tree (partially redrawn from Bock and
Gruninger [44]).
International Journal of Computer Science and Information Security (IJCSIS),
Vol. 16, No. 7, July 2018
25 https://sites.google.com/site/ijcsis/
ISSN 1947-5500](https://image.slidesharecdn.com/journalofcomputerscienceijcsisjuly2018fullvolume-180915043348/75/Journal-of-computer-science-ijcsis-july-2018-full-volume-39-2048.jpg)
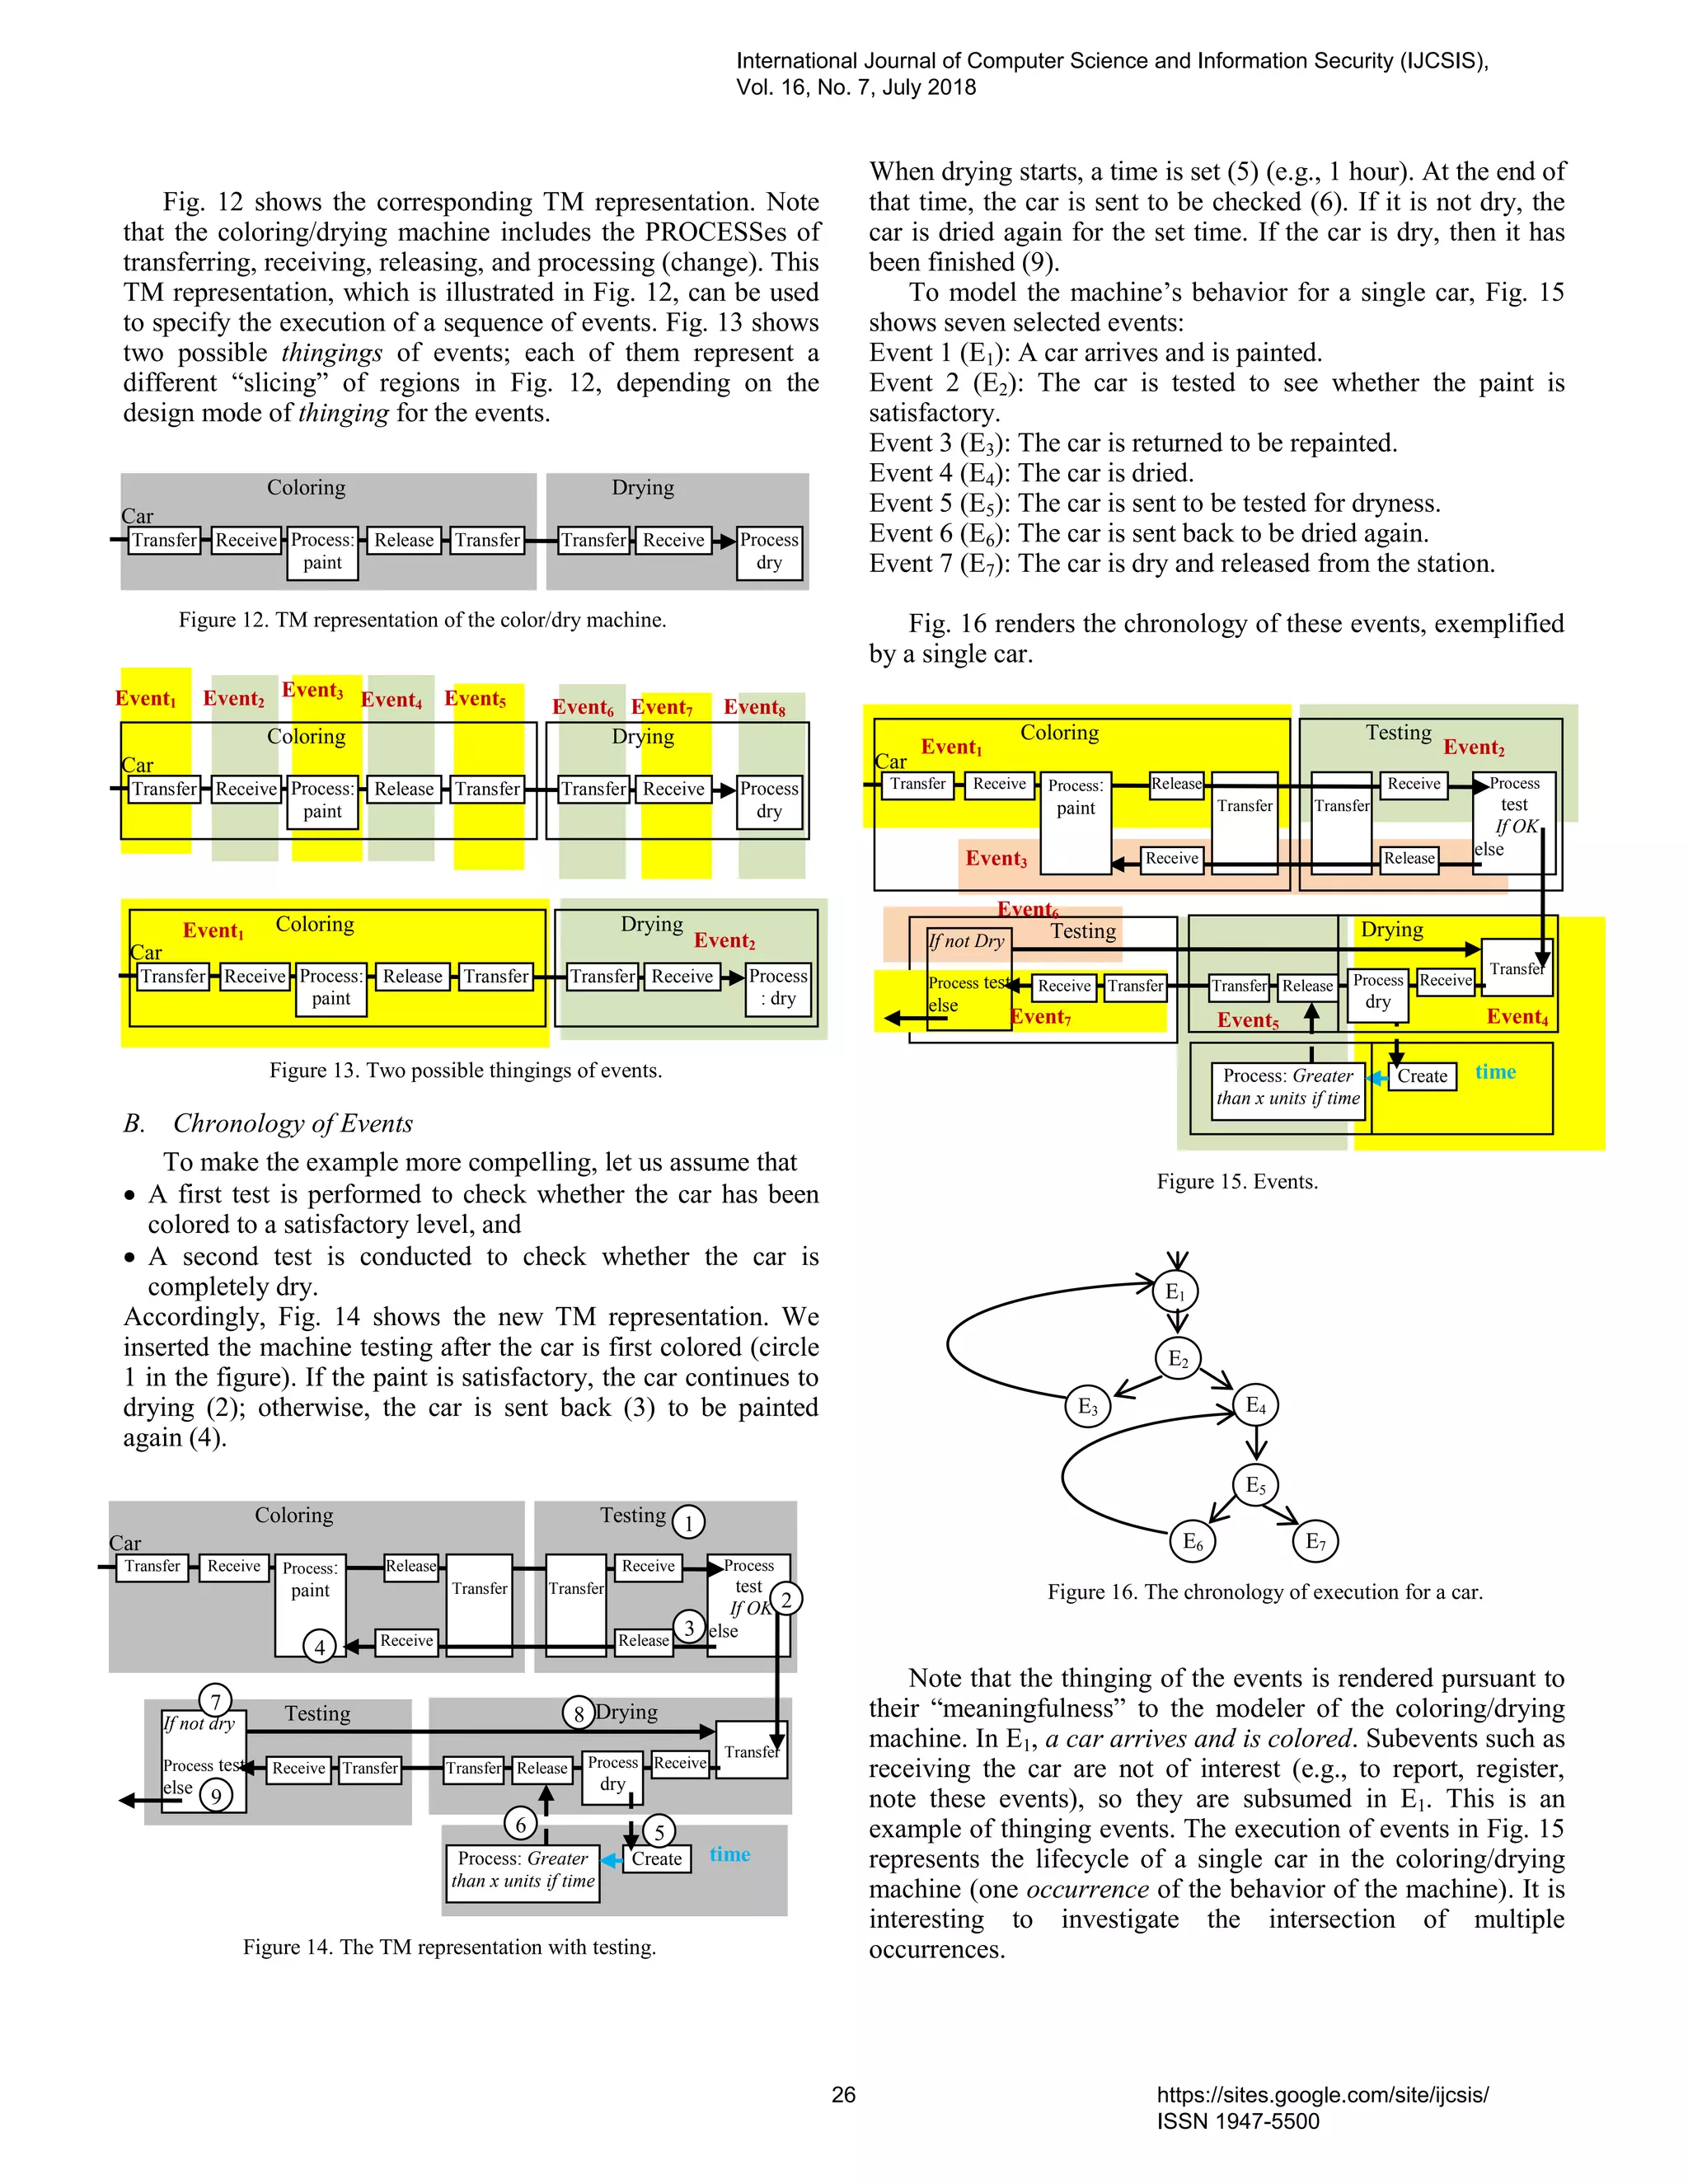
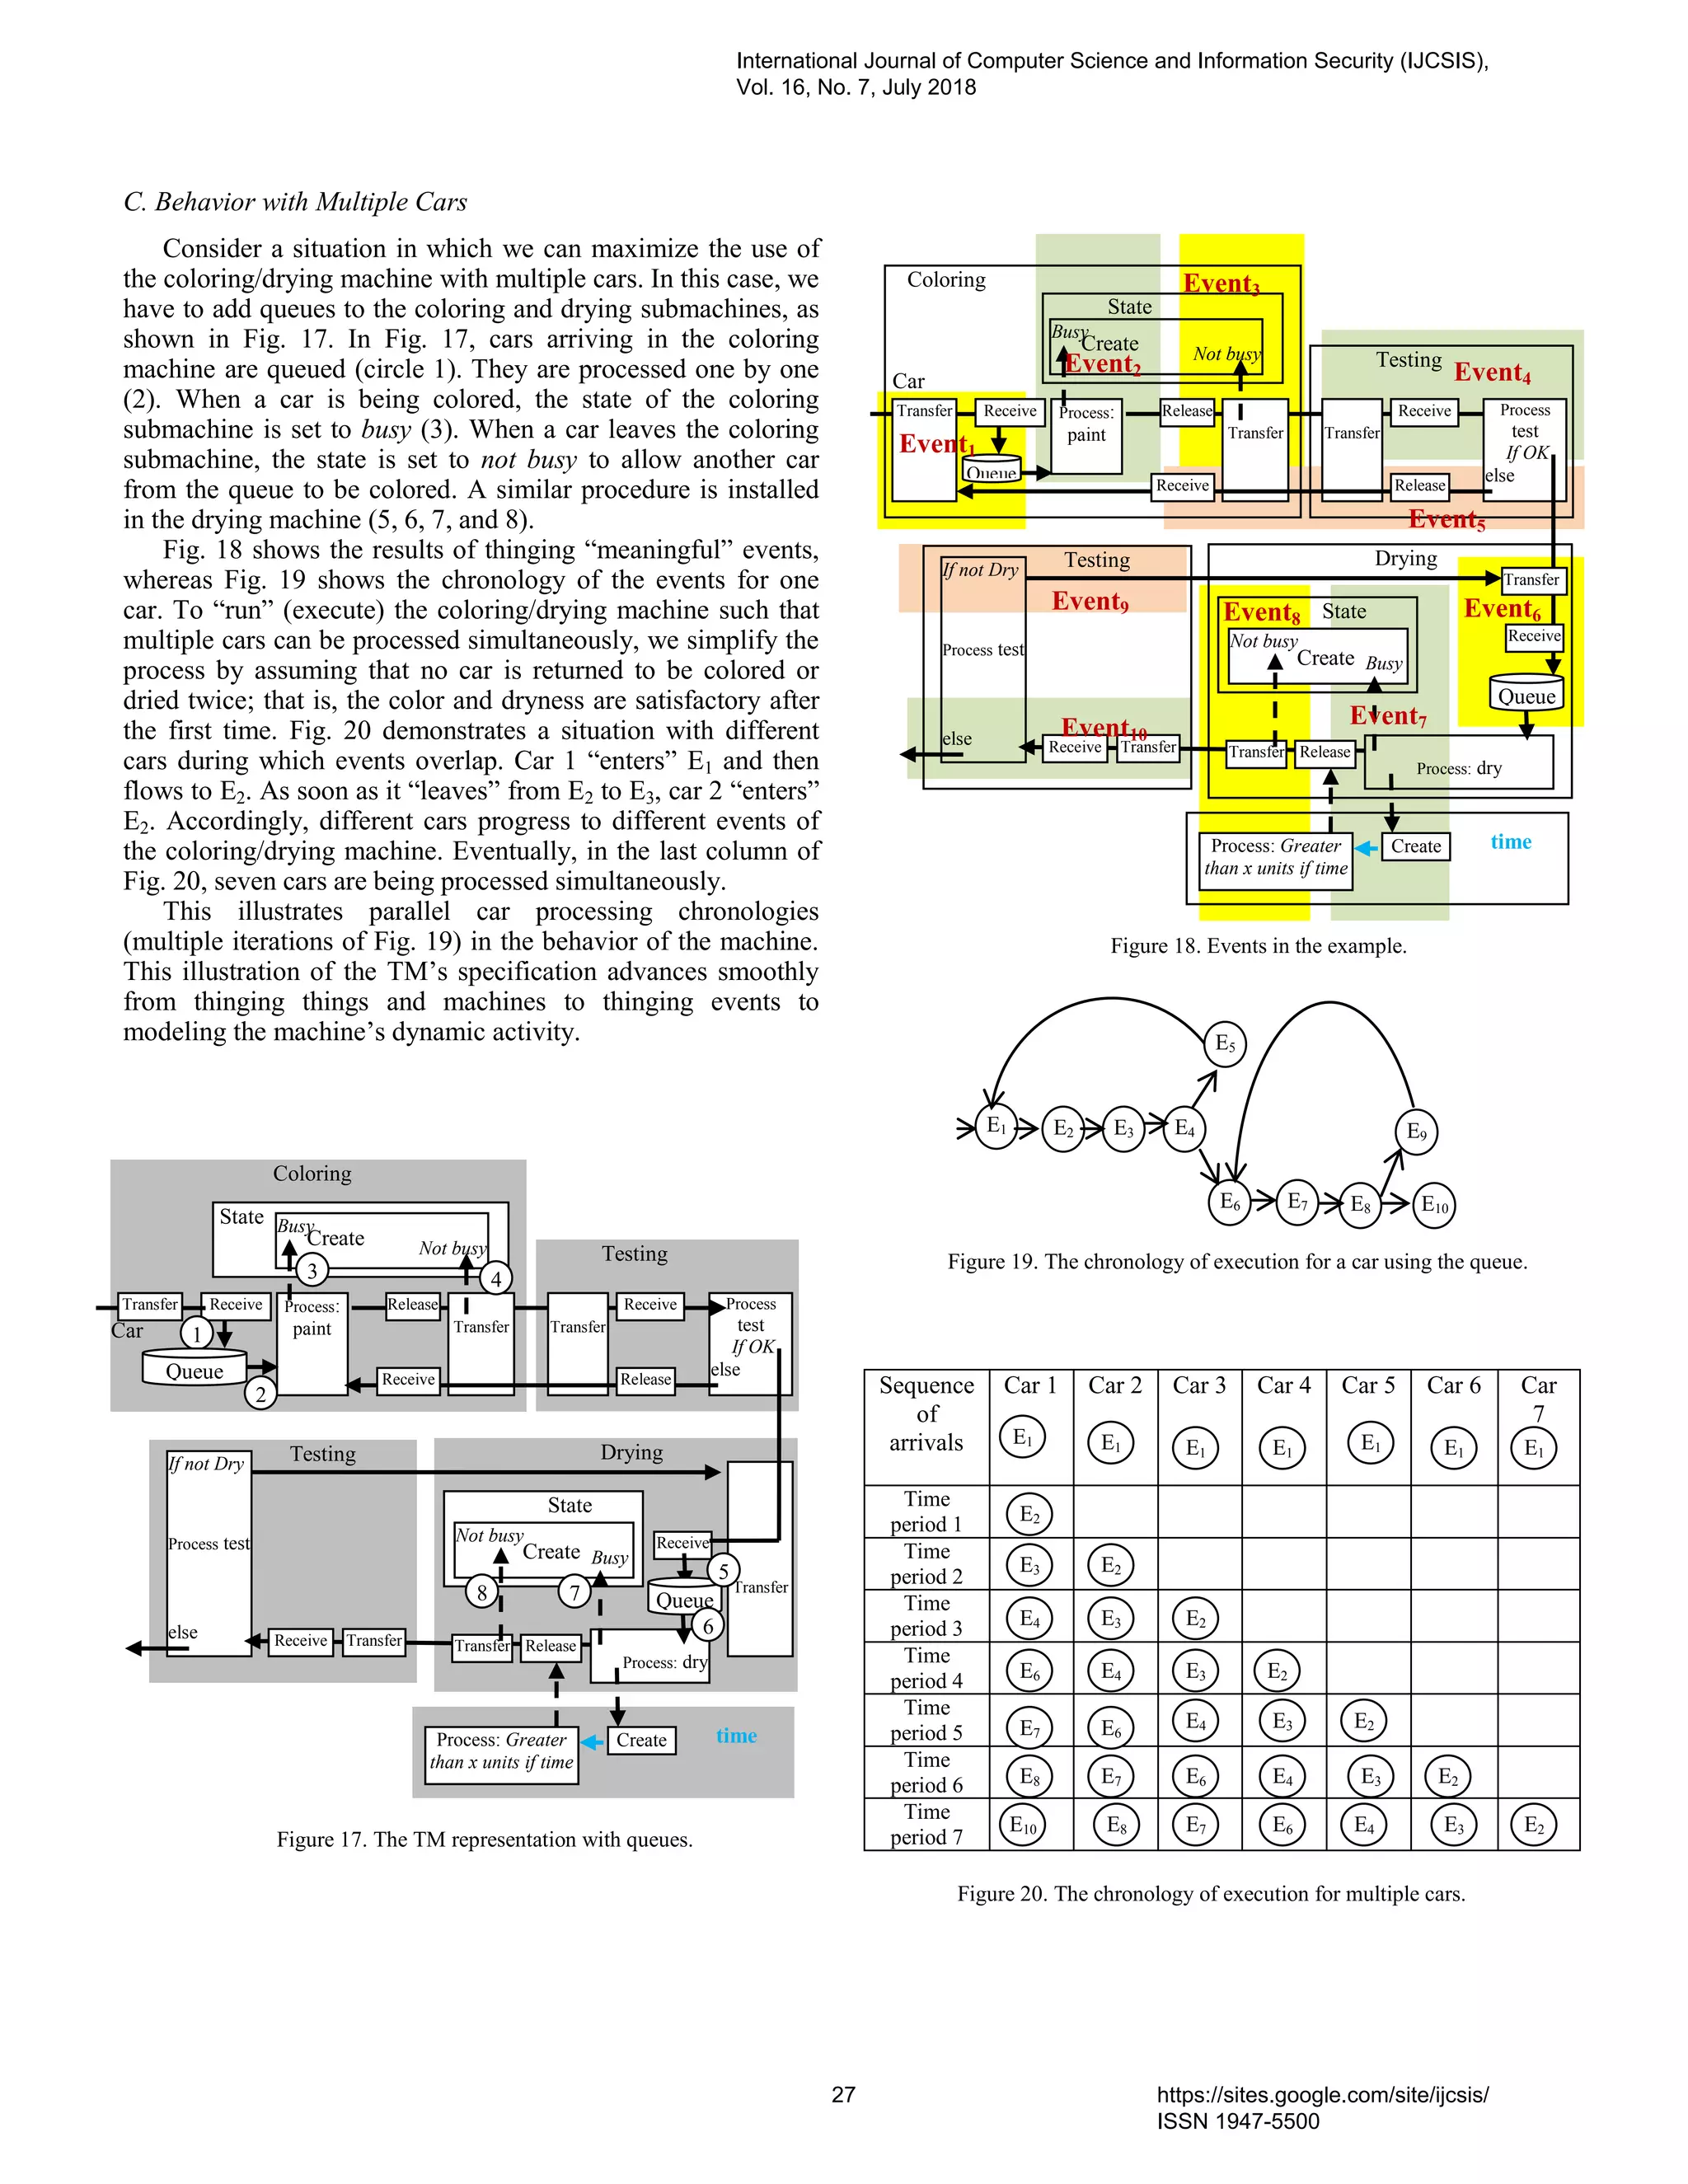
![V. THINGING AND EVENTING
The previous section stated that an event in the TM
includes at least three submachines: the time, region, and event
itself. According to Heidegger [5], “the particularity of things
seems to depend completely on their space and time” [44].
Space in the TM is called the region of the event, as shown in
the previous examples. From this perspective, TM events are of
sources that generate particularities. If we focus on the space
aspect of regions in events, we find that it is a logical space:
Even if we break a thing to get to the space “inside” we find
external relations between its parts, bits, and pieces. Space
seems to be not really “in” the thing but only the
“possibility” of arrangements of its parts (in, out, next to,
etc.). [44]
For Heidegger [5], time and space are the realms in which
things can be given. Edwards [33] expands, “They stabilize the
flow of sentience; they make it into something. They bring it to
a lasting stand”. In TM events, time and space even out the
flow of things (e.g., in the Time class example, the three flows
of integers [hour, minute, and second] reach their destination to
create a particular time [thing]). Analogous to analyzing a
connection between a subject and a predicate [44], the TM
conceptualizes a connection between a machine (system) and
an event (region/time diagram). In the context of the machine,
the region diagram expresses itself as a situation in which
facets of itself are stated and in which something (the creation)
is asserted about the thing. (The last two sentences express an
alternative account of Gendlin’s [44] description of a
connection between a thing and a human being.)
VI. CONCLUSION
This paper has presented the term thing and showed that
this specific term and the general term thinging are valued
notions that play an important role in the need to distinguish
separable entities in software engineering modeling.
Additionally, the paper attempted to answer the question, what
is a thing, object, or process? As a result, this may raise the
issue of thinging in software engineering.
An (abstract) TM is reintroduced and proposed as a
foundation for the clarification of these notions.
The substance of this paper suggests that thinging should be
more meaningfully emphasized as a research and teaching
topic, at least in the requirement analysis phase of the software
development cycle. According to Umans [45], “the quest for
knowledge is not a quest for truth but a challenge to understand
the processes of thinging.”
REFERENCES
[1] W. V. Siricharoen, “Ontologies and object models in object oriented
software engineering,” IAENG Int. J. of Com. Sci., vol. 33, issue 1,
2007. www.iaeng.org/IJCS/issues_v33/issue_1/IJCS_33_1_4.pdf
[2] B. Rettler and A. Bailey, “Object,” October 26, 2017, Stanford Encycl.
of Phil.
[3] B. Latour, “Why has critique run out of steam?” in Critical Inquiry, vol.
30, Winter 2004.
[4] J. Carreira, “Philosophy is not a luxury,” [blog], March 2, 2011,
https://philosophyisnotaluxury.com/2011/03/02/to-thing-a-new-verb/
[5] M. Heidegger, “The thing,” in Poetry, Language, Thought, A.
Hofstadter, Trans. New York: Harper & Row, 1975, pp. 161–184.
[6] T. Fry, “‘Object-thing philosophy’ and design: Review of B. Latour and
P. Weibel making things public; G. Harman tool-being and guerrilla
metaphysics; Peter-Paul Verbeek what things do,” Design Philosophy
Papers, vol. 4, issue 1, 2006, pp. 21–39.
http://dx.doi.org/10.2752/144871306X13966268131316
[7] A-S. Klemp McLeod, Personal Effects and Vital Matters: Property and
Personhood in Eighteenth-Century Satiric Fiction. Københavns
Universitet, Det Humanistiske Fakultet, 2015.
[8] Y. Cho, “Politics of tranquility: Religious mobilities and material
engagements of Tibetan Buddhist nuns in post-Mao China,” Ph.D.
dissertation, Department of Cultural Anthropology, Duke University,
2015.
[9] O. Imbusch, F. Langhammer, and G. von Walter, “Ercatons: Thing-
oriented programming,” 5th Annual International Conference on Object-
Oriented and Internet-Based Technologies, Concepts, and Applications
for a Networked World, Net.ObjectDays 2004, Erfurt, Germany,
September 27–30, 2004. DOI:10.1007/978-3-540-30196-7_16
[10] J. M. Artz, “The ghost of Socrates: Exploring philosophical issues in
information systems,” unpublished, 2010.
http://www.academia.edu/34450599/The_Ghost_of_Socrates_The_Ghos
t_of_Socrates_Exploring_Philosophical_Issues_in_Information_Systems
_The_Ghost_of_Socrates
[11] P. Brey and J. H. Søraker, “Philosophy of computing and information
technology,” in Philosophy of Technology and Engineering Sciences, 1st
ed., A. Meijers, Ed., North Holland, 2009. eBook ISBN:
9780080930749.
https://pdfs.semanticscholar.org/9573/e4e10c786de69fac32b80b03f164a
9c27f44.pdf
[12] H. Campbell, “A critical evaluation of object-oriented analysis and
design methods with a special focus on object formulation,” master’s
thesis, University of Central Lancashire, May 2001.
http://www.google.com/url?sa=t&rct=j&q=&esrc=s&source=web&cd=9
&cad=rja&uact=8&ved=0ahUKEwiS2IHS-
OfbAhVpIJoKHUXMDL4QFghjMAg&url=http%3A%2F%2Fclok.ucla
n.ac.uk%2F9272%2F1%2FHelen%2520Campbell%2520May01%2520a
%2520critical%2520evaluation%2520of%2520object-
orientated%2520analysis%2520and%2520design%2520methods%2520
with%2520a%2520special%2520focus%2520on%2520object%2520for
mation%2520%2520Master%2520of%2520Phlosophy%2520unpublishe
d1.pdf&usg=AOvVaw29NUqkkji8QNqWfvBa1Lbu
[13] P. P.-S. Chen, Ed. The Entity-Relationship Model: Towards a Unified
View of Data. Readings in Database Systems (1994), Morgan
Kaufmann, 1976.
[14] S. Al-Fedaghi and H. Alahmad, “Process description, behavior, and
control,” Int. J. Com. Sci. and Inf. Sec., vol. 15, no. 7, August 2017.
[15] S. Al-Fedaghi, “Thinking in terms of flow in design of software
systems,” 2017 Second International Conference on Design Engineering
and Science (ICDES 2017), Kortrijk, Belgium, February 24–26, 2017.
[16] S. Al-Fedaghi, “How to create things: Conceptual modeling and
philosophy,” Int. J. Com. Sci. and Inf. Sec., vol. 15, no. 6, June 2017.
[17] S. Al-Fedaghi, “Flow-base provenance,” Informing Sci., vol. 20, 2017.
[18] S. Al-Fedaghi, “Software engineering modeling applied to English verb
classification (and poetry),” Int. J. Com. Sci. and Inf. Sec., vol. 15, no.
10, Oct. 2017.
[19] S. Al-Fedaghi, “Diagrammatic exploration of some concepts in
linguistics,” Int. J. Com. Sci. and Inf. Sec., vol. 15, no. 5, May 2017.
[20] S. Al-Fedaghi, “Toward a philosophy of data for database systems
design,” Int. J. Database Theory and Application, vol. 9, no. 10, 2016.
[21] S. Al-Fedaghi, “Function-behavior-structure model of design: An
altenative approach,” Int. J. Adv. Com. Sci. and Applications, vol. 7,
issue 7, 2016.
[22] S. Al-Fedaghi and M. Almutairy, “Applying thing-oriented modeling
and patterns,” Int. J. Software Eng. and Its Appl., vol. 10, no. 4, 2016,
pp. 143–160.
International Journal of Computer Science and Information Security (IJCSIS),
Vol. 16, No. 7, July 2018
28 https://sites.google.com/site/ijcsis/
ISSN 1947-5500](https://image.slidesharecdn.com/journalofcomputerscienceijcsisjuly2018fullvolume-180915043348/75/Journal-of-computer-science-ijcsis-july-2018-full-volume-42-2048.jpg)
![[23] S. Al-Fedaghi, “Philosophy made (partially) structured for computer
scientists and engineers,” Int. J. u- and e- Service, Sci. and Tech., vol. 9,
no. 8, 2016.
[24] J. Searle, The Construction of Social Reality. MIT Press, 1995.
[25] B. Meyer, Obiect-Oriented Software Construction. New York: Prentice
Hall, 1988.
[26] S. Shlaer and S. Mellor, Object Oriented Systems Analysis: Modelling
the World in Data. Prentice Hall, 1988.
[27] A. Thomasson, “Artifacts and human concepts,” in Creations of the
Mind: Essays on Artifacts and Their Representations, E. Margolis and S.
Laurence, Eds. Oxford: Oxford University Press, 2007.
[28] “The philosophy of computer science,” in The Stanford Encyclopedia of
Philosophy, 2017. https://plato.stanford.edu/entries/computer-science/
[29] L. A. Maciaszek, Requirements Analysis and Systems Design, 2nd ed.
Harlow: Pearson Education Limited, 2004.
[30] S. Kim, S. Park, and M. Kim, “Image classification into object/non-
object classes,” in CIVR 2004, LNCS 3115, P. Enser et al., Eds. City,
2004, pp. 393–400.
[31] C. Atkins, “Of worlds and things,” Neologikon [blog], June 25, 2018.
https://neologikonblog.wordpress.com/tag/heidegger-on-things
[32] L. Constantine, “What is perception? Our relationship with new media
objects,” Leah Constantine [blog].
https://leahconstantine.net/perception-relationship-new-media-objects/
[33] J. C. Edwards, “The thinging of the thing: The ethic of conditionality in
Heidegger's later work,” in A Companion to Heidegger, H. L. Dreyfus
and M. A. Wrathall, Eds. lackwell Publishing, 2004. eISBN:
9781405110921
[34] T. Winograd, “Thinging machines: Can there be? Are we?” in The
Boundaries of Humanity Humans, Animals, Machines, J. J. Sheehan and
M. Sosna, Eds. Berkeley: University of California Press, 1991.
http://ark.cdlib.org/ark:/13030/ft338nb20q/
[35] R. Grigg, “‘Thinging’ and the verb ‘to thing,’” Speak to the Wild [blog],
10 March 2015. https://www.speaktothewild.org/2015/03/thinging-and-
the-verb-to-thing/
[36] E. Bjögvinsson, P. Ehn, P.-A. Hillgren, “Design things and design
thinking: Contemporary participatory design challenges,” DesignIssues,
vol. 28, no. 3, Summer 2012.
[37] W. Pieters, Ethics and Information Technology, vol. 15, Issue 3,
September 2013, pp. 195–208.
[38] K. Skoldberg, “Heidgger and organization: Notes towards a new
research programme,” Scandinavian J. Mgmt., vol. 14, no. 1–2, March–
June 1998, pp. 77–102.
[39] L. Malafouris, “The feeling of and for clay,” Pragmatics & Cognition,
vol. 22, no. 1, pp. 140–158, January 2014. DOI:10.1075/pc.22.1.08mal
[40] P. Deitel and H. Deitel, C++ How to Program, 10th ed., Prentice Hall.
2017.
[41] A. Tanaka, “Usage of business process choreography,” OMG Second
Workshop on Web Services Modeling, Architectures, Infrastructures and
Standard, April 2003.
http://www.omg.org/news/meetings/workshops/Web_Services_USA_M
anual/08-3_Tanaka.pdf
[42] “Introduction and support package: Guidance on the concept and use of
the process approach for management systems,” Document: ISO/TC
176/SC 2/N544R3, October 2008. “Industrial automation systems and
integration – Process specification language – Part 1: Overview and
basic principles,” ISO IS 18629-1, 2004.
[43] C. Bock and M. L. Gruninger, “PSL: A semantic domain for
flowmodels,” Softw. Syst. Model., vol. 4, 2005, pp. 209–231.
DOI:10.1007/s10270-004-0066-x.
[44] E. T. Gendlin, “An analysis of Martin Heidegger’s What is a Thing?” in
M. Heidegger, What Is a Thing?, W. B. Barton and V. Deutsch, Trans.
Chicago: Henry Regnery, 1967, pp. 247–296.
http://www.focusing.org/gendlin/docs/gol_2041.html
[45] L. Umans, On the Edge of Fluidity: International Cooperation in
Turbulent Times, Phd Thesis, Wageningen University, November 2016.
http://www.google.com/url?sa=t&rct=j&q=&esrc=s&source=web&cd=4
0&cad=rja&uact=8&ved=0ahUKEwiIrrbanrHcAhVBBywKHWviADI4
HhAWCFowCQ&url=http%3A%2F%2Fedepot.wur.nl%2F388367&usg
=AOvVaw2pwVst5F9bRBDQDrwftUrZ
International Journal of Computer Science and Information Security (IJCSIS),
Vol. 16, No. 7, July 2018
29 https://sites.google.com/site/ijcsis/
ISSN 1947-5500](https://image.slidesharecdn.com/journalofcomputerscienceijcsisjuly2018fullvolume-180915043348/75/Journal-of-computer-science-ijcsis-july-2018-full-volume-43-2048.jpg)
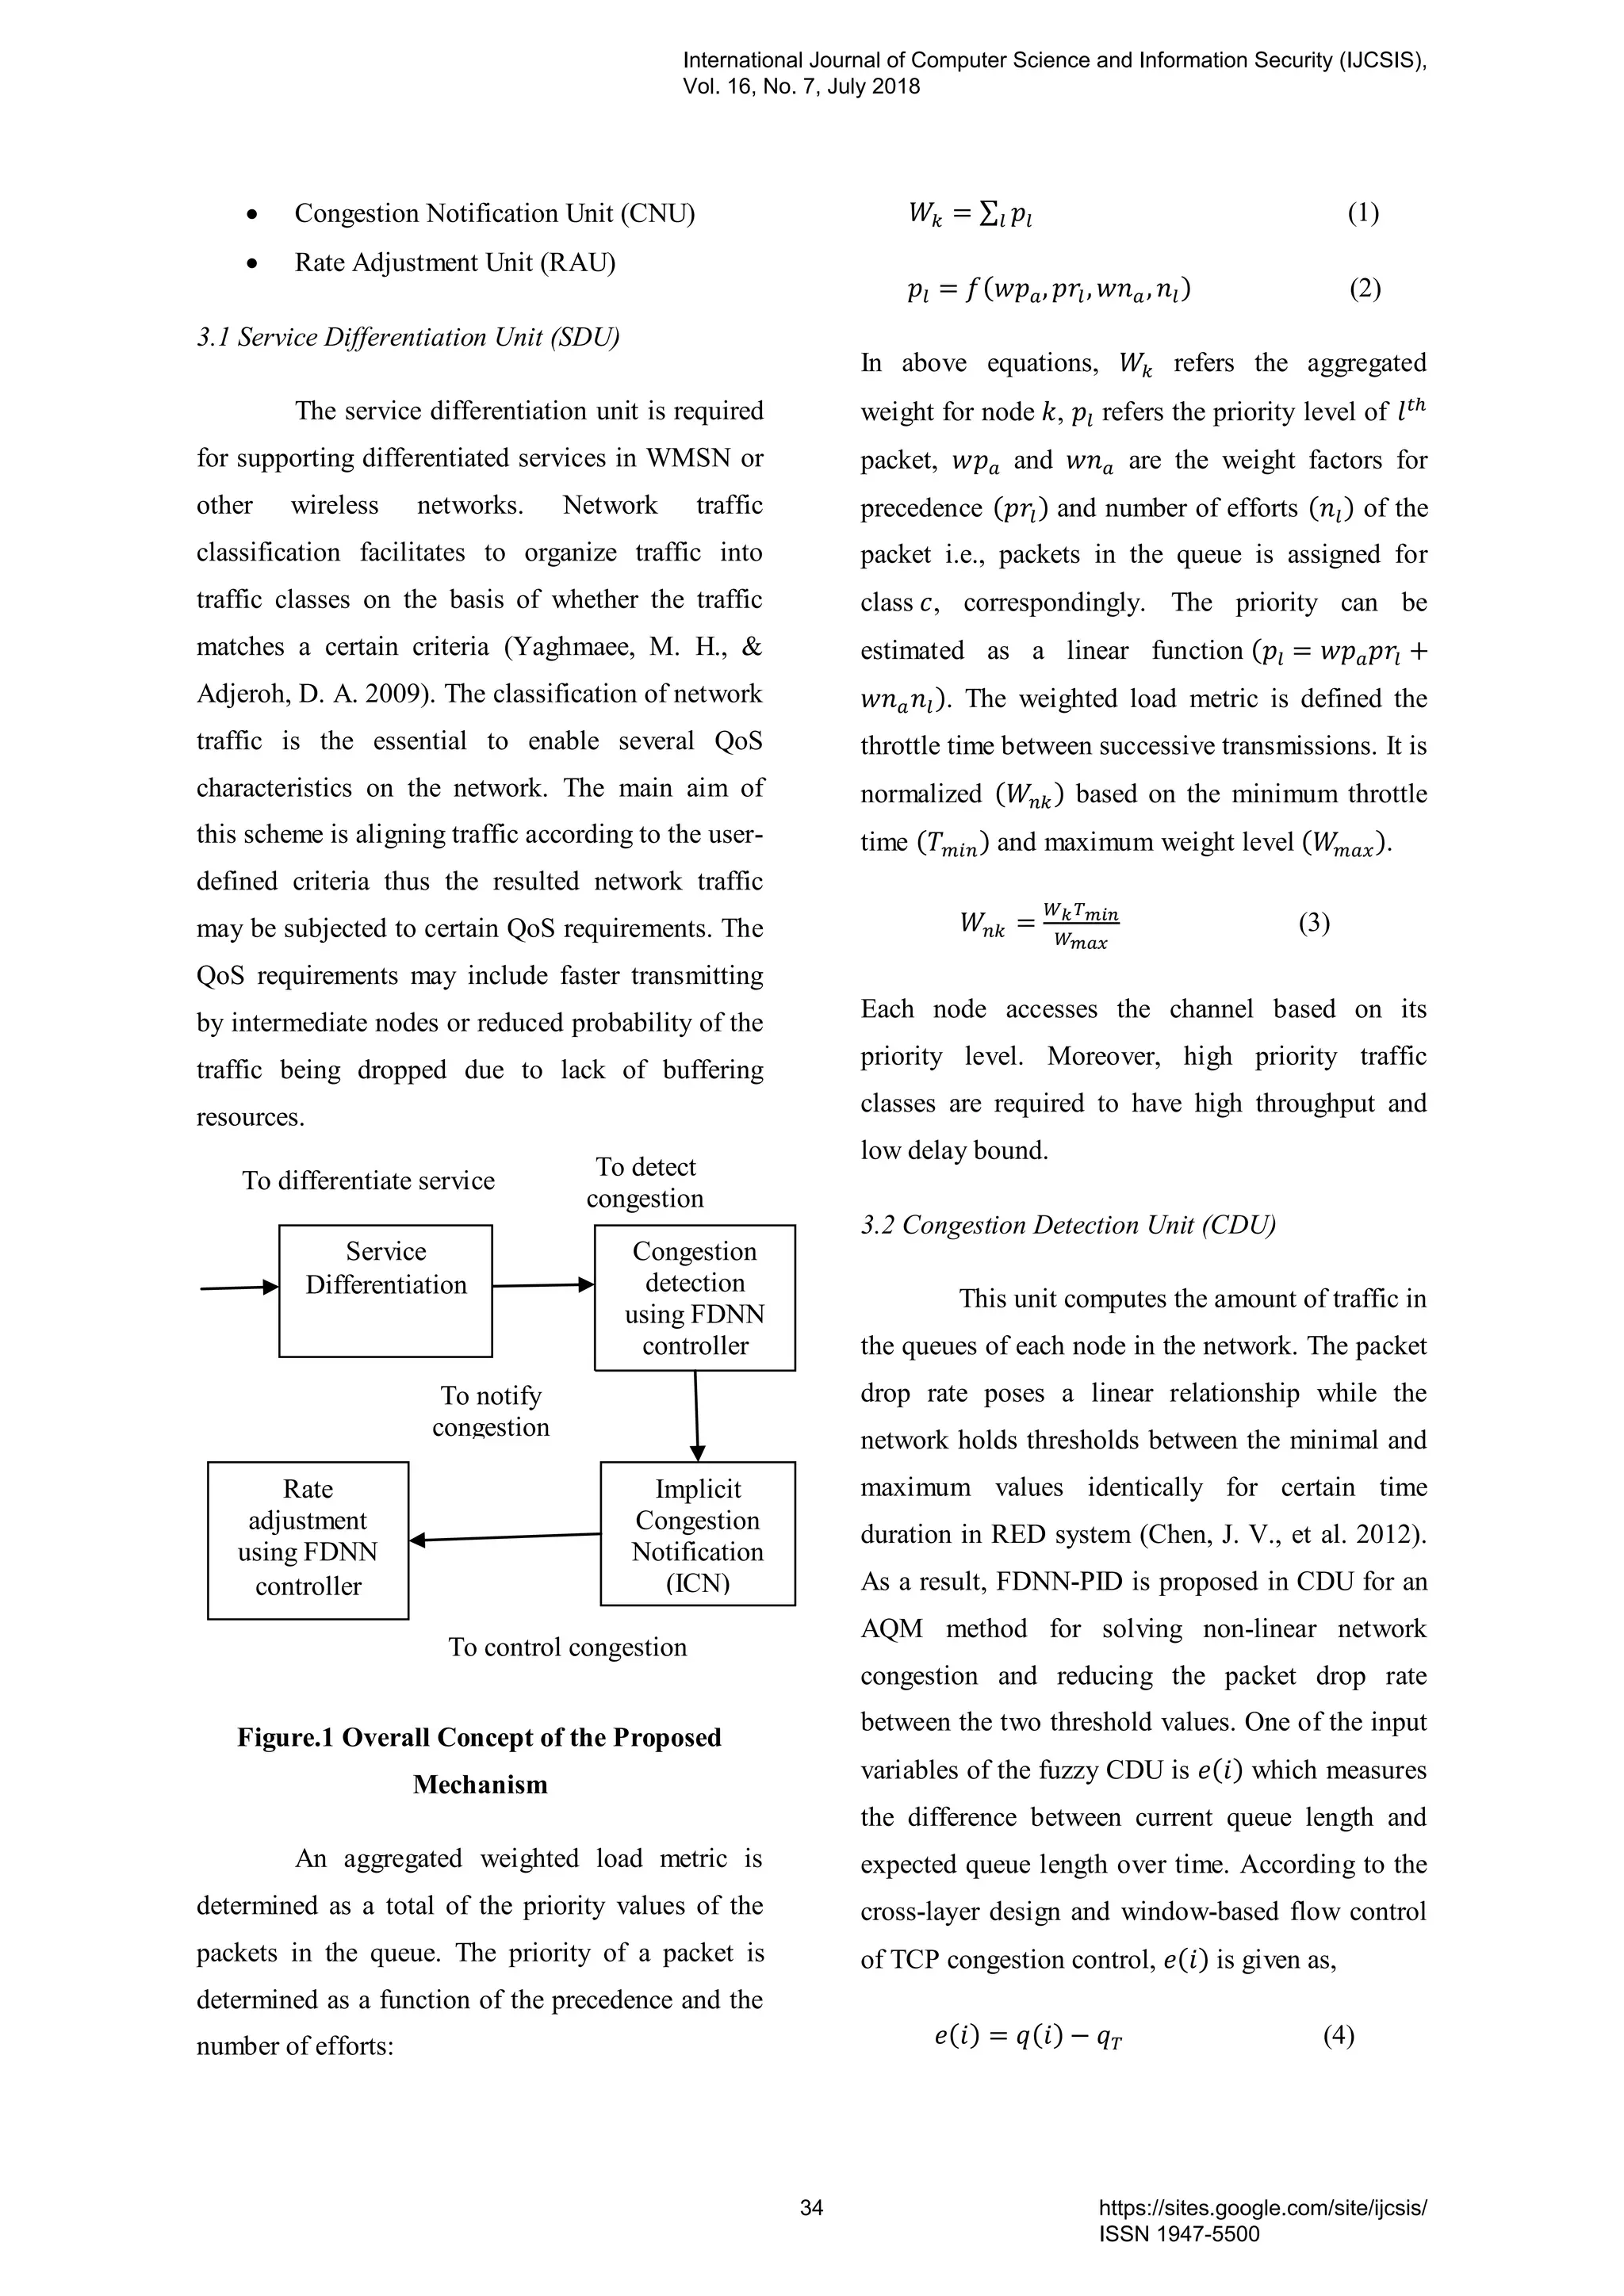
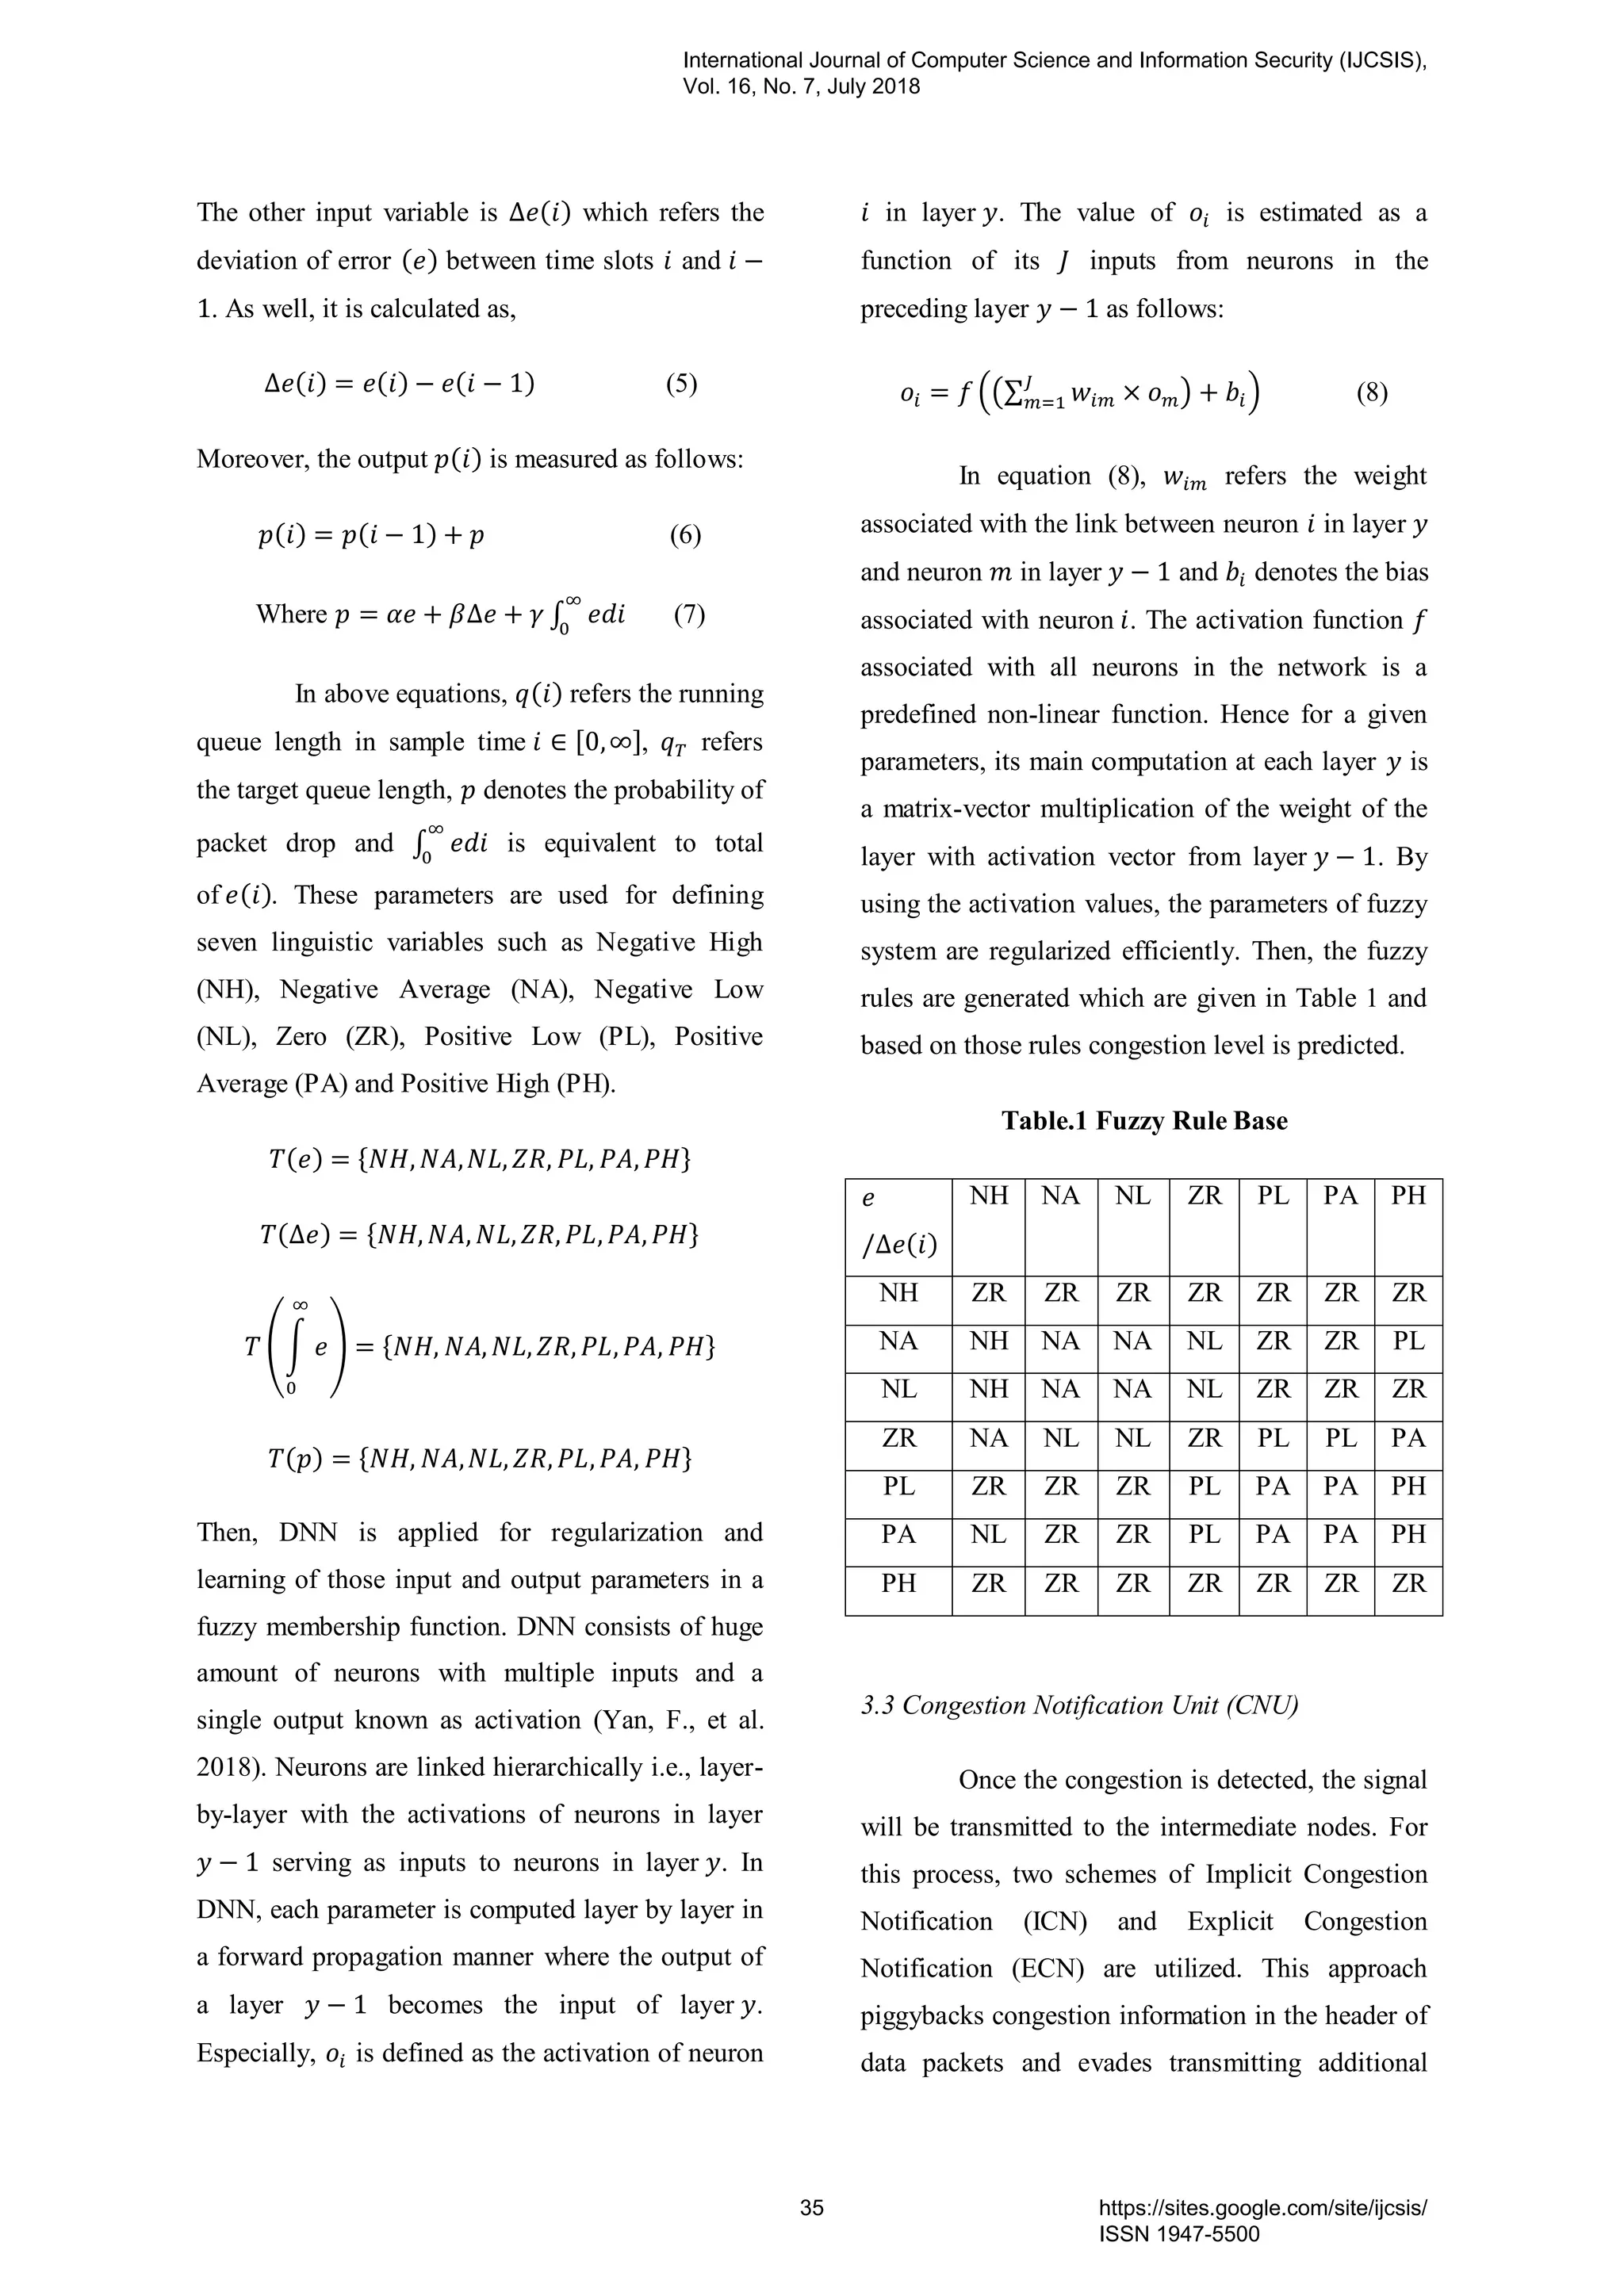
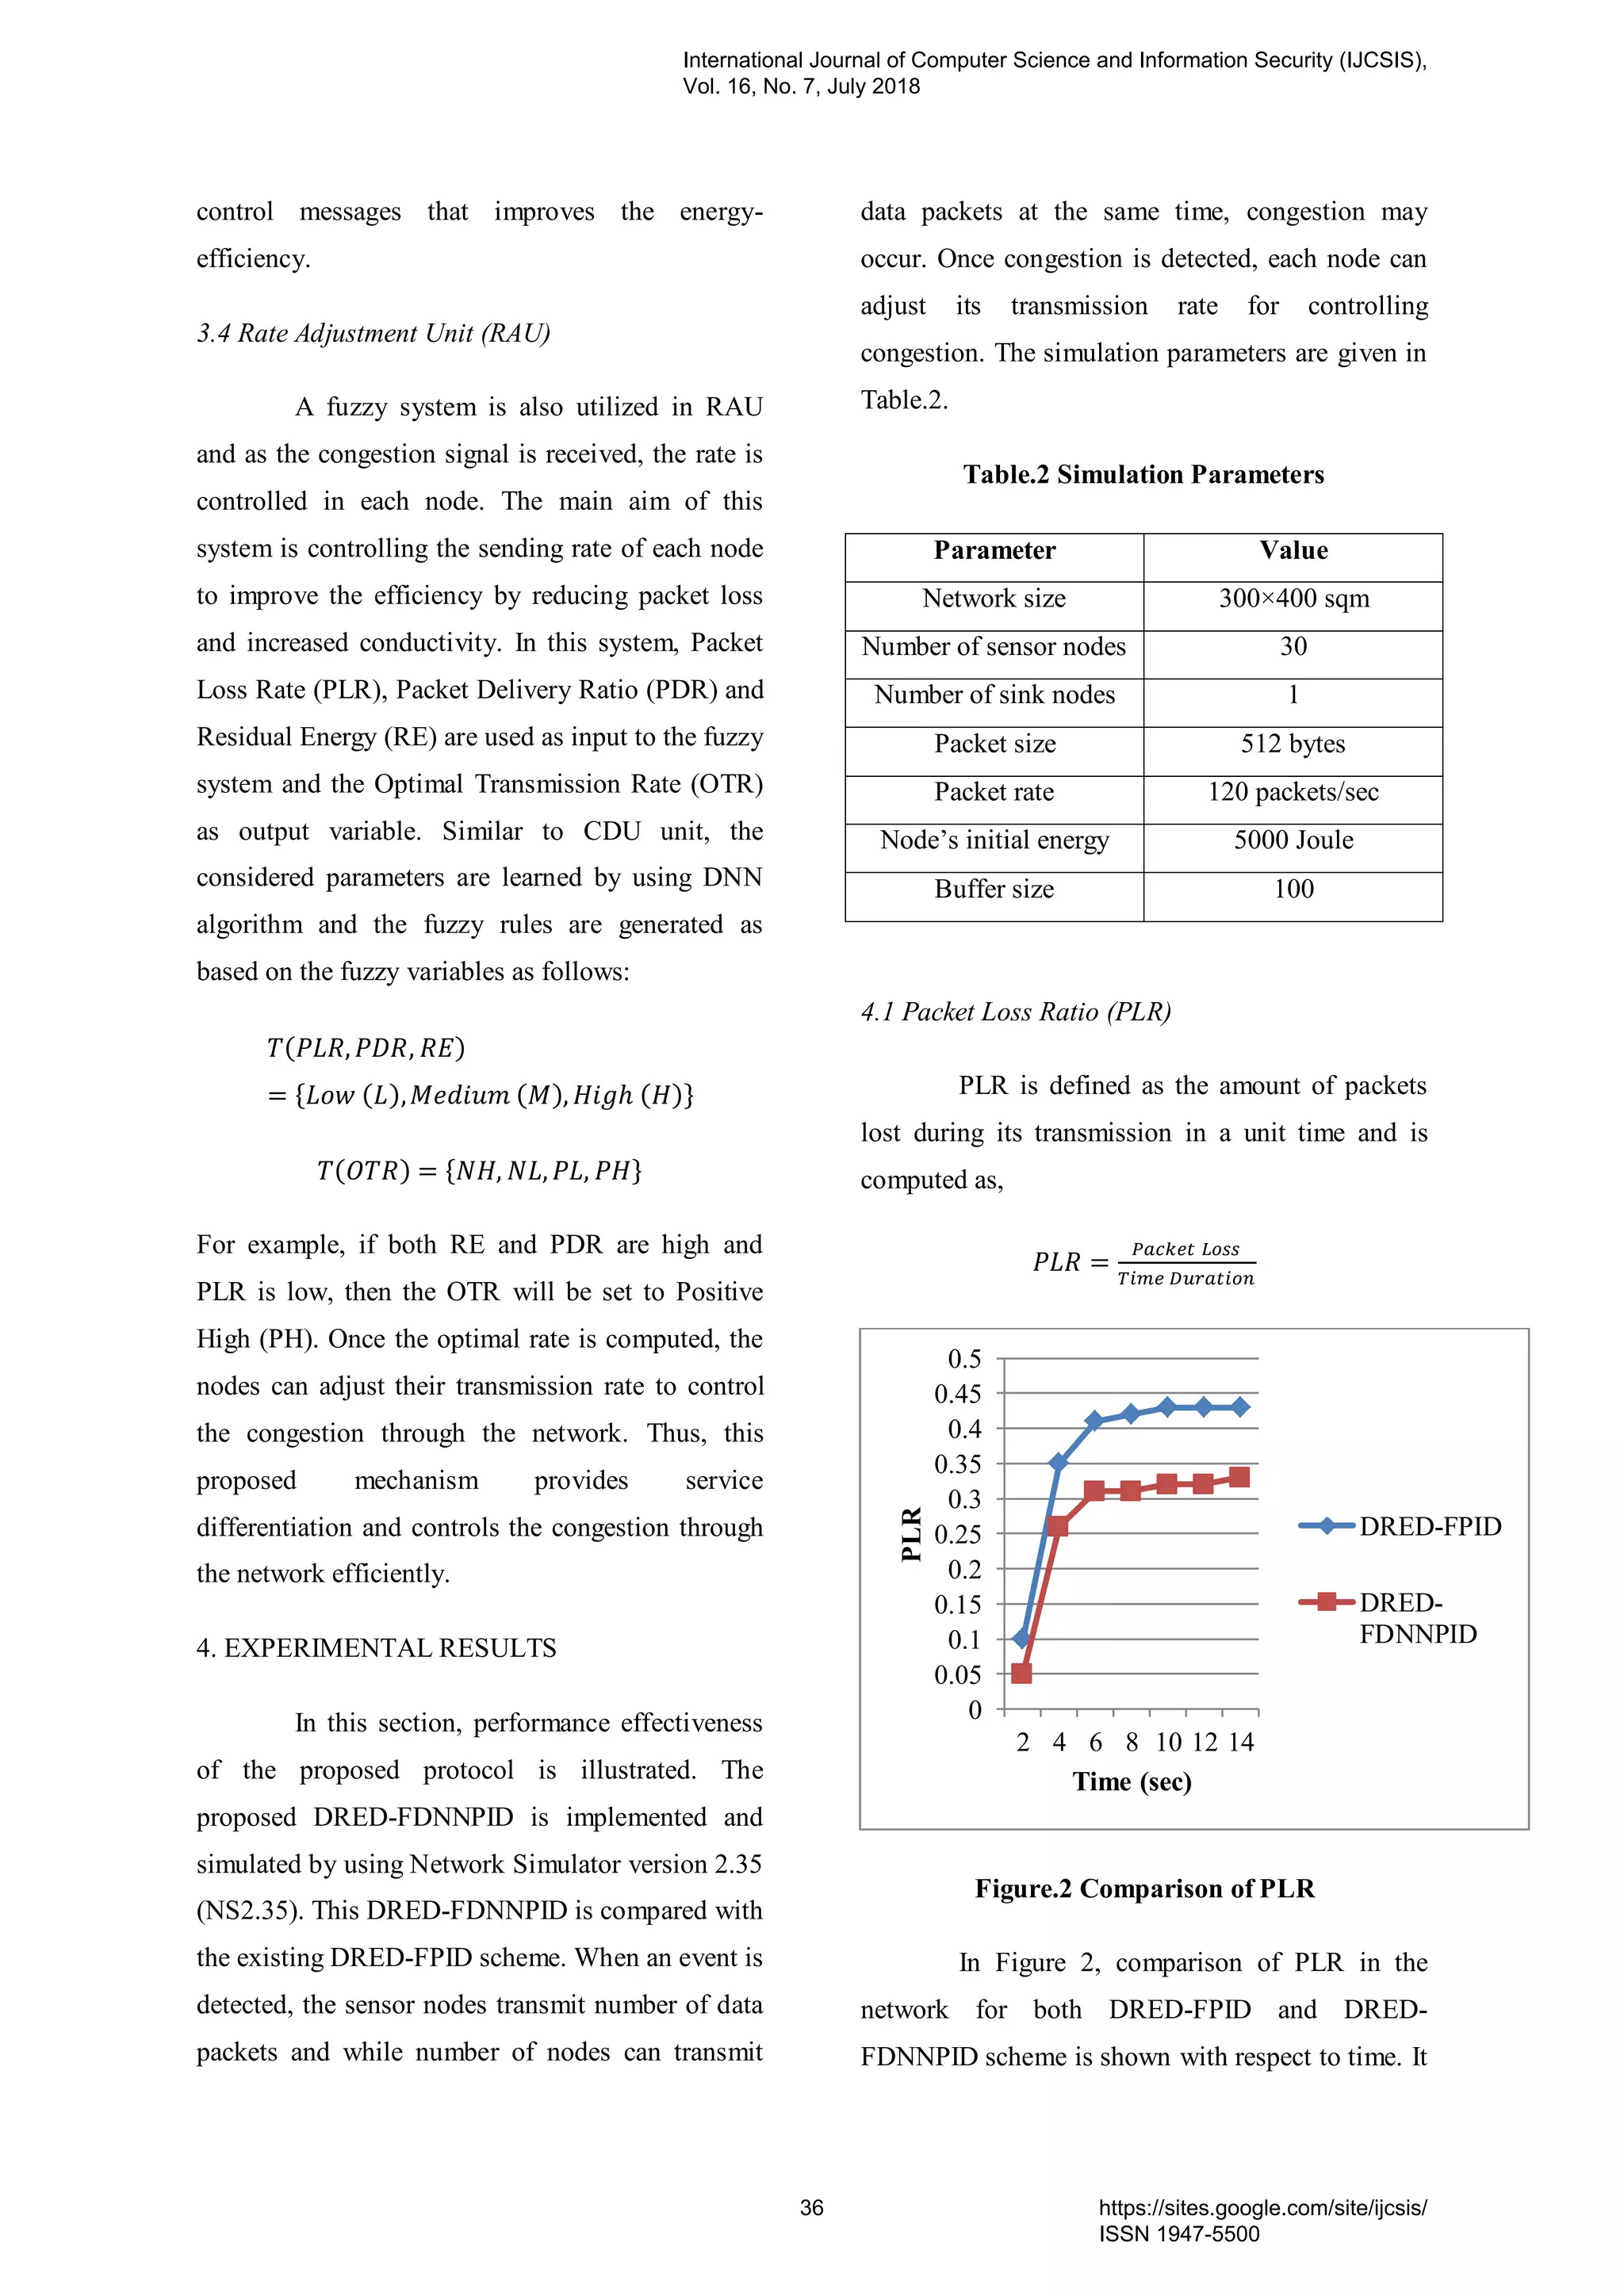
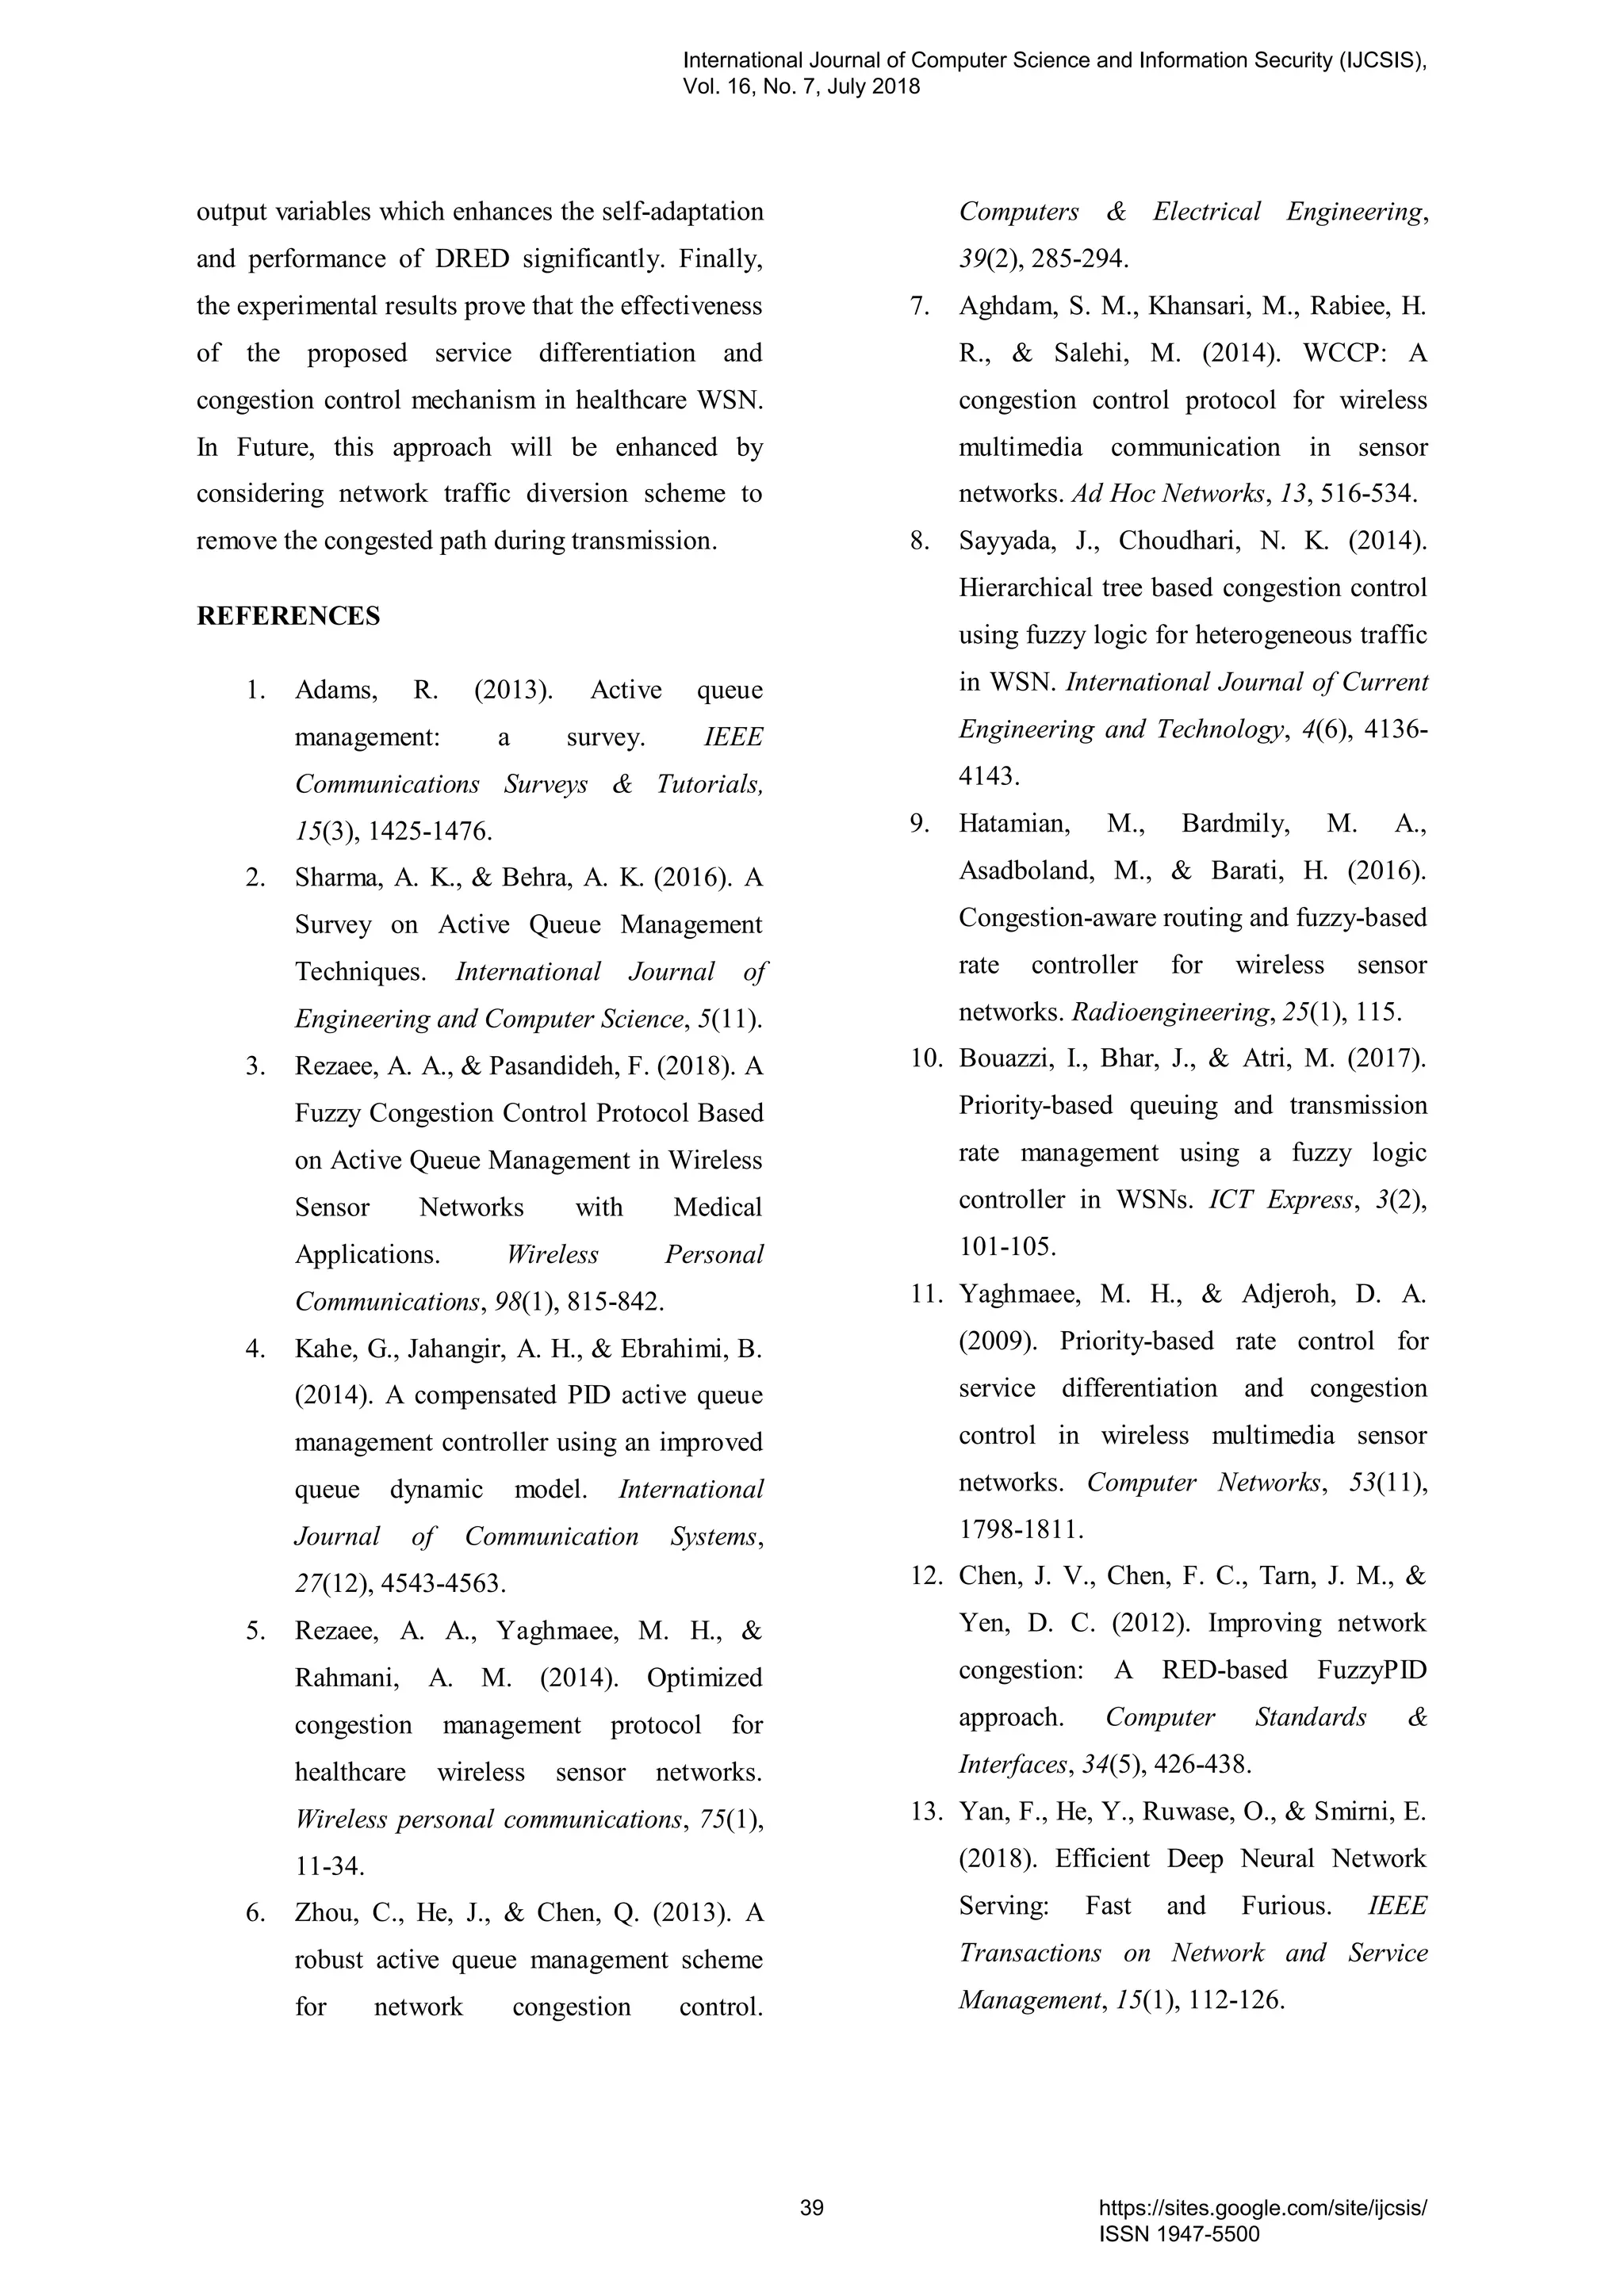
![Medical Image Segmentation Based On
Generalized Gamma Distribution for Effective
Identification of Diseases in Brain
K .Srinivas #1
, P.V.G.D Prasad Reddy#2
, GPS Varma#3
#1
Research Scholar, Dept. of CS&SE, Andhra University, Visakhapatnam, A.P-India.
#2
Prof & HOD, Dept. of CS&SE, Andhra University, Visakhapatnam, A.P-India.
#3
Principal, SRKR Engineering College, Bhimavaram, A.P-India.
1
kasrinu71@gmail.com
2
prasadreddy.vizag@gmail.com
3
gpsvarma@gmail.com
Abstract—Medical image processing has gained
significant importance with the increase in the number of
medical cases globally. To combat this increase, sophisticated
medical equipments were developed and made into use. However
in particular cases of medical diseases like-; Alzimeer diseases,
Parksions diseases, Acoustic Neuroma, these technological
developments could not able to identify the early onsets of the
diseases. Therefore to overcome this disadvantage, the present
article makes an attempt for identifying the medical diseases at
the earlier stages by proposing a methodology based on
generalized gamma distribution with k-Means algorithm. The
performance evaluation carried out by using metrics like
Average Difference, Maximum Distance, Image Fedility, Mean
squared Error and Signal to Noise Ratio showcase that the
developed model exhibits an accuracy rate of above 90 percent in
most of the cases.
Index terms: Medical image analysis, Acoustic Neuroma, Parksions
diseases, Performance evaluation metrics, AD, IF, MSE, PSNR
I. INTRODUCTION
Image processing is a area of specialization that deals with
mainly the analysis and enhancement of the images under
consideration. This area was popularized with the addition of
medical analysis and had wide applications ranging from
security to military. Medical image processing mainly deals
with the analysis of the images and thereby helps in the
identification of the diseases, such that more appropriate
details regarding the medical data can be extracted. This
analysis has helped to resolve in many of the medical related
diseases identification. As the number of medical cases are
increasing on daily basis, to identify these diseases accurately
with the available recourses of specialized Medical
Radiologists has become a challenging task. Therefore, many
models were developed by researchers to help in the
identification process [1], [2], [3], [4]. Most of these methods
were based on models based on neural network approach
based, SVM classifier based, Data mining based approaches.
However, as the number of cases is increasing, the disease
identification is mostly based on manual interpretation of the
Radiologists in many on the previous instances. But as the
number of cases is increasing, the manual identification
process has become extremely difficult and hence effective
identification is mostly at stake. To overcome this
disadvantages, automated devices are into existence, however
whenever a disease is affected, there are many factors that
influence the disease. Therefore, to underline these factors is
an essential task before ratifying a disease. With this very
purpose, approaches based on both generative and
degenerative model based techniques were proposed by many
reviewers [5], [6], [7], [8], [9], Among these approaches,
generative approaches are most commonly and widely
recognized because of their ability to interpret the disease
more precisely, since they consider the associated parameters
of the human anatomy into consideration and thereby ensures
better recognition rates (S.K.Pal, N.R.Pal (1993)).
Among the medical diseases, brain related diseases are
mostly highlighted in the recent past. The numbers of
mortality cases are increasing as a result of this deformity.
The main reason is that every human brain enclose three main
tissues, namely White Matter (WM), Grey Matter (GM) and
Cerebrum Spinal Fluid (CSF) . Most of these diseases of the
brain are obscured with either WM or GM. Therefore
identification of the diseases more aptly has become a
challenging task. To overcome this disadvantage, in the
present article an methodology was proposed by using
Generalized Gamma Distribution (GGM). The main
advantage behind the consideration of this model is that all the
pixels inside the medical region exhibit random phenomena,
and as a result, the output results into several shapes of
distributions. Most of these shapes are the particular cases of
GGM. Hence the choice of the model is justified. The rest of
the paper is structured as follows; section-2 of the paper deals
with the GGM and its PDF, this section also highlights the
updated parameters of the proposed model, Section-3
highlights the clustering methodology based on K-Means
algorithm, the Dataset considered is presented in section 4, the
section 5 of the paper highlights the experimentation carried
out and in the section 6, the performance of the model is
carried out using evaluation metrics like Average Difference,
Maximum distance, Image Fedility, Mean Squared Error and
International Journal of Computer Science and Information Security (IJCSIS),
Vol. 16, No. 7, July 2018
41 https://sites.google.com/site/ijcsis/
ISSN 1947-5500](https://image.slidesharecdn.com/journalofcomputerscienceijcsisjuly2018fullvolume-180915043348/75/Journal-of-computer-science-ijcsis-july-2018-full-volume-55-2048.jpg)
![Signal to Noise Ratio, and the concluding section 7,
summarizes the article.
II. GENERALIZED GAMMA DISTRIBUTION
Every image is a collection of several image regions. In
each image region, the image data is quantized by pixel,
which is a random variable because of the fact it is influenced
by random factors like Vision, brightness, contrast etc. To
model the pixel intensities in a image region, it is necessary to
assume that the pixels in each image region follow a
Generalized Gamma Distribution.
The probability density function of generalized gamma
distribution is given by
--2.2.1
Where a, b, c, k are called the gamma variants and c, k are
called shape parameters such that c, k >0.
a is called location parameter, b is called shape parameter
with a ,b >0.
The mean of the generalized gamma distribution is given by
--2.2.2
The variance of the generalized gamma distribution is given
by
--2.2.3
The mode of generalized gamma distribution is given by
--2.2.4
The rth
moment about the location parameter „a‟ is given by
--2.2.5
III. K-MEANS ALGORITHM
All paragraphs must be indented. All paragraphs must be
justified, i.e. both left-justified and right-justified.
The K-Means clustering is a popular approach to segment the
image into K-Clusters. The steps to be performed are:
Step 1: Begin with initial value of k=Number of segments.
Step 2: Select the number of clusters k with initial cluster
centroids Vi; i=1,2…k.
Step 3: Partition the input pixels into k clusters by assigning
each pixel xj to the closest Cluster centroid Vi using the
selected distance measure, e.g. Euclidean distance defined as:
Step 4: Compute a cluster assignment matrix U representing
the partition of the pixels with the binary membership value of
the jth pixel to the ith
cluster such that:
U = [µij], Where,
Step 5: Recompute the centroids using the membership values
as
Step 6: If the cluster centroids or the assignment matrix does
not change from the previous iteration, stop otherwise goto
step 3.
A. Segmentation Algorithm
After refining the parameters, the first step in image
reconstruction by allocating pixels to the segments. This
operation is done by the segmentation algorithm. The
segmentation algorithm consists of 7 steps.
Step 1: Obtain the pixel intensities of the gray image. Let they
be represented by xij.
Step 2: Obtain the number of regions by k-means algorithm
and divide the (image) pixel into regions.
Step 3: For each region obtain the initial estimates using
moment methods of estimation for µi, σi. Let αi=1/k is the
initial estimate for αi.
Step 4: Obtain the refined estimates of µi, σi, αi for i=1….k
using updated equations for the parameters derived by EM
algorithm with step 3 estimates as initial estimates.
Step 5: Implement the segmentation and retrieval algorithm
by considering maximum likelihood estimate.
Step 6: With the step 5 obtain the image quality metric.
Step 7: The image segmentation is carried out by assigning
each pixel into a proper region (segment) according to
maximum likelihood estimates of the jth
element Lj according
to the following equation
Lj = Maxj
International Journal of Computer Science and Information Security (IJCSIS),
Vol. 16, No. 7, July 2018
42 https://sites.google.com/site/ijcsis/
ISSN 1947-5500](https://image.slidesharecdn.com/journalofcomputerscienceijcsisjuly2018fullvolume-180915043348/75/Journal-of-computer-science-ijcsis-july-2018-full-volume-56-2048.jpg)
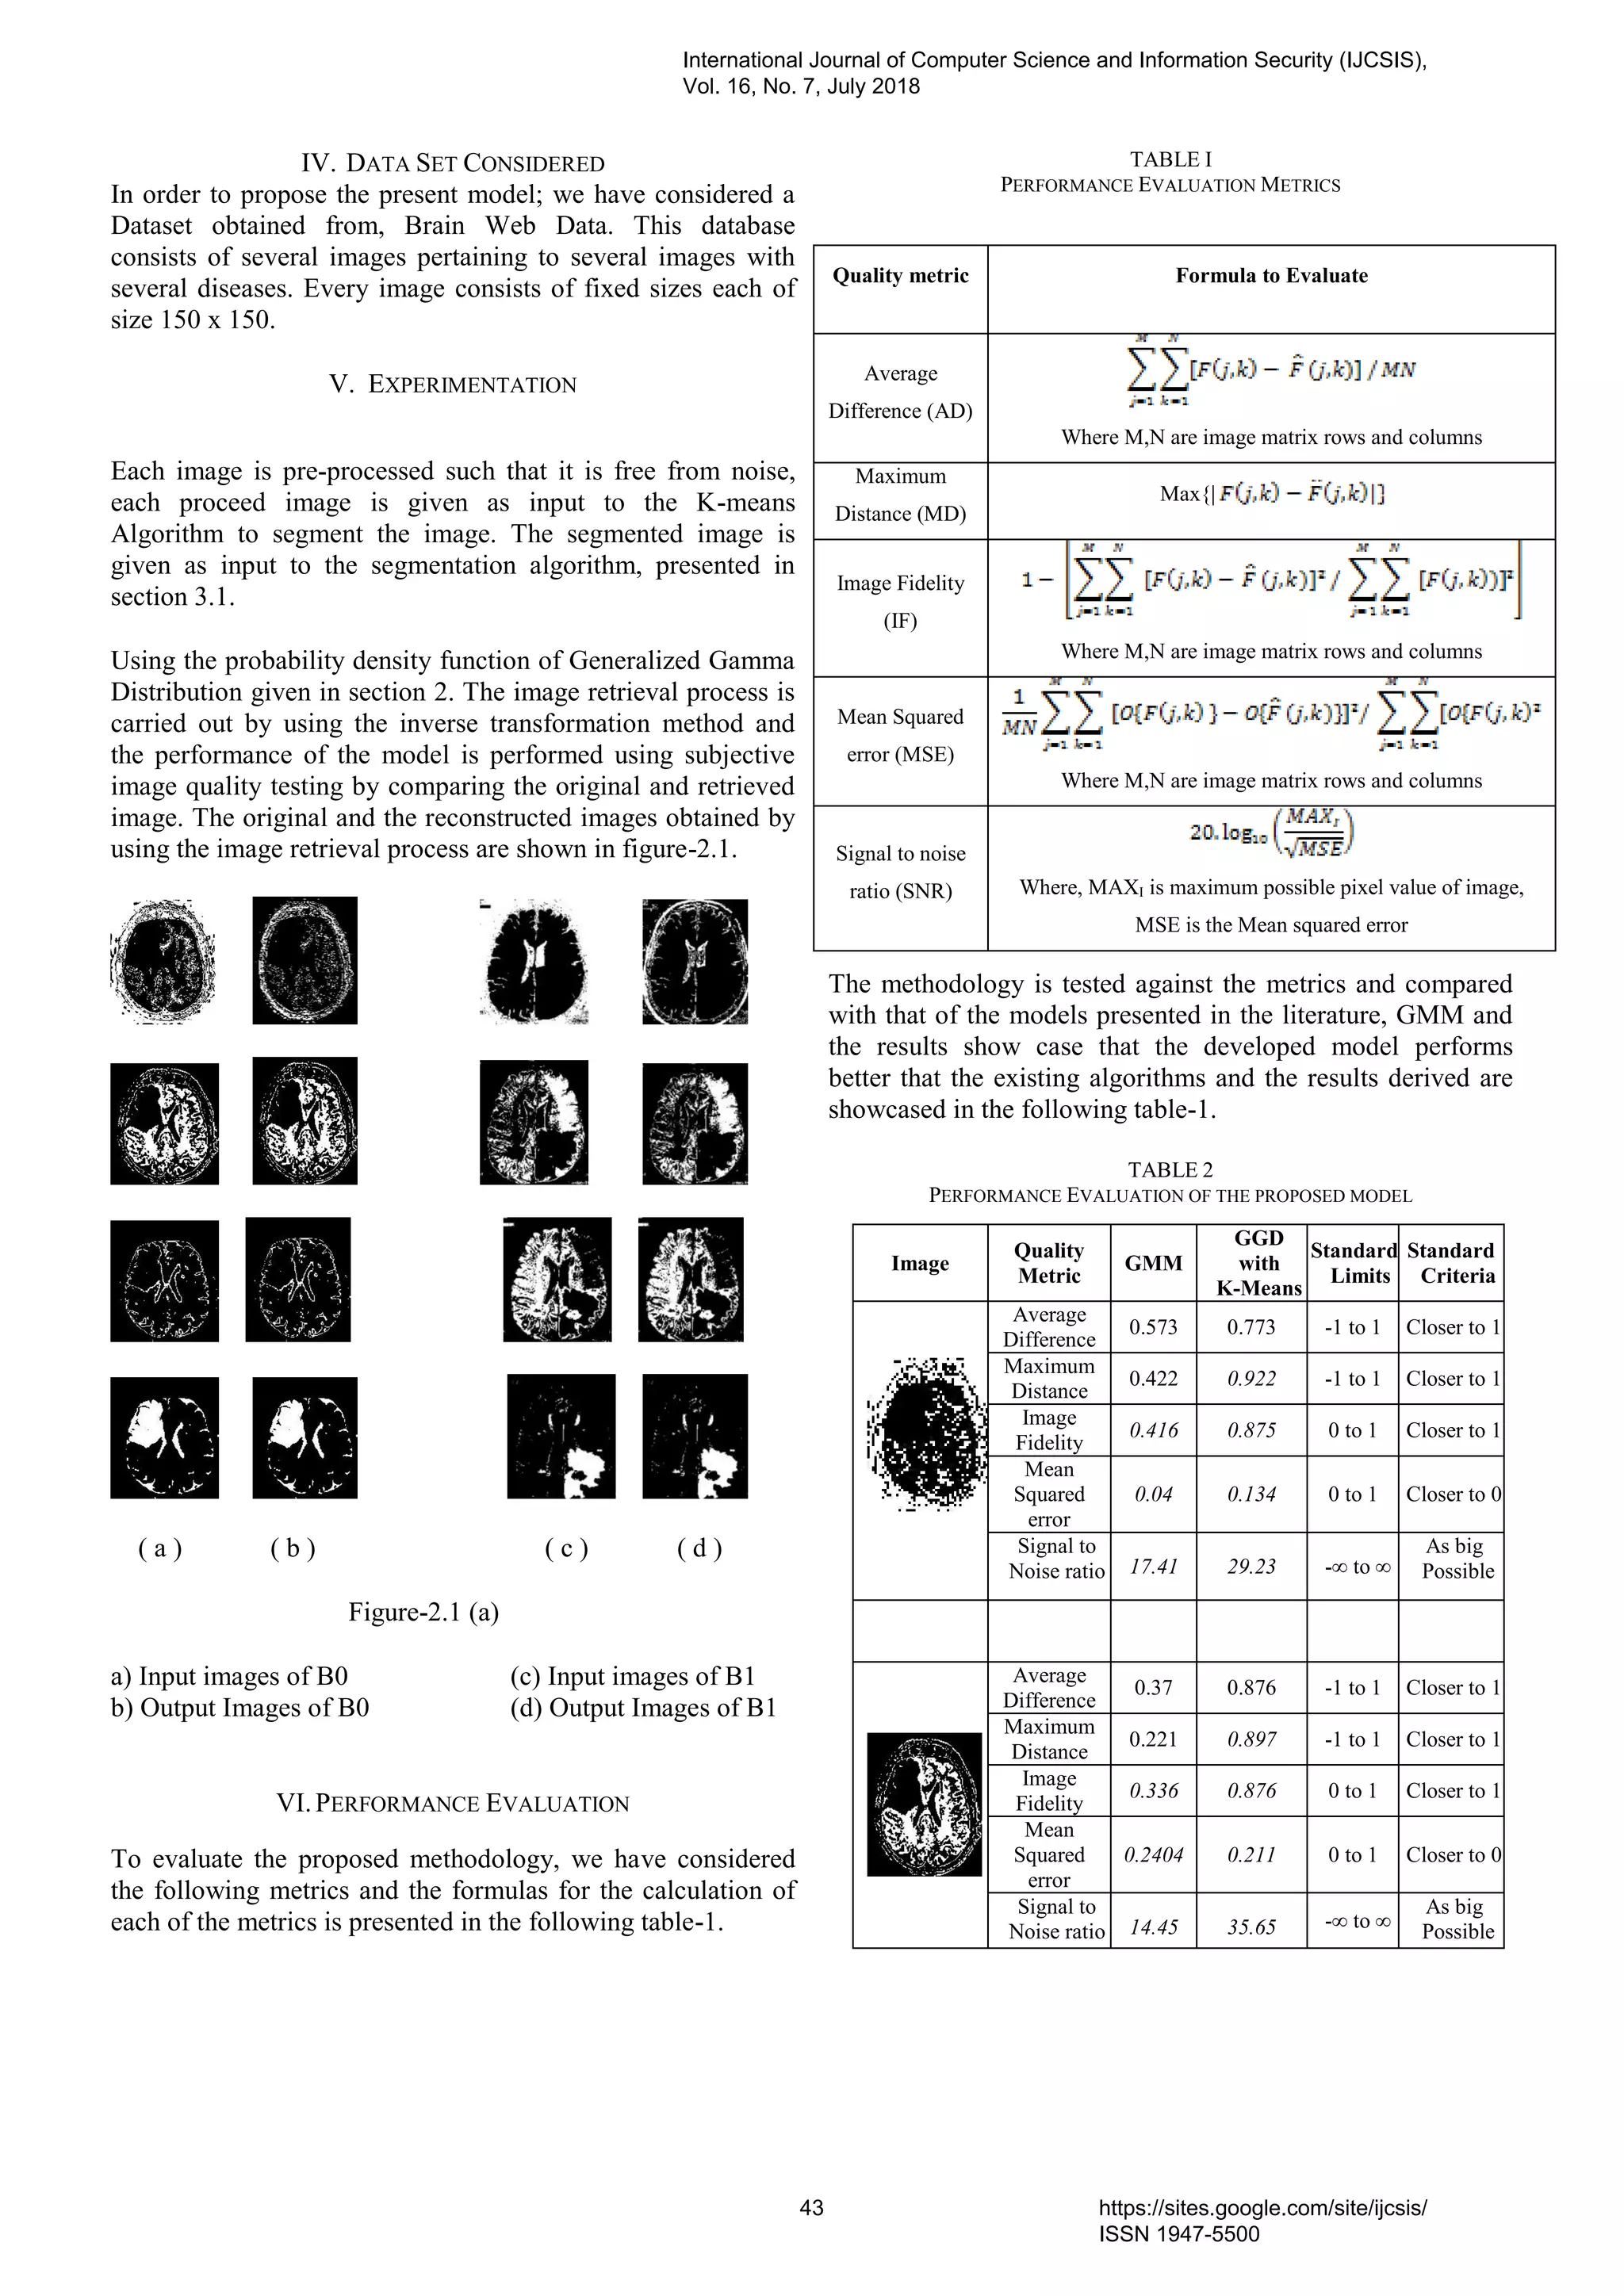
![Average
Difference
0.456 0.76 -1 to 1 Closer to 1
Maximum
Distance
0.345 0.879 -1 to 1 Closer to 1
Image
Fidelity
0.44 0.86 0 to 1 Closer to 1
Mean
Squared
error
0.22 0.23 0 to 1 Closer to 0
Signal to
Noise ratio 19.88 37.98 -∞ to ∞
As big
Possible
Average
Difference
0.231 0.473 -1 to 1 Closer to 1
Maximum
Distance
0.224 0.977 -1 to 1 Closer to 1
Image
Fidelity
0.212 0.813 0 to 1 Closer to 1
Mean
Squared
error
0.24 0.121 0 to 1 Closer to 0
Signal to
Noise ratio 21.42 33.28 -∞ to ∞
As big
Possible
Average
Difference
0.342 0.764 -1 to 1 Closer to 1
Maximum
Distance
0.317 0.819 -1 to 1 Closer to 1
Image
Fidelity
0.391 0.812 0 to 1 Closer to 1
Mean
Squared
error
0.2514 0.228 0 to 1 Closer to 0
Signal to
Noise ratio 3.241 5.514 -∞ to ∞
As big
Possible
Average
Difference
0.21 0.3653 -1 to 1 Closer to 1
Maximum
Distance
0.21 0.892 -1 to 1 Closer to 1
Image
Fidelity
0.2134 0.787 0 to 1 Closer to 1
Mean
Squared
error
0.06 0.145 0 to 1 Closer to 0
Signal to
Noise ratio 13.43 49.22 -∞ to ∞
As big
Possible
Average
Difference
0.3232 0.322 -1 to 1 Closer to 1
Maximum
Distance
0.123 0.212 -1 to 1 Closer to 1
Image
Fidelity
0.233 0.897 0 to 1 Closer to 1
Mean
Squared
error
0.01 0.4345 0 to 1 Closer to 0
Signal to
Noise ratio 11.11 27.267 -∞ to ∞
As big
Possible
Average
Difference
0.314 0.338 -1 to 1 Closer to 1
Maximum
Distance
0.241 0.249 -1 to 1 Closer to 1
Image
Fidelity
0.293 0.683 0 to 1 Closer to 1
Mean
Squared
error
0.18 0.197 0 to 1 Closer to 0
Signal to
Noise ratio 21.214 78.19 -∞ to ∞
As big
Possible
From the above table-2, it can be observed that the MSE of
the developed model is very less in comparison with the
existing algorithm. The MSE values of the proposed model is
approaching towards 0, which clearly shows that the error is
minimal, since the error is less, implies that the retrieved
image is more in accordance with that of the original image.
The SNR is high in case of the existing model, which clearly
shows that the retrieval signal. The same is in case with the
other metrics.
VII. CONCLUSION
In this article, a methodology based on GGM is
proposed for analysing the medical data. The methodology is
applied on to the Brain web images, obtained from the web
data. This method is tested against the existing model based
on GMM and the results are tested against the metrics like
Average Difference, Maximum Distance, Image Fedility,
Mean Squared Error and Signal to Noise Ratio. From the
above results presented in Table-2, it clearly showcased that
the developed model outperforms than that of the existing
model based on GMM, from the results it can be seen that
MSE is very less in case of the developed model, which
specifies that it is more acceptable than that of the existing
model, the other metrics like IF, SNR, AD, MD showcase
better results to the developed model when compared to that
of the existing model. The overall efficiency is around 92%
recognition rate.
REFERENCES
[1] Annemie Ribbons, Jeroen Hermans, Frederik Maes, Dirk
Vandermeulen, and Paul Suetens, “Unsupervised Segmentation,
Clustering, and Groupwise Registration of Heterogeneous Populations
of Brain MR Images,” IEEE Transaction on Medical Imaging., vol. 33,
no. 2, pp. 201-224, 2014.
[2] A. Montanvert et al, “Hierarchical Image Analysis Using Irregular
Tessellations”, Transactions On Pattern Analysis and Machine
Learning, Vol. 13, No.4, April-1991
[3] A. Montanvert et al, “Hierarchical Image Analysis Using Irregular
Tessellations”, Transactions On Pattern Analysis and Machine
Learning, Vol. 13, No.4, April-1991
[4] A. Ortiz, J.M.Gorriz, J.Ramirez, and D. Salas-Gonzalez,
“Unsupervised Neural Techniques Applied to MR Brain Image
Segmentation,” Hindawi Publishing Corporation on Advances in
Artificial Neural Systems, vol. 2012 Article ID 457590 pp. 1-7, 2012.
[5] A. Ortiz, J.M.Gorriz, J.Ramirez, and D. Salas-Gonzalez, J.M. Llamas-
Elvira, “Two fully-unsupervised mehods for MR brain image
International Journal of Computer Science and Information Security (IJCSIS),
Vol. 16, No. 7, July 2018
44 https://sites.google.com/site/ijcsis/
ISSN 1947-5500](https://image.slidesharecdn.com/journalofcomputerscienceijcsisjuly2018fullvolume-180915043348/75/Journal-of-computer-science-ijcsis-july-2018-full-volume-58-2048.jpg)
![segmentation using SOM-based strategies,” ELSEVIER on Applied
Soft Computing 13 (2013) 2668-2682.
[6] Nagesh Vadaparthi, Srinivas Yarramalle, Suresh Varma Penumatsa,
P.S.R.Murthy, “Segmentation of Brain MR Images based on Finite
Skew Gaussian Mixture Model with Fuzzy C-Means Clustering and
EM Algorithm,” International Journal of Computer Applications, vol.
28, no. 10, pp. 18-26, August 2 011.
[7] Nagesh Vadaparthi, Srinivas Yarramalle, Suresh Varma.P,
“Unsupervised medical Image Segmentation on Brain MRI images
using Skew Gaussian Distribution”, IEEE-International Conference on
Recent Trends in Information Technology, 2011, pp.1293-1297.
[8] Nikos Vlassis and Theo Gevers, “A Spatially Constrained Generative
Model and EM Algorithm for Image Segmentation”, IEEE
Transactions on Neural Networks, Vol:18, No. 3, May 2007.
[9] Prasad Reddy P.V.G.D, Srinivas Rao. K, Srinivas Yarramalle,
“Unsupervised Image Segmentation Method based on Finite
Generalized Gaussian Distribution with EM & K-Means Algorithm”,
IJCSNS International Journal of Computer Science and Network
Security, VOL.7 No.4, April 2007.
[10] Publishing Corporation on Computational and Mathematical Methods
in Medicine., vol. 2014, Article ID 712783, pp.
[11] R. B. Dubey et al, “Semi-automatic Segmentation of MRI Brain
Tumor”, ICGST-GVIP Journal, ISSN: 1687-398X, Volume 9, Issue 4,
August 2009.
[12] R. Venkateswaran, S.Muthukumar, “Genetic Approach on Medical
Image Segmentation by Generalized Spatial Fuzzy C-Means
Algorithm”, IEEE Int. Conf. on Computational Intelligence and
Computing Research, 2017.
[13] R.C.Gongalez and R.E. Woods, “Digital Image Processing”, PHI
Publications India Limited, New Delhi, India.
[14] Rahman Farnoosh, Gholamhossein Yari, Behnam Zarpak, “Image
Segmentation Using Gaussian Mixture Models”, 26-th International
Workshop on Bayesian Inference and Maximum Entropy Methods in
Science and Engineering, Paris, France, July 8-13, 2016.
[15] K. Srinivas, Dr.G.P.Saradhi Varma, Dr. P.V G D Prasada Reddy
“ Improved tool for Content and Context based Information Retrieval ”
by in National Conference on Research Issues & Recent Trends in
Computer Science& Information Technology, Sir CRREC, Eluru.
International Journal of Computer Science and Information Security (IJCSIS),
Vol. 16, No. 7, July 2018
45 https://sites.google.com/site/ijcsis/
ISSN 1947-5500](https://image.slidesharecdn.com/journalofcomputerscienceijcsisjuly2018fullvolume-180915043348/75/Journal-of-computer-science-ijcsis-july-2018-full-volume-59-2048.jpg)

![II. RELATED WORK
Reference [1][5] describe notation of safety and dependability of the description document of the system. In
this paper, we have adopted the GSN to the notation of the safety knowledge representation.
Reference [1][10][14] proposes knowledge system related to safety or dependability, but it does not provide
a way to describe the GSN. Reference [3][4][5][6] proposes the notation or patterns related to a safety
argument. However, it does not describe the relation between HAZOP, FTA and GSN. Reference [2][7][15]
proposes the method combined HAZOP or FTA with D-Case, but it does not describe the relation between
HAZOP and FTA. Reference [8][9] shows the relation of safety analysis methods such as HAZOP, FTA, but
it does not show the relation with GSN. Reference [11][12] proposes the method of generating safety case, but
it does not describe concrete analysis methods such as HAZOP. Reference [13] proposes the method of
generating D-Case based on Context Dependency Matrix. However, it does not consider about HAZOP and
FTA.
Any of the research, the applied case to the automatic driving system are not included. Therefore, in the
system development in the future of the IoT society, the safety knowledge representation of automatic driving
system shown in this paper is considered to be effective.
III. ADOPTED SAFETY ANALYSIS PROCESS
Here, we describe the procedure for creating an explanation document that the stakeholders involved in the
development of the automatic driving system confirm the quality of each other's product and verify the quality
of the entire system.
(1) Define (Agree) the quality requirements the system should achieve.
(2) Organize the context, such as the configuration of the target system.
(3) To confirm the quality of the system based on the context.
A. Defining the quality requirements the system should achieve
In the automatic drive system, various devices will be connected. Due to having been connected, threats
such as the falsification of communication data are considered to increase. Furthermore, with the falsification
or reception error of communication data, it is also conceivable that hazards may occur in the system.
Therefore, in this explanation, we will explain that the following quality requirements have been achieved:
(A) Countermeasures against the possible hazards have been established.
(B) Countermeasures against the possible threats have been established.
(C) Countermeasures against the possible conflicts between services have been established.
B. Organizing the context
(1) Component devices and stakeholders of the automatic driving system
International Journal of Computer Science and Information Security (IJCSIS),
Vol. 16, No. 7, July 2018
47 https://sites.google.com/site/ijcsis/
ISSN 1947-5500](https://image.slidesharecdn.com/journalofcomputerscienceijcsisjuly2018fullvolume-180915043348/75/Journal-of-computer-science-ijcsis-july-2018-full-volume-61-2048.jpg)

![(3) Services to be provided by the automatic driving system
A list of services to be provided by the automatic driving system is shown in Table I. To provide multiple
services from one system, it is necessary to check the quality of each service.
TABLE I. PROVIDING SERVICES.
ID. Service ID. Service
1. Collision prevention between invisible people and vehicle 7. Idling stop support
2. Crossing road accident prevention 8. Start delay prevention
3. Collision prevention when turning right or left 9. Securing the safety of passengers
4. Rear-end collision and crash prevention 10. Securing the punctuality of public transportation
5. Sag part transportation facilitation 11. Overall optimization of public transportation
6. Track convoy travel 12. Movement support of vulnerable road users
(4) Collision prevention service of invisible people and vehicle
The specifications for the “Collision prevention with invisible people and vehicle”, one of the services to be
provided by the automatic driving system, are shown below.
[For vehicle drivers]
Using the following information to be obtained from the outside of vehicle, issues a warning by
detecting the risk of collision in advance with invisible people and vehicle due to the wall and the like.
Slows down the vehicle automatically as necessary.
Position information of pedestrians obtained from a smartphone
Vehicle position information obtained from the other vehicle
Risk avoidance information obtained via the roadside antenna from the Center
[For pedestrians]
Using the vehicle position information transmitted from the vehicle, issues a warning by detecting the
risk of collision in advance with invisible people and vehicle due to the wall and the like.
(5) Life cycle of the services
The behavior of the system will change according to the user's contract status. The behavior of the system
for the contract status of the “Collision prevention with invisible people and vehicle” is shown in Table II.
TABLE II. LIFE CYCLE OF THE SERVICES.
Service Life cycle Behavior
Collision prevention
with invisible people
and vehicle
When closing the
service contract
Sends the personal information such as name and
vehicle ID to the Center to close the service contract.
During the service
contract
Provides the collision prevention services with other
invisible vehicles and people due to the wall and the
like.
When terminating the
service contract
Terminates the service contract based on the contract
and deletes the personal information stored in the
Center.
International Journal of Computer Science and Information Security (IJCSIS),
Vol. 16, No. 7, July 2018
49 https://sites.google.com/site/ijcsis/
ISSN 1947-5500](https://image.slidesharecdn.com/journalofcomputerscienceijcsisjuly2018fullvolume-180915043348/75/Journal-of-computer-science-ijcsis-july-2018-full-volume-63-2048.jpg)
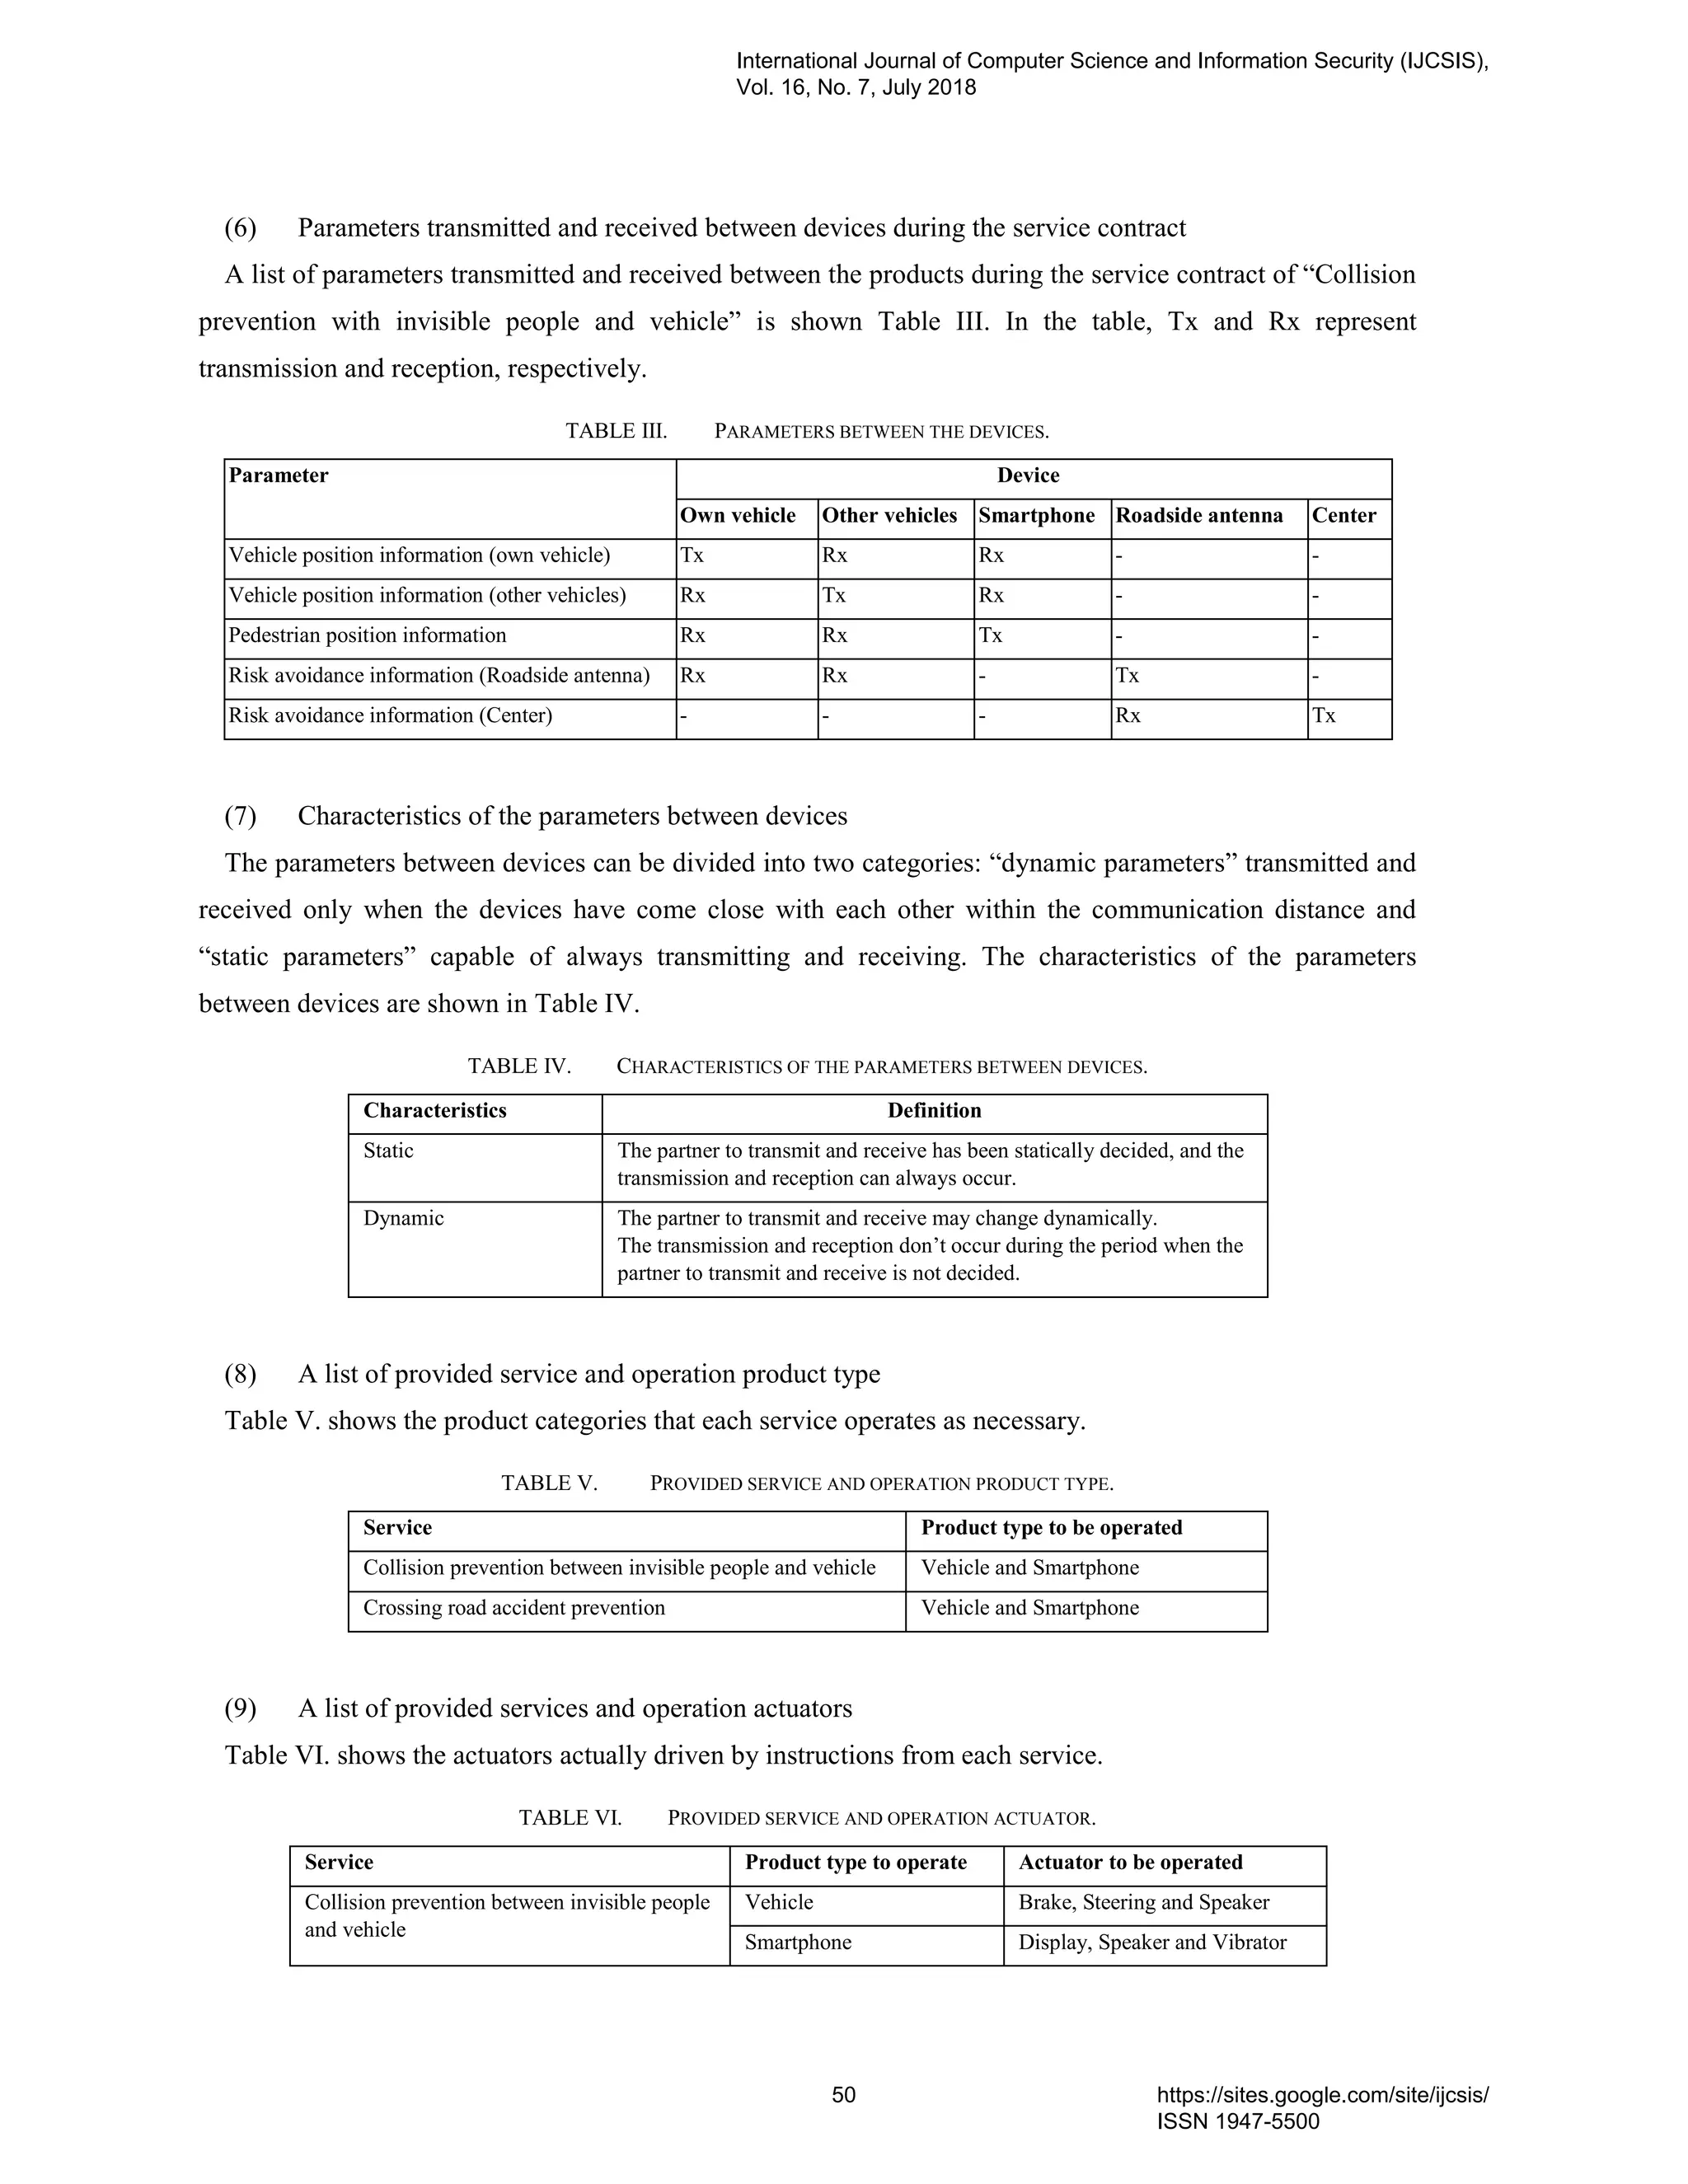
![Crossing road accident prevention Vehicle Brake and Steering
Smartphone Display and Speaker
C. Assure the system quality with the assumption
We assure the quality based on the assumption arranged in Section III.B. while setting “the quality of the
automatic driving system is reasonable” as the highest goal.
We assure mainly by the following 4 procedures.
(1) Subdivide the goal per component for the automatic driving system.
(2) Assure if a measure is established for a potential hazard of a parameter between devices (III.A-(A)).
(3) Assure if a measure is established for a potential threat of a parameter between devices (III.A-(B)).
(4) Assure if a measure is established for against conflict of actuator operation between the services (III.A-
(C)).
In order to clarify each procedure, the following case studies have executed (1) to (3) earlier and added (4)
later.
(1) Subdivide the goal per component for the automatic driving system.
Show the result after subdividing the goal per component for the automatic driving system as Fig.3.
Analysis is conducted in the following sequence:
[Step.1] Assure the quality over the system.
Explain the quality of the automatic driving system by subdividing per service which the automatic driving
system provides.
[Step2.] Assure the quality per service.
We explain including a service “collision prevention between invisible people and vehicle”. In this service,
the system behavior will be changed depending on three status of users such as before/after service contract or
at the time of service contract, under service contract, and at the time of termination of service contracts.
Accordingly, we explain per status which changes the system behavior in order to explain that the service
quality is reasonable.
[Step.3] Assure the quality per service component.
We explain including the status, “under service contract”. Services are composed of several devices and
each device performs the cooperative behavior. In the world such as automatic driving service which can
connect to several devices, we need to explain the quality per device is reasonable as well as the quality of
relationship between devices is reasonable. The quality per device should be assured by individual developer
and we link the assurance result as evidence. Also, the normal function related to the connection between
devices should be assured by assuring the reasonability of quality per device.
In addition, concerning the relationship between devices, we consider that each type of parameters is sent
and received between devices in order to realize the service and assure that the quality of relationship between
devices is reasonable by subdividing per parameter sent and received in this step.
International Journal of Computer Science and Information Security (IJCSIS),
Vol. 16, No. 7, July 2018
51 https://sites.google.com/site/ijcsis/
ISSN 1947-5500](https://image.slidesharecdn.com/journalofcomputerscienceijcsisjuly2018fullvolume-180915043348/75/Journal-of-computer-science-ijcsis-july-2018-full-volume-65-2048.jpg)
![[Step.4] Assure the quality per parameter between devices.
As explained above, we showed that we can subdivide into; assuring that the quality per system component
device is reasonable and assuring that the quality per parameter between devices is reasonable when assuring
the reasonability of service quality. We actually assure the followings against sending and receiving a
parameter in order to actually assure the reasonability of system quality.
Safety:
A measure is established for a potential hazard in sending and receiving a parameter.
Security:
A measure is established for a potential threat in sending and receiving a parameter.
International Journal of Computer Science and Information Security (IJCSIS),
Vol. 16, No. 7, July 2018
52 https://sites.google.com/site/ijcsis/
ISSN 1947-5500](https://image.slidesharecdn.com/journalofcomputerscienceijcsisjuly2018fullvolume-180915043348/75/Journal-of-computer-science-ijcsis-july-2018-full-volume-66-2048.jpg)
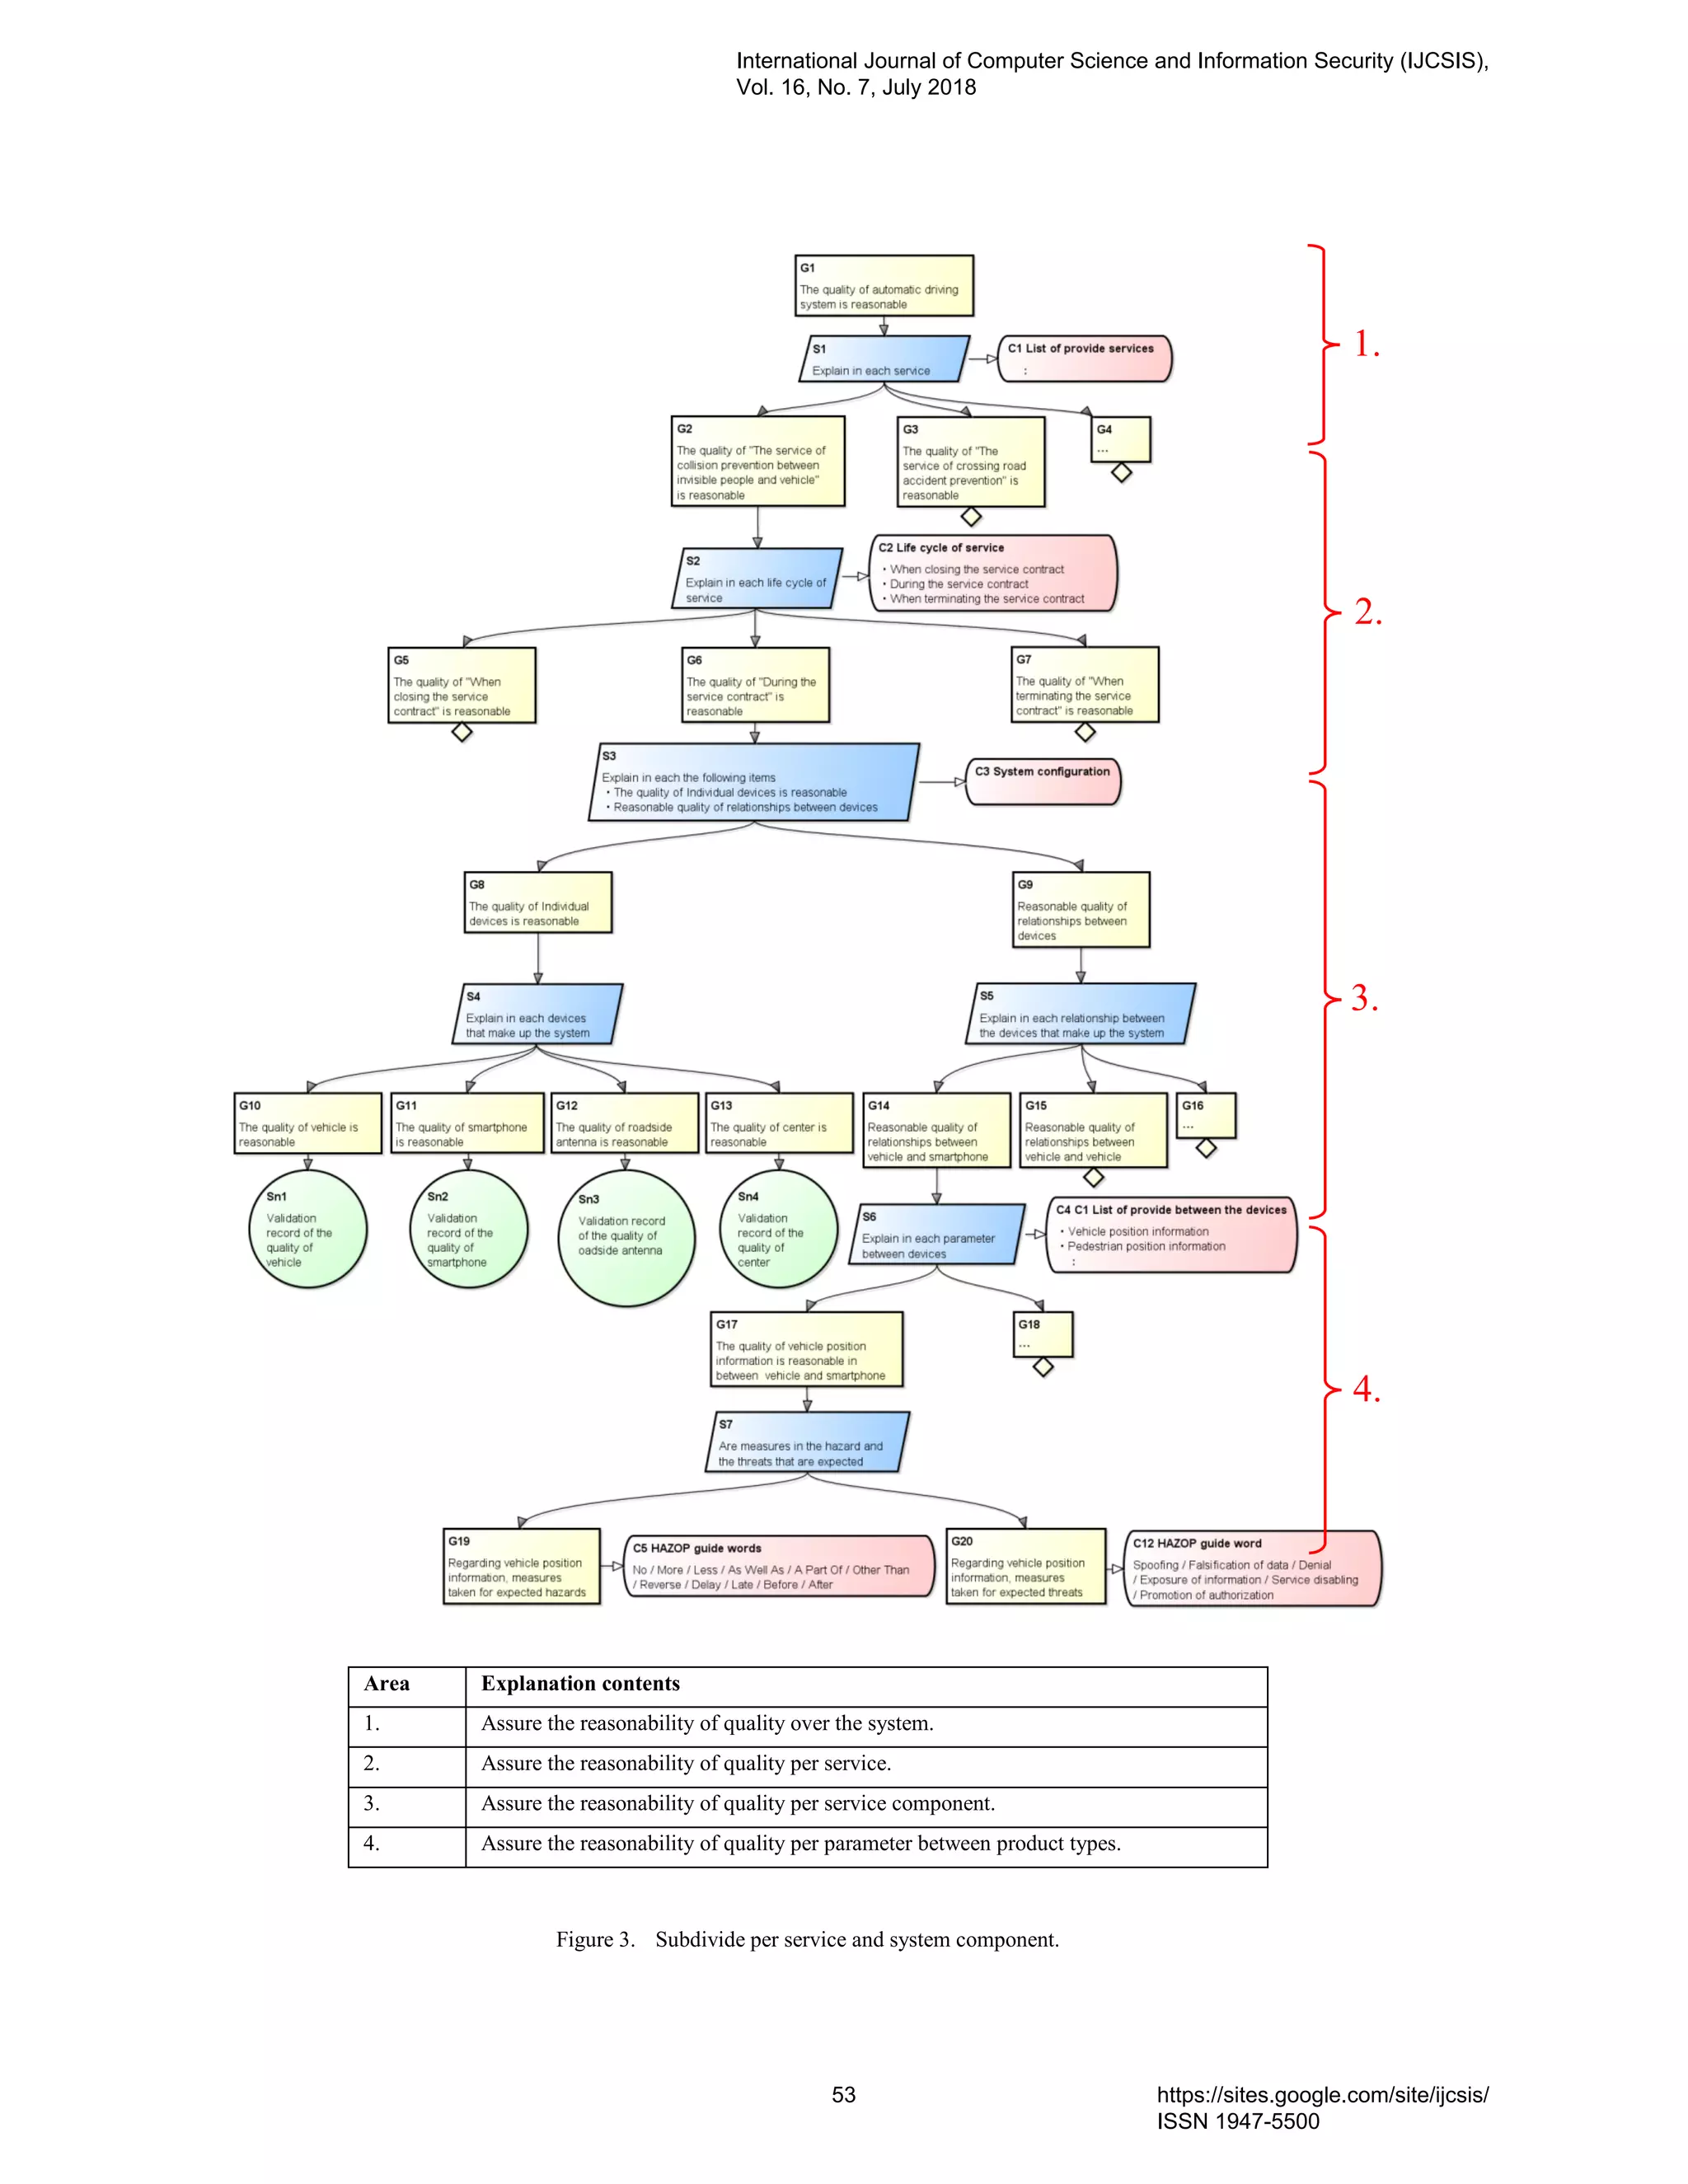
![(2) Assure if a measure is established for a potential hazard of a parameter between devices.
We show the case for explanation to assure if a measure is established for a potential hazard as Fig.5. We
now analyze the parameter of vehicle position information sent and received between devices.
Analysis is conducted in the following sequence:
[Step.5] Description of what is measured hazard expected.
Subdivide per hazard and assure if a measure is established for a potential hazard in sending and receiving a
parameter between devices. We now explain including the vehicle position information.
In order to extract a hazard, we conduct HAZOP analysis by Guide Words. Guide Words included “No /
More / Less / Extra / Insufficiently / Other than / Reverse / Early / Delay / Before / After”.
We apply Guide Words to parameters to extract a potential hazard. We now assume that there is a period
without any sending and receiving and a period with them since the vehicle position information is a dynamic
parameter as shown in Table IV. We show how we think about it as below.
■ How to consider a dynamic parameter at the time of extracting a hazard.
[Guide Word: Delay]
• Vehicle as well as smartphones (pedestrians) may detect a vehicle position after they reached a
position with high risk of collision since they are moving therefore the connection is “delayed”.
=> Hazard: A vehicle detection is delayed and no warning appears on the smartphone.
[Guide Word: No]
• Even though the connection is established between the vehicle and smartphone, the vehicle position
information “cannot be received”.
=> Hazard: No warning appears when a vehicle is closing.
• Both vehicles and smartphone are moving therefore the vehicle position information “cannot be
received” when they have a long distance each other.
=> Hazard: None
(It is normal not to receive a parameter and any undesirable situation will not occur.)
TABLE VII. RESULTS OF HAZARD EXTRACTION ON VEHICLE POSITION INFORMATION PARAMETERS.
Parameter Characteristics Guide Words Hazard
Vehicle
position
information
Dynamic No No warning appears when a vehicle is closing.
More The smartphone erroneously recognizes the position of the vehicle and issues an
unnecessary warning.
Less The smartphone erroneously recognizes the position of the vehicle and issues an
unnecessary warning.
Extra The smartphone is the illusion that there are multiple vehicles, and multiple
warnings are issued when the vehicle approaches.
Insufficiently Since part of the data is not acquired, the smartphone can’t detect the approach of
the vehicle and does not issue a warning when the vehicle approaches.
Other than The smartphone erroneously recognizes the position of the vehicle and does not
issue a warning when the vehicle approaches.
Reverse The smartphone erroneously recognizes the position of the vehicle and does not
issue a warning when the vehicle approaches.
Early Since the smartphone can’t detect the approach of the vehicle, do not issue a
warning when the vehicle approaches.
International Journal of Computer Science and Information Security (IJCSIS),
Vol. 16, No. 7, July 2018
54 https://sites.google.com/site/ijcsis/
ISSN 1947-5500](https://image.slidesharecdn.com/journalofcomputerscienceijcsisjuly2018fullvolume-180915043348/75/Journal-of-computer-science-ijcsis-july-2018-full-volume-68-2048.jpg)
![Delay A vehicle detection is delayed and no warning appears on the smartphone.
Before Since the smartphone can’t detect the approach of the vehicle, do not issue a
warning when the vehicle approaches.
After Since the smartphone can’t detect the approach of the vehicle, do not issue a
warning when the vehicle approaches.
[Step.6] Analyze the damage factor against a hazard.
We conducted FTA analysis against an extracted hazard of system structure and specify the damage factor.
The results of FTA analysis are shown below.
International Journal of Computer Science and Information Security (IJCSIS),
Vol. 16, No. 7, July 2018
55 https://sites.google.com/site/ijcsis/
ISSN 1947-5500](https://image.slidesharecdn.com/journalofcomputerscienceijcsisjuly2018fullvolume-180915043348/75/Journal-of-computer-science-ijcsis-july-2018-full-volume-69-2048.jpg)
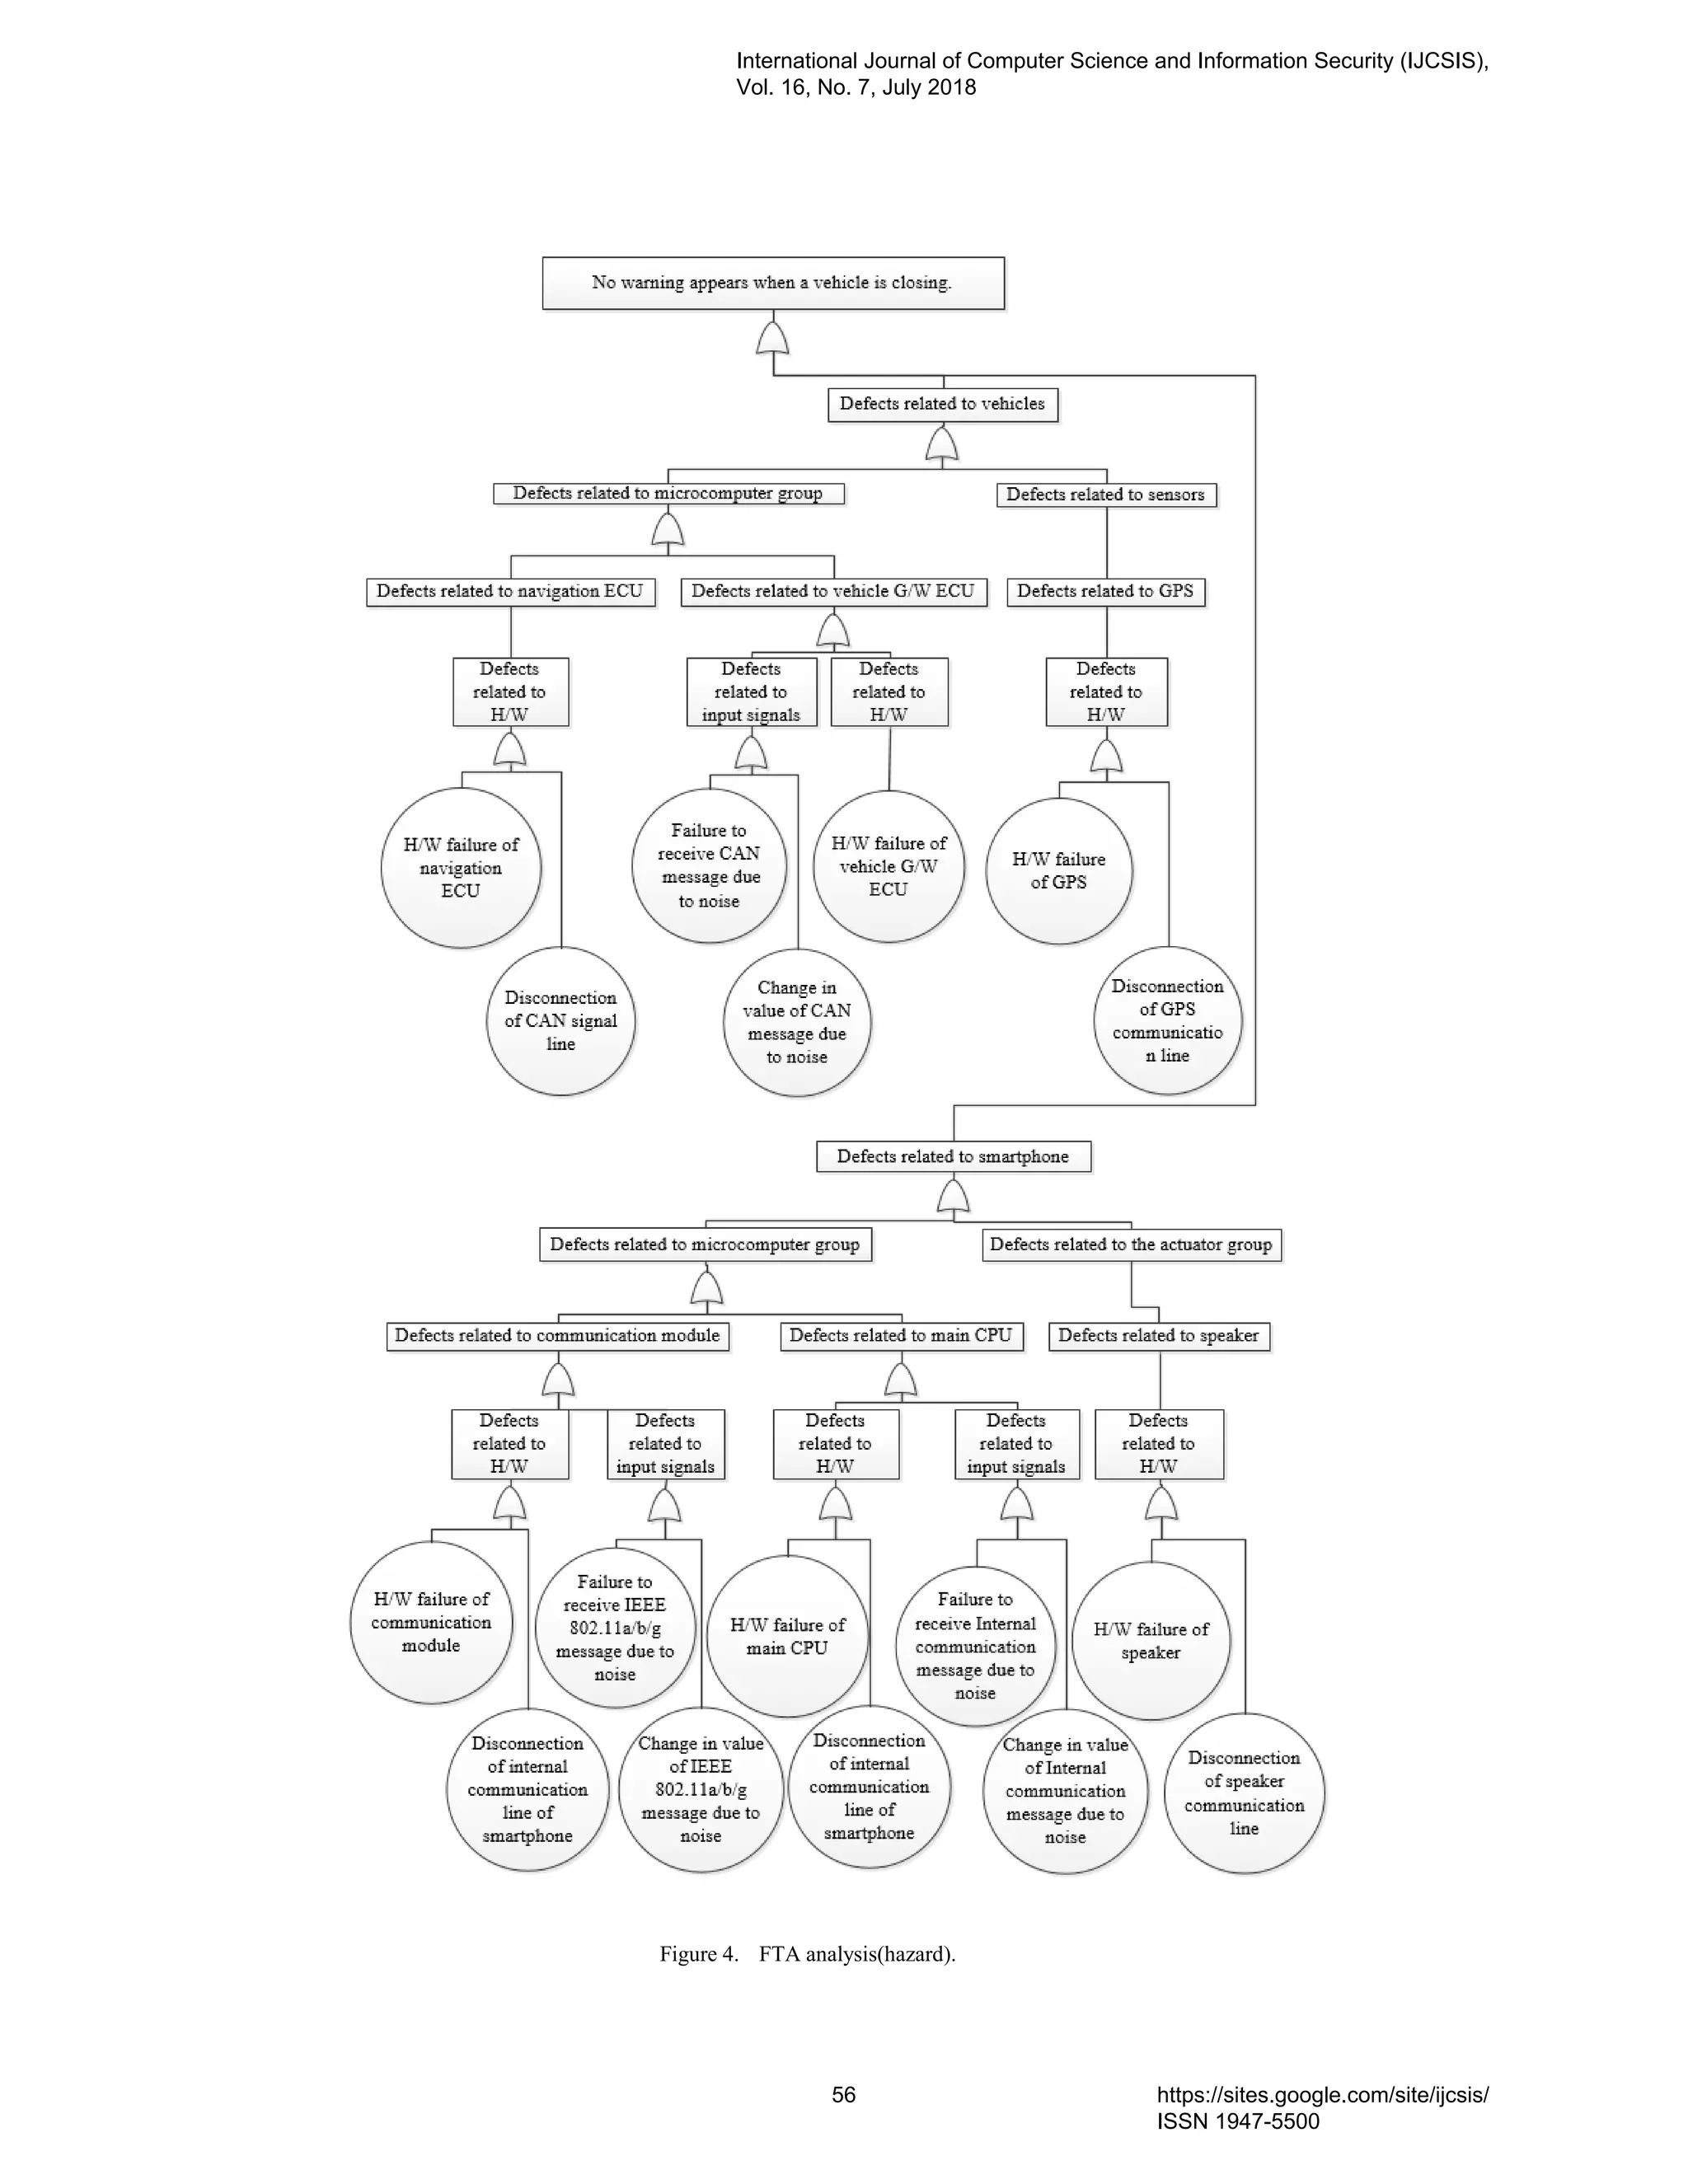
![The following explanation shows a hazard, “no warning appears when a vehicle is closing since the
smartphone cannot detect the closing vehicle”.
[Step.7] Assure if a measure is established for a damage factor.
We consider a measure per damage factor extracted from FTA and explain to assure that a measure is
established for a hazard by linking a record assuring that the measure is involved to a portion where the
measure is required as evidence. The results of the examination of countermeasures and the measures taken
against hazards are shown below.
TABLE VIII. RESULTS OF HAZARD EXTRACTION ON VEHICLE POSITION INFORMATION PARAMETERS.
Countermeasure targets
product type
Factor of hazard Measures
Vehicle Change in value of CAN message due to
noise
Detecting an error in the CRC, to request retransmission
Smartphone Change in value of IEEE 802.11a/b/g
message due to noise
Detecting an error in the CRC, to request retransmission
International Journal of Computer Science and Information Security (IJCSIS),
Vol. 16, No. 7, July 2018
57 https://sites.google.com/site/ijcsis/
ISSN 1947-5500](https://image.slidesharecdn.com/journalofcomputerscienceijcsisjuly2018fullvolume-180915043348/75/Journal-of-computer-science-ijcsis-july-2018-full-volume-71-2048.jpg)
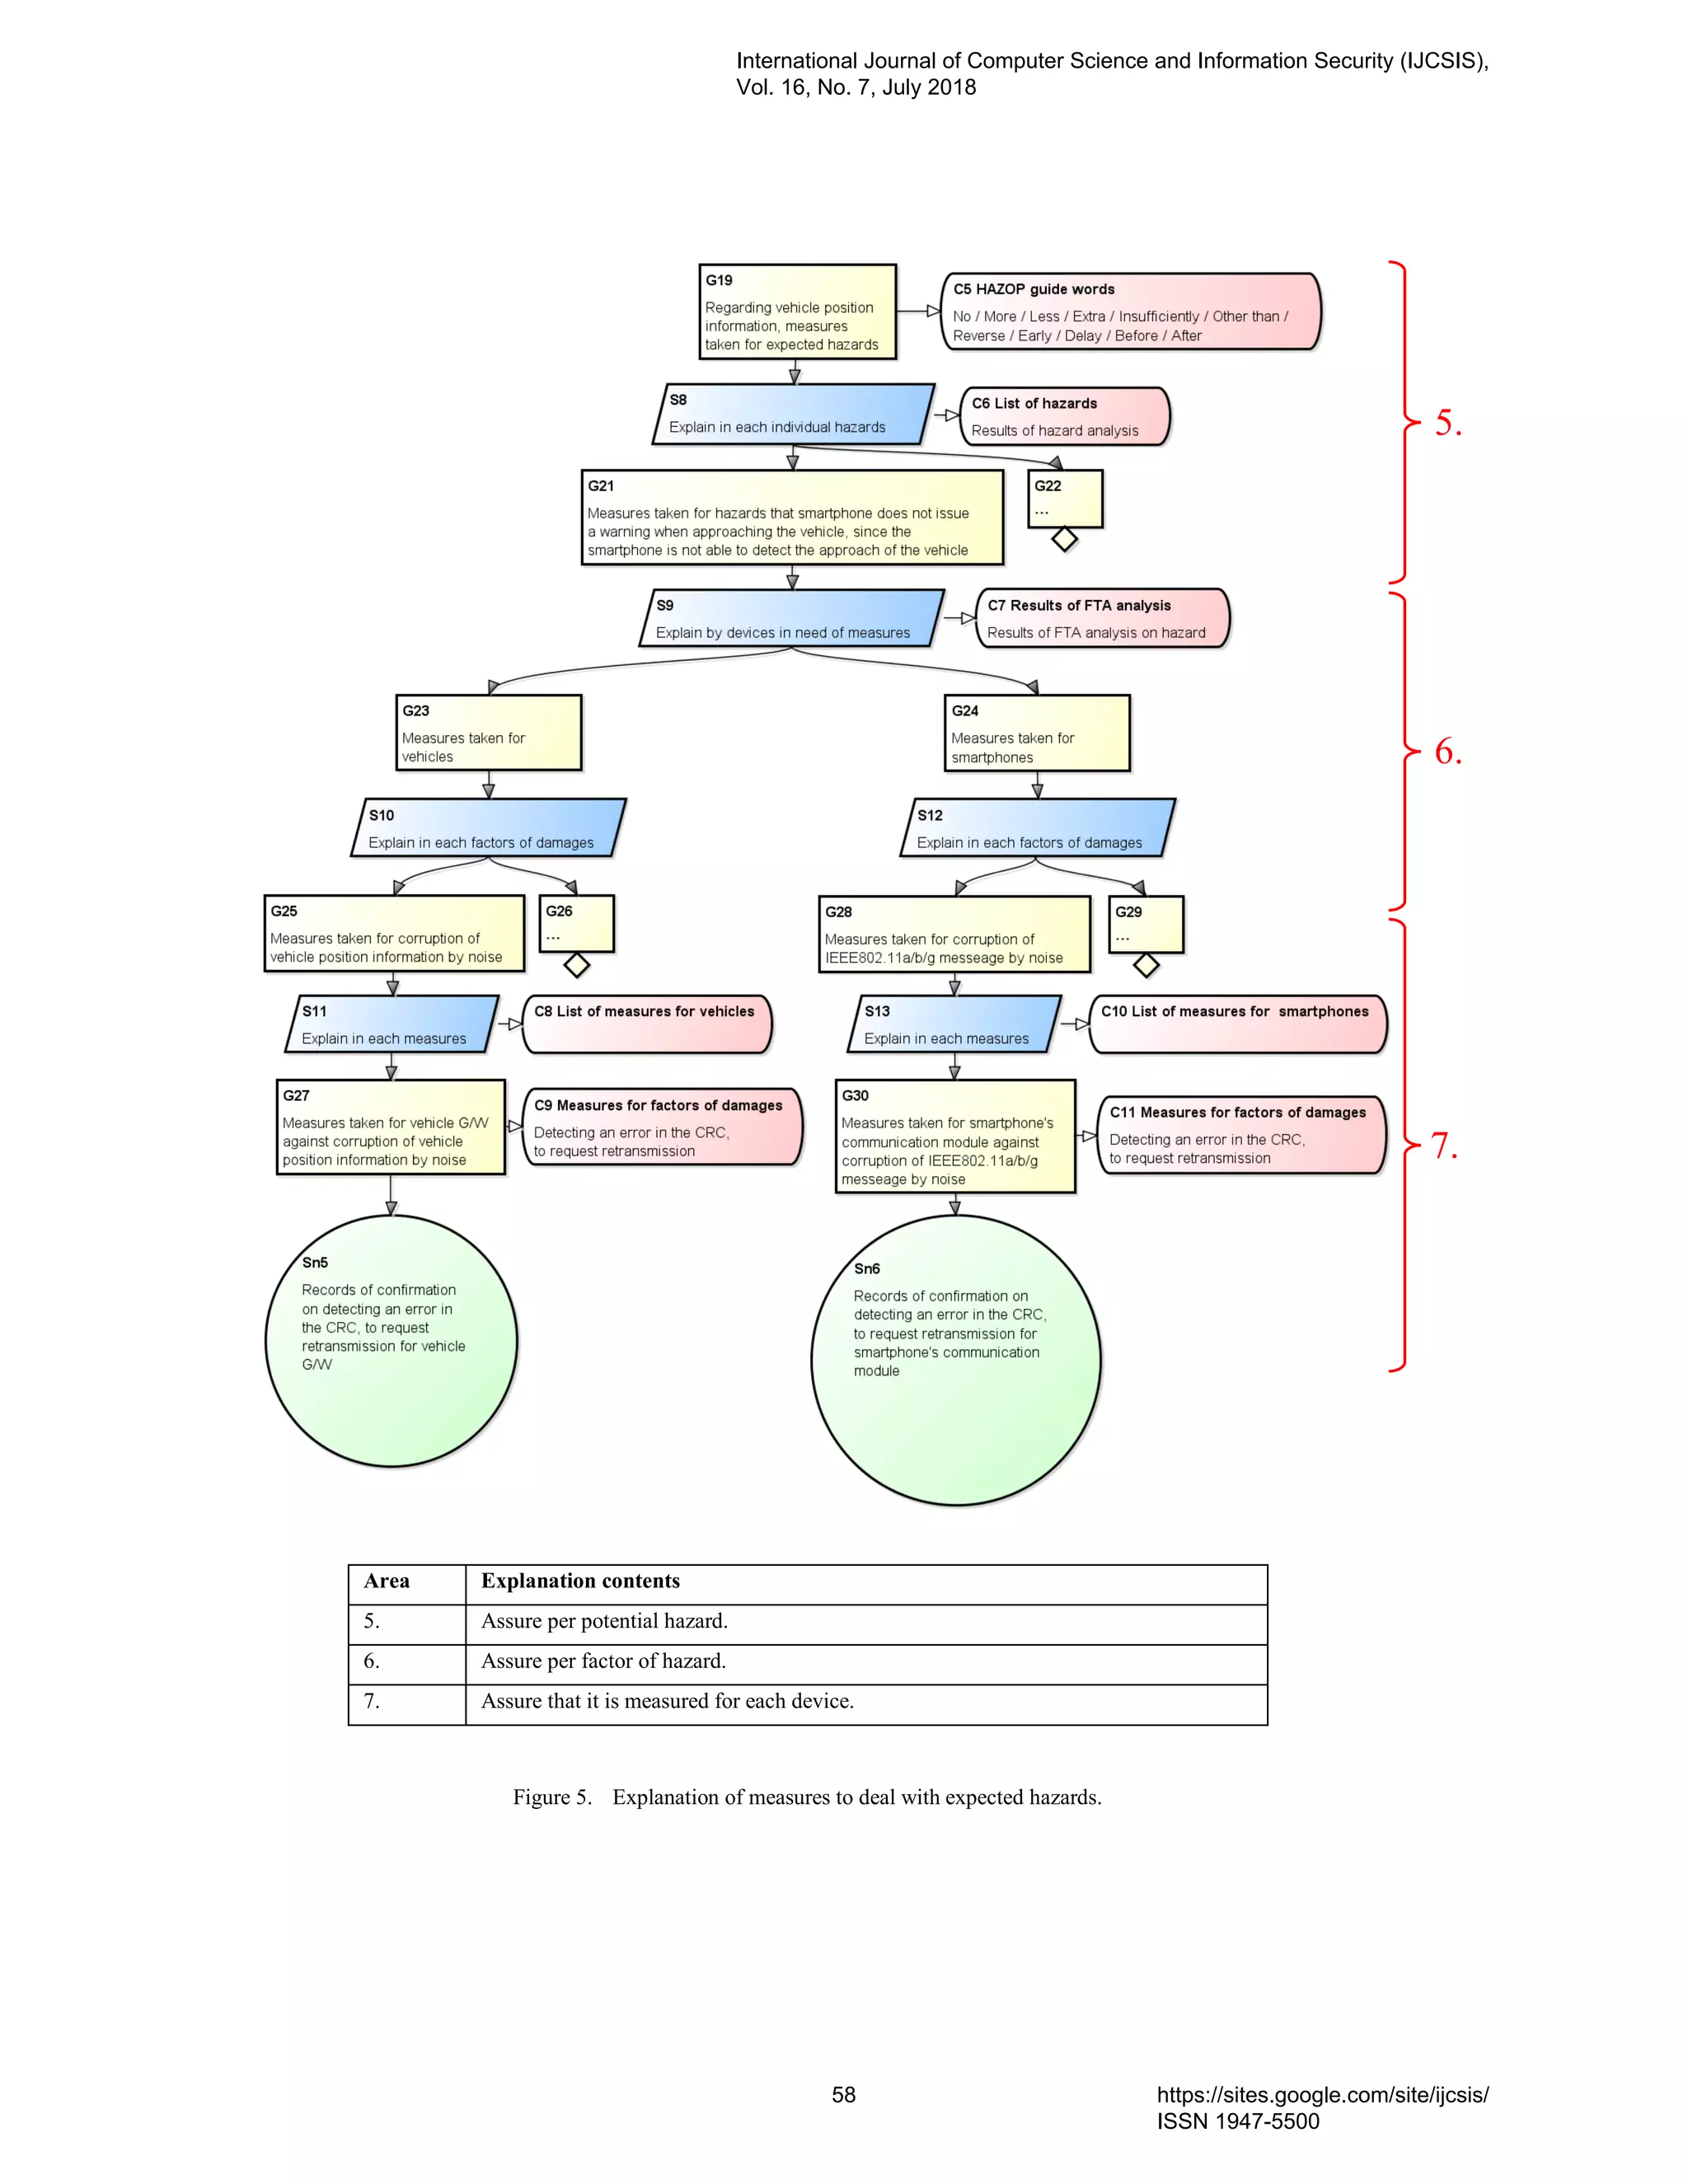
![(3) Assure if a measure is established for a potential threat of a parameter between devices.
Fig.7 shows an illustrative case of dealing with expected threats. Here, vehicle position information
parameters which are sent and received between devices are analyzed.
Analysis is conducted in the following sequence:
[Step.8] Description of what is measures threat expected.
Regarding sending and receiving of parameters between devices, confirm that measures have been taken for
expected threats by decomposing into individual threats. Here, the explanation is given using vehicle position
information.
In order to identify threats, HAZOP analysis is conducted using Guide Words. For Guide Words, “Spoofing
/ Tampering / Repudiation / Information Disclosure / Denial of Service / Elevation of Privilege” are used.
Moreover, since vehicle position data are dynamic parameters, identification of threats is conducted taking
into consideration of their characteristics, as with hazards. The results of extracting assumed threats are shown
below.
TABLE IX. ANALYSIS OF FACTORS OF THREAT.
Parameter Characteristics Guide Words Threat
Vehicle
position
information
Dynamic Spoofing A third party transmits unauthorized vehicle position information,
and the smartphone gives an unnecessary warning.
Tampering A third party transmits unauthorized vehicle position information,
and the smartphone gives an unnecessary warning.
Repudiation Not applicable. (Since the authentication of transmission content is
not done)
Information Disclosure Third parties eavesdrop on vehicle position information and
personal information such as vehicle ID is stolen.
Denial of Service The vehicle position information can’t be transmitted, and the
smartphone can’t issue a warning when the vehicle approaches.
Elevation of Privilege A third party transmits unauthorized vehicle position information,
and the smartphone gives an unnecessary warning.
[Step.9] Analysis of factors of threat.
For the identified threats, FTA analysis is conducted using the system composition, to identify factors
which give threats to the system. The results of FTA analysis are shown below.
International Journal of Computer Science and Information Security (IJCSIS),
Vol. 16, No. 7, July 2018
59 https://sites.google.com/site/ijcsis/
ISSN 1947-5500](https://image.slidesharecdn.com/journalofcomputerscienceijcsisjuly2018fullvolume-180915043348/75/Journal-of-computer-science-ijcsis-july-2018-full-volume-73-2048.jpg)
![Figure 6. FTA analysis(threats).
In the explanation below, the threat that “A third party eavesdrops vehicle position information, and
information such as vehicle IDs is stolen” is taken up.
[Step.10] Confirmation of measures to deal with the factors of threats.
Examine measures for each factor of threats identified from FTA, and explain that measures have been
taken to deal with threats by linking, as evidence, the record of confirmation that such measures are
incorporated in the necessary places. The results of the examination of countermeasures and the measures
against threats are shown below.
TABLE X. RESULTS OF THREAT EXTRACTION ON VEHICLE POSITION INFORMATION PARAMETERS.
Countermeasure targets
product type
Factor of threat Measures
Vehicle Eavesdropping of IEEE 802.11a/b/g radio
waves
Encryption of telecommunications contents
of IEEE 802 11a/b/g
Smartphone Eavesdropping of IEEE 802.11a/b/g radio
waves
Encryption of telecommunications contents
of IEEE 802 11a/b/g
International Journal of Computer Science and Information Security (IJCSIS),
Vol. 16, No. 7, July 2018
60 https://sites.google.com/site/ijcsis/
ISSN 1947-5500](https://image.slidesharecdn.com/journalofcomputerscienceijcsisjuly2018fullvolume-180915043348/75/Journal-of-computer-science-ijcsis-july-2018-full-volume-74-2048.jpg)
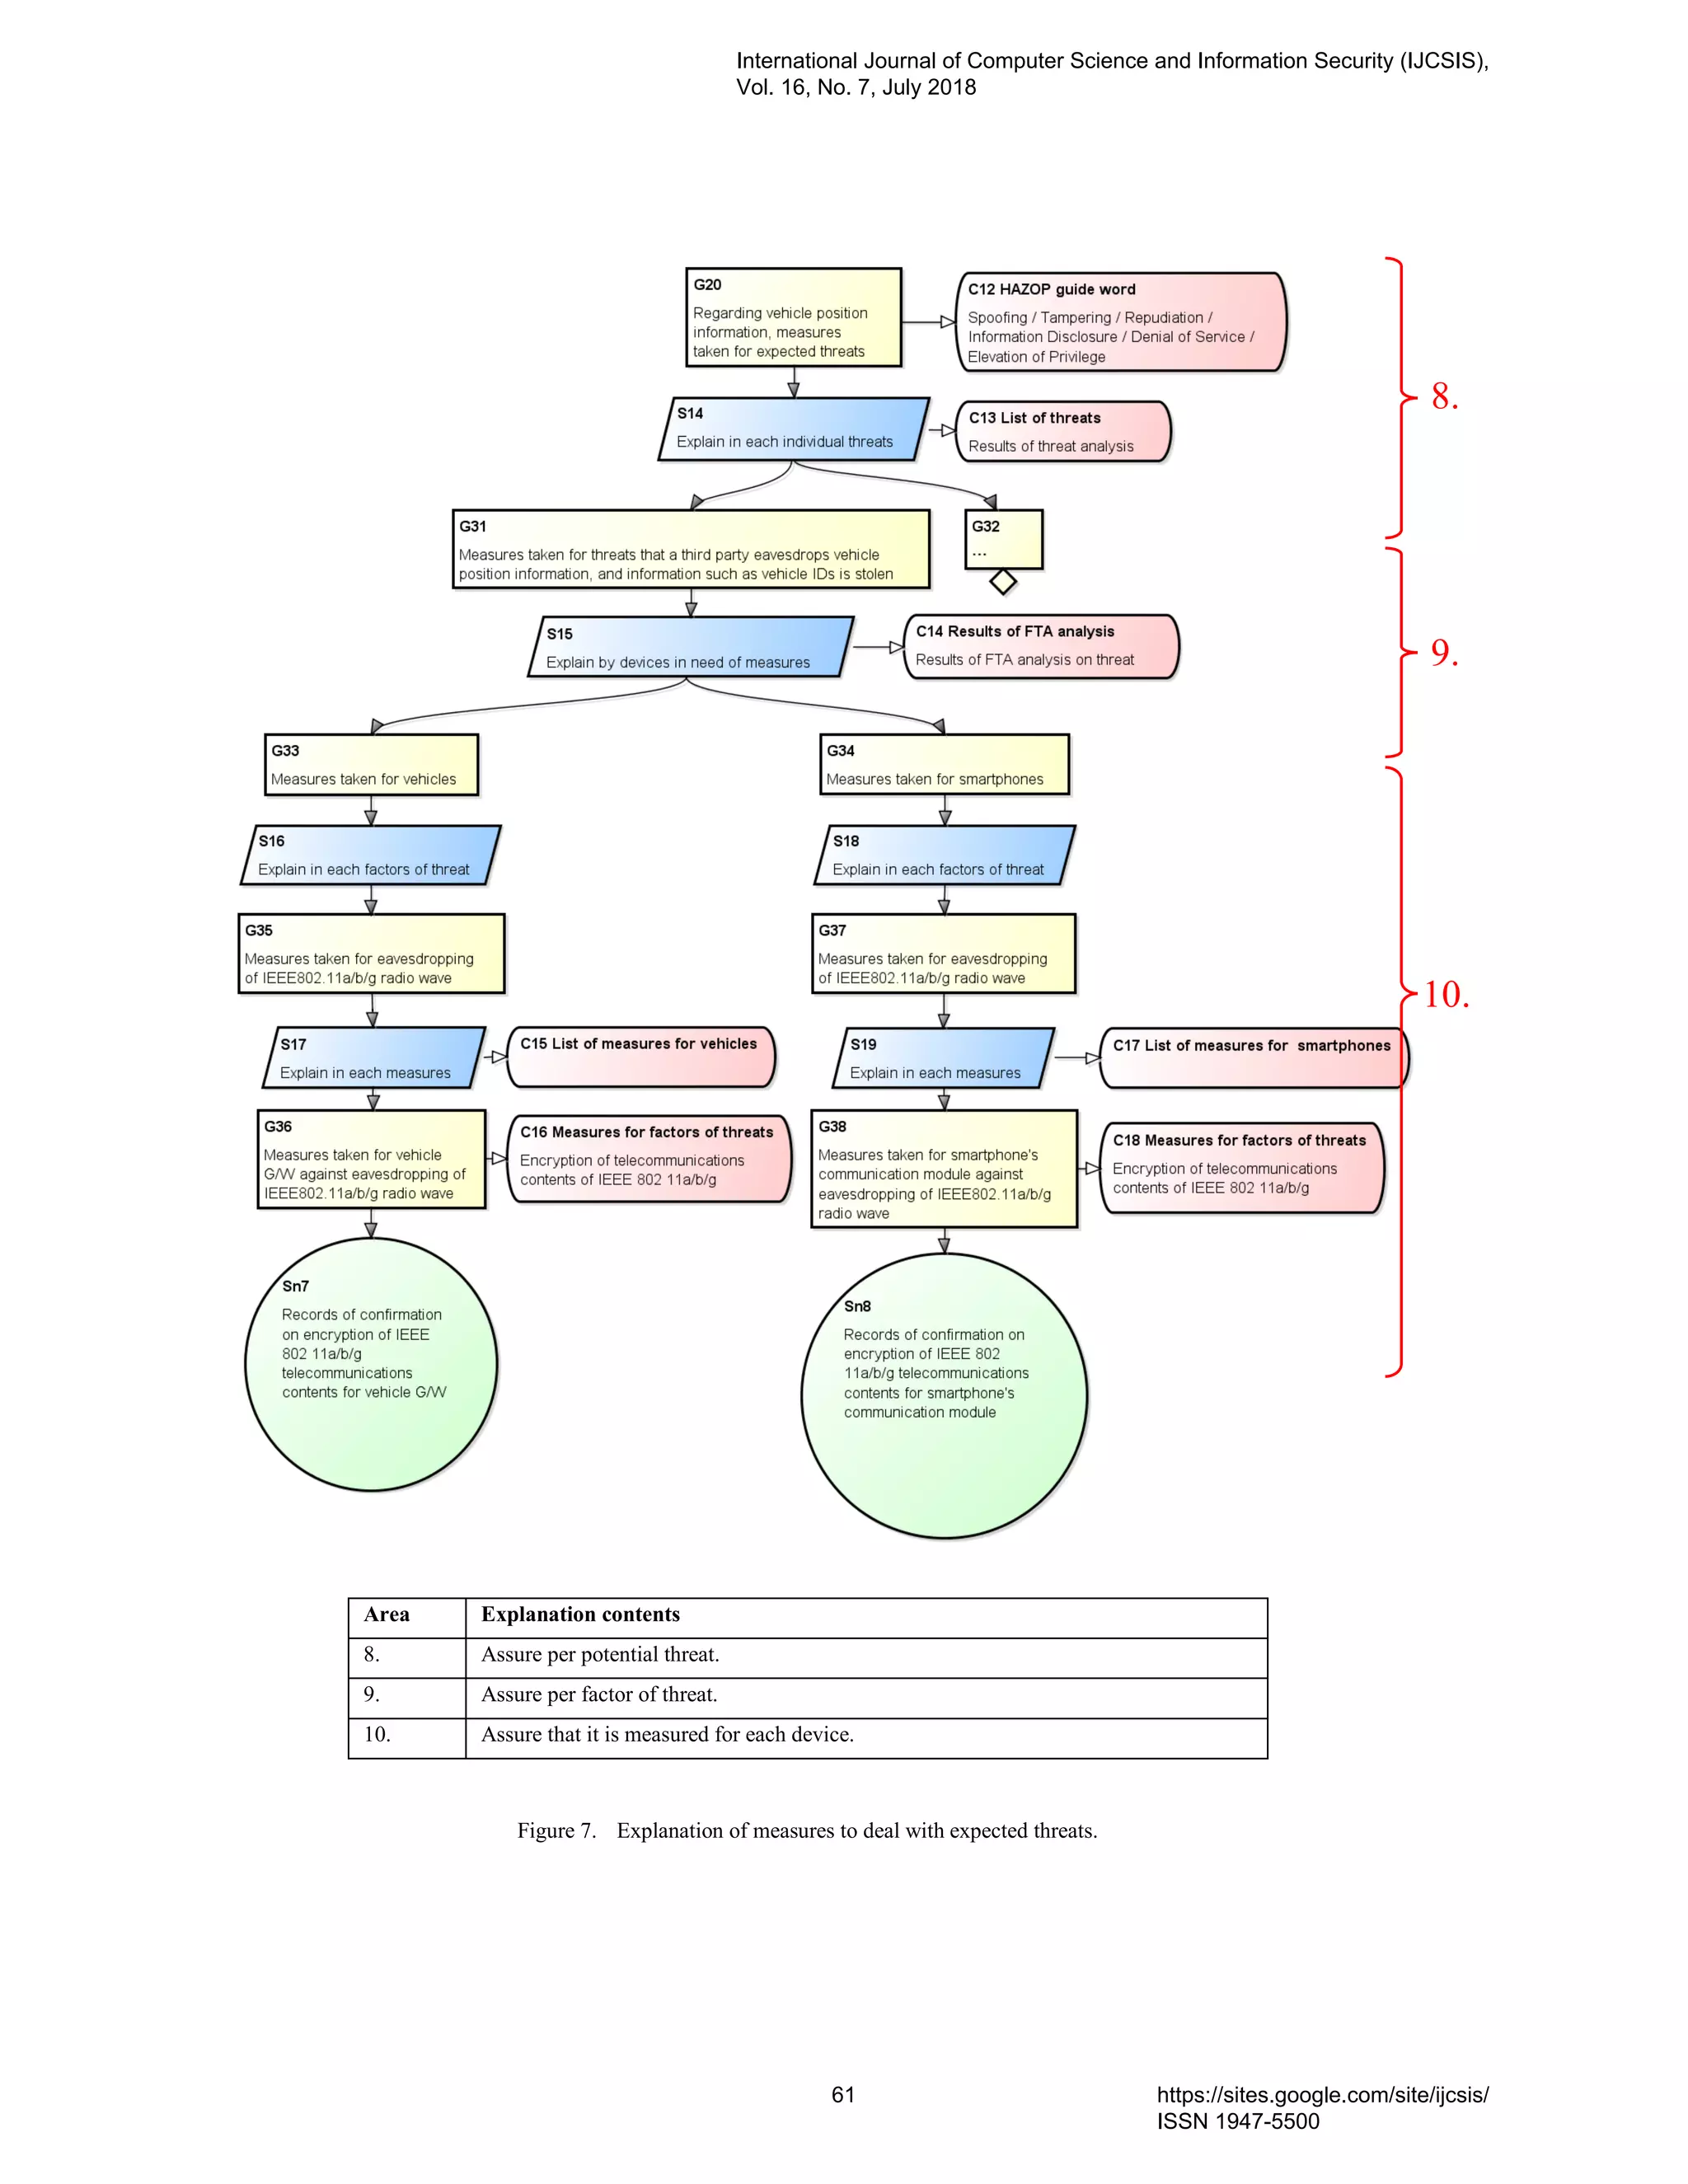
![(4) Assure if a measure is established for against conflict of actuator operation between the services.
In [Step 1], we decided to describe the quality of the entire system by service. However, since multiple
services actually operate at the same time, it is necessary to explain that the quality of the relationship
between the services is appropriate.
[Step.11] Add quality check of relationship between services.
We decompose the top goal “the quality of the automatic operation system is reasonable” into “the quality
of each provided service is reasonable” and “the quality of the relationship between the provided services is
reasonable”. For quality confirmation of individual services, combine the GSNs confirmed in [Step 2] - [Step.
10] as they are.
[Step.12] Confirmation of service that instructs operation for the same product type.
It is conceivable that multiple services simultaneously refer to devices and parameters used by each service.
However, there is no big problem if only reference. The problem is competition against actuator operation
such that a plurality of services simultaneously operates the steering of the vehicle. Organize product
categories for which each service instructs operation and extract combinations of services that instruct
operation of the same product type.
[Step.13] Confirmation of services that instruct operation to the same actuator.
Furthermore, a combination of services instructing operation to the same actuator is extracted.
[Step.14] Confirmation that countermeasures against the contention of operation instructions can be taken.
We explain how measures can be taken against action instruction conflicts by considering countermeasures
at every competition of action instructions and associating the record confirming that the countermeasure is
incorporated as evidence.
The results of confirmation are shown below
International Journal of Computer Science and Information Security (IJCSIS),
Vol. 16, No. 7, July 2018
62 https://sites.google.com/site/ijcsis/
ISSN 1947-5500](https://image.slidesharecdn.com/journalofcomputerscienceijcsisjuly2018fullvolume-180915043348/75/Journal-of-computer-science-ijcsis-july-2018-full-volume-76-2048.jpg)
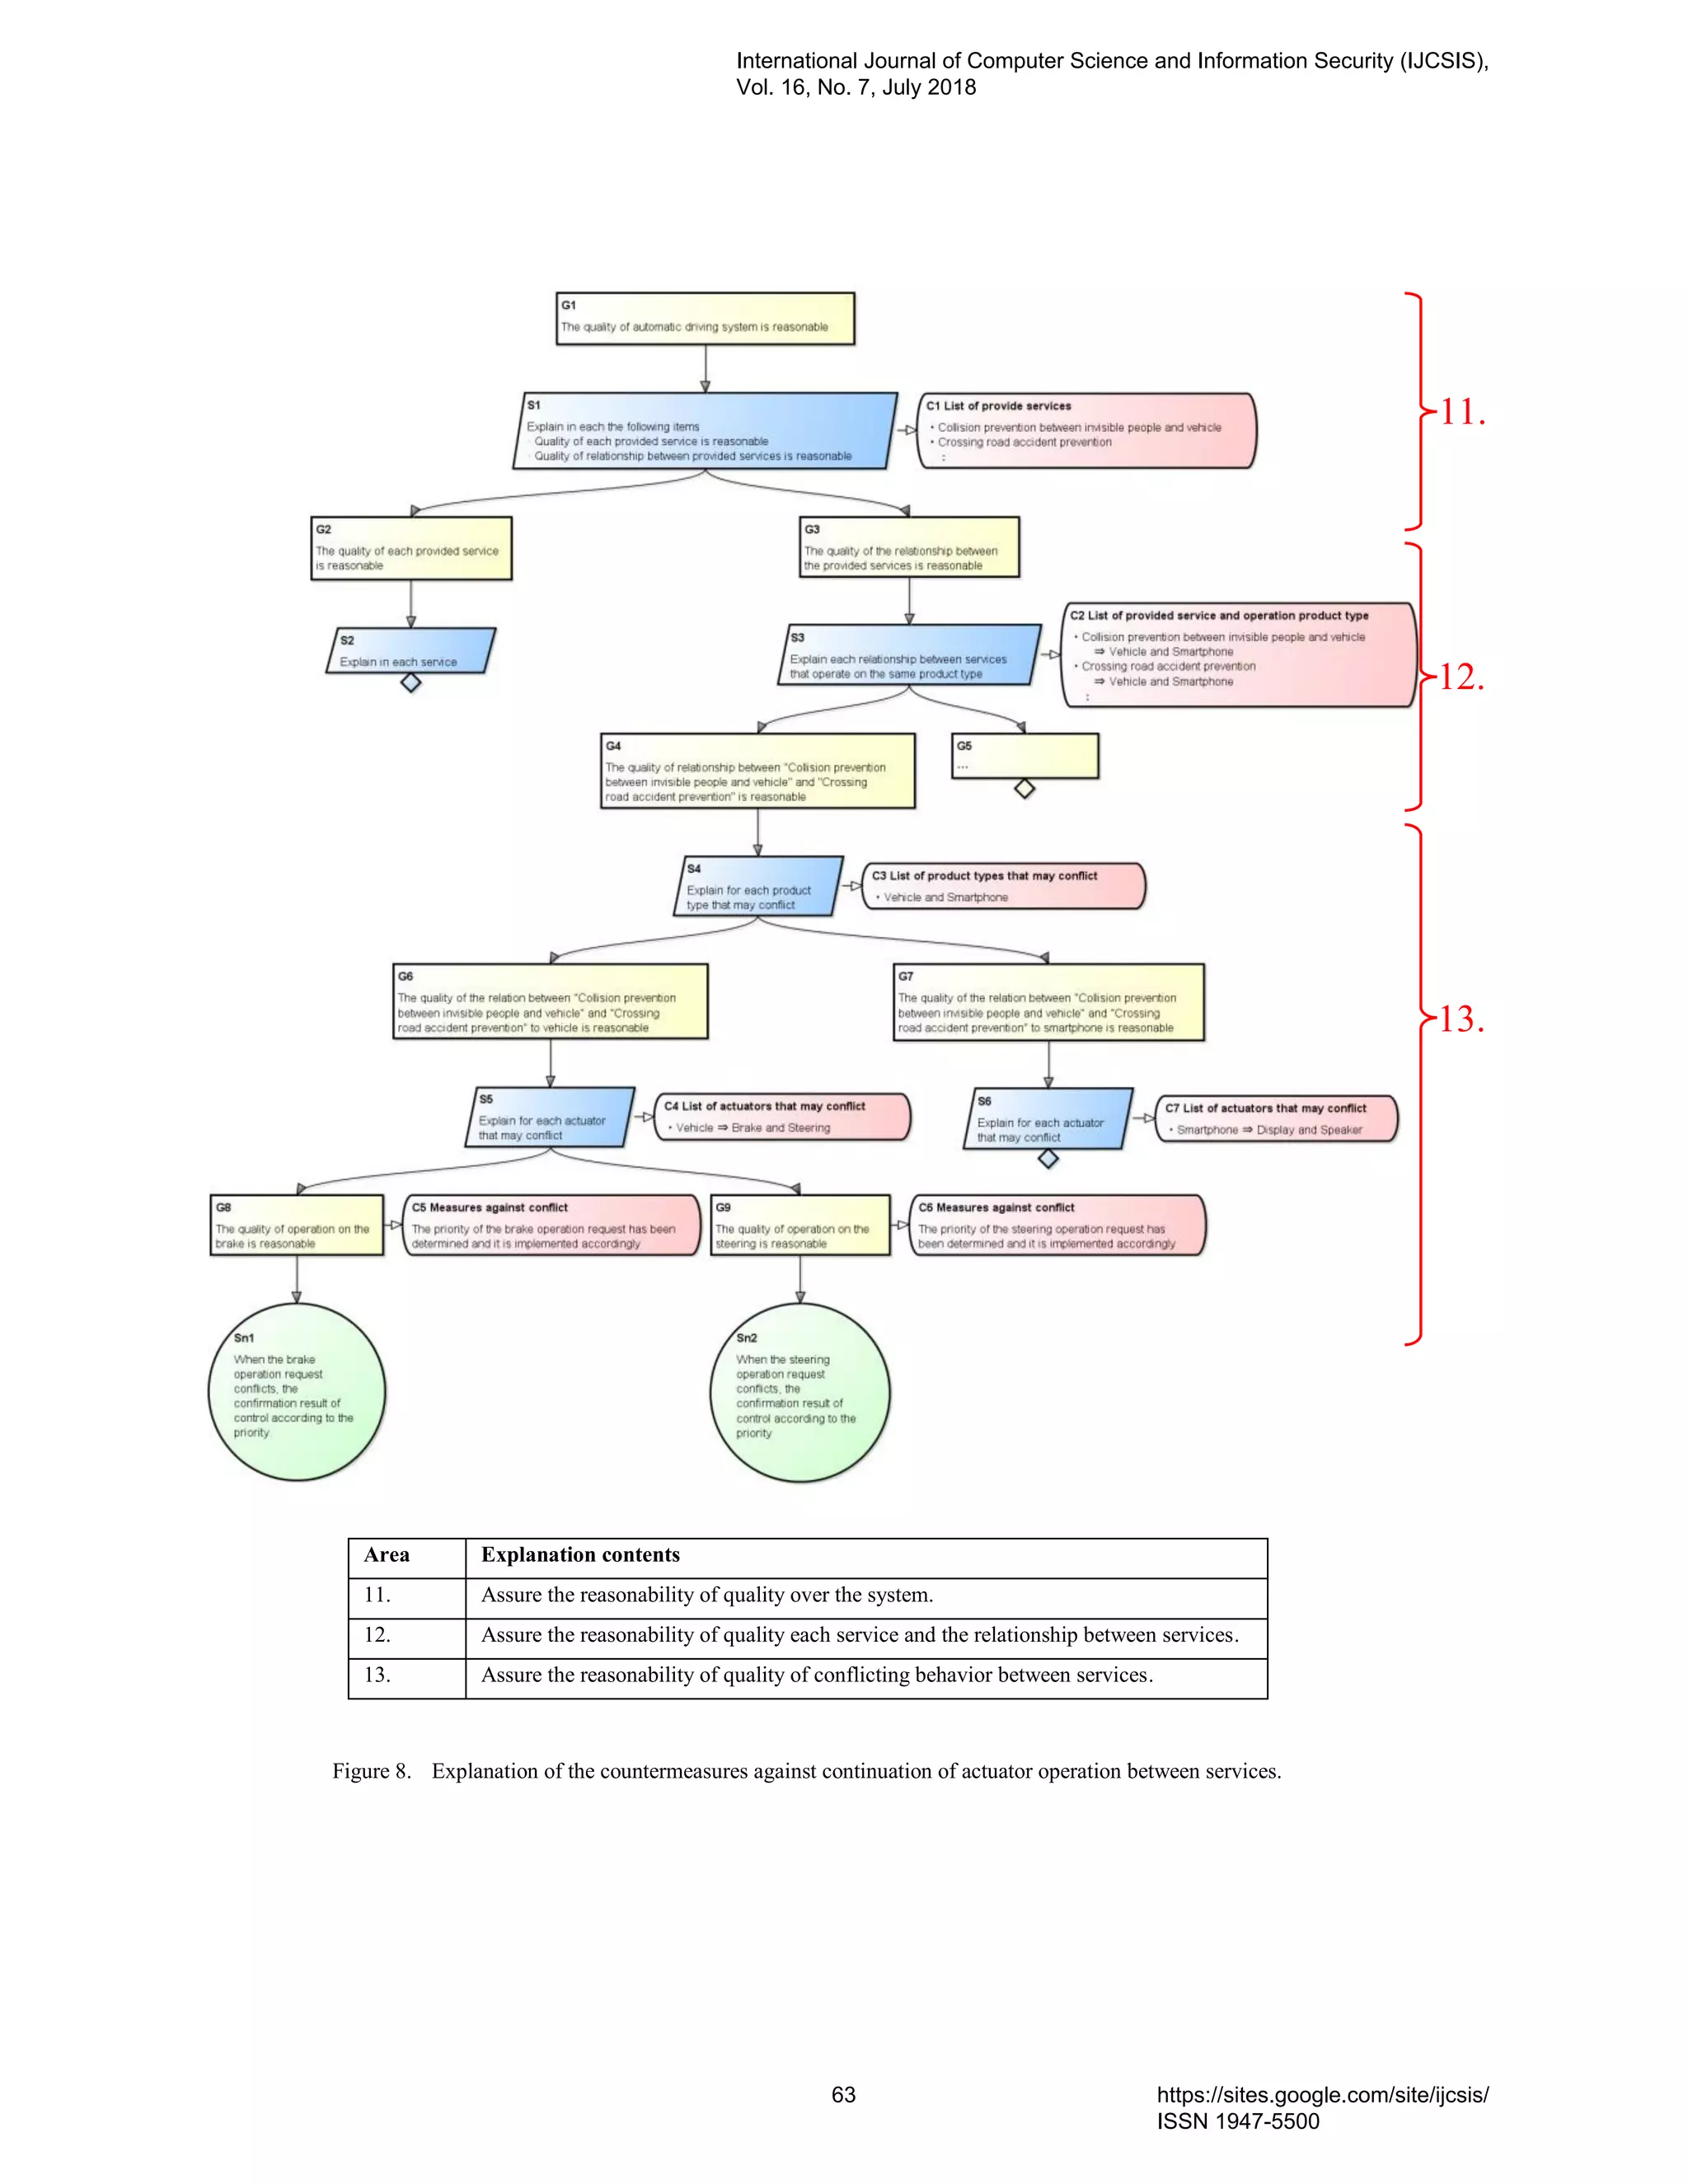

![and objectively explain the adequacy of the design quality of each system based on the preconditions and the
evidence It has been confirmed.
At the time of confirmation, measures to deal with the risks and threats expected in relation between the
products in the automatic operation system and explanation items on items to be explained mutually among
the products were set. By standardizing such explanation system and sharing among the companies, it is
necessary to have a common understanding between companies, predict the product quality necessary for
collaborating with the system in advance, and to prevent malfunction due to the difference in corporate
culture I think that I can do it.
ACKNOWLEDGMENT
I would like to express my sincere gratitude to D-Case Study Group member who gave us a valuable
opinion. And I am very grateful to the mine company’s colleagues who cooperate with the safety analysis.
REFERENCES
[1] M.Tokoro, Dependable Operating Systems for Embedded Systems Aiming at Practical Applications, 2010 Japan Science and
Technology Agency, 2010
[2] R.Alexander, T.Kelly, Z.Kurd, and J.McDer-mid, Safety cases for advanced control software: Safety Case Patterns, Technical report,
Department of Computer Science, University of York, 2007
[3] T.Kelly, R.Weaver, The goal structuring notation - a safety argument notation, In Proceedings of the Dependable Systems and
Networks 2004 Workshop on Assurance Cases, July 2004
[4]T.Kelly, Arguing Safety - A Systematic Approach to Safety Case Management, Department of Computer Science, University of York,
YCST99-05, 1998.
[5] GSN contributors. GSN community standard version 1.0, http://www.goalstructuringnotation.info, 2011
[6] R,Hawkins, T.Kelly, A Software Safety Argument Pattern Catalogue, Technical Report, Department of Computer Science, University
of York, YCS-2013-482, 2013
[7] Y.Matsunoand, S.Yamamoto, A Framework for Dependability Consensus Building and In-OperationAssurance, Journal of Wireless
Mobile Networks, Ubiquitous Computing, and Dependable Applications (JoWUA), vol. 4, no. 1, pp. 118–134, 2013
[8] T.Dimitrakos, B.Ritchie, D.Raptis, K.Stolen, Model Based Security Risk Analysis for Web Applications: The CORAS Approach,
Proceedings of the EuroWeb 2002, st Anne’s College, Oxford, UK. Electronic Workshops in Computing vol. British Computer
Society, 2002
[9] P.Fenelon, B.D.Hebbron, Applying HAZOP to software engineering models. In Risk Man- agement And Critical Protective Systems,
Proceedings of SARSS 1994, Altrincham, England, pp. 1/1–1/16, The Safety a
nd Reliability Society, 1994
[10]T.Srivatanakul, Security analysis with deviational techniques, Department of Computer Science, University of York, UK, YCST-
2005-12, 2005
[11]I.Habli et al, Model-Based Assurance for Justifying Automotive Functional Safety, Proceedings of the 2010 SAE World Congress,
Detroit, Michigan, USA, 2010
[12]V.Patua, S.Yamamoto, How to develop Security Case by combining real life security experiences (evidence) with D-Case, 17th
International Conference in Knowledge Based and Intelligent Information and Engineering Systems – KES2013, 2013
[13]M.Matsumura, S.Morisaki, N.Astumi, S.Yamamoto, A Comparative capability analysis on the context description methods for CDM,
KBSE Conference, IEICE-KBSE2014-30, IEICE-114, no.292, pp. 13-18, 2014 (in Japanese)
[14]S,Yamamoto, A knowledge integration approach of safety-critical software development and operation based on the method
architecture, 18th International Conference on Knowledge-Based and Intelligent Information & Engineering Systems - KES2014,
2014
[15]F.Ding, S.Yamamoto, N.Abrahim, The Method of D-Case Development Using HAZOP Analysis on UML Models, Knowledge-
Based Software Engineering Communications in Computer and Information Science Volume 466, pp.617-629, 2014
International Journal of Computer Science and Information Security (IJCSIS),
Vol. 16, No. 7, July 2018
65 https://sites.google.com/site/ijcsis/
ISSN 1947-5500](https://image.slidesharecdn.com/journalofcomputerscienceijcsisjuly2018fullvolume-180915043348/75/Journal-of-computer-science-ijcsis-july-2018-full-volume-79-2048.jpg)
![Abstract—Educational institutions are making use of academic management apps to satisfy the needs of their stakeholders.
Perceived usability of such apps determines their sustainability, and thus there is an urgent need for usability scholars to
develop benchmarks for comparisons. Research in app usability in the academic realm is scarce, and it is even more scarce
for Arabic apps. This research calls to build a database of usability evaluation findings of academic management apps
using a standard usability tool that is adapted to the Arabic language. A case study is administered at the Public Authority
for Applied Education and Training (PAAET) in Kuwait. The Arabic System Usability Scale (A-SUS) questionnaire which
is an adaptation of the standard System Usability Scale (System Usability Scale) is used to evaluate female students per-
ceived usability of PAAETs’ “Smart PAAET” app. Results are employed in two folds: to evaluate the perceived usability
of the app, and to start a repository of perceived usability data for Arabic academic apps. By using A-SUS, results will
contribute to the ultimate goal of establishing system usability benchmarks.
Keywords- App Usability; System Usability Scale; SUS; Standard Usability Questionnaire; Arabic-System Usability Scale,
A-SUS; Usability Benchmarks; Academic Management App.
I. INTRODUCTION
Database repositories of standard system usability evaluation results is essential. They are used in software engineer-
ing to compare against previous studies to ensure the quality of systems. Usability results of software are used as part
of a learning process, patterns of previous studies are compared with the ultimate goal of enhancing the system under
focus [1] [2]. Such data is collected over time and space, spanning diverse genres for the purpose of generalization and
establishing benchmarks for each system.
Smartphones and their mobile applications are considered systems. The mobile application industry is expanding
and app users are increasing at a great scale [3]. This is evident in the increase number of app downloads for all
platform users [4]. Smartphones and apps revolutionised how things are being done, [5] specifically in the current era
of technological advancement [5] [6]. Usability of these apps is crucial as it represents a users satisfaction of the app.
Specifically if these apps are integrated within the processes of an educational institution, as these apps may either
facilitate users experiences or add to their frustration. A specific process needs to be followed to ensure the apps quality
[6]. Usability evaluation is used as a mean to ensure quality, and quality in return ensures continuous use of the app.
There is a need to keep users from various stakeholder categories engaged, satisfied and continue using the app. This
need is extended to academic management apps to support the academic process.
The paper starts with an outline of a literature review of standard usability questionnaires, and translations of stand-
ard tools to languages other then English. The literature review emphasises that the Arabic region lacks research in
perceived usability and standard usability tools, and an overview specifically SUS is presented. To help advance the
Arabic region in usability studies a standard usability tool is administered on “Smart PAAET” app. This study presents
a female student perspective of usability evaluation of an academic management app. It is administered using the
Arabic-System Usability Scale (A-SUS) tool [7]; an Arabic adaptation of the standard System Usability Scale (SUS)
International Journal of Computer Science and Information Security (IJCSIS),
Vol. 16, No. 7, July 2018
67 https://sites.google.com/site/ijcsis/
ISSN 1947-5500](https://image.slidesharecdn.com/journalofcomputerscienceijcsisjuly2018fullvolume-180915043348/75/Journal-of-computer-science-ijcsis-july-2018-full-volume-81-2048.jpg)
![[1][8]. “Smart PAAET” app is an academic management app that is specifically developed for users of the Public
Authority for Applied Education and Training (PAAET) in Kuwait. The research conducts psychometric evaluation
on the perceived usability data of “Smart PAAET” app. Which will contribute to the ultimate goal of building a
corpus of research administered on A-SUS, with hope of establishing benchmarks for usability practitioners, and
scholars that are of need of usability questionnaires administered in the Arabic native language. Results are then
presented followed by a discussion of the empirical implementation of A-SUS. The paper concludes that there is a
need to promote future work in the field of app usability, and continue collecting data for the usability database,
specifically on native Arabic language speakers using Arabic usability tools.
II. LITRERATURE REVIEW
A. Standard Usability Tools
Usability is a multidimensional construct that is context specific, where it is defined as the effectiveness, efficiency
and ease of use of a specific system in a specific context [9]. Usability evaluation results vary according to the system's
environment and the participants involved in the evaluation process. Where usability measure is conducted at any
point of system development [10] [11]; as it serves a specific goal at each development phase. Using standard usability
tools after an initial launch of an app, developers and clients will have a prominent way to gain initial acceptance of
its usability. The advantage of specifically using a standard tool is that there is common understanding of how the
evaluation is to be performed, and how to interpret the results. Employing this act as part of system development
promotes the overall usability of the system [6].
Standard usability tools are a reliable mean to evaluate the usability of systems [12] [13]. They are developed by
practitioners and scholars to measure usability with confidence. Various literature in standard usability is evident with
documented processes, approaches and findings [7][11][14][15][16][17]. Many usability practitioners and scholars
are adopting and adapting standard tools as part of their practice because they appreciated the reliability of their results
[13]. Most standard usability tools that evaluate user perceptions are in the form of questionnaires [13]. Standard
usability questionnaires use psychometric methodologies. There is a need to prove that these questionnaires are relia-
ble, valid, and sensitive [14]. Results of such studies are used to set benchmarks that are beneficial for system com-
parison. A usability benchmark of a system in a specific environment from a certain perspective and goal informs the
system developers if improvements are needed.
Standard usability questionnaires if followed correctly can be conducted and interpreted in a fast, and simple man-
ner. The literature is evident with various standard usability questionnaires in the English language. The most com-
monly used are the System Usability Scale (SUS) [1][15], Computer System Usability Questionnaire (CSUQ) [15],
Usability Metric for User Experience (UMUX) [13], Usability Metric for User Experience Light (UMUX-Light) [12],
and Post-Study System Usability Questionnaire (PSSUQ) [15][16][17].
International Journal of Computer Science and Information Security (IJCSIS),
Vol. 16, No. 7, July 2018
68 https://sites.google.com/site/ijcsis/
ISSN 1947-5500](https://image.slidesharecdn.com/journalofcomputerscienceijcsisjuly2018fullvolume-180915043348/75/Journal-of-computer-science-ijcsis-july-2018-full-volume-82-2048.jpg)
![B. Translations of Usability Tools in Arabic Language
Usability questionnaires are used globally in different countries by different language speakers. However, usability
practitioners find that it can be beneficial if these standard tools are adapted to the native language of the users [7] [8]
[18] [19] [20] [21] [22] [23].
The literature shows how these tools have been transformed into the native language of the participants. Psycho-
metric evaluation ensures that these translations reflect the original English versions tools [18] [24] [25]. A certain
level of validity, reliability, and sensitivity gives confidence in the questionnaires. They answer questions such as does
the questionnaire evaluates what it is supposed to evaluate?, does it stand the duration of time and space?, and can it
depict small differences and variations in the system?. Questionnaires conducted in the native language avoids mis-
understanding of the statements, and thus more accurate results of usability are measured.
Systems developers in the Arab region find difficulties in acquiring standard tools to accommodate system usa-
bility for native Arabic speakers. The authors are aware of two documented attempts of such Arabic tools, Arabic
System Usability Scale (A-SUS) [7] and Arabic Computer System Usability Questionnaire (A-CSUQ) [26]. The first
has been applied to several systems, and the later is still under development. It should be noted that Arabic usability
questionnaires should still be used casually and in need of further investigation. There is a crucial need to further
administer A-SUS studies, document them, and analyse their results for the optimal goal of benchmarking.
C. Usability of Academic Apps
Academic life in diverse institutions has already made use of apps and they have had them integrated within their
academic processes (for example student application, registration, employees services,..etc.). The usability of their
apps is vital to support the management flow for all stakeholders using it. Standard usability assessment of such apps
would be beneficial and provides a usability measure, that is widely acceptable by practitioners and scholars. More
and more practitioners and scholars are using and coming up with various standard usability tools and measures.
In the mobile application realm, usability has been and is still a major interest of practitioners [10] [27] [28] [29].
Mobile app usability is considered crucial and very important, however literature shows that there is scare literature
that taps it, specifically on app usability [30]. It also calls for the development of a processes to be followed by
software researchers and practitioners to specifically measure mobile usability within its context. A rigorous process
when followed will ensure both quality and efficiency of the app. There is a gap in the literature conc
D. Usability Tool Dellima
In this research, we are concerned with particularly studying students perception which is subjective. Student
experience and perceive the academic management app differently then faculty, administration or other users. Also,
International Journal of Computer Science and Information Security (IJCSIS),
Vol. 16, No. 7, July 2018
69 https://sites.google.com/site/ijcsis/
ISSN 1947-5500](https://image.slidesharecdn.com/journalofcomputerscienceijcsisjuly2018fullvolume-180915043348/75/Journal-of-computer-science-ijcsis-july-2018-full-volume-83-2048.jpg)
![each student might experience the use of the same app differently depending on the capabilities of the device used to
access the app [6][31] and the students experience with the smart phone. In the literature, minimum studies exist that
support better understanding of app usability perception [6], specifically academic management apps. The added tech-
nology usage may add onto the stress of students that are less technical savvy. In general, it’s vital to realise the
importance of software usability [29] [11], and it is more vital to realize the importance of usability for app acceptance
[32]. Reference [ 33] shows that it is important to evaluate academic systems. Therefore, academic management apps
would benefit from administering usability evaluation on them.
Usability practitioners and researchers are faced with a major dilemma [34]. They need to consider what usability
tool to use to evaluate a system [11]. The decision of usability measurement tool relies on the goal of the evaluation
[7] [35] [36]. References [11] [23] [24] [25], [26] span some of the literature in usability and documents what usability
evaluation methods adopted and used for what purpose and at what point of systems development.
Usability measurement tools in both the literature and industry are originally developed for desktops and laptops
software. Some have been developed for universal systems and only one is found in the literature that is specifically
developed for mobile usability [8]. Smart phones and mobile devices have features devices [5] [6] [31] that evolve
constantly [31], which makes them very different than software systems and websites. One of the most prominent
feature is the global positioning system (GPS), other features include: use of cameras, accessing the app without the
internet, and many more features that are evolving constantly as new functions are being adapted to smartphones.
Academic apps when developed for academic management in educational institutions recognises these evolving
smartphone feature and makes use of them in. Users of academic apps need the usability of such apps to be high or at
least acceptable in order for them to continue using them. Therefore their usability measures is crucial, and the via-
bility of such apps definitely depends on their usability. Literature shows apps are developed in a rapid manner [37],
it also shows a massive increase of app downloads [38] [39]; however downloading does not sustain the use of the
app [9]. The distinguished characteristics and features of smart phones [5] [6] [31] has promoted innovated usage of
apps. The mobile app industry needs to makes use of usability to ensure the successfulness of their apps [9]. Taking
into consideration the revolution of app development and how they are being more integrated into every aspect of our
lives. There is a need of a fast way to conduct usability and to acquire a certain level of quality in the app development
process to ensure app use sustainability.
Results of usability studies can be used to correct errors, and/or enhance the software [1] [2]. Mobile applications
benefit from the use of standardised usability questionnaires for their evaluation [7]. Following a process ensures
improved app usability and this will enable developers to cope with the evolving next generation of mobile technology.
E. System Usability Scale(SUS) and Arabic System Usability Scale(A-SUS)
In our research, the goal is evaluating perceived usability. Literature shows that standard questionnaires are
widely used in practice to evaluate such usability [12]. Evidence shows that they are adequate tools to be used in
order to satisfy the goal of the research of perceived usability. As presented in the previous section one such standard
International Journal of Computer Science and Information Security (IJCSIS),
Vol. 16, No. 7, July 2018
70 https://sites.google.com/site/ijcsis/
ISSN 1947-5500](https://image.slidesharecdn.com/journalofcomputerscienceijcsisjuly2018fullvolume-180915043348/75/Journal-of-computer-science-ijcsis-july-2018-full-volume-84-2048.jpg)
![usability questionnaire is called “The System Usability Scale” (SUS) [15]. We believe that SUS best fits our research
because of the following reasons: it is short and fast; which appeals to the respondents, easy to administer, easy to
complete, has a guided analysis process, and it is psychometrically evaluated. It is beneficial to find the usability of
Arabic mobile apps using the adaptations of the standard usability tools. One such implementation uses A-SUS to
evaluate the perceived usability of a payment app from its users who are Arabic native speakers [9]. It is also note-
worthy to point that the literature highly advocates the use of SUS on systems [6], as it is considered a universal
usability tool [8], therefore, the authors choose to use its Arabic version in our study .
SUS, is a standard questionnaire for system usability that is psychometrically proven [1] [30]. In 1986, SUS was
developed by Digital Equipment Corporation (DEC), in the UK by John Brooke. It consists of a ten statements ques-
tionnaire that starts with a negative statement followed by a positive statement alternatively. Respondents choose
from a five level Likert scale that ranges from (1) being least agreed upon to (5) being the most agreed upon. The
SUS questionnaire is then analysed using specific guidelines to obtain a single numeric value that represents the sub-
jective measure of perceived usability. The SUS usability single value is interpreted differently depending on the
users and genres [1] [40].
Interpretation of results SUS is systemic and easy to conduct. The process of dealing with the statements is divided
into two ways. First: the odd statements, a one is to be subtracted from the choice of the evaluator. Second: the even
statements the evaluators' choice is subtracted from five. The resulted values for all standard are transformed values
in the range of (0 to 4); where four indicates the most positive response. At the end, the transformed responses of
each evaluator is summed and multiplied by 2.5, the final SUS result is a single value in the range of (0 to 100). It
should be noted that this value from zero to one hundred is not a percentiles, and there is specific representation for
the SUS values as presented [41]. The literature shows that SUS values of usability are interpreted differently when
conducted on different environments [41]. This importance of environment reflection on usability is in sync with [11]
who stressed on the effect of the environment on usability measures. As a conclusion identical scores for two different
users in different genres might give different indications of usability. To make the evaluation more comprehendible,
researchers have transformed the numerical value to an adjective representation [28]. The evaluation of perceived
satisfaction of apps is essential [17] and there is a demand in the literature for further research [9].
There is a need to find confidence in Arabic standard usability tools. Native Arabic language apps are rapidly
becoming popular and being developed for the public sector specifically the public educational sector in Kuwait.
Scarce literature exists that documents perceived usability measures using standard usability tools adapted for the
Arabic language. The state of Kuwait and its goal of integrating technology to meet the “New Kuwait” motto calls
for public institutions to initiate and the use of apps. Institutions all over Kuwait are moving into the use mobile apps,
and academic tertiary institutions in Kuwait are no exceptions. At this time of fast pace and working on the go, aca-
demic management apps are essential in Kuwait because it inhabits in students, academics and staff a culture of mobile
process. Specific attention to the student perceived usability of these apps is of vital importance because they are
International Journal of Computer Science and Information Security (IJCSIS),
Vol. 16, No. 7, July 2018
71 https://sites.google.com/site/ijcsis/
ISSN 1947-5500](https://image.slidesharecdn.com/journalofcomputerscienceijcsisjuly2018fullvolume-180915043348/75/Journal-of-computer-science-ijcsis-july-2018-full-volume-85-2048.jpg)
![considered the input of our market place and workforce. We need to integrate the use of such apps seamlessly within
their academic life.
A case study is chosen to add onto the collected database of perceived usability of mobile apps. The usability tool
A-SUS is administered on an “Smart PAAET” app in one of Kuwaits’ tertiary educational sectors; The Public Au-
thority for Applied Education and Training (PAAET). The next section provides detailed description of how the case
study was administered utilising the chosen usability tool.
III. METHODS
A. Process and Tools
The process below outlines the steps and tools used, it follows an adaptation of steps developed from a previous
study of usability evaluation [9] and changed accordingly.
1) An academic management app is chosen for usability evaluation.
2) An in-depth interview was conducted to encapsulate app environment.
3) A Usability Evaluation tool was chosen to measure the perceived usability of the app taking into consid-
eration the goal of the study.
4) Results of usability are documented in a repository with an emphasis of the systems environment , user and
goal.
5) Focus groups to discuss results.
Steps 1 to 5 need to be repeated on other apps to establish benchmark.
B. Participants and Setting
“Smart PAAET” is chosen as a case study to measure the usability of a mobile app in Kuwait within the educational
realm. The app is a web-based Academic/Educational Management software tool, that is becoming a popular course
management app in the Public Authority of Applied Education and Training (PAAET) in Kuwait. It offers easy
paperless solution that can be used with confidence.
The app is used by various stakeholders (students, faculty, employees, administrators ,.. etc.) to promote organiza-
tion and cooperation between them. “Smart PAAET” is used to facilitate the learning process. An interview with the
IT staff in PAAET informed the authors that “Smart PAAET” was designed with the goal to increase productivity
and improve communications between PAAETs’ stakeholders, thus in return the use of the app will reduce time and
cost. To achieve this goal, “Smart PAAET” offers a variety of academic and management-related tasks to its stake-
holders.
The focus of this study is from a students perspective. For students, “Smart PAAET” provides a number of tools,
including the academic year calendar, general announcement, electronic mail, student schedule, grade maintenance,
International Journal of Computer Science and Information Security (IJCSIS),
Vol. 16, No. 7, July 2018
72 https://sites.google.com/site/ijcsis/
ISSN 1947-5500](https://image.slidesharecdn.com/journalofcomputerscienceijcsisjuly2018fullvolume-180915043348/75/Journal-of-computer-science-ijcsis-july-2018-full-volume-86-2048.jpg)
![student progress tracking and student reward financial record. It also provides an access to track student enrollment,
progress reports and verify course completion.
“Smart PAAET” app fills the gap of a needed communication tool between students and academics in PAAET.
The authors are from PAAET Enviroment, and each is with more than 15 years. The first and third author have expe-
riences as instructors and teachers, while the second author is an experienced trainer within PAAET. According to
their experience, E-mail is not favorable by students in PAAET, and students are gradually forced to use it as a com-
munication tool to contact the instructor. The authors feel that the students are still reluctant to use E-mail. There still
is no student email created by PAAET. The faculty has resolved to using social media tools to communicate with
students. Some instructors utilized Twitter, WhatsApp, and recently many instructors are using my which is a Kuwaiti
app that is privately owned specifically meets the need of student-faculty interactions.
C. Procedure and Analysis
The standard tool SUS is used in this research to measure the perceived usability. The literature presents various
attempts of using SUS [42], psychometric analysis of SUS indicates that it is a valid, reliable and sensitive tool.
The importance of administrating SUS in the native language of the user [7] where many scholars have used such
language adaptations to various standard usability tools [18] [19] [20] [21] [22] . For that reason, in this research, we
employ the Arabic adaptation of the SUS standard evaluation tool called Arabic- System Usability Scale (A-SUS)
[7].
Psychometric Evaluation considers the validity, reliability, and sensitivity of a questionnaire [15]. It is essential
to examine the psychometric evaluation of the usability tool [24], specifically if it’s adapted in a different language.
The literature shows many standard tools used in other languages have gone through psychometric evaluation [18]
[25] The psychometric process conducted previously for A-SUS in conjunction with the communication disorder app
[7] is to be followed in this study. Reliability, validity, and sensitivity is of concern and once established. A-SUS
results will indicate usability as perceived satisfaction [7].
The A-SUS score is calculated using the same procedure used to calculate SUS presented in the literature review.
Psychometric evaluation of A-SUS ensures that the essence of SUS is reflected upon it; where it has similar results to
previously conducted research using SUS [7].
IV. RESULTS
The A-SUS questionnaires was distributed to female students through a link sent via WhatsApp app messages.
Student users were asked to download the questionnaires link from the message. The link opens a questionnaire; where
Google forms was used to create and collect the responses. The total number of students who responded was 159
students.
International Journal of Computer Science and Information Security (IJCSIS),
Vol. 16, No. 7, July 2018
73 https://sites.google.com/site/ijcsis/
ISSN 1947-5500](https://image.slidesharecdn.com/journalofcomputerscienceijcsisjuly2018fullvolume-180915043348/75/Journal-of-computer-science-ijcsis-july-2018-full-volume-87-2048.jpg)
![Reliability of 0.83 alpha Cronbach is calculated from the collected data. This score is considered a valid and reliable
result; where reliable results have a minimum of 0.70 alpha coefficient. Also Pearson correlation ranges between the
values 0.528 and 0.732 and this range is within the accepted range of valid results.
A score of 68.8 represents the total of a single number of A-SUS as discussed in the methods section. This
represents an acceptable result of usability; where SUS average benchmark is a score of <= 68 [25]. Perceived
usability of the system under study is just above benchmark of usability. However it is under the benchmark of
software products of 72 [25].
Item A7 such states “ would imagine that most people would learn to use this system very quickly”, has the highest
mean, which indicates that “Smart PAAET” seams acceptable, easy to learn and students would adapt to using it in
minimum time. While item A10 which states “needed to learn a lot of things before I could get going with this system”
has the lowest mean, which gives us an indication that it is most not agreed on item between students, thus confirms
that “Smart PAAET” seams acceptable and easy to learn.
V. Discussion
A-SUS tool was administered on “Smart PAAET” app; an academic management mobile application. The data
was collected electronically by google forms, however students were given direct information on how to use and fill
the questionnaires. Calculation of A-SUS score followed the same calculation process of SUS. Usability results found
in general was acceptable. However, they are considered a below average result if we take into consideration the
realm of SUS application of software products. Benchmarks are vital to find where a system falls. Even though
usability results are acceptable, there is a need for improvement. Early interviews with the developers indicate that
some services are still not functioning, which explains the relatively low result of A-SUS score. Post A-SUS evalua-
tion focus groups with students confirmed that although “Smart PAAET” is easy to use but it still has to resolve some
services that are still not functioning creating a negative impact on its effectiveness and efficiency.
Results of A-SUS are stored in a database of app usability, specifically academic management, with the emphasis
of student users perspective. There was a need to add a descriptive explanation of what might have affected the results
of the A-SUS. Qualitative data enhances the findings of the questionnaires and provides further understanding. Figures
and numbers alone are indicators of benchmarks, and descriptive data articulate context to the numeric value. The
authors based their analysis on benchmarks of software in general using SUS. This gives emphasis to develop bench-
marks specific to academic management apps. If by time a benchmark is set for such apps, then the discussion part of
this research needs revaluation.
International Journal of Computer Science and Information Security (IJCSIS),
Vol. 16, No. 7, July 2018
74 https://sites.google.com/site/ijcsis/
ISSN 1947-5500](https://image.slidesharecdn.com/journalofcomputerscienceijcsisjuly2018fullvolume-180915043348/75/Journal-of-computer-science-ijcsis-july-2018-full-volume-88-2048.jpg)

![REFERENCES
[1] J. Brooke, “SUS: A retrospective”, Journal of Usability Studies. vol. 8, no. 2, 2013, pp. 29-40.
[2] R. Tsopra, J.P. Jais, A. Venot and C. Duclos, “Comparison of two kinds of interface, based on guided navigation or usability principles, for
improving the adoption of computerized decision support systems: application to the prescription of antibiotics”, Journal of the American
medical informatics Association, vol. 21, no. 1, 2014, pp. 107–116.
[3] Ericsson Website, Ericsson Mobility Report: 70 Percent of World's Population Using Smartphones by 2020, 2015. Available:www.ericsson.com,
[Accessed 16 December, 2017].
[4] Available: http://www.digital.com, [Accessed December, 30, 2015].
[5] A. Tang, “Mobile app monetization: app business models in the digital era”, International Journal of Innovation, Management and Technology,
vol. 7, no. 5, October 2016, Available:http://www.ijimt.org/vol7/677-MB00017.pdf, [Accessed January, 4, 2018].
[6] A. Inukollu1, D. Keshamoni, T. Kang and M. Inukollu., “Factors influencing quality of mobile apps: role of mobile app development life cycle”,
International Journal of Software Engineering & Applications (IJSEA), vol. 5, no. 5, September 2014, Available: http://airccse.org/jour-
nal/ijsea/papers/5514ijsea02.pdf, [Accessed January, 1, 2018].
[7] B. AlGhannam, S. Albustan, A. Al-Hassan and L. Albustan, “Towards a standard Arabic System Usability Scale (A-SUS): psychometric evaluation
using communication disorder app”, International Journal of Human-Computer Interaction, 2017, Available:
https://doi.org/10.1080/10447318.2017.1388099, [Accessed December, 30, 2017].
[8] James R. Lewis (2018) The System Usability Scale: Past, Present, and Future, International Journal of Human–Computer Interaction, Available:
doi: 10.1080/10447318.2018.1455307
[9] B. AlGhannam, E. AlEssa and M. Almukhaizim. (2018). “Mobile First Companies: A Case of App Usability in Kuwait”. International Journal of
Computer Science and Information Security. vol. 16. no. 3, Available: https://www.academia.edu/36306545/Mobile_First_Compa-
nies_A_Case_of_App_Usability_in_Kuwait Accessed [11 June 2018].
[10] K. Blagec, K. M. Romagnoli, R. D. Boyce and M. Samwald, “Examining perceptions of the usefulness and usability of a mobile-based system for
pharmacogenomics clinical decision support: A mixed methods study”, PeerJ , vol. 8, no. 4, 2016, Available:
https://doi.org/10.7717/peerj.1671, [Accessed February, 1, 2017].
[11] N. Bevan, “International standards for usability should be more widely used”, Journal of Usability Studies. 4, no. 3, 2009, pp. 106-113.
[12] J. Lewis, B. Utesch and D. Maher, “Measuring perceived usability: The SUS, UMUX-LITE, and AltUsability”, International Journal of Human–
Computer Interaction, vol. 31, no. 8, 2015, pp. 484-495.
[13] M. I. Berkman and D. Karahoca, “Re-Assessing the Usability Metric for User Experience (UMUX) Scale”, Journal of Usability Studies. vol. 11,
no. 3, May 2016, pp. 89–109.
[14] J. C. Nunnally, Psychometric theory, 2nd Edition, McGraw-Hill, New York, 1978.
[15] J. Lewis, “ IBM computer usability satisfaction questionnaires: Psychometric evaluation and instructions for Use”, International Journal of Human-
Computer Interaction, vol. 7, no. 1, 1995, pp. 57-78.
[16] J. Lewis, “Psychometric evaluation of PSSUQ using data from five years of usability studies”, International Journal of Human-Computer Interac-
tion, vol. 14, no. (3&4), 2002, pp. 463-488.
[17] J. Lewis and J. Sauro, “The factor structure of the System Usability Scale”, In Proceedings of the 1st International Conference on Human Centered
Design: Held as Part of HCI International 2009. 2009, pp. 94-103, ACM , Available: doi: 10.1007/978-3-642-02806-9_12.
[18] K. Lohmann, “System Usability Scale (SUS)- An improved German translation of the questionnaire”, Minds, 2013, Available: https://minds.core-
media.com/2013/09/18/sus-scale-an-improved-german-translation-questionnaire/, [Accessed February 02, 2017].
[19] I. Dianat, Z. Ghanbari and M. Asghari-Jafarabadi, “Psychometric properties of the Persian language version of the System Usability Scale” Health
Promote Prospect,, vol. 4, no. 1, 2014, pp. 82-89.
[20] B. Blažica and J. R. Lewis, “A Slovene translation of the System Usability Scale: The SUS-SI”, International Journal of Human-Computer
Interaction, vol. 3, no. 2, 2015, pp. 112-117.
[21] A. I. Martins, A. F. Rosa, A. Queirós, A. Silva, and N. P. Rocha, “ European Portuguese validation of the System Usability Scale (SUS)”,
Procedia Computer Science, vol. 67, 2015, pp. 293-300, Available: www.sciencedirect.com
International Journal of Computer Science and Information Security (IJCSIS),
Vol. 16, No. 7, July 2018
76 https://sites.google.com/site/ijcsis/
ISSN 1947-5500](https://image.slidesharecdn.com/journalofcomputerscienceijcsisjuly2018fullvolume-180915043348/75/Journal-of-computer-science-ijcsis-july-2018-full-volume-90-2048.jpg)
![[22] A. Borkowska, and K. Jach, “ Pre-testing of Polish translation of System Usability Scale (SUS)”, In: L. Borzemski, A. Grzech, J. Świątek, Z.
Wilimowska, Ed. Information Systems Architecture and Technology: In Proceedings of 37th International Conference on Information Sys-
tems Architecture and Technology – ISAT 2016 – Part I, Advances in Intelligent Systems and Computing, vol. 521, 2016, pp. 143-153,
Springer, Cham, ch. 12.
[23] O Erdinç, Harun Karga, Ahmet Ürkmez. “User satisfaction and components of perceived usability for a course management software”, Interna-
tional Conference on Value Chain Sustainability (ICOVACS 2015), March 2015.
[24] M. Deniz and A. Alsaffar, “Assessing the validity and reliability of a questionnaire on dietary fibre-related knowledge in a 450 Turkish Student
Population”, Journal of Health, Population, and Nutrition, vol. 31, no. 4, 2013, pp. 497–503.
[25] J. Sauro, “The challenges and opportunities of measuring the user experience”, Journal of Usability Studies, vol. 12, no. 1, 2016, pp. 1-7.
[26] A. Al-Hassan, B. AlGhannam, M. Bin Naser, H. AlAbdulrazaq, "Towards a standardized Arabic-CSUQ", The Annual Kuwait University Poster
Day for Humanities and Bussiness Administration, 2017.
[27] A. Kaikkonen, T. Kallio, A. Keklinen, A. Kankainen and M. Cankar, “Usability testing of mobile applications: A comparison between
laboratory and field testing”, Journal of Usability Studies, vol. 1, no. 1, 2005, pp. 4-16.
[28] B. Campbell, C. Tossell, M.D. Byrne and P. Kortum, “Voting on a smartphone: evaluating the usability of an optimized voting system for
handheld mobile devices”, Proceedings of the Human Factors and Ergonomics Society, 2010, pp. 1100-1104, Santa Monica, CA, Available:
http://chil.rice.edu/research/pdf/CampbellTossellByrneKortum_HFES_(2011), pdf, [Accessed February, 1, 2017].
[29] P. Kortum and M. Sorber, “Measuring the usability of mobile applications for phones and tablets“, International Journal of Human–Computer
Interaction, vol. 31, no. 8, 2015, pp. 518-529.
[30] R. Harrison, D. Flood and D. Duce, “Usability of mobile applications: literature review and rationale for a new usability model”, Journal of
Interaction Science, 2013, Available: http://www.journalofinteractionscience.com/content/1/1/1, [Accessed February, 1, 2016].
[31] L. Wroblewski, Mobile First, Mandy Brown (Ed), Publisher Jeffry Zeldman, 2011, ISBN 978-1-937557-02-7 Available: http://www.fer-
rispark.com/audio/DOCUMENTS/mobile-first.pdf, [Accessed December, 17, 2017].
[32] F. Lettner and C. Holzmann, “Usability evaluation framework”, In: Moreno-Díaz R., Pichler F., Quesada-Arencibia A. (eds) Computer
Aided Systems Theory – EUROCAST 2011, EUROCAST 2011. Lecture Notes in Computer Science, vol. 6928, Springer, Berlin,
Heidelberg, Available: doi https://doi.org/10.1007/978-3-642-27579-1_72
[33] B. Scholtz, A. Calitz and C. Cilliers, “Usability Evaluation of a Medium- sized ERP System in Higher Education” , The Electronic Journal
Information Systems Evaluation”, vol. 16 , no. 2, 2013, pp.148-161, ISSN 1566-6379 148, Available: www.ejise.com, [Accessed June, 30,
2018].
[34] F. Nayebi, J. Desharnais and A. Abran, “The state of the art of mobile application usability evaluation”, 25th IEEE Canadian Conference on
Electrical and Computer Engineering (IEEE CD: 978-1-4673-6/12), Montreal, April 29-May 2, 2012, IEEE.
[35] J. Nielsen, Usability 101: Introduction to Usability, 2012, Available: https://www.nngroup.com/articles/author/jakob-nielsen, [Accessed January,
19, 2018].
[36] C. Rohrer, When to Use Which User-Experience Research Methods, Nielson Norman Group, 2014, Available : https://www.nngroup.com/arti-
cles/which-ux-research-methods/, [Accessed March, 30, 2017].
[37] H. Flora, S. Chande and X. Wang, “Adopting an agile approach for the development of mobile applications”, International Journal of Computer
Applications (0975 – 8887), vol. 94, no. 17, May 2014, Available: doi: 10.5120/16454-6199, https://pdfs.seman-
ticscholar.org/aa3f/4916c79db8118729e1b0bc0039d248e5eb72.pdf
[38] A. Logan. “Regulating the mobile app market”, Regulation, Washington, vol. 37, no. 3, 2014, pp. 13-14.
[39] P. LaBerge, The 2017 Mobile Growth Handbook, 2017. Available: https://branch.io/attachment/2017-Mobile-Growth-Handbook.pdf, [Accessed
January, 1, 2018].
[40] J. Brooke, “SUS: A ‘quick and dirty’ usability scale”, In P.W. Jordan, B. Thomas, B.A. Weerdmeester, and I.L. McClelland (Eds.), Usability
Evaluation in Industry, pp. 189-194, London: Taylor & Francis, 1996.
[41] A. Bangor, P.T. Kortum and J.T. Miller, “ Determining what individual SUS scores mean: Adding an adjective rating scale”, Journal of Usability
Study. Vol. 4, no. 3, 2009, pp. 114-123. Available: http://uxpajournal.org/issue/volume-4-issue-3/, [Accessed 10 January, 2017].
[42] O. Erdinç and J. Lewis, “ Psychometric evaluation of the T-CSUQ: The Turkish version of the computer system usability questionnaire”, Interna-
tional Journal of Human-Computer Interaction, vol. 29, no. 5, 2013, pp. 319–326, Available: doi:10.1080/10447318.2012.711702.
International Journal of Computer Science and Information Security (IJCSIS),
Vol. 16, No. 7, July 2018
77 https://sites.google.com/site/ijcsis/
ISSN 1947-5500](https://image.slidesharecdn.com/journalofcomputerscienceijcsisjuly2018fullvolume-180915043348/75/Journal-of-computer-science-ijcsis-july-2018-full-volume-91-2048.jpg)

![Evaluating the Proposed Public Budget
Ontological Model
Y. M. Helmy, Faculty of Commerce and Business Administration, Helwan University, Egypt
S. A. Ali, Faculty of Commerce and Business Administration, Helwan University, Egypt
M. M.A. Abd Ellatif, Faculty of Information Systems, Jeddah University, KSA and Helwan University,
Egypt
Abstract- Ontology plays an important role in the emerging semantic web as it captures background knowledge for a
specific domain and provides relevant concepts and relationships between them. From these vital domains, is the budget
domain. In order to provide budget transparency, the ontology is going to be used to share and formalize
conceptualization of the budget in order to enable humans and machines to read and understand the data that is being
exchanged. The fluency of the ontology can be measured only by its evaluation of its quality from different perspectives.
Consequently this paper intends to show how we can use the evaluation methods and metrics to measure the quality of an
ontology based on the proposed public budget ontological model as an area of study, In order to ensure the quality of the
ontology design an OntoMetric tool is used and obtained a reasonable results compared to the ideal results of the
standards. As well as to measure the validity of the ontology towards the real world, a Protégé tool employing the
reasoner is used to check the consistency of the concepts and subconcepts.
I. INTRODUCTION
Public budget is an important field of study due to its importance in including all government revenues and expenses
during a coming period of time mainly a year. It reflects the main instructions of the general policy for the
government [15]. The governmental public budget needs to be transparent and accurate. because budget
transparency means that it includes a full disclosure of all relevant financial information in a timely, accurate and
systematic manner [27].But in fact, there is a difficulty in the budget preparation process and It‟s found that there are
non- experienced employees with a misunderstanding of the whole budget structure, as well as the technical aspects
that are could be used to achieve the work efficiently are not employed [25]. All of these issues are found similarly
in the Egyptian public sector, which affects badly the process of the public budget structure and preparation. So in
order to ensure the public budget transparency, which is significantly important due to its ability to facilitate
understanding the basic structure of the budget, as well as help the recipient government make their budget
processes more predictable and efficiently make the budget information accessible [26]. According to these, we
sought to use the ontology which considered the backbone of the semantic web, to facilitate representing, storing,
sharing, reusing and inferring new knowledge of the public budget domain in an efficient way. Ontology plays an
important role in knowledge sharing with its ability to capture the real world information into a machine-readable
format [24]. As well as it provides an explicitly defined and formal requirement specification in the initial stage of
the requirement engineering [28].Unfortunately, according to the Standish group, 19% of the projects are failed
because of the requirement engineering, which takes the highest proportion of the elements that affect the software
International Journal of Computer Science and Information Security (IJCSIS),
Vol. 16, No. 7, July 2018
79 https://sites.google.com/site/ijcsis/
ISSN 1947-5500](https://image.slidesharecdn.com/journalofcomputerscienceijcsisjuly2018fullvolume-180915043348/75/Journal-of-computer-science-ijcsis-july-2018-full-volume-93-2048.jpg)
![projects, as a result, it could make an effect in whole software project construction [29].To overcome these
requirement engineering problems, many researchers tend to use the semantic web and ontology to increase the
quality of the project and reduce failure[30]. So in order to take the steps towards the transparency of the budget an
ontological model is developed for a public budget for the first time in Egypt. As well as to ensure the quality of this
budget ontological model, This paper provides an evaluation for the quality of the proposed public budget
ontological model using an OntoMetrics tool based on a set of well-defined metrics and the validation method to
check whether the ontological model really model the real world for which it is created using the protégé tool.
In order to effectively start the journey of evaluating the quality of the proposed ontological public budget model,
we will begin by introducing the concepts of the public budget domain, the basics of ontology and the ontology
evaluation metrics and methods.
II. PUBLIC BUDGET DOMAIN
Budget is a public planning document which simultaneously projects revenues and expenditure, the budget is an
itemized summary of likely income and expenses for a given period of time mainly one year [15]. The budget
structure contains all the features of the socio-economic and political relations of the cities in which the budget is
passed. It‟s important to know that Planning and monitoring the budget will help in identifying wasteful
expenditures, adapt quickly the financial situation changes, and achieve the financial goals. Budget planners and
adopters should know that budget is an administrative document valid for a period of one financial year, accurately
determining the structure of revenues and expenditure, prepared and adopted prior to the start of a budget year, it
contains general provisions essential to the process of execution while it must be in accordance with economic
policy [6]. The budget also considers the main guidance of the public policy. According to the state‟s general budget
in the Arab Republic of Egypt, It is stated that The General Budget life cycle process is consisted of four stages as
follows [15].
Stage 1: Preparation
The first stage of the budget process is to actually generate the budget. Done right, this process starts with a careful
thought at the ground level as to what is needed and what new initiatives can be started. At the same time, leadership
and vision from the top offer some guidance as to what the departments can expect. Once each department makes its
spending decisions, their requests are sent to the decision makers for inclusion in, or exclusion from, the final
document. The preparation of the budget should pass through the following six phases that are shown in Fig. 1.
International Journal of Computer Science and Information Security (IJCSIS),
Vol. 16, No. 7, July 2018
80 https://sites.google.com/site/ijcsis/
ISSN 1947-5500](https://image.slidesharecdn.com/journalofcomputerscienceijcsisjuly2018fullvolume-180915043348/75/Journal-of-computer-science-ijcsis-july-2018-full-volume-94-2048.jpg)
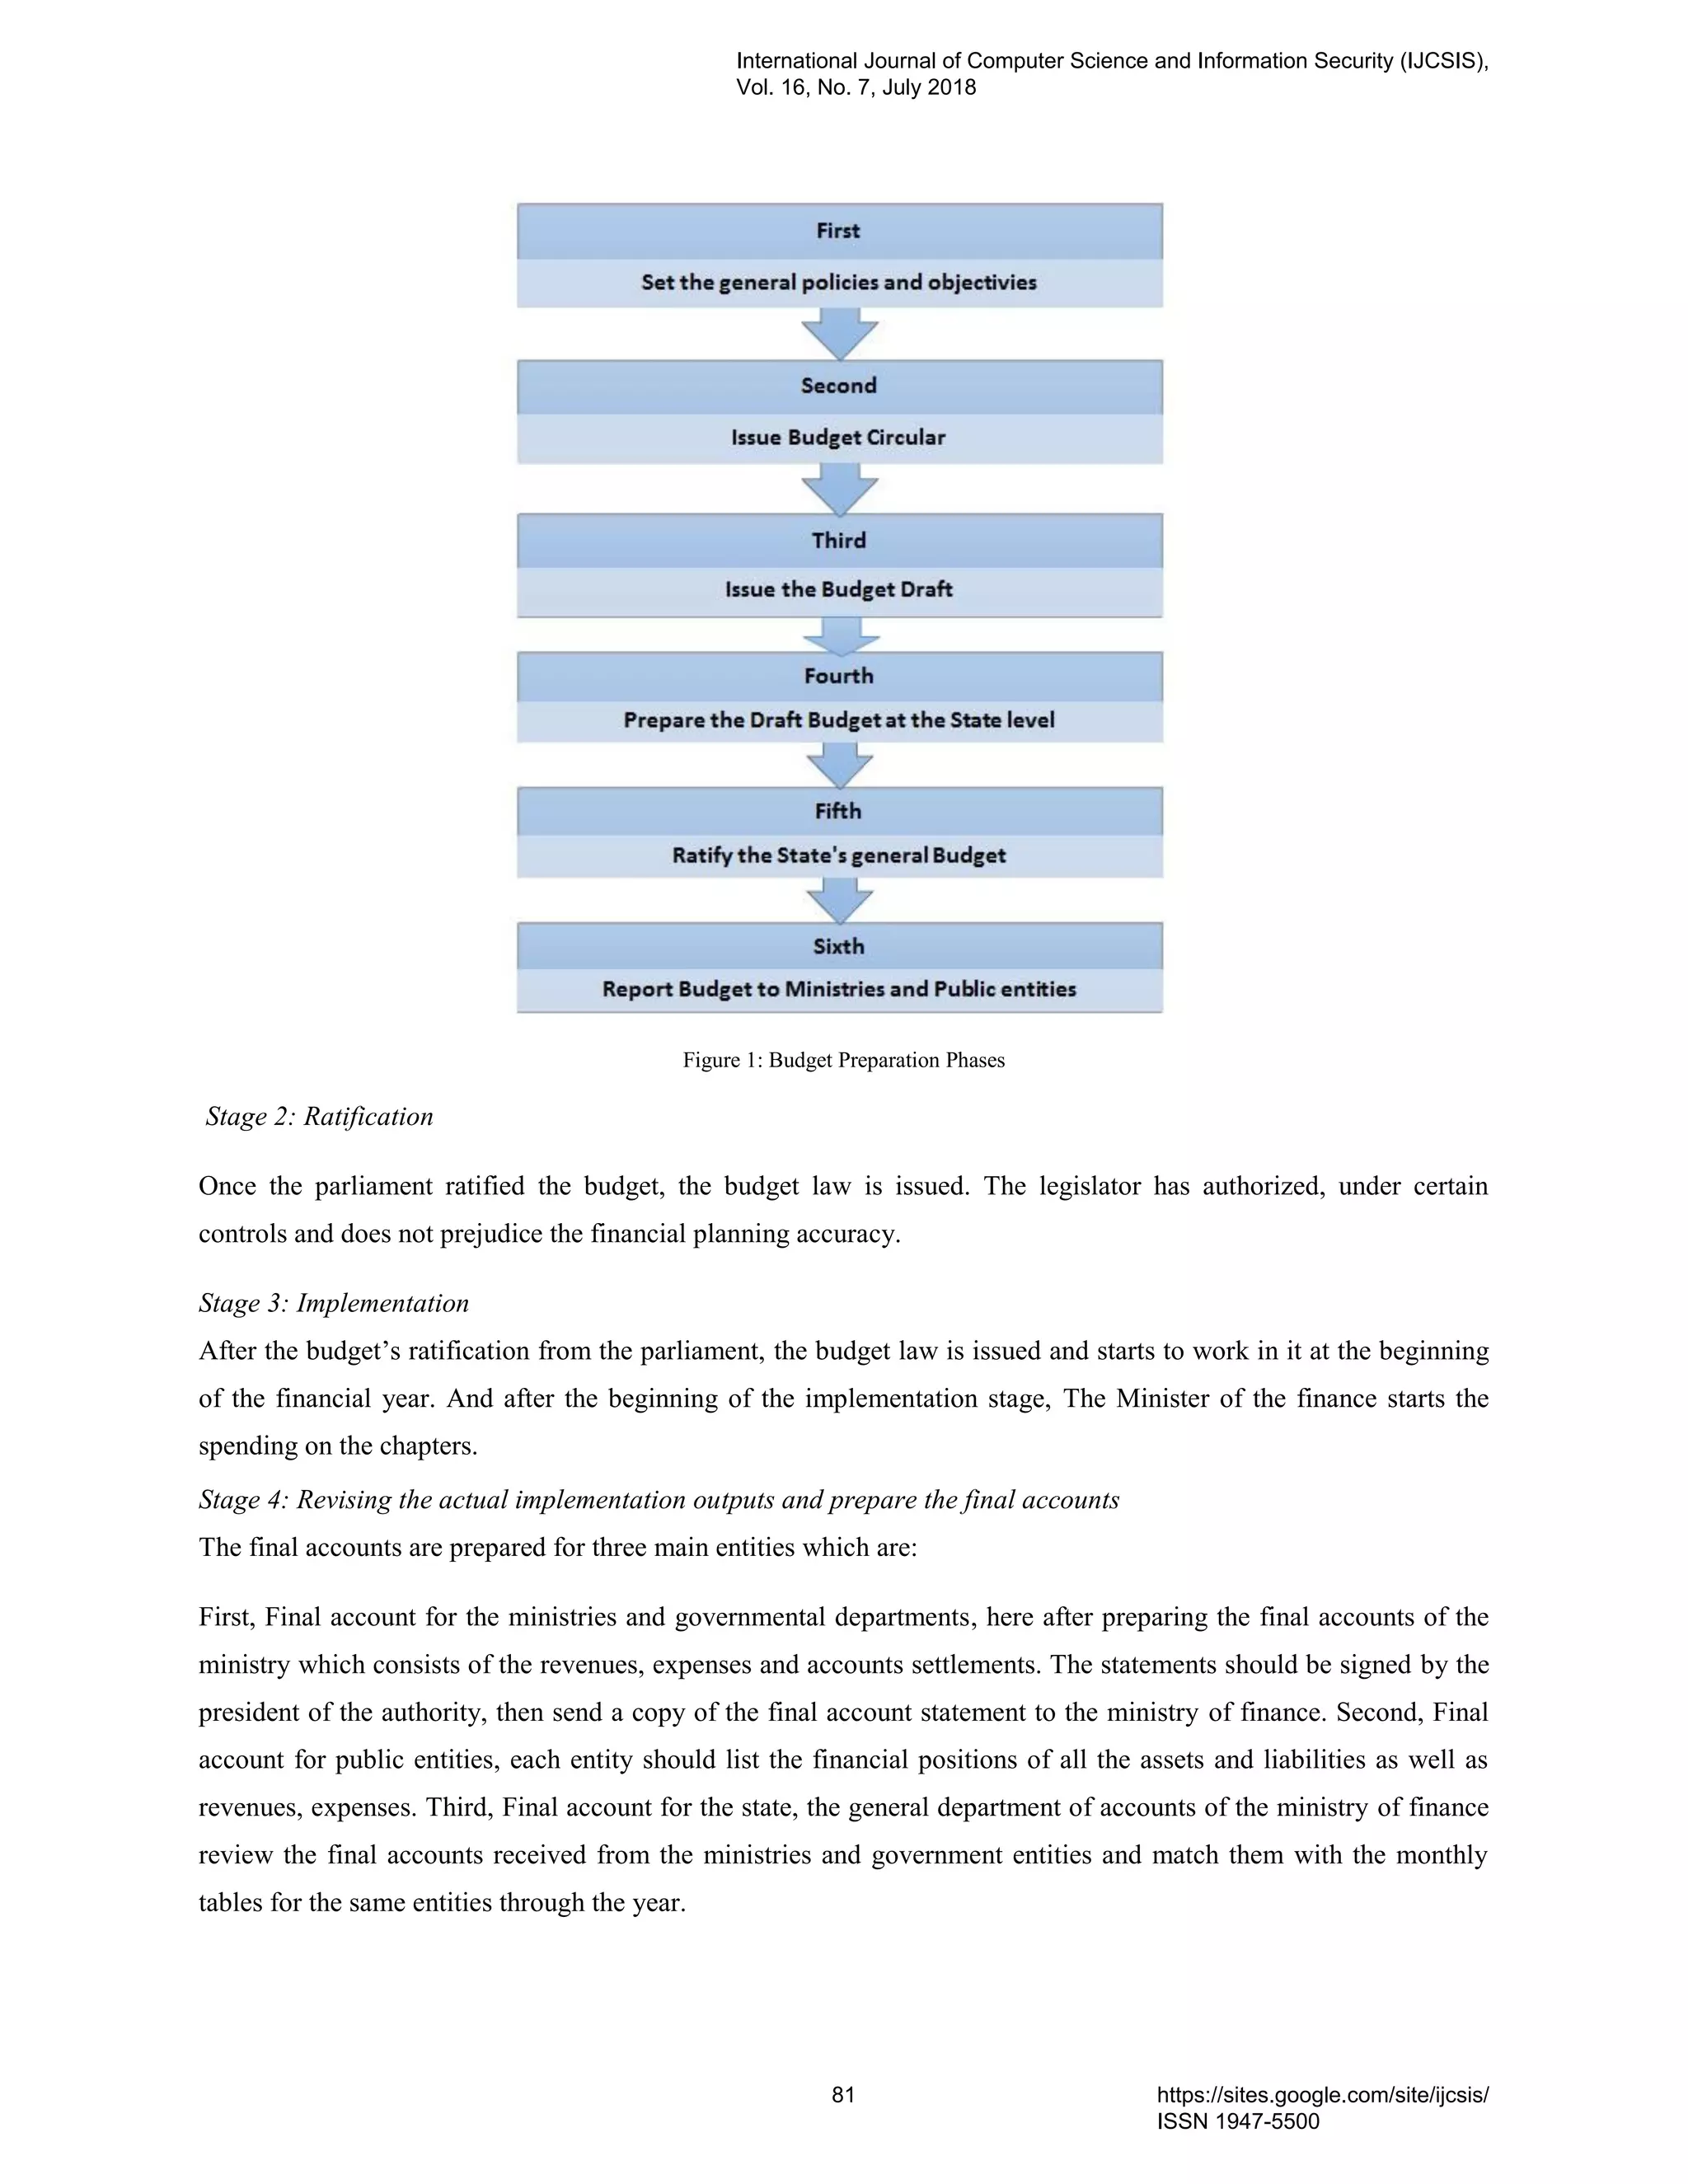
![III. Ontology
Ontologies are considered the important component and the building block of the semantic Web and are becoming
increasingly popular since they allow for delivering a shared common description of data that does not depend on
the particular context of a data source and can be freely communicated between information systems and people [3].
The ontology describes a hierarchy of concepts that are usually related to other concepts by the relationships. A
simple example that illustrates its use is when two communicating organizations refer to the same concept using
different names then if one application needs to access the databases of both organizations, it needs to be able to
recognize that those two concepts refer to the same subject. Therefore, this system may need to refer to an ontology
file that defines concepts using a logic-based machine-readable format so that the machines would be able to resolve
the name mismatch and infer whether the two concepts share the same semantics. Ontology types based on the level
of generality as summarized as Top-level ontologies -Domain ontologies -Task-based ontologies -Application
ontologies where ontologies are used to represent a conceptualization of a specific domain and a specific task. And it
is a very broad term and act as a more conceptual idea rather than a strictly defined formalism for expressing
knowledge and it can be seen as a dictionary of terms formulated in a canonical syntax and with commonly accepted
definitions designed to yield as a taxonomical framework for knowledge representation which can be shared by
different information system communities [2]. It considered being important to share information in internal
activities of government administration and to facilitate information access in e-government services. It describes an
area with a given terminology, basic concept, classification of these concepts and the connection between concepts
while defining the rules between them. It also provides a detailed description of the structure of an area of
knowledge with formal definitions of mutual relationships and connections among the various elements of the area.
Ontologies are used for knowledge representation, knowledge management, and organization, as well as for the
search and retrieving of desired knowledge it is beneficial because it can be updated, new concepts and connections.
Creating ontology is an iterative and continuous upgradable process. In Computer and information, science
Ontology is a data model that represents the concepts within a domain and the relationships that can exist for an
agent or a community of agents [6].
In the context of database systems, ontology can be viewed as a level of abstraction of data models, analogous to
hierarchical and relational models, but intended for modeling knowledge about individuals, their attributes, and their
relationships to other individuals. Ontologies are typically specified in languages that allow abstraction away from
data structures and implementation strategies; in practice, the languages of ontologies are closer in expressive power
to first-order logic than languages used to model databases. For this reason, ontologies are said to be at the
"semantic" level, whereas database schema is models of data at the "logical" or "physical" level. Due to their
independence from lower level data models, ontologies are used for integrating heterogeneous databases, enabling
interoperability among disparate systems, and specifying interfaces to independent, knowledge-based services.
So reasons that allow people to develop ontology are: 1) to share a common understanding of the structure of
information among people or software agents. 2) To enable reuse of domain knowledge. 3) To make domain
International Journal of Computer Science and Information Security (IJCSIS),
Vol. 16, No. 7, July 2018
82 https://sites.google.com/site/ijcsis/
ISSN 1947-5500](https://image.slidesharecdn.com/journalofcomputerscienceijcsisjuly2018fullvolume-180915043348/75/Journal-of-computer-science-ijcsis-july-2018-full-volume-96-2048.jpg)
![assumptions explicit. 4) To separate domain knowledge from the operational knowledge, 5) to analyze domain
knowledge, 6) provide an organizational framework that allows reasoning knowledge.
A. Ontology Development Processes
To support engineer and building of ontology we are going to use methods and tools from software engineering. In
general, the ontology development process can be divided into three main phases: Specification, Conceptualization,
and Implementation. Atanasova Stated that the objective of the specification subprocess is to acquire informal
knowledge about the domain. To fulfill this objective this subprocess is divided into four main tasks: determine
ontology goal and scope, describe the domain, define motivating scenarios and competency questions and, define
granularity and ontology type. With regards to the conceptualization subprocess, its objective is to define a domain
conceptual model organizing the relevant knowledge acquired in the previous subprocess [1]. To this aim, this
subprocess is divided into three main tasks: define the domain conceptual model, identify classes, relations, and
attributes and, create instances. And in order to engineer and develop an ontology for business analysis domain, there
are two main groups of methodologies to be concerned in which the first group is experience based methodologies
and the second group is evaluative prototype methodologies. Finally, the goal of the implementation subprocess is to
build a correct ontology represented in a machine-processable language. With this goal in mind, this subprocess is
divided into three main tasks: implement the ontology, verify the ontology and, validate competency questions.
Radivojevic Stated that adopting ontologies and knowledge bases improved the process of creating and adopting
budgets faster and more efficiently and also provide monitoring as well as better understanding of the budget
structure [6]. Brusa stated that the ontology development process can be divided into two main phases: specification
and conceptualization. The goal of the specification phase is to acquire knowledge about the domain. The goal of the
conceptualization phase is to organize and structure this knowledge using external representations that are
independent of the implementation languages and environments. In order to define the ontology for the budget
domain, we have followed the 101 Method which guides for creating the first ontology and used the analysis steps
from METHONTOLOGY in the conceptualization process. Both consider an incremental construction that allows
refining the original model in successive steps and they offer different representations for the conceptualization task
[2]. Salah M. has developed an ontology in the financial investment domain in order to facilitate the process of
collection, organization, representation, and formalization in the finance, they used the METHONTOLOGY as
development process to facilitate the sharing of knowledge in the field [5].
B. The Proposed Public Budget Ontological Model
This section demonstrates an excerpt of the development of the proposed public budget ontological model developed
for the first time for the Egyptian public sector.
Ontologies are considered as descriptions of certain application domains of knowledge which include sets of
concepts and links between them. Also, it consists of properties and individuals. Different languages may be used
for ontology description. Such languages as RDFS and OWL were developed within the Semantic Web framework.
These languages have different capabilities that enable to facilities the creation of detailed concept descriptions and
International Journal of Computer Science and Information Security (IJCSIS),
Vol. 16, No. 7, July 2018
83 https://sites.google.com/site/ijcsis/
ISSN 1947-5500](https://image.slidesharecdn.com/journalofcomputerscienceijcsisjuly2018fullvolume-180915043348/75/Journal-of-computer-science-ijcsis-july-2018-full-volume-97-2048.jpg)
![performance of logical inference. RDFS allows description of concept hierarchies and relations between them [12].
There are also various tools used as infrastructure for the ontology. From this tools that are employed in this study is
the Protégé. The protégé is an open source platform that enables users to read and save OWL ontologies, update and
visualize concepts, performance reasons. It also allows users to display the meanings of terms and the relationships
between those terms. It provides a rich set of structures and modeling activities that support the creation,
visualization and manipulation of ontologies represented in different formats [13].
In order to build the public budget ontology, the concepts should be defined. Concepts in the domain act as a
collection of objects. It considered as the fundamental element of the domain and usually represent a group whose
members share common properties. This component is represented in form of hierarchical graphs [14]. Annotation
properties can be used to add information (metadata-data about data) to classes. Ontologies can define their own
annotation properties or reuse existing ones. In contrast to other properties, annotation properties do not have any
formal meaning for external OWL components like reasoners, but they are an extremely important vehicle for
maintaining project information. A typical use for annotation property in the budget field is to design concepts that
describe the functionality of each class. Therefore we should first illustrate the main concepts of the budget where it
consists of five main concepts: Budget Basics, Budget Classification, Budget Phases, Budget Report and Budget
Setup. Fig. 2 presented An Excerpt view of the Public Budget Ontology. An OntoGraf is used to give the support for
interactively navigating the relationships in the ontology [16].
Figure 2: Excerpt view of the Public Budget Ontology
IV. Ontology Evaluation Methods and Metrics
As Ontologies become the widely used methodology for knowledge representation, so the need for its effectiveness
and quality are increased. Subsequently, the importance of the ontology can be measured only by its evaluation.
Accordingly, evaluation is recommended during the whole life cycle of the ontology. Brank, Stated that there is no
single best approach to evaluate the ontology. Instead, the approach should be chosen according to the purpose of
the ontology, the application in which the ontology will be applied on, and on what aspect of the ontology trying to
evaluate. While Bilgin indicated that ontology evaluation methods are defined according to two basic concepts
International Journal of Computer Science and Information Security (IJCSIS),
Vol. 16, No. 7, July 2018
84 https://sites.google.com/site/ijcsis/
ISSN 1947-5500](https://image.slidesharecdn.com/journalofcomputerscienceijcsisjuly2018fullvolume-180915043348/75/Journal-of-computer-science-ijcsis-july-2018-full-volume-98-2048.jpg)
![which are: The verification method that ensures the structure of the ontology meets the domain requirement and the
validation method that examines the applicability of the ontology in the real world [8]. According to Gómez,
Ontology evaluation can be defined as “A technical judgment of the content of the ontology with respect to a frame
of reference during every phase and between phases of their lifecycle". As well as, the author indicated that the
evaluation should consist of two main terms. The first is the verification which referred to “building the ontology
correctly, that is, ensuring that its definitions (written in informal or the formal language) implement correctly the
ontology requirements and competency questions, or function correctly in the real world”. The second is the
validation which referred to “whether the ontology definitions really model the real world for which the ontology
was created. So the goal is to prove that the world model is compliant with the world modeled formally"[9].
Lovrencic and others indicated that in order to develop an appropriate and usable ontology, several evaluation
methods should be applied to ensure the quality of ontology. They applied it on domain ontology for university
studies in Croatia as an example by employing two independent evaluation methods for both verification and
validation. They use the ontology taxonomy evaluation method and ontoclean method for the verification. While
they use the application ontology and ontology content evaluation methods for the verification. They found that it is
beneficial to apply multiple evaluation methods that comprise both the verification and validation methods [10]. Tan
provides the evaluation procedures for real-life application ontology, the evaluation is based on three ontology
quality features such as usability, correctness, and usability. First, the usability means that ontology should be user-
friendly and the users should put a trust in it and be confident that it carries their tasks effectively and efficiently.
Usability can be measured using the protégé tool to visualize the application ontology in the evaluation through the
VOWL tool. The correctness of ontology is probably the most important quality feature that needs to be evaluated.
The Correctness is measured through using competency questions which compare the information represented in the
ontology with the information found in the required document. As well as, the web-based application is an ontology
verbalization tool that is used to evaluate the correctness. Finally, Applicability means the quality of the ontology
regarding its appropriateness, and it can be evaluated by the person who develops the application and who use the
ontology to implement its functionality [11]. According to Tartir, the quality of the ontology can be evaluated from
different dimensions such as the quality metrics which can be used to evaluate how much the schema succeeded in
modeling a real world domain. Then, the quality of the populated ontology (knowledge base) can be measured to
ensure whether it is rich and represent the real-world entities and relationships accurately or not. Finally, the quality
of the knowledge base itself can be measured to check if the instances and relations agree with the schema. The
study used the OntoQA approach to analyze the ontology schema and their population [18].
A. Ontology Metrics
Metrics are used to evaluate the ontology fast and in a simple way [19]. Ontology metrics offers a quantitative
representation of the ontology quality through scanning the ontology and returning a statistics about the knowledge
represented in the ontology [18]. It also considered an important approach as they can help to evaluate and qualify
ontology. From the ontology developer‟s perspective, assessing the quality of ontology, can define areas that might
need more work and recognize some parts of the ontology that may cause problems. Furthermore, metrics are
International Journal of Computer Science and Information Security (IJCSIS),
Vol. 16, No. 7, July 2018
85 https://sites.google.com/site/ijcsis/
ISSN 1947-5500](https://image.slidesharecdn.com/journalofcomputerscienceijcsisjuly2018fullvolume-180915043348/75/Journal-of-computer-science-ijcsis-july-2018-full-volume-99-2048.jpg)
![helpful in the process of reusing because before using a previously defined ontology it should be evaluated in order
to determine the worthiness of using it. Metrics can always evaluate ontologies both during engineering and
application processes [20]. The metrics are divided into two main categories which are: the schema metrics and the
instance metrics. The First category assesses the ontology design and measures the inheritance level, while the
second category assesses the placement of the instance data in the ontology and measure how the ontology is used to
represent the knowledge model [18]. There are various tools that are used to implement the metrics from this tools
are OntoQA, Protégé, OntoMetrics, and OntoClean.
In this study, we are going to use the OntoMetrics tool which is a web-based tool and works to validate and display
the statistics about the OWL ontology. Based on the schema metrics which are includes three important metrics:
base metrics, schema metrics, and graph metrics.
The first metric is; Base Metrics [21] encompasses simple metrics, such as the counting of classes, axioms, and
objects. It shows the number of ontology elements. These metrics include measurement of:
Axioms: which are a basic statement of the ontology and also act as a main component, they indicate what is actually
true in a domain. It is possible that classes, properties, datatype definitions, assertions, and annotations have axioms.
Logical Axiom: An axiom which affects the logical meaning of the ontology
Class: The class or the concept in the ontology includes a set of individuals. This metric counts the number of the
classes in ontology.
There are two types of the properties in the ontology which are; Data property which is used to link individuals or
the attributes to data values. And, Object property which is used to describe the relationships between classes.
Individuals: the individual is the instance of the class, it represents the actual object of the domain. This metric
counts the number of the instances in the class of the ontology.
Annotation: the annotation can be used to add information with the ontology. It consists of annotation value and
annotation property.
DL expressivity: Description Logics (DL) is used to describe the relevant concepts of an application domain. It gets
the human-readable name of the metric.
The second metric is; the Schema Metrics [22] which is used to evaluate the design of the ontology, as well as
indicates the richness and inheritance of the ontology schema design. Schema metrics provide the richness of
attributes, inheritance, and relationships in the ontology schema.
Attribute Richness: This metric measures the number of attributes that are defined for each class. It can evaluate the
quality of both the ontology design and the amount of the information inside the instance data. The more attributes
that are defined the more knowledge the ontology could have. Formally, The Attribute Richness (AR) is defined as
International Journal of Computer Science and Information Security (IJCSIS),
Vol. 16, No. 7, July 2018
86 https://sites.google.com/site/ijcsis/
ISSN 1947-5500](https://image.slidesharecdn.com/journalofcomputerscienceijcsisjuly2018fullvolume-180915043348/75/Journal-of-computer-science-ijcsis-july-2018-full-volume-100-2048.jpg)
![the average number of the attributes per class. It is calculated as the number of the attributes for all classes (att)
divided by the number of classes (C).
(1)
The result will be a real number that represents the average number of attributes per class, which indicates how
much the knowledge is acquired in the schema. An ontology with a high value for the AR means that each class has
a high number of attributes, while a lower value indicates that less information is provided about each class [18].
Inheritance Richness: This metric defines the distribution of the information across the ontology‟s inheritance tree.
It is considered as a good indicator to measure how well the knowledge is grouped into different categories and
subcategories in the ontology.
This Metric can also differentiate between the horizontal ontology (which indicates high inheritance richness to
represent a deep knowledge, through having a large number of subclasses) and the vertical ontology (which
indicates low inheritance richness, through having a few numbers of subclasses), this can be measured for the whole
schema or for a subtree of the schema.
Formally, the inheritance schema (IR) is defined as the average number of subclasses per class. The number of
subclasses of a class is defined as the average number of subclasses ( ) for a class ( ) is defined as ( ( ) ,
Where (H) is the number of the inheritance relationships.
∑ ( )
(2)
The result of the equation will be a real number, which represents the average number of subclasses per class. The
high (IR) indicates a horizontal nature ontology with a deep knowledge. Otherwise, the low (IR) indicates a vertical
ontology which contains very detailed type of knowledge [18].
Relationship Richness: This metric describes the different types of relations in the ontology. An ontology that
includes only inheritance relationships usually results from a less information than an ontology that contains a
different set of relationships. An ontology that includes many relations other than the class-subclass relationship is
fruitful than a taxonomy with an only class-subclass relationship.
Formally, the relationship richness (RR) of the schema is defined as the average number of the non-inheritance
relationships (P), divided by the total number of the relationships in the schema (which is the summation of the
number of inheritance relationship (H) and non-inheritance relationship (P)).
(3)
The result of this metric will be represented in a percentage number which indicates how much are the connections
between classes of rich relationships compared to all of the possible connections that can include rich relationships
and inheritance relationships. if an ontology has an RR near to zero, this means that most of the relationships are
International Journal of Computer Science and Information Security (IJCSIS),
Vol. 16, No. 7, July 2018
87 https://sites.google.com/site/ijcsis/
ISSN 1947-5500](https://image.slidesharecdn.com/journalofcomputerscienceijcsisjuly2018fullvolume-180915043348/75/Journal-of-computer-science-ijcsis-july-2018-full-volume-101-2048.jpg)
![class-subclass relationships. While ontology with an RR near one this means that most of the relationships are other
than class-subclass [18].
The third metric is the Graph Metrics [23] calculates the structure of the ontology from different perspectives such
as the absolute root, leaf, and sibling cardinality. As well as, the absolute, average and maximal count of the depth
and breadth.
B. The Proposed Public Budget Ontology’s Evaluation Results
According to The metrics mentioned above in Section 3 in order to ensure the verification of the ontology. The
metrics of the schema are used by employing attribute richness, inheritance richness, and relationship richness. The
schema metrics are implemented using the OntoMetrics tool, which is used to display the statistics about the OWL
of the public budget ontology.
Making the evaluation based on equation (1), equation (2), and equation (3). The results are shown in table 1 as
follow.
TABLE I: RESULTS OF THE BUDGET ONTOLOGY „S EVALUATION BASED ON THE SCHEMA METRICS
Metrics Results Logical Interpretation
Classes 34 Number of the classes found in the public budget ontology
Attribute Richness 1.04 moderate
Inheritance Richness 2.97 Horizontal
Relationship Richness 0.83 Good
Evaluating the ontology during its building has a disadvantage and an advantage. Its disadvantage is that it returns
unfair results because the work does not complete yet. But, its advantage is that can allow us to evaluate the work in
its initial phase and identify if there any area that will require further enhance.
The above results presented in table II reflects back the evaluation of the proposed public budget ontology which
includes 34 classes. Equation (1) is used to calculate the attribute richness the result equal 1.04 which is mean that it
is a moderate result that reflects the average number of attributes per class. Equation (2) is used to measure the
inheritance richness, the result is equal to 2.97 which is near to be horizontal ontology (it is going to represent the
general knowledge as modeled). Equation (3) is used to evaluate the relationship richness and by comparing the
ideal results for this metric and the obtained result it‟s found that the result is good because it is near to one so this
means that the relationships are other-than class-subclass relations. This evaluation will be repeated after completing
all the development of the ontology in order to enhance the results of the evaluation using these metrics.
As a result of the importance of developing the ontology for the budget domain in the public sector, the results need
to be obtained accurately and with a high-quality. We didn‟t depend only on the OntoMetrics for evaluating the
budget ontology but the ontology is also evaluated using the Protégé tool, in order to measure the quality using the
validation method by applying the Reasoner using Pellet 1.5.2 in order to check the inconsistency of the concepts,
subconcepts and the properties in a general way.
International Journal of Computer Science and Information Security (IJCSIS),
Vol. 16, No. 7, July 2018
88 https://sites.google.com/site/ijcsis/
ISSN 1947-5500](https://image.slidesharecdn.com/journalofcomputerscienceijcsisjuly2018fullvolume-180915043348/75/Journal-of-computer-science-ijcsis-july-2018-full-volume-102-2048.jpg)
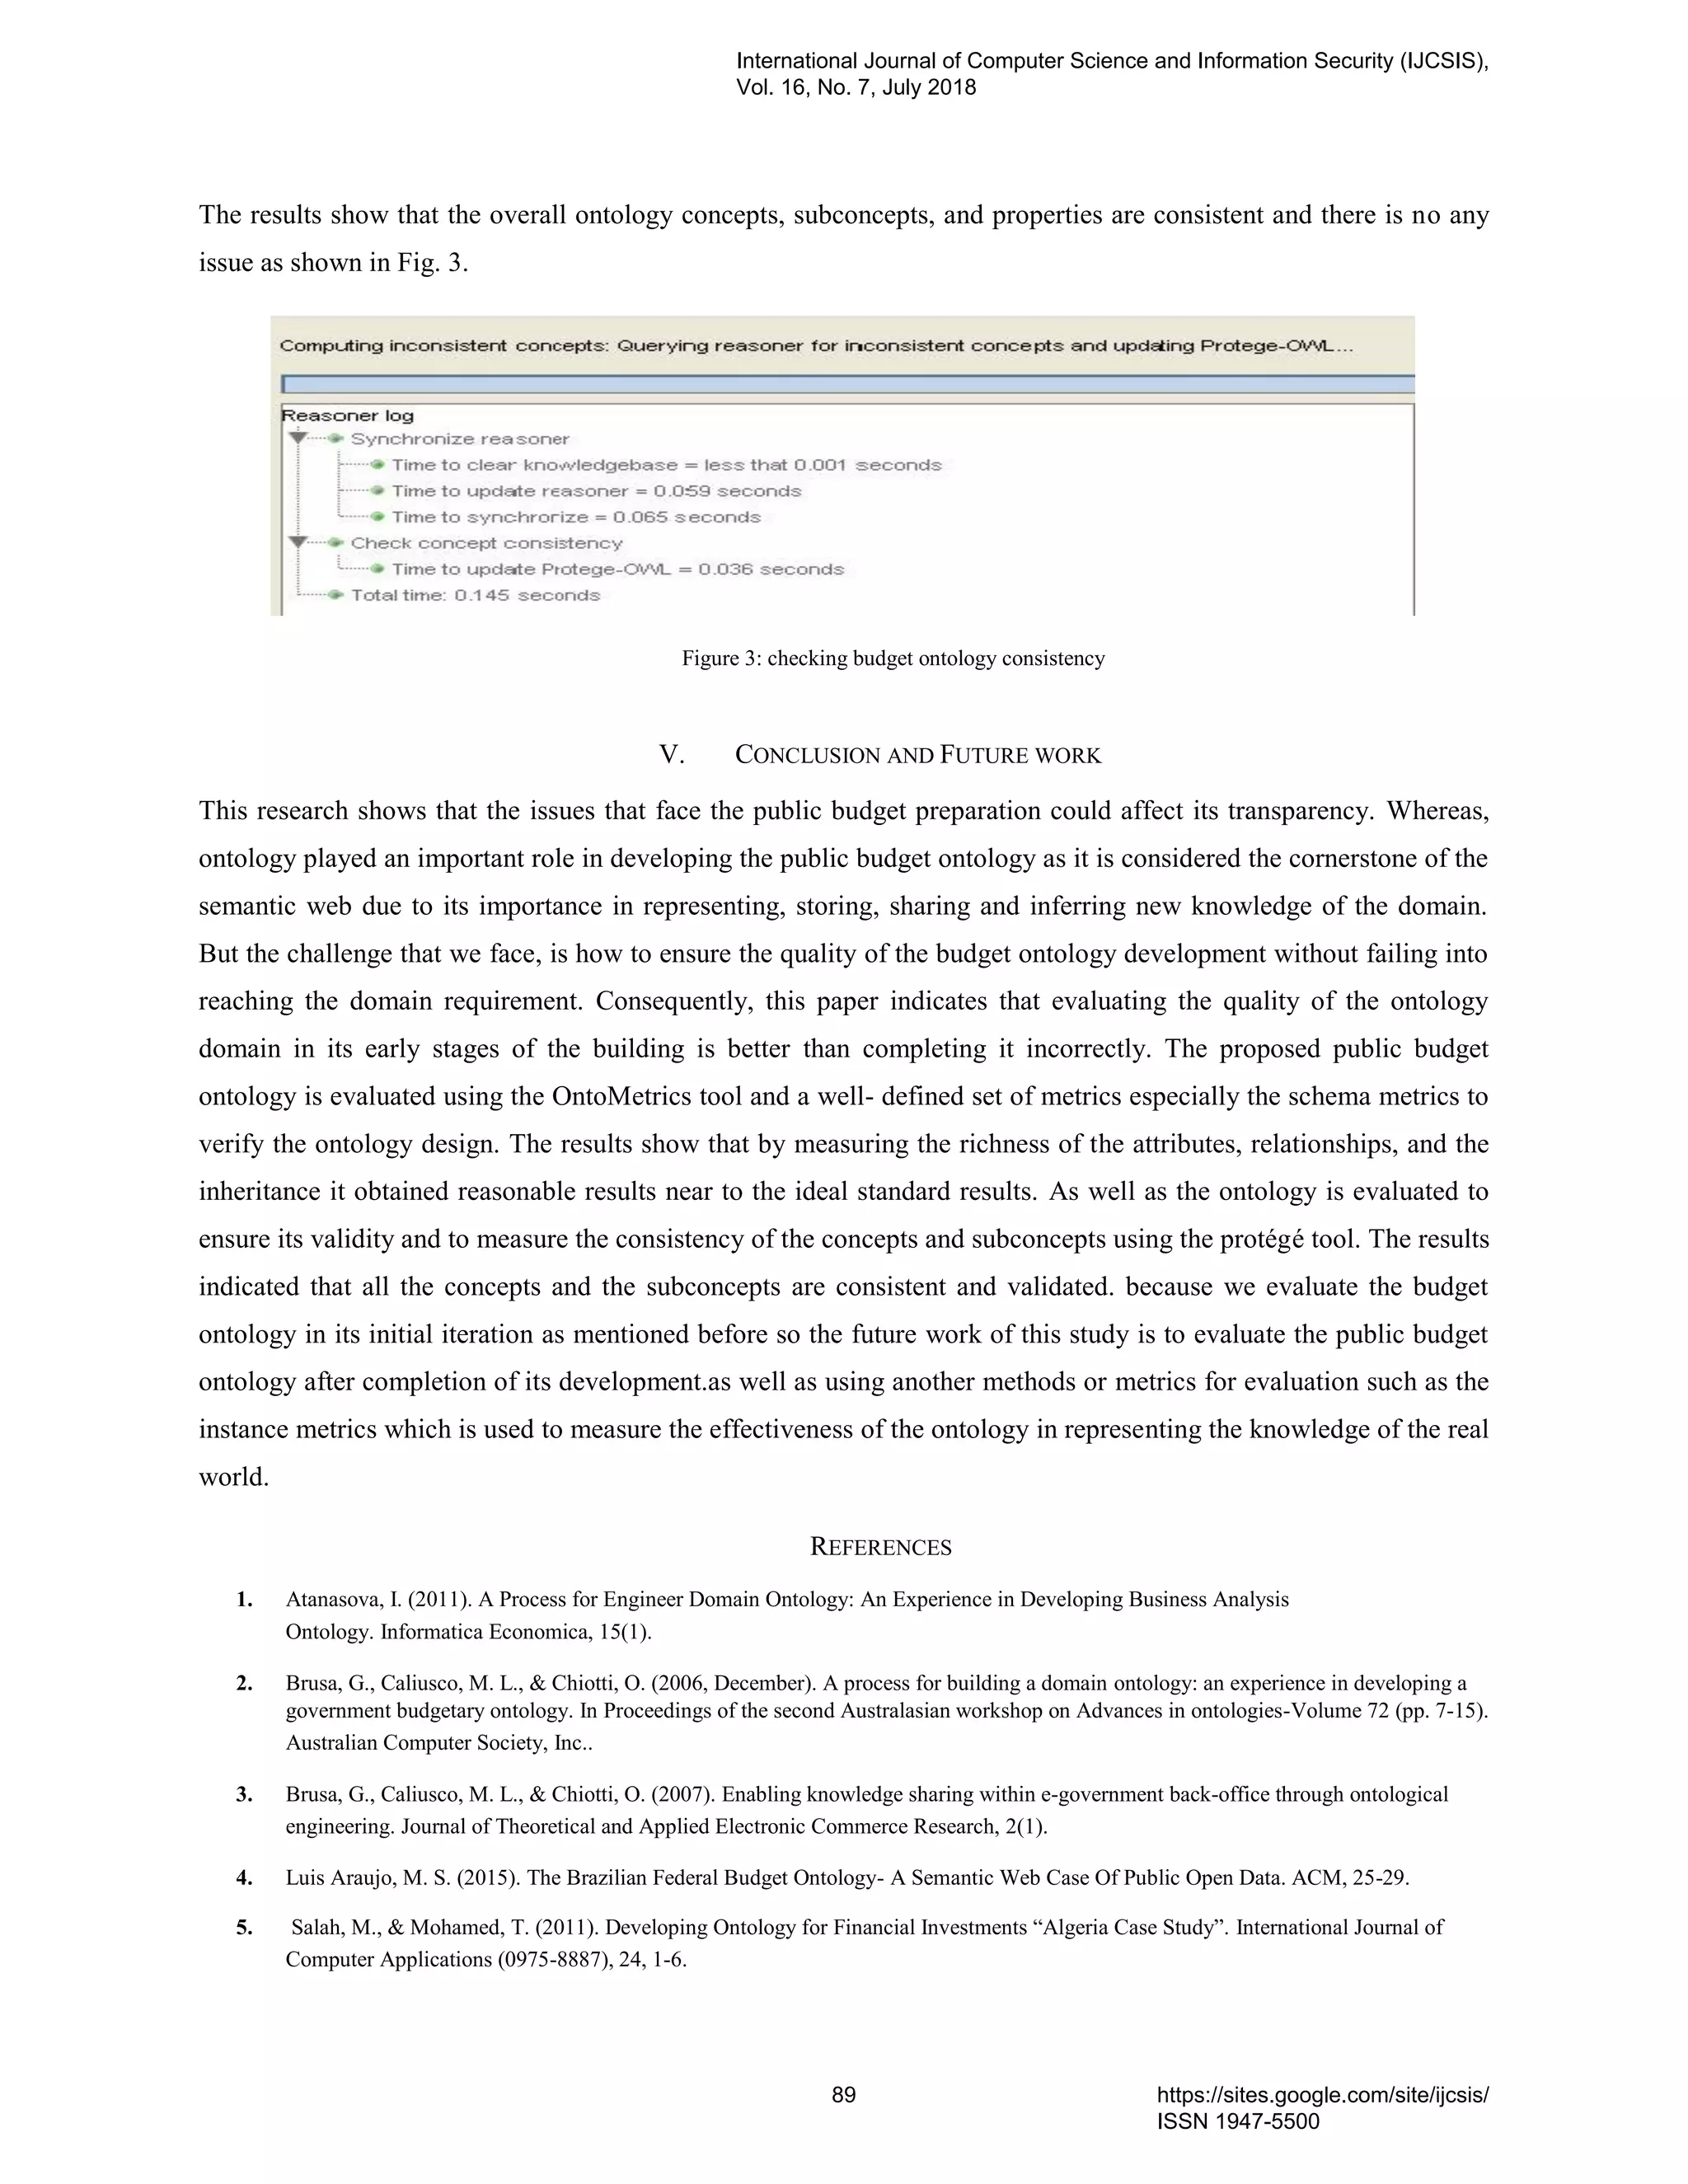


![Reliable Multicast Notification System on
Mobile Location Indexing
Thu Thu Zan
Cloud Computing Lab
University of Computer Studies, Yangon
Yangon, Myanmar
thuthuzan@ucsy.edu.mm
Sabai Phyu
Cloud Computing Lab
University of Computer Studies, Yangon
Yangon, Myanmar
sabaiphyu@ucsy.edu.mm
Abstract—Today, many people in their daily activities
include searching for required data and getting information on
the mobile phones. The mobile technology is fully supported for
such activities so that the mobile stands the most important and
common in the telecommunications. Typically, there is also the
need for many people to receive information automatically rather
than the self-query and search for it. In other words, there is no
person who does not want to receive important news,
environmental reminding for them. This paper proposed a
complete notification system with relevant architecture, research
methods and experimental results. In this system, a novel Range*
tree- based location index structure is proposed and mobile users
in the imminent emergency area are searched by range query.
Then, notification is sent by multicast to the mobile users
according to the current locations.
Keywords- range query, FCM, location update, index tree, Google
API
I. INTRODUCTION
Mobile has been significantly improved that acts as a king
in digital marketing today. With the growth of the mobile, its
technologies are widely applied to business areas, government
and public environment. Push notification, one of the mobile
technologies is a clickable real-time message system which
appears on the screen even mobile is in an idle state. For this
technology, there is an inexpensive way of communication
that interacts between a third-party server and application.
Moreover, it can create the rich push messages with valuable
notification and information. This is called Firebase Cloud
Messaging that allows queuing and delivering the message to
mobile devices to the server [10] [5]. Besides, as push comes
from location-based services (LBS), it also has a similar
service called pull [8]. However, apart from each of functional
differences, the results of two types are quite different in
energy consumption [2]. In pull type, the mobile application
pulls the server whenever it requires new messages. In this
way, pull may suffer battery consumption and message delays
when the pulling frequency is too high or too low [11].
Nevertheless, both approaches are used in risk reduction
management, such as natural disaster alert system and other
information accessing systems such as advertising, product
promotions and so on[1].
Normally, the special issues and requirements related to
LBS have grown since LBS together with the variety of
research areas of positioning, modelling, and analysis of
location-based data are rapidly increase [4]. In addition, there
has been a significant improvement in location-based
techniques in the modern era. These techniques or services are
normally based on the current location of the user that receives
from the location providers. GPS signals are uncertain to
estimate moving object locations under weak conditions of
Satellite [9]. Sometimes, Google Map is used to map the road
and places of interest in the location-based system. But lack of
details in Google Map especially in developing countries
brings the main challenge in such a system [7]. Google API is
one of the location access techniques that combine the
effectiveness of location providers such as Cellular Network,
Global Positioning System and Network Provider.
In this system, getting locations of mobile users are
undertaken by using Google API with relevant location update
policies. Besides, the appropriate update is done by taking
distance and time predefined thresholds at the client side. In
order to quickly access query, Range* tree-based index
structure is proposed for storing and managing of moving
objects' locations. Normally, indexing technology has been
used for moving data in recent years. It is used as an
optimization technique in real time that manages and stores
moving locations and query based on them. The objective of a
moving index structure is both query and update to be running
smoothly. Thus, moving object databases are created along
with relevant structure query language for accessing [3]. In
fact, the index structure that can quickly access the query is
not easy to take the appropriate update. In other words, it is
rarely to be perfect index structure for both updating and
querying. Therefore, moving object types and behaviours are
classified and stored them separately in the indexes [6]. In this
paper, thus, the duty of the update consistently undertakes at
the client side and efficient and fast query processing is done
on the server side by proposed index structure.
II. RESEARCH METHODOLOGIES
In this system, there are three aspects of methods that fully
support to be a complete multicast notification. Each of them
has certain facts and reasons to promote for a multicast
notification system. The appropriate explanations and
motivations of these methodologies are explained in the
following.
International Journal of Computer Science and Information Security (IJCSIS),
Vol. 16, No. 7, July 2018
92 https://sites.google.com/site/ijcsis/
ISSN 1947-5500](https://image.slidesharecdn.com/journalofcomputerscienceijcsisjuly2018fullvolume-180915043348/75/Journal-of-computer-science-ijcsis-july-2018-full-volume-106-2048.jpg)
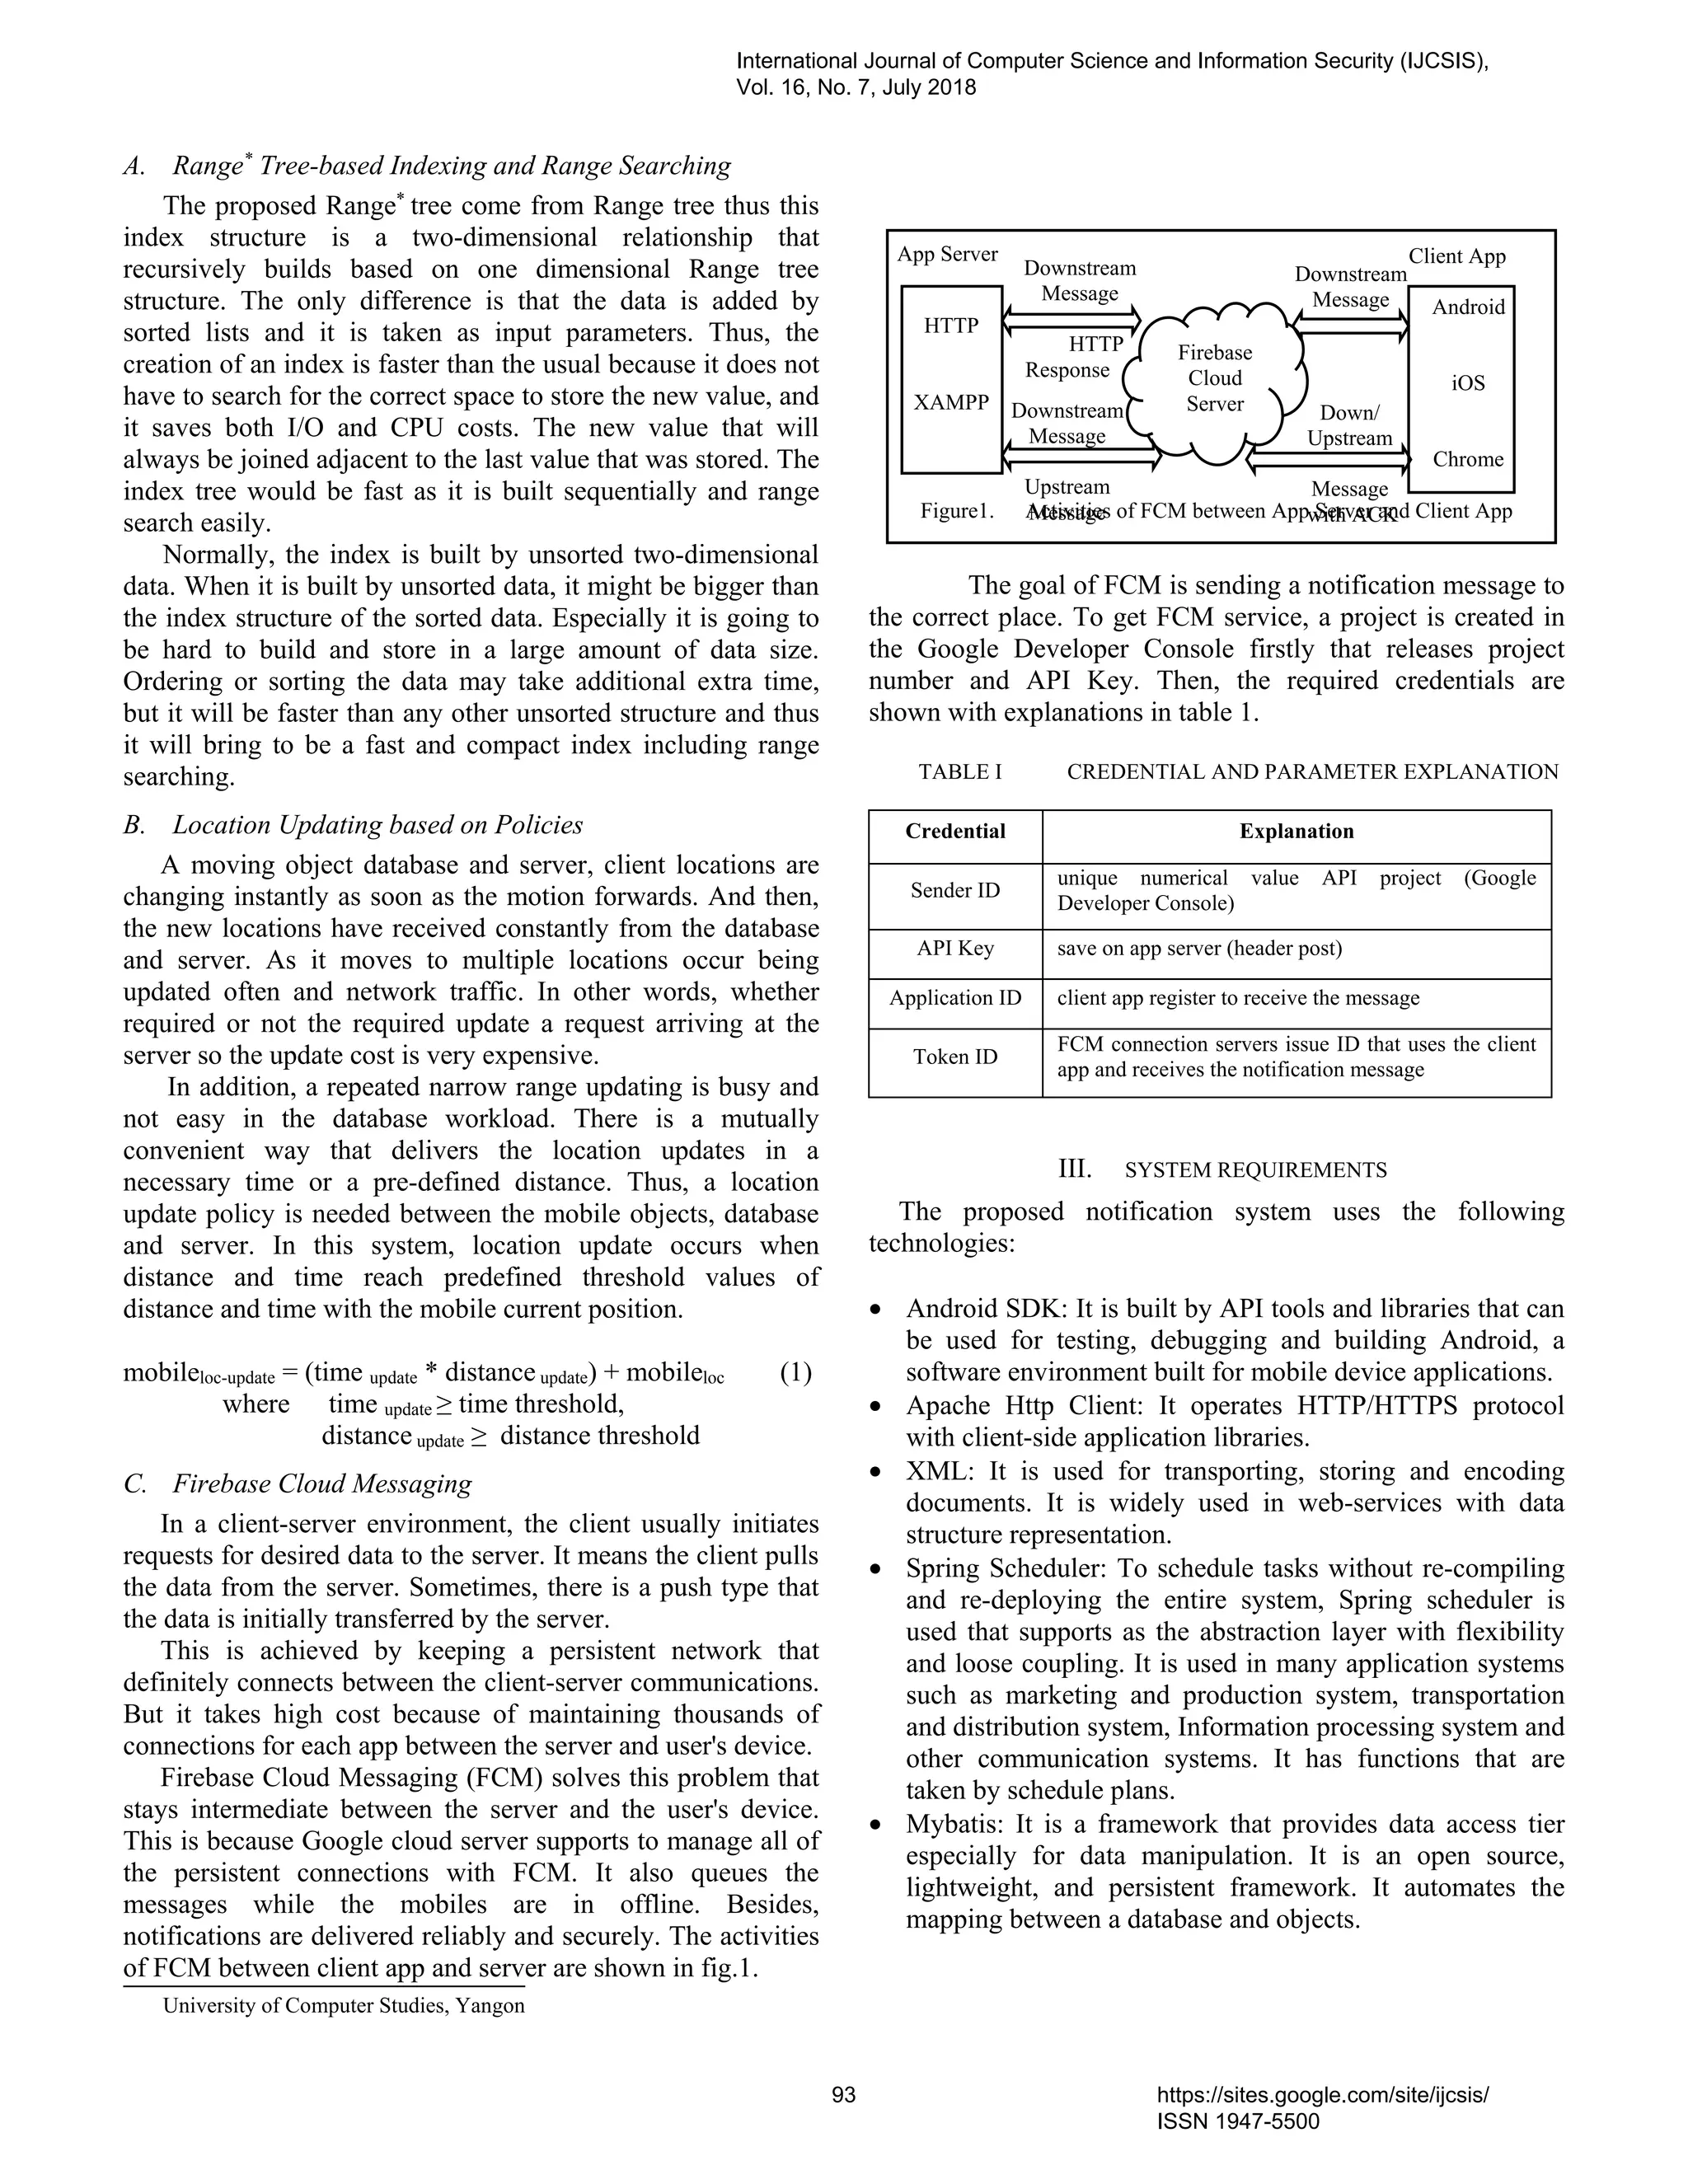
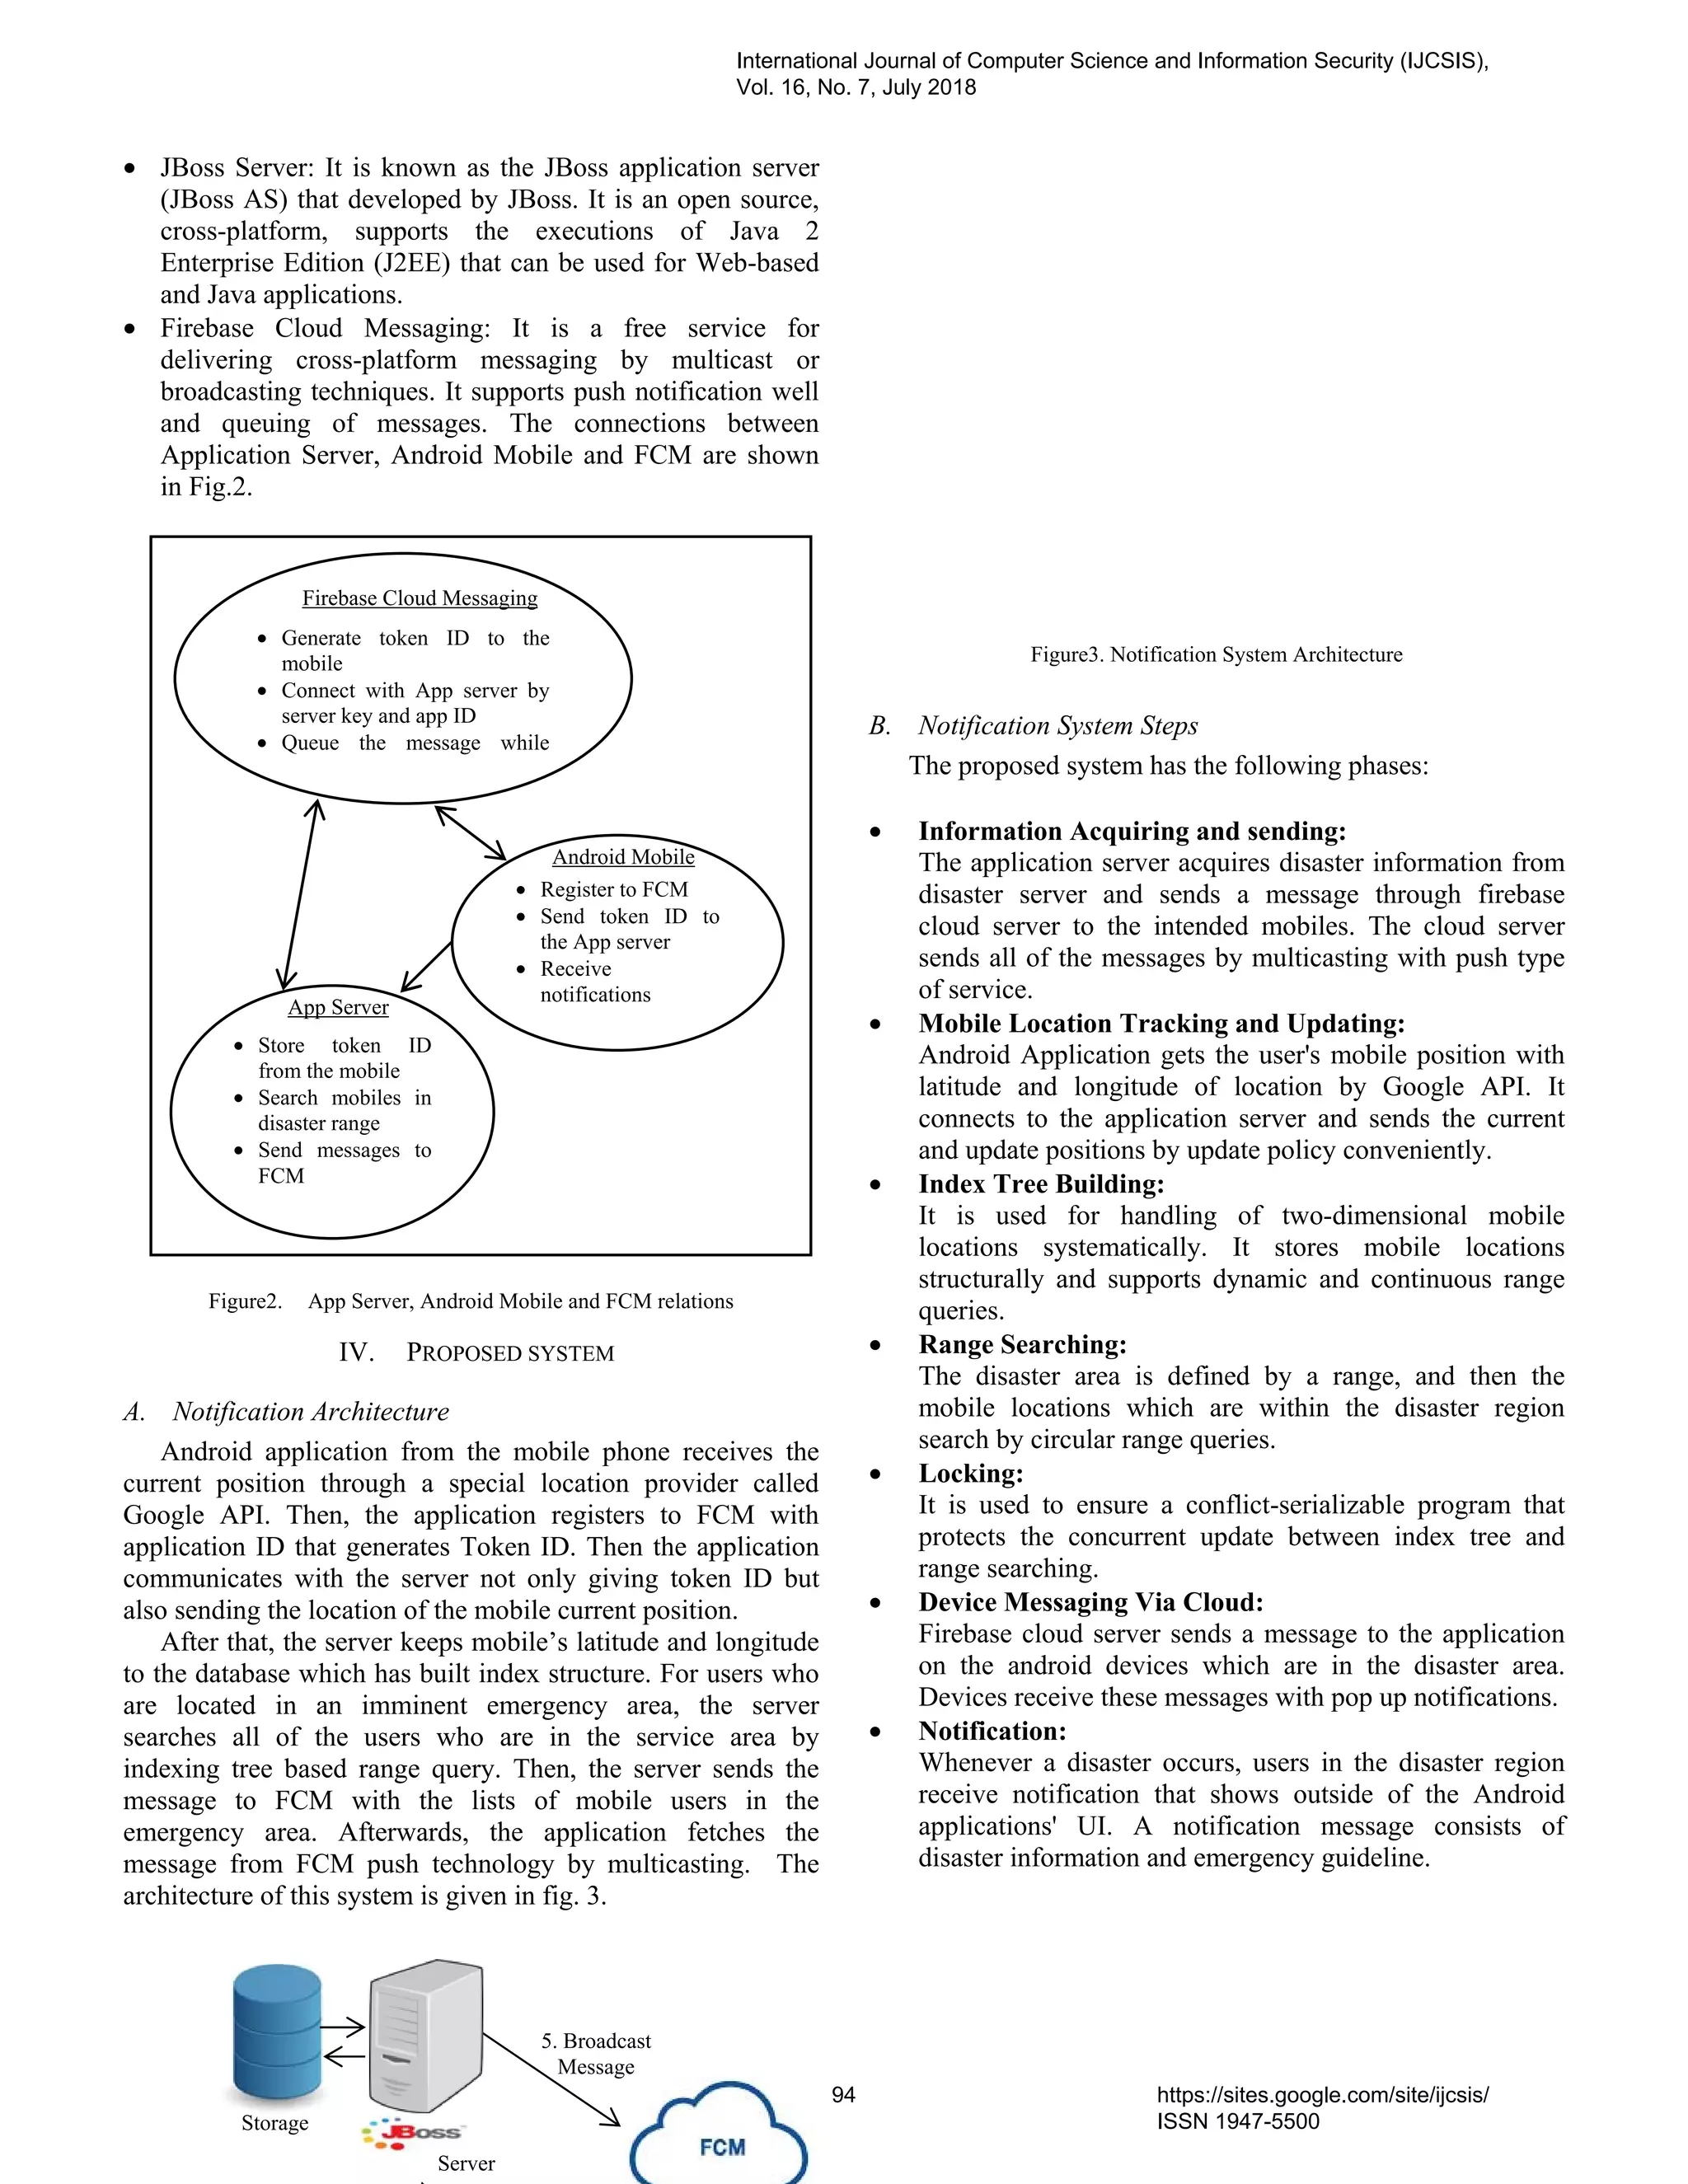
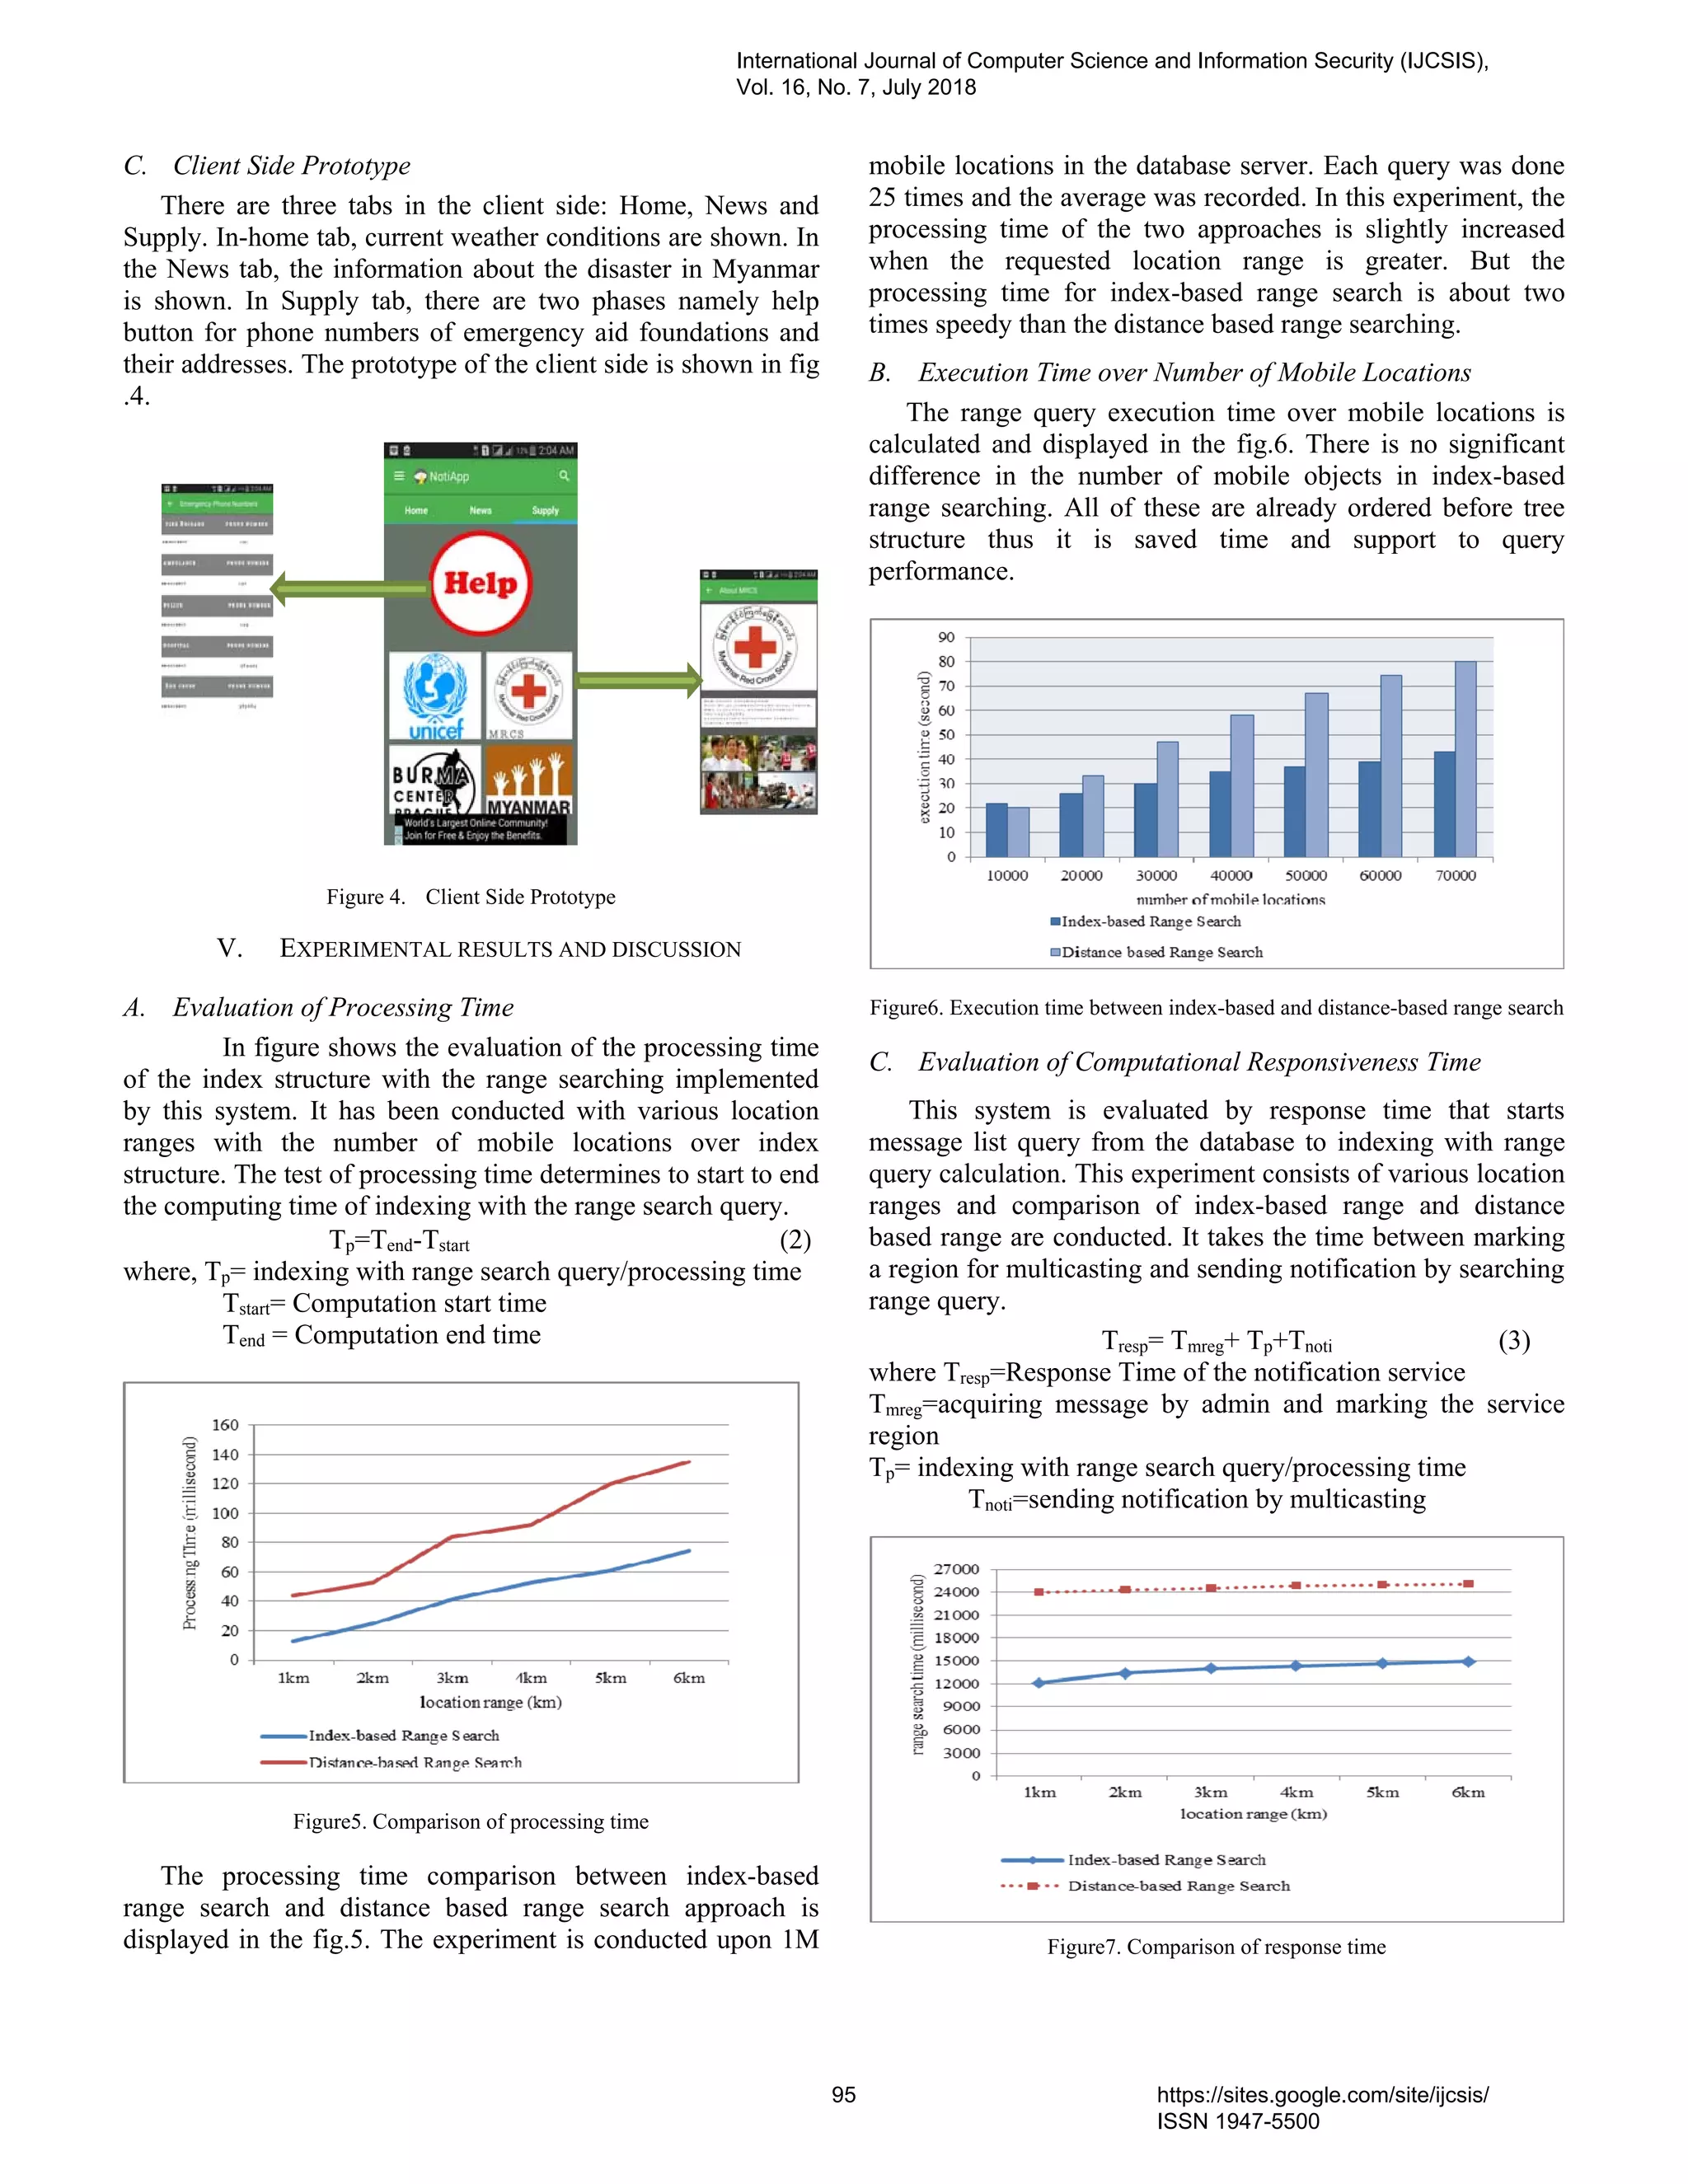
![The response time comparison between index-based range
and the distance based range is shown in the fig.7. It is done
by different location ranges and range search times are marked
on millisecond. The experiment is conducted with 1million
mobile locations in the database server. Both of them
gradually increase in range search time along with the
increasing number of location range. According to this fig.7,
even though the response time increases based on location
range, the response time of the index-based approach is about
two times faster than distance based range search approach.
D. Discussion
The experiment has been conducted on a Core i7 CPU and
8 GB memory. It basically performs for range search along
with processing time and response time from range searching.
The proposed index structure has three activities such as
preprocessing, querying, and updating. It is compared to
distance-based range searching for processing time,
responsiveness time and execution time on mobile locations.
The range searching time of the proposed index structure is
about two times faster than the distance based range searching.
The index-based range search takes better performance when
it is used for both a larger range area and the number of
datasets. Especially, it needs the less number of seconds when
it is used for a large number of moving dataset.
CONCLUSION
This system is aimed at sending multicast notification of
emergency conditions that are too bad and facing difficulties.
Notifications or alerts will be delivered to users who are in the
emergency area such as Tsunami, earthquake, cyclone and so
on. This system provides finding the location of mobile users
in an emergency region. Then, the message is delivered to
users who are actually needed for notification so that they are
saved with lives and property. The application is intended to
use on Android mobile. It will be used in all the mobiles
which are equipped with location provider in our future work.
This system can be used not only for emergency notification
but also product promotion and business notification of any
environment. This system takes not to be receiving duplicate
messages in multiple times and not to be expiring messages
during a time-to-live period. Moreover, the proposed Range*
tree structure allows for storing other moving objects such as
temperature, vehicle location and so on.
ACKNOWLEDGEMENT
I deeply express my special appreciation and thanks to Dr
Sabai Phyu who is my supervisor work at University of
Computer Studies, Yangon, Myanmar. She always kind and
believe in me. Her comments, advice, and insight are very
useful. I will not be able to do well without her precious
guideline and valuable suggestion during the period of
research.
REFERENCES
[1] A.Elazab, B.Shababa, H.Hefny, "Location-Based Approach for
Messaging Services", Egyptian Computer Science Journal, Vol. 42 No.2,
pp. 30-43, May 2018.
[2] D.Burgstahler, U.Lampe, N.Richerzhagen, R.Steinmetz, " Push vs. Pull:
An Energy Perspective ", 2013 IEEE 6th International Conference on
Service-Oriented Computing and Applications, Koloa, HI, USA, pp.
190-193, 16-18 Dec 2013.
[3] H.Hajari, F.Hakimpour, "A Spatial Data Model For Moving Object
Databases", International Journal of Database Management Systems
(IJDMS) Vol.6, No.1, pp. 1-20, Feb 2014.
[4] H. Huang, G. Gartner, Current Trends and Challenges in Location-Based
Services, International Journal of Geo-Information, ISPRS Int. J. Geo-
Inf. 2018, Vol. 7, 199, 2018.
[5] H.Singh, S.udesh Kumar, H.Kaur, "Location Based System Using
Google Cloud Messaging", Proceedings of National Conference on
Innovative Trends in Computer Science Engineering (ITCSE-2015),
BRCMCET, Bahal, Pp.183-186, 4th April 2015.
[6] J.Qiu, Q. Guo, Y. Xiong, "QR*-Tree: A New Hybrid Spatial Database
Index Structure", Recent Advances in Computer Science and
Information Engineering, Part of the Lecture Notes in Electrical
Engineering book series (LNEE), Vol. 126, pp 795-801, Feb 5 2012.
[7] P.Doshi, P. Jain, A.Shakwal," Location Based Services and Integration of
Google Maps in Android ", International Journal Of Engineering And
Computer Science, Vol. 3 Issue 3 pp. 5072-5077, March 2014.
[8] S.W. Rahate, Dr M.Z. Shaikh, "Geo-fencing Infrastructure: Location
Based Service", International Research Journal of Engineering and
Technology (IRJET), Vol. 03 Issue: 11, pp. 1095-1098, Nov -2016.
[9] V. A. Paz-Soldan, R. C. Reiner Jr, A. C. Morrison, S. T. Stoddard, U.
Kitron, T. W. Scott, J. P. Elder, E. S. Halsey, "Strengths and
Weaknesses of Global Positioning System (GPS) Data-Loggers and
Semi-structured Interviews for Capturing Fine-scale HumanMobility:
Findings from Iquitos, Peru", June 12, 2014.
[10] Y.Selim Y.Bahadir I.Aydin M.Demirbas, "Google Cloud Messaging
(GCM): An Evaluation", Globecom 2014 - Symposium on Selected
Areas in Communications: GC14 SAC Internet of things IEEE, pp.
2847-2852, 2014.
[11] Z. Ji, I. Ganchev, M.O’Droma1, Q.Zhao, " A Push-Notification Service
for Use in the UCWW", 2014 International Conference on Cyber-
Enabled Distributed Computing and Knowledge Discovery, IEEE
Computer Society, Shanghai, China, pp. 318-322, October 10 - 12, 2014.
AUTHORS PROFILE
Professor Sabai Phyu is a dean of
Cloud Computing Lab at University of
Computer Studies, Yangon (UCSY). She
is interested in computer science,
information theory and cloud computing.
Her research areas include wireless and
mobile cloud computing, spatial indexing
and virtualization. She currently works at
the Software Department, UCSY,
Myanmar.
Thu Thu Zan is a PhD candidate at
University of Computer Studies, Yangon.
She is very interested in mobile
computing and moving object indexing.
Her current research is related to moving
object database, wireless technologies,
location-based services and spatial query
and index structure. She is also a research
student at University of Computer Studies,
Yangon, now.
International Journal of Computer Science and Information Security (IJCSIS),
Vol. 16, No. 7, July 2018
96 https://sites.google.com/site/ijcsis/
ISSN 1947-5500](https://image.slidesharecdn.com/journalofcomputerscienceijcsisjuly2018fullvolume-180915043348/75/Journal-of-computer-science-ijcsis-july-2018-full-volume-110-2048.jpg)
![Building an Effective Intrusion Detection System using Genetic Algorithm
based Feature Selection
Mr. Prakash N Kalavadekar, Research Scholar Dr. Shirish S. Sane
K.K Wagh Institute of Engineering Education & Research, Nashik
Savitribai Phule Pune University, India, kprak3004@gmail.com, sssane@kkwagh.edu.in
Abstract-Conventional methods of intrusion prevention like firewalls, cryptography techniques or access management schemes, have
not proved themselves to completely defend networks and systems from refined malwares and attacks. Intrusion Detection Systems
(IDS) are providing better solution to the current issues and thus became an important element of any security infrastructure to
detect these threats so as to prevent widespread harm. The basic aim of IDS is to detect attacks and their nature and prevent damage
to the computer systems.
A signature-based IDS builds a classifier model using training data. The trained model is then used to detect and classify various
attacks. As like any other classification applications, the issues in building such IDS is to pre-process the training dataset by selecting
only a handful of important features to build a compact model in least amount of time without degradation in detection rate,
accuracy etc.
Several different algorithms are available for feature selection. FMIFS is one of such reported feature selection approach. This paper
investigates the performance of IDS that employs genetic algorithm for features selection. The empirical results presented here are
encouraging and show superiority of Genetic based feature selection over FMIFS and other state-of-the-art feature selection
algorithms with respect to time required to build the model, detection rate, accuracy, false positive rate and F-measure.
Keywords: Intrusion Detection, Security, Signature, Features.
I. INTRODUCTION
Security attacks are classified into two types: passive and active. The passive attacks are usually invisible (hidden) and do
tapping of the communication link to gather data or destroy the network functioning. Passive attacks are classified as
eavesdropping, tampering, traffic monitoring and analysis. Active attacks affect the operations within the network [1]. The
performance of networking services may get degraded or come to a halt because of these attacks. Active attacks are classified
as hole attacks, Denial-of-Service (DoS), jamming, flooding etc. The security solutions for two types of networks (wireless or
wired) are as given below:
Prevention: It provides preventing before happening of any attack. Signature based technique can used to protect against the
targeted attack.
Detection: If an attacker break the precautions made by the prevention system, then defending is difficult for such types of
attacks. At this point, the protection answer would instantly use the ‘detection’ section of the attack to find which parts of the
nodes are being compromised.
Mitigation: In this step the affected nodes were removed from the network and securing the network [18].
In any security system, if prevention does not stop intrusions, then detection system will be used for further process. Detection
means finding suspicious behavior of user during a network communications. In the security set up, IDS offer information to
the opposite systems such as identification, location ( single node or group of nodes from particular region), time of the
intrusion, type of intrusion (active or passive), specific attack name, OSI layer such as physical, data link, network from where
attack is happened. This data would be terribly useful in defense like mitigating and analyzing the results of attacks. So, IDS
plays important role in network security.
Intrusion is referred as: “any set of actions that plan to compromise the integrity, confidentiality, or handiness of a resource”
and intrusion interference techniques such as encoding, authentication, access management, secure routing, etc. are parts of the
initial phase of defense against intrusions. But till there are security systems does not provide fully preventions for intrusions.
The discovery of security keys to the intruders can compromise the security of nodes. So this will break the defined mechanism
of preventive security. So the IDS will play the role of disclosure of intrusions for preventing important system resources. The
IDS should posses as: “low false positive rate, calculated because the proportion of normalcy variations detected as anomalies,
International Journal of Computer Science and Information Security (IJCSIS),
Vol. 16, No. 7, July 2018
97 https://sites.google.com/site/ijcsis/
ISSN 1947-5500](https://image.slidesharecdn.com/journalofcomputerscienceijcsisjuly2018fullvolume-180915043348/75/Journal-of-computer-science-ijcsis-july-2018-full-volume-111-2048.jpg)
![and high true positive rate, calculated because the proportion of anomalies detected”. So there is plenty of scope for analysis in
detection performance for unknown attacks & detection speed.
II. MOTIVATIONS AND RELATED WORK
Detection using Misuse or Signatures: -These types of methods are used to recognize known attacks using signatures of
previously known attacks. These methods always gives accurate & efficient finding of attacks which are known with low false
positive rate[19].The limitation is that it only works for known attack, if any new kind of attack then it will not useful to detect.
Sobh [19] says that such systems works like anti-virus systems, which will be useful for only detecting some or all known
attacks.
These systems used known attack dataset like KDD Cup 99 which contains 41 attributes for each signature of different types
(DOS, R2L, U2R, and Probe) attacks [5].
Malki and Shun [13] have developed signature based IDS using neural network with the back propagation training algorithm. It
was used to determine and predict current and possibly future attacks. For training & testing of classifier KDD Cup (1999)
dataset was used.
Siva Sivatha Sindhu, S.Geetha and A. Kannan [6] have developed decision tree based light weight signature based detection
using a wrapper approach for features selection and nerotree for classification of attacks. They have used genetic algorithm for
optimizing selection of signature features from given 41 features of KDD Cup 99 dataset.
Chung and Wahid [21] proposed a classification methodology in which they used dynamic swarm based rough set and
simplified swarm optimization (SSO) with hybrid feature selection. They used weighted local search (WLS) strategy to
enhance the performance of SSO to find a better solution from the neighborhood. They achieved the 93.3% accuracy in
classifying intrusions. Kuang et al. had proposed a hybrid methodology for intrusion detection by combining multi-layered
SVM with kernel principal component analysis (KPCA) and genetic algorithm (GA) to increase the accuracy of the model. The
dimension of features set and the training time is reduced using KPCA. In the KDD Cup99 dataset there are 41 features from
which few features have no effect or have high levels of noise. So, they find the suitable features using SVM, decision tree and
simulated annealing (SA) [19].
Kim et al. [21] used C4.5 decision tree algorithm in hybrid misuse detection system and proposed an autonomous labeling
approach to support vector machine algorithms. They excluded the well known attacks from the dataset which improves the
performance of SVM. So to improve efficiency of intrusion detection, features selection is important. So, they proposed a
method based on gradually feature removal combined with SVM and ant colony algorithm. SVM may be inefficient in large
scale intrusion detection datasets because it will take more time to train a model. So this drawback can be removed by using
Core Vector Machine (CVM) and Partial Least Square(PLS) features extraction to increase the training speed and detection
capability.
Mukkamala and Sung [22] selected 6 features from 41 using a novel feature selection algorithm and evaluated using SVM
model. So selected features improves the classification accuracy by 1%.
Chebrolu et al. [23] had reduced features from 41 to 12 of KDD Cup99 using a Markov blanket model and decision tree
analysis.
Chen et al. [24] had selected 4 features using a pre-processing feature selection phase and implemented IDS based on Flexible
Neural Tree (FNT). The model achieved 99.19% detection accuracy.
Amiri had build the IDS using LS-SVM classifier with a forward feature selection algorithm which uses the mutual
information method to measure the relation among features [2].
International Journal of Computer Science and Information Security (IJCSIS),
Vol. 16, No. 7, July 2018
98 https://sites.google.com/site/ijcsis/
ISSN 1947-5500](https://image.slidesharecdn.com/journalofcomputerscienceijcsisjuly2018fullvolume-180915043348/75/Journal-of-computer-science-ijcsis-july-2018-full-volume-112-2048.jpg)
![Training Dataset [KDDCup99/NSL-KDD] Features Selecton using Genetc Algorithm
Training with selected
features
Classifcaton using SVM/J48Testng Dataset /Packet
Data
AtackInntrusion or Normal Unknown Atack
Horng et al. had built the IDS by combining a hierarchical clustering and the SVM. The training data is selected using
hierarchical clustering algorithm which reduced the average training and testing time as well as improves the classification
performance. Experiment was performed on the corrected labels KDD Cup 99 dataset, which includes some new attacks. The
IDS which is based on SVM gives false positive rate as 0.7% and overall accuracy is 95.75% [2].
III. IMPLEMENTATION METHODOLOGIES
Signature based IDS can be trained by using previously known attack pattern. Whenever new record comes to system it
compares that pattern with previously known attack pattern and based on comparison decision will be given. Figure 1 shows
proposed architecture of Effective IDS, in which signature based detection system will be used for detection of known &
unknown attacks.
Figure 1. Framework of EIDS
Before applying any learning algorithm data processing step is essential. By reducing attribute space a good understandable
model can be designed. Feature reduction can be done by two approaches as1] wrapper which uses the learning algorithm to
find out the usefulness of features, 2] the filter which uses general characteristics of the data. The wrapper approach runs much
slower but produces better result than filter.
As per the survey, from the total 41 features of signature based dataset, 5 features for Probe attack, 9 features for DoS attack,
14 features for R2L attack and 8 features for U2R attack are important. So to get these numbers of optimized features GA
(Genetic Algorithm) is used [28].
Features selection using Genetic Algorithm (GA) requires taking care of encoding & fitness function. For IDS, a fixed-length
binary string encoding can be used in which the value of the gene 0 or 1 is decided from the number of features. So, each
individual chromosome with fixed length in population represents the given features set.
Fitness Function: - The fitness feedback is required to evaluate feature subset which is represented in GA population. This will
be helpful for enhancing detection accuracy of the IDS i.e. it is indirectly achieved by maximizing the sensitivity and
specificity of the classifier.
The GA works as filter approach for selecting number of features from given dataset. So the length of chromosome is
depending on number of features in dataset. The population size is decided on number of records in given dataset. The number
of generations and termination condition can be used to generate new population to get best solution or expected solution. The
tournament selection is a method of selecting individual from a population of individuals and used to choose few individuals at
random from the population and which is fittest will be selected for crossover operation.
The crossover probability will decide to select two individuals from population to form new individual in new population. The
mutation with low probability need to add a little bit randomness into population’s genetics otherwise every combination of
solutions would be initial population.
International Journal of Computer Science and Information Security (IJCSIS),
Vol. 16, No. 7, July 2018
99 https://sites.google.com/site/ijcsis/
ISSN 1947-5500](https://image.slidesharecdn.com/journalofcomputerscienceijcsisjuly2018fullvolume-180915043348/75/Journal-of-computer-science-ijcsis-july-2018-full-volume-113-2048.jpg)
![Algorithm Steps:
Figure 2. Pseudo code for Genetic Algorithm to select features
This implies that some of the bits in the bit string can be flipped. The algorithm termination condition will decide the
population has converged i.e. does not produce solution which are significantly different from the previous generation. The
different values are set as 0.1 to 1.0 for crossover probability and 0.0001 to 0.1 for mutation probability to get different
important features from the three different datasets. These features are used with J48 classifier to get best accuracy, detection
rate and false positive rate. In this paper we have shown the best results with less time for building model and minimum
number of features [28].
IV. EXPERIMENTAL RESULTS AND ANALYSIS
A. Datasets
To test and evaluate IDS only a few public datasets are available currently. The commonly used datasets in the literature are
KDD Cup99 dataset; NSLKDD dataset and Kyoto 2006+ dataset to assess the performance of IDS. These datasets are of
different data sizes and have varying number of features which is useful for validating feature selection methods. Therefore,
testing of proposed approach with these datasets facilitates a fair and rational comparison with other state-of-the-art detection
approaches.
To evaluate the performance of intrusion detection systems mostly the KDD Cup99 dataset is widely used. It consists of five
different classes: ‘normal’ and four types of attacks, namely, the ‘DoS’, ‘Probe’, ‘U2R’ and ‘R2L’. It contains training data
with approximately five million connection records and test data with about two million connection records. Each record in the
dataset has 41 different quantitative and qualitative features and labeled as either ‘normal’ or one of the attacks mentioned
above.
Tavallaee had proposed a new revised version of the KDD Cup99 as NSLKDD dataset. A huge number of redundant records
are the problem of the KDD Cup99 dataset is resolved in NSLKDD dataset. The 41 different quantitative and qualitative
features are available in each record of NSLKDD as like the KDD Cup99 dataset.
Input- Binary encoded string which is having length n (where n is the number of features), population size, Uniform
crossover probability (Pc), Mutation probability (Pm), Empty solution (All bits value ‘0’).
Output- Selected important features.
1. Initialize the population with chromosome which has size n and each gene value can be ‘0’ or ‘1’. (0-means
feature value zero and 1- means feature value other than zero )
2. Initialize Maximum Fitness = Solution length (n), previous fitness = 0 & calculate current fitness (initial value
is zero) of chromosome by incrementing fitness value by one if solution bits match with gene bits.
3. While (( current fitness – previous fitness)>0.001) {
a. With the specified probability Pc & Pm do uniform crossover and mutation operations.
b. Increment fitness value if solution bits match with gene bits.
c. Make previous fitness = current fitness.
4. Using tournament selections find the best of chromosomes into new population. }
5. Display the solution with selected features.
International Journal of Computer Science and Information Security (IJCSIS),
Vol. 16, No. 7, July 2018
100 https://sites.google.com/site/ijcsis/
ISSN 1947-5500](https://image.slidesharecdn.com/journalofcomputerscienceijcsisjuly2018fullvolume-180915043348/75/Journal-of-computer-science-ijcsis-july-2018-full-volume-114-2048.jpg)
![Both the KDD Cup 99 and NSL-KDD benchmarks include different datasets: 1) the training sets called the “10% KDD Cup
99” and “KDDTrain+”, the testing sets called “KDD Cup test data” and “KDDTest+” and sets containing samples of new
attacks previously unseen in the training data called the corrected labels KDD Cup 99 and KDDTest-21.
Song presented the Kyoto 2006+ dataset which contains three years of real traffic data between November 2006 and August
2009. The data was collected from both honeypots and regular servers that were deployed at Kyoto University. Each record in
this dataset has 24 different features. The Table 1 provides the details of datasets used in experiments.
TABLE 1: Dataset details
Dataset # Features Records
KDD Cup 99 10% 41 494021
KDD Cup_Corrected_Test 41 311029
NSLKDD 41 125973
Kyoto 2006+ (1-3 Nov 2007) 24 237718
Kyoto 2006+ (27-31 Aug 2009) 24 777110
B. Experimental Setup
Feature selection algorithms aim at selecting optimum features from the given set of features. The selected features are then
used by a classifier to build a trained model without compromising the detection rate and/or accuracy of the model.
Table 2 shows number of features selected by different feature selection methods such as Genetic Algorithm (GA), FMIFS [2]
and three in-built attribute selection algorithms such as AttributeSelection, RandomProjection, RandomSubset from Weka
3.8.1for each of the five datasets. It can be seen from Table 2 that Genetic algorithm based feature selection algorithm selects
lesser number of features in case of all five datasets when compared with FMIFS and Randomsubset while the algorithm
AttributeSelection selects the least value of features. Number of features selected by ‘RandomProjection’ is intermediate. The
time required for selection of attribute by the GA algorithm is also shown and it is directly proportional to number of attributes
and instances. Time required by FMIFS or other algorithms in WEKA are not available and thus not shown. The best Pc=0.3
and Pm=0.001, Pc=0.9 and Pm=0.001,Pc=0.6 and Pm=0.0001, Pc=0.8 and Pm=0.001 for KDD Cup 99, NSLKDD, Kyoto
2006+ 27-31 Aug 2009 and Kyoto 2006+ 1-3 Nov 2007 was selected respectively.
TABLE 2: Number of Features selected
Dataset #Attributes #Records # Attributes selected by
FMIFS GA Attribute
Selection
Random
Projection
Random
Subset#
Attribu
tes
Time
needed
(sec)
KDD Cup 99 41 494021 19 12 13.711 11 10 21
NSL-KDD 41 125973 18 14 4.185 19 10 21
Kyoto 2006 +
(27-31 August
2009)
24 777110 4 6 21.645 4 10 9
Kyoto 2006 +
(1-3 Nov 2007)
24 237718 5 6 6.688 2 10 9
KDD Cup
99_Corrected
41 311029 19 14 8.476 12 10 21
In order to test and compare effectiveness of a IDS constructed using attributes selected by GA, FMIS and other approaches, in
terms of time need to build the system, detection rate, false positive rate and accuracy using the J48 classifier in WEKA 3.8.1
and LIBSVM classifier in and MATLAB. J48 is decision tree based classifier and normally needs lesser time to construct. To
evaluate the performance three different datasets are used as KDD Cup99, NSLKDD and Kyoto 2006+ dataset. The
experimental results of the J48 and LIBSVM based on GA are compared with the results using the other LSSVM-IDSs with
FMIFS as feature selection.
International Journal of Computer Science and Information Security (IJCSIS),
Vol. 16, No. 7, July 2018
101 https://sites.google.com/site/ijcsis/
ISSN 1947-5500](https://image.slidesharecdn.com/journalofcomputerscienceijcsisjuly2018fullvolume-180915043348/75/Journal-of-computer-science-ijcsis-july-2018-full-volume-115-2048.jpg)

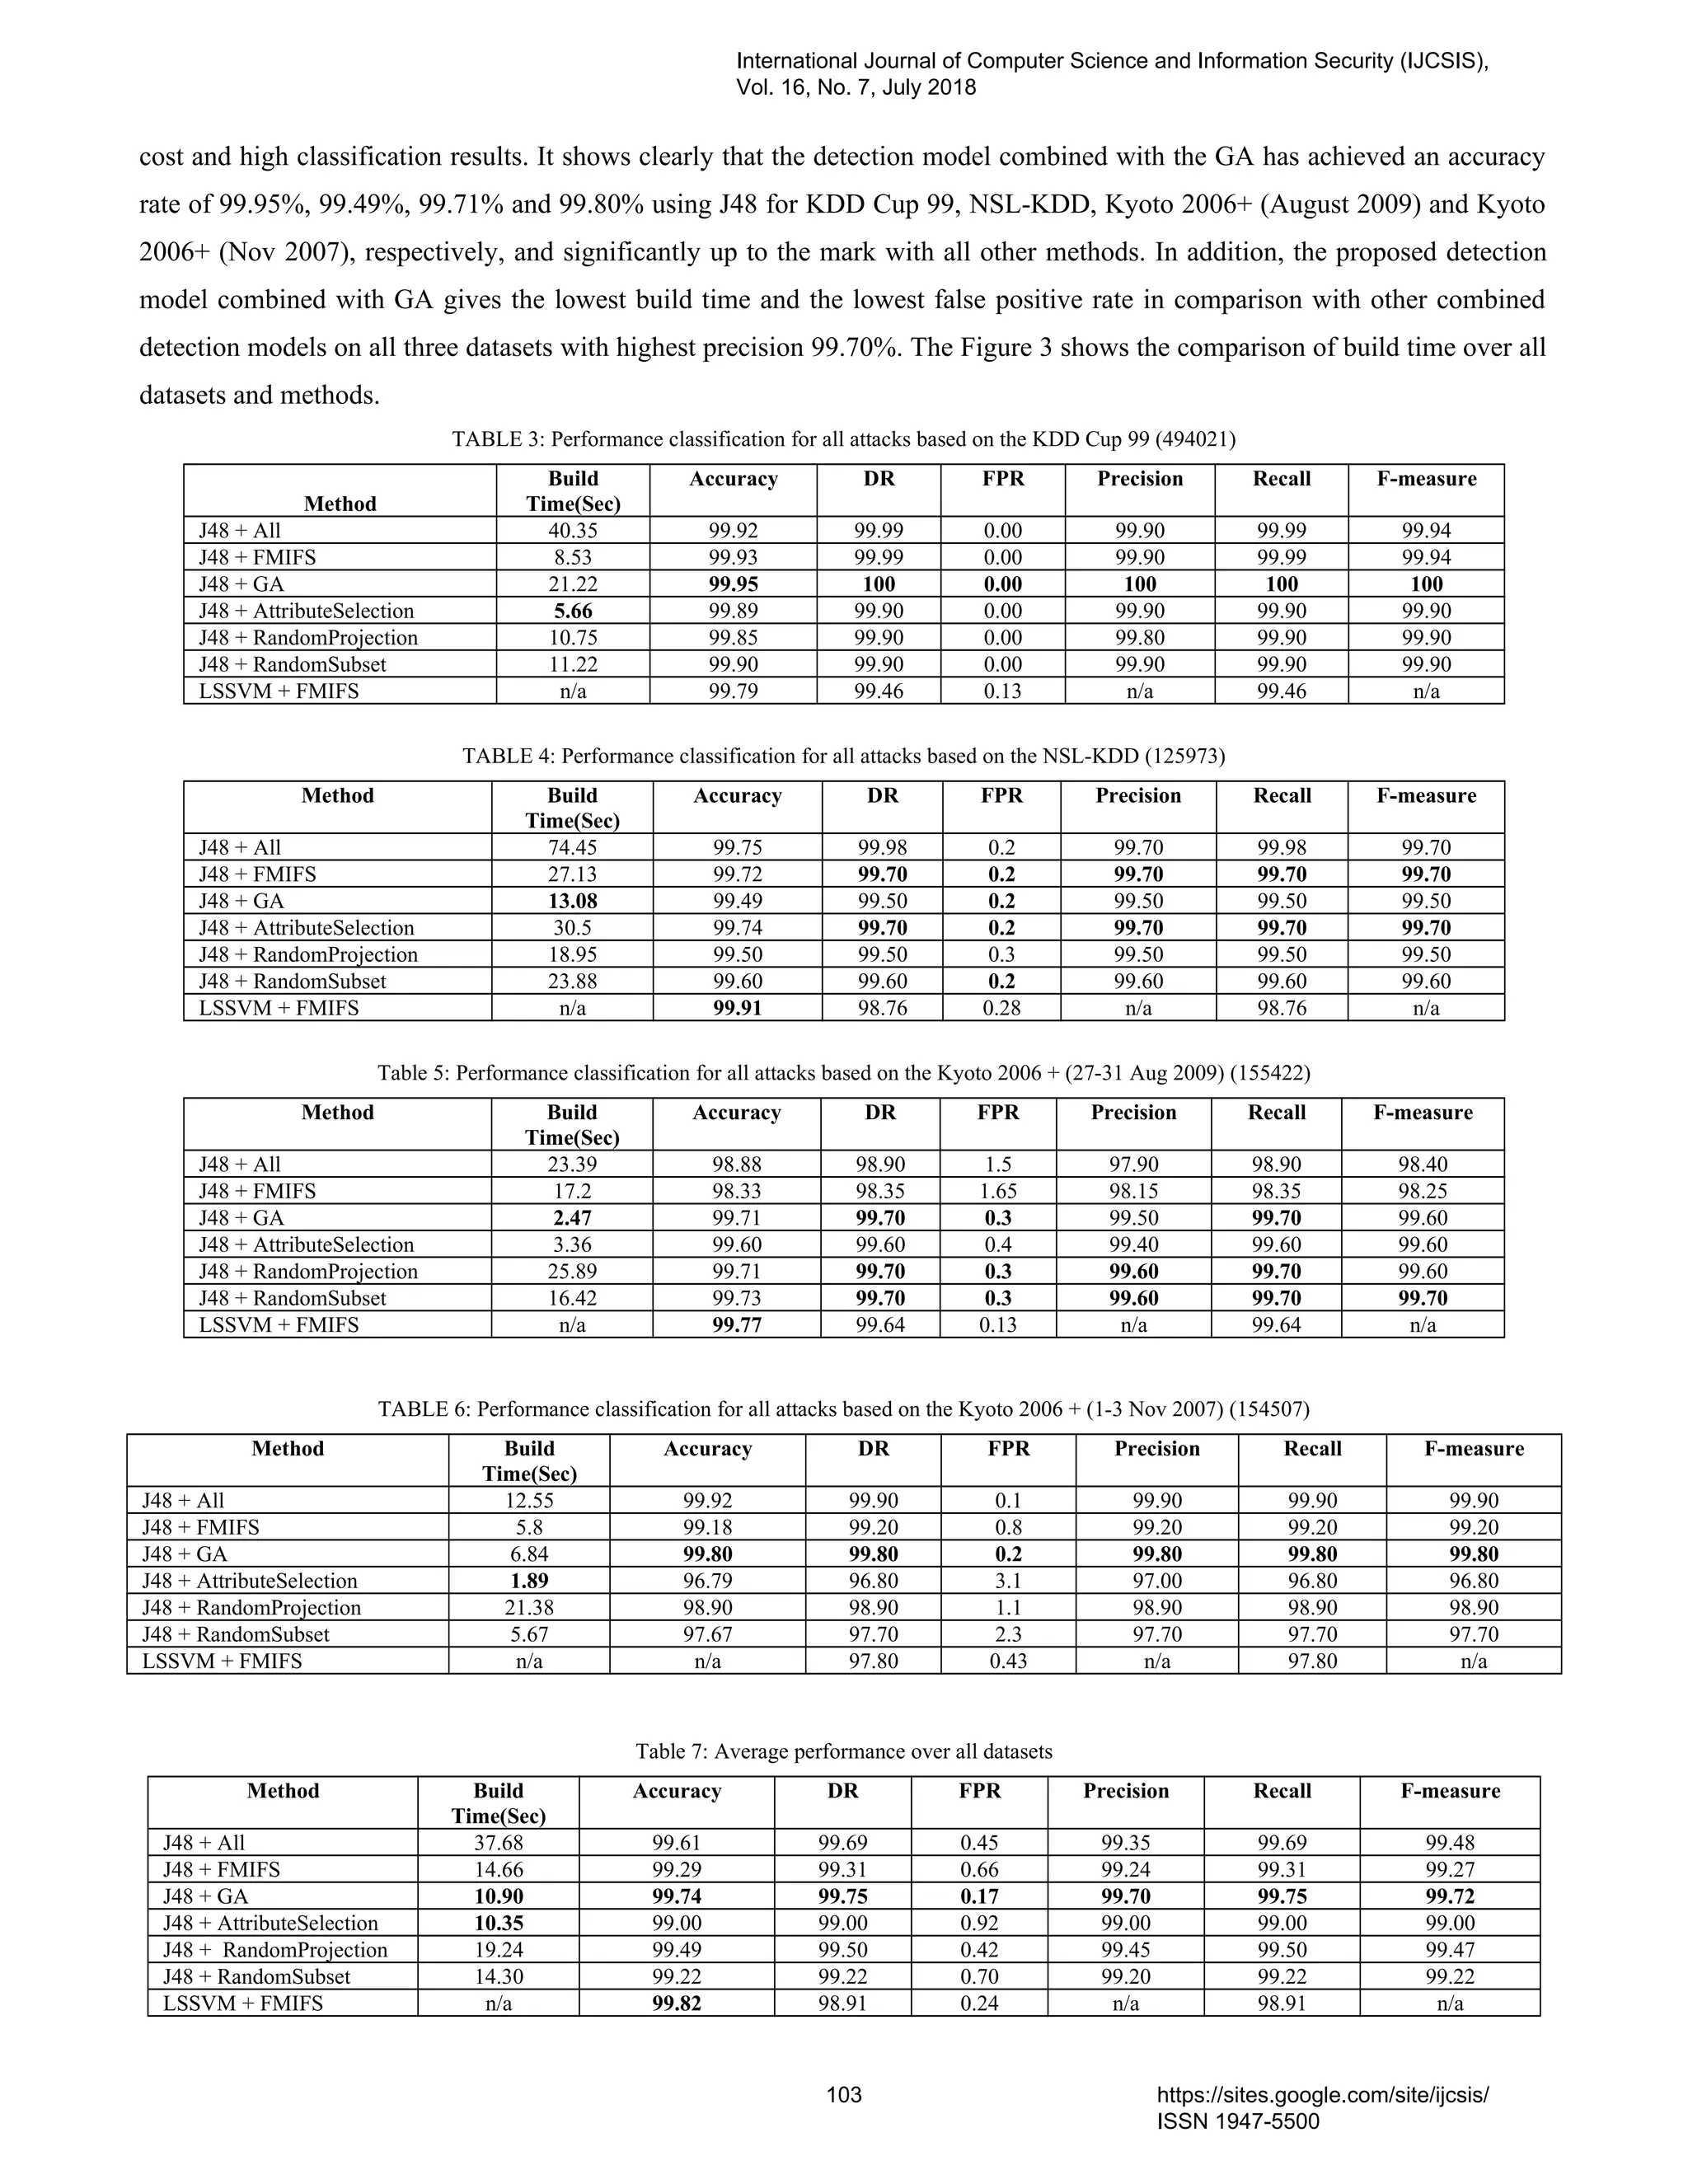
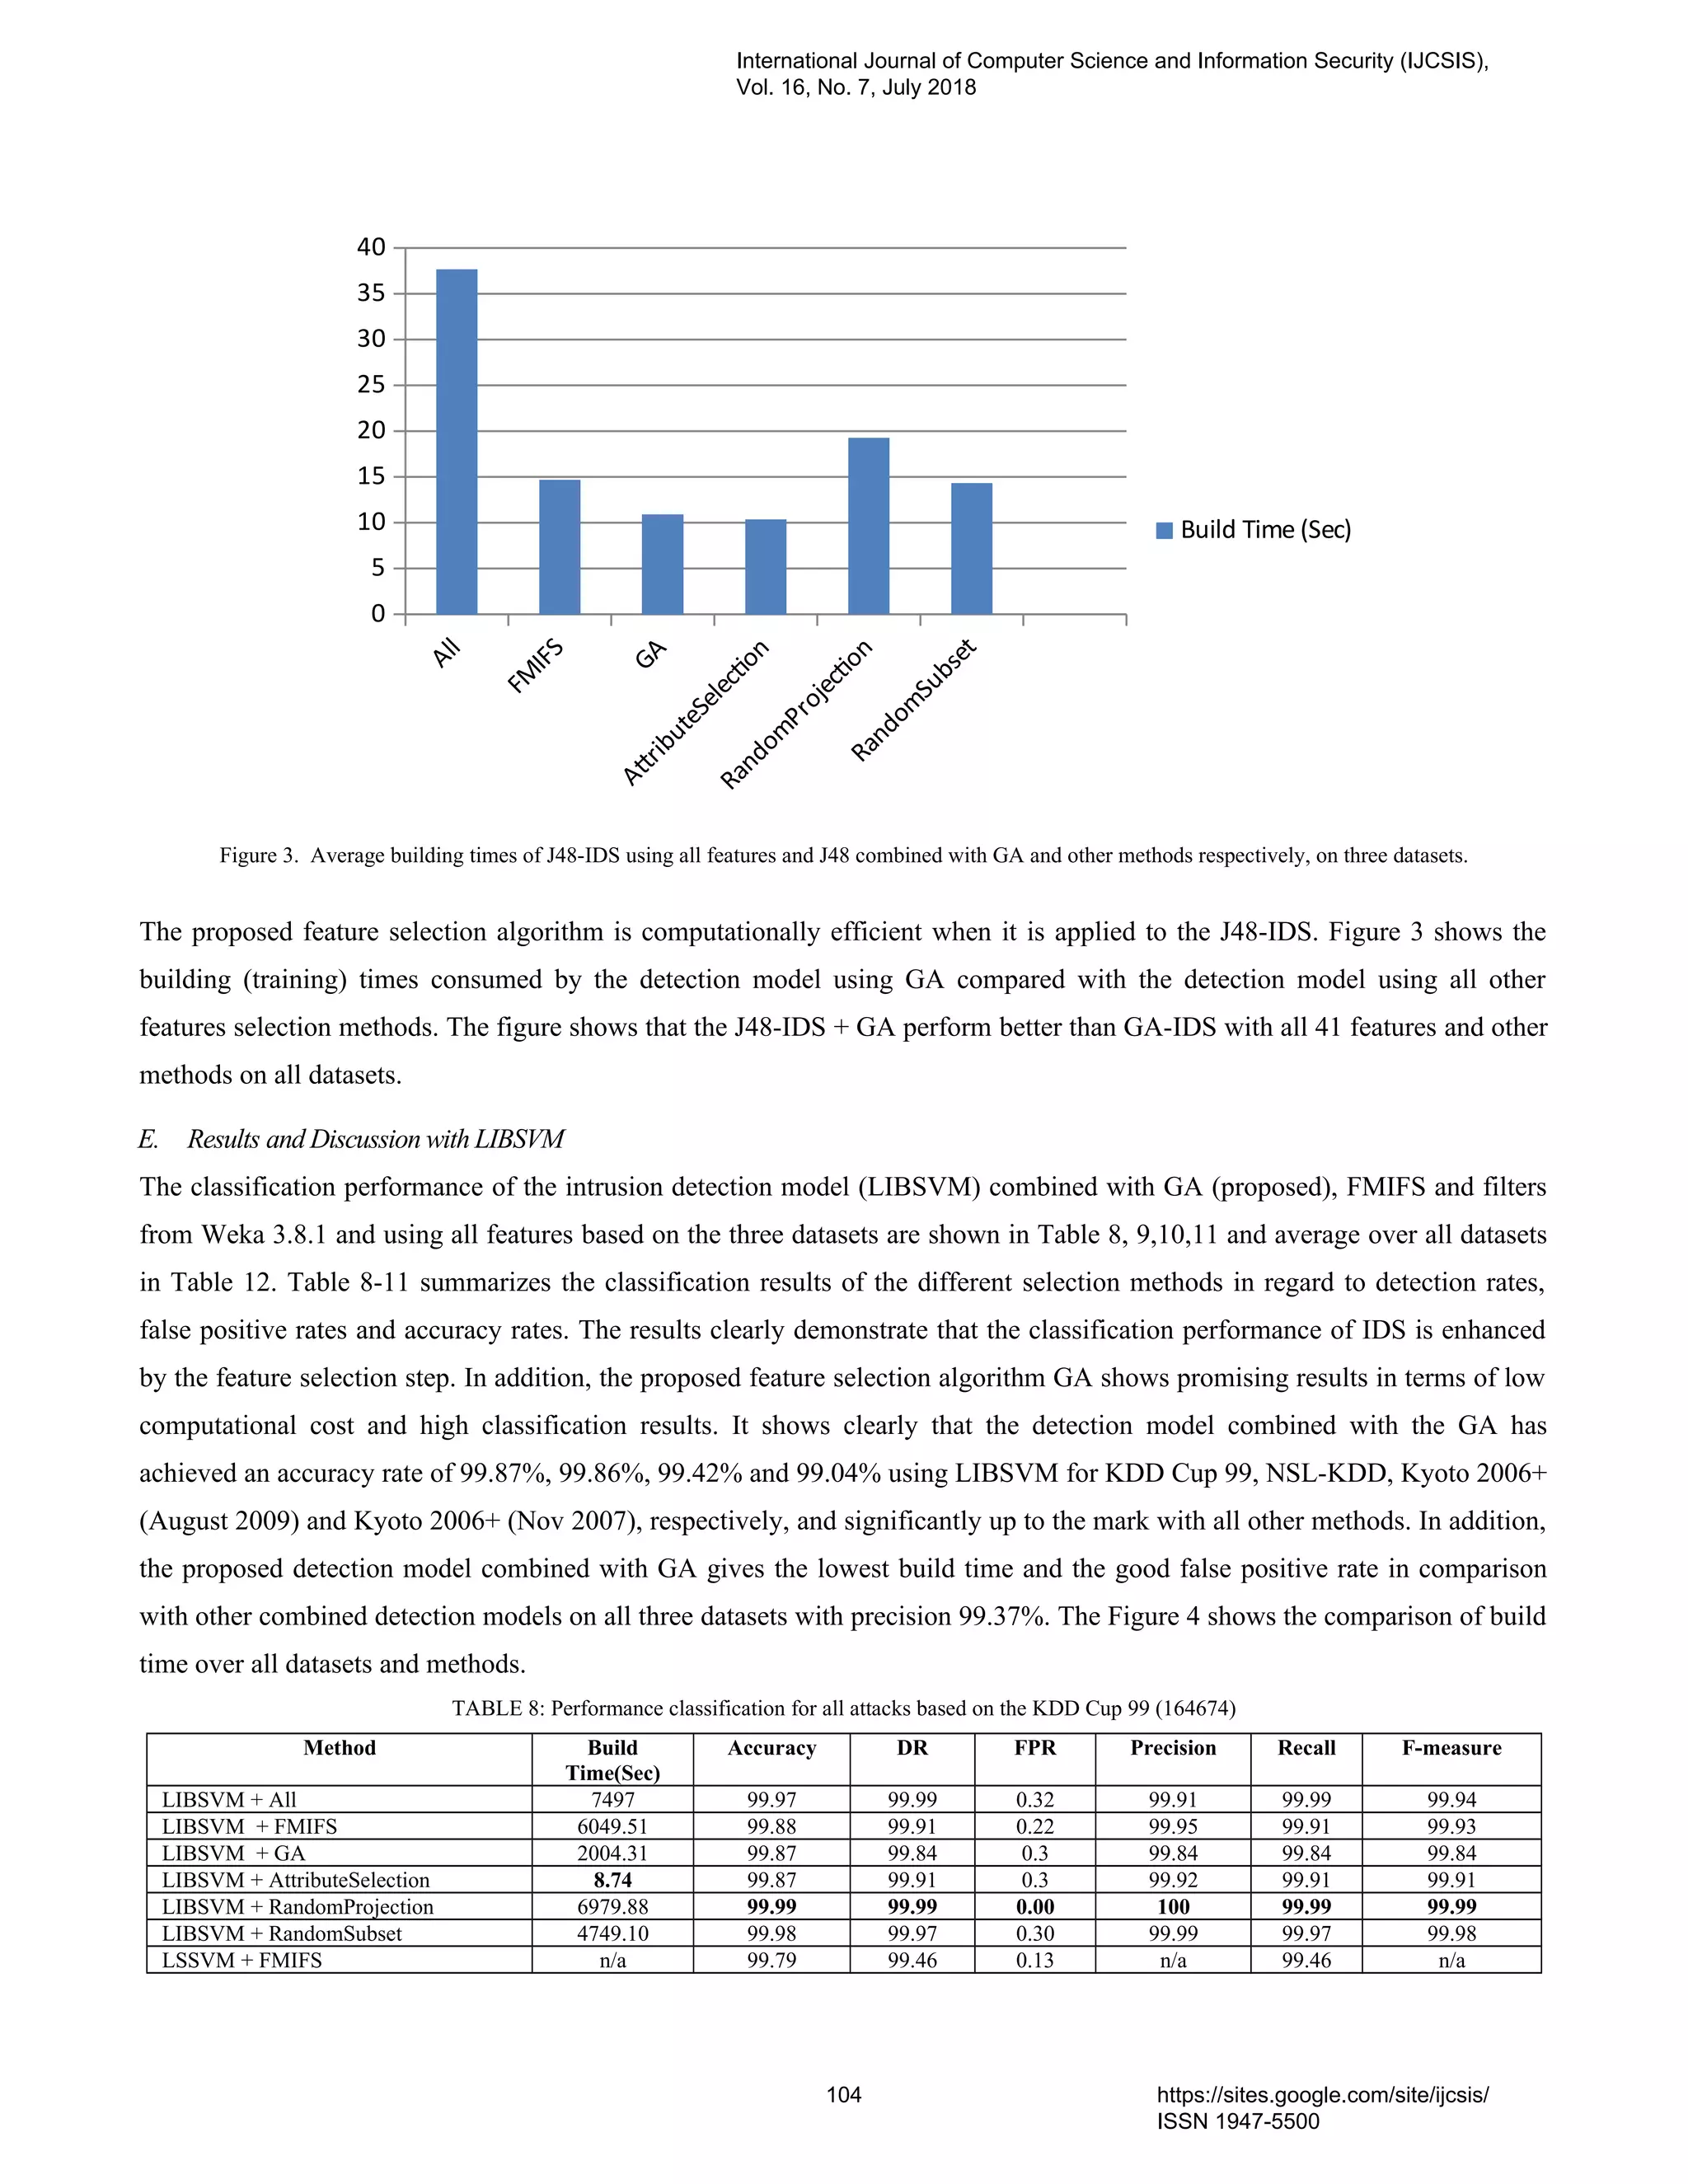
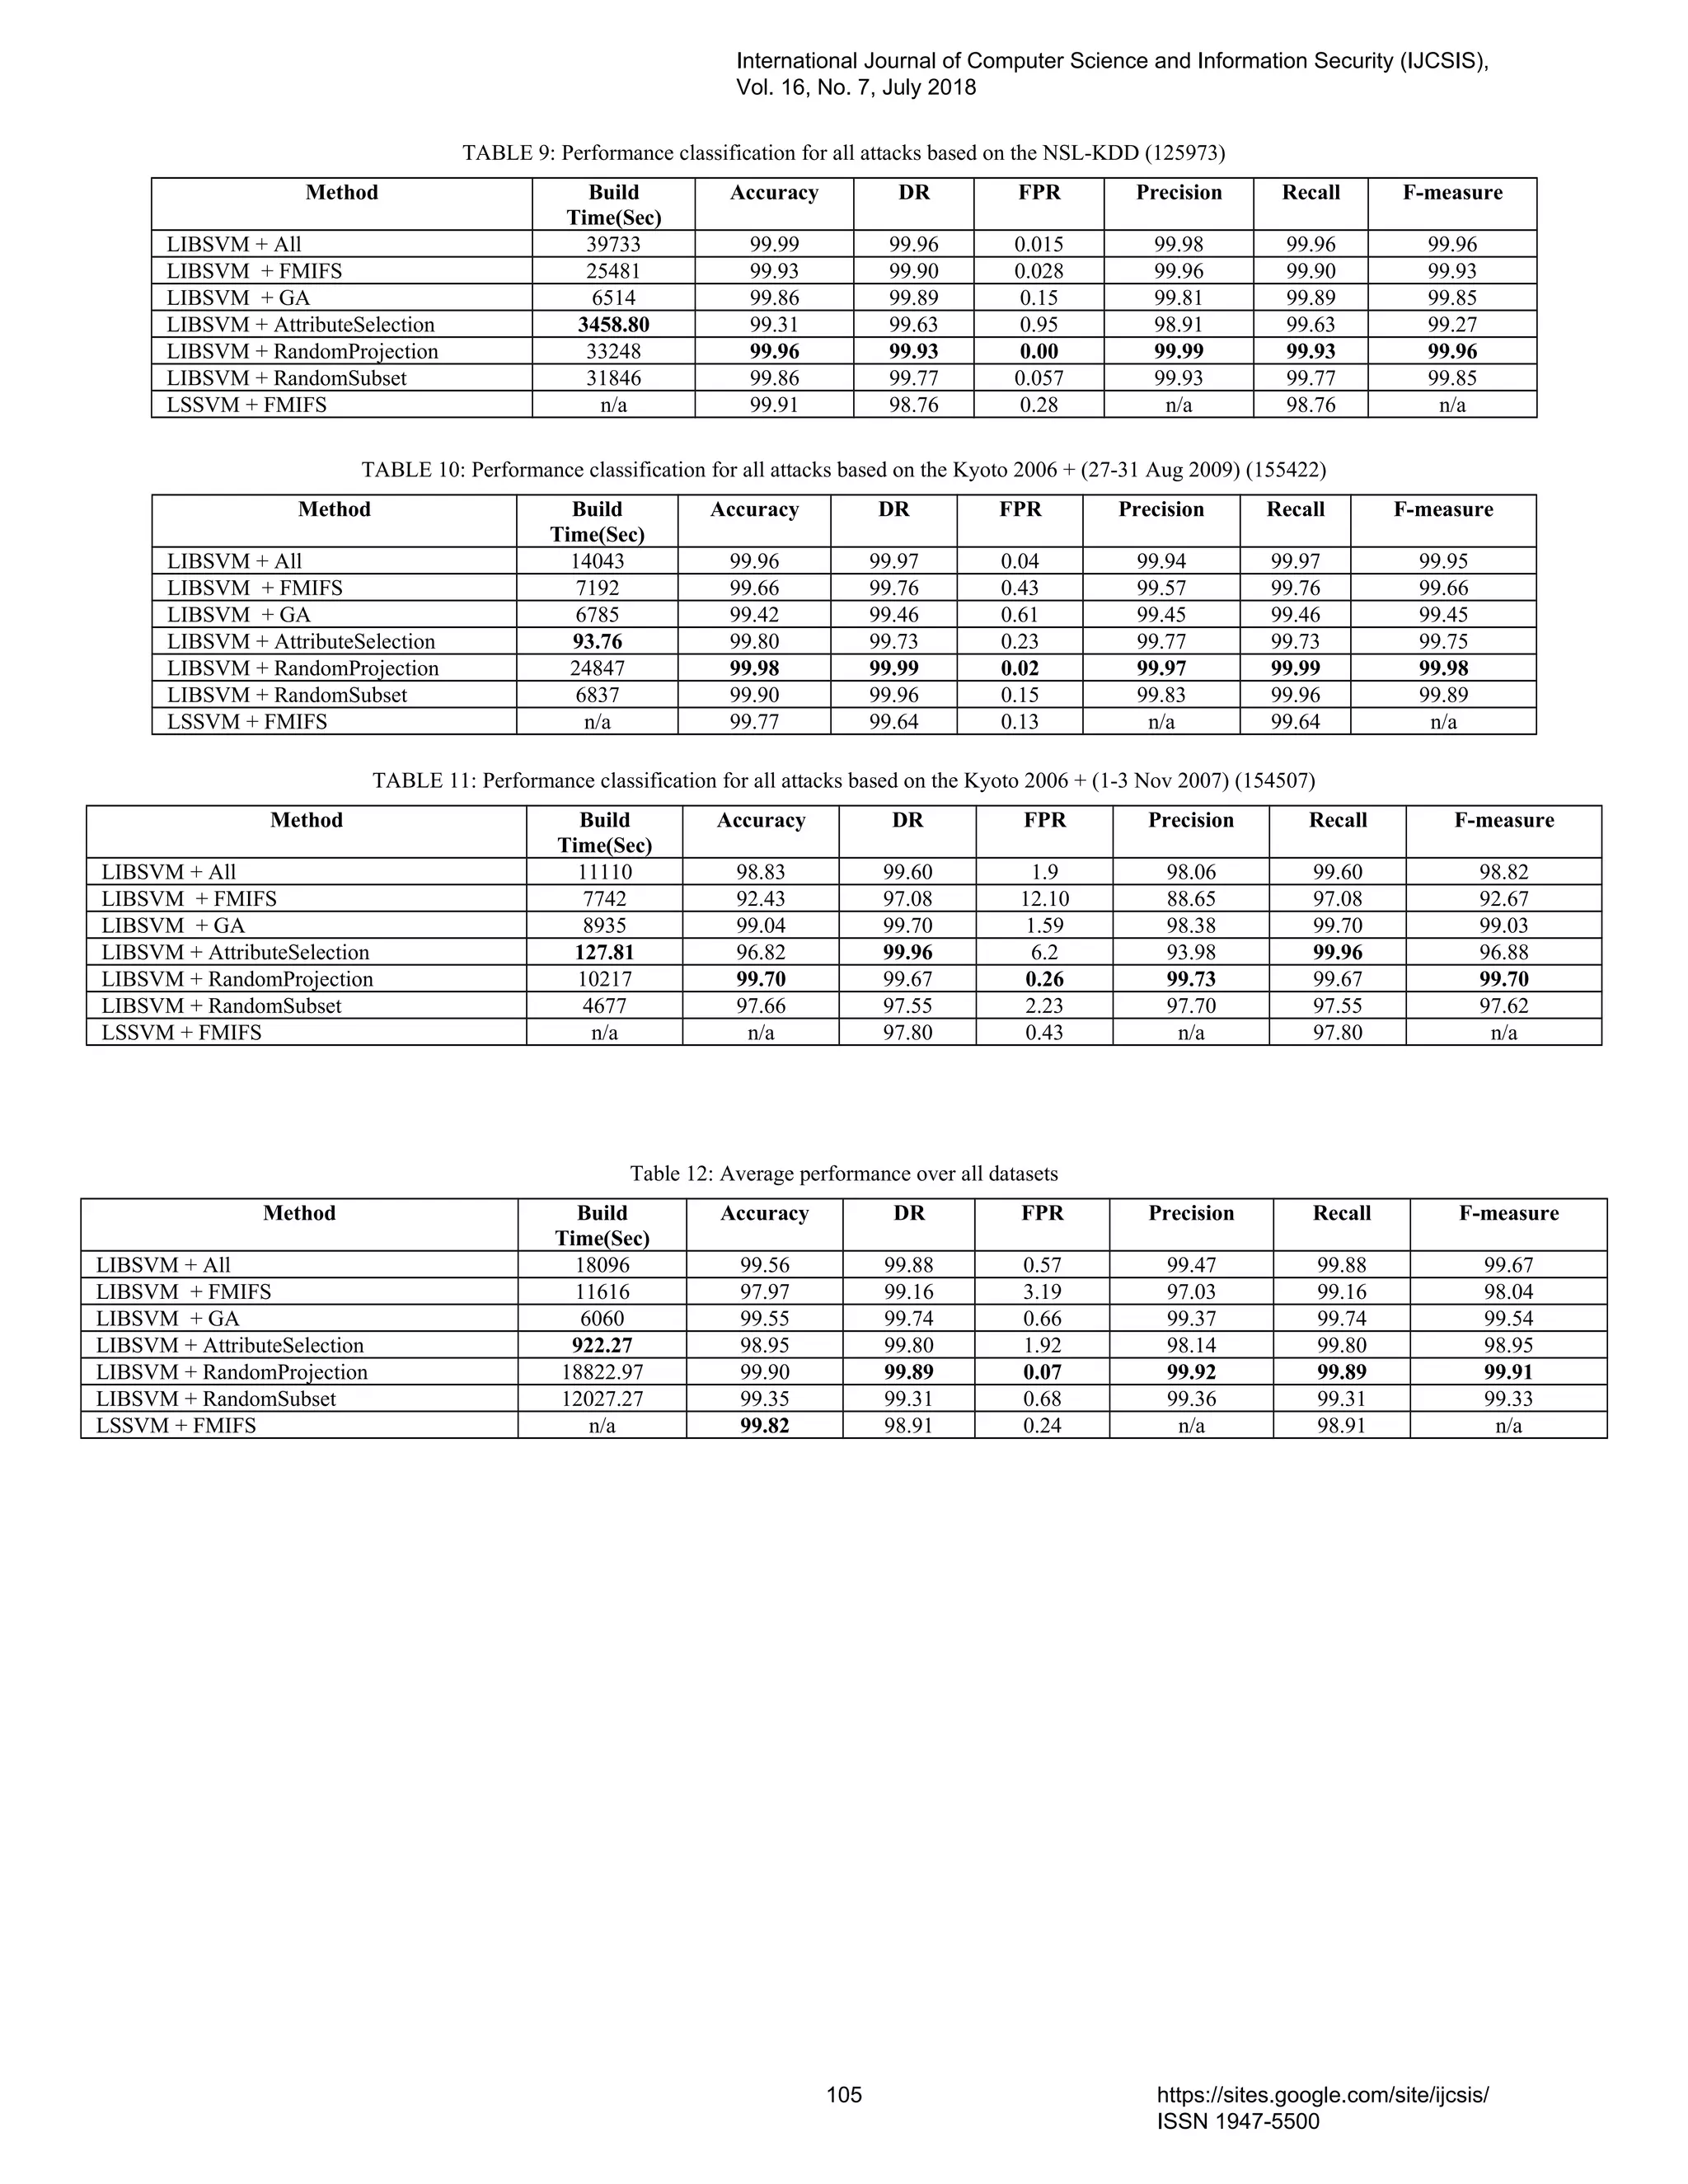
![All
FM
InFS
GA
cfssubsetvalue
Random
Projecton
Random
Subset
0
2000
4000
6000
8000
10000
12000
14000
16000
18000
20000
Build Time (Sec)
Figure 4. Average building times of LIBSVM-IDS using all features and LIBSVM combined with GA and other methods respectively, on three datasets.
The proposed feature selection algorithm is computationally efficient when it is applied to the LIBSVM-IDS. Figure 4 shows
the building (training) times consumed by the detection model using GA compared with the detection model using all other
features selection methods. The figure shows that the LIBSVM-IDS + GA perform better than LIBSVM-IDS with all 41
features on all datasets.
F. Comparative Study
Table 13 shows a comparison with the results achieved by CSV-ISVM, LSSVM + FMIFS proposed in [2] that have been tested
on Kyoto 2006+ dataset (1-3 Nov. 2007). Through the results, both systems show improvement in detection rates and reduction
in false positive rates. However, the obtained results of the J48-IDS + GA and LIBSVM-IDS +GA are better, compared to
LSSVM + FMIFS and CSV-ISVM. The final results achieved by J48-IDS + GA show 99.80% ,0.2% and LIBSVM-IDS + GA
show 99.70%, 1.59% of the final detection and false positive rates respectively, while LSSVM + FMIFS produces 97.80% and
0.43% of the final detection and false positive rates respectively.
TABLE 13: Performance classification for all attacks based on the Kyoto 2006 + (1-3 Nov 2007)
Method # Feature Accuracy DR FPR
J48 + All 21 99.92 99.90 0.1
J48 + FMIFS 5 99.18 99.20 0.8
J48 + GA 6 99.80 99.80 0.2
LIBSVM + All 41 98.83 99.60 1.9
LIBSVM + FMIPS 4 92.43 97.08 12.10
LIBSVM + GA 6 99.04 99.70 1.59
LSSVM + FMIFS[2] 5 n/a 97.80 0.43
CSV-ISVM [2] 5 n/a 90.15 2.31
Table 14: Detection rate (%) for different algorithm performances on the test dataset with Corrected Labels of KDD Cup 99 dataset
System Normal DoS Probe U2R R2L Overall
J48 + GA 95.6 91.25 91.11 33.05 63.17 74.83
J48 + FMIFS 94.8 96.68 98.77 92.75 70.91 76.74
LSSVM + FMIFS [2] 98.98 98.76 86.08 22.11 88.38 78.86
KDD’99 winner [2] 99.50 97.10 83.30 13.20 8.40 60.30
International Journal of Computer Science and Information Security (IJCSIS),
Vol. 16, No. 7, July 2018
106 https://sites.google.com/site/ijcsis/
ISSN 1947-5500](https://image.slidesharecdn.com/journalofcomputerscienceijcsisjuly2018fullvolume-180915043348/75/Journal-of-computer-science-ijcsis-july-2018-full-volume-120-2048.jpg)
![Furthermore, the detection rate of J48 + GA has been compared with some other approaches that have also been tested on the
Corrected Labels dataset and the results are shown in Table 14. Through Table, compared to the KDD Cup 99 winner’s
detection system and other systems, J48-IDS + GA achieves the best detection rates for Probe,U2R and R2L attacks with rates
of 91.11%, 33.05% and 63.17% respectively. For the normal class, all of KDD Cup 99 winner [2], Association rule [22] and
PNrule [2] achieve the best result with 99.50% detection rate. However, overall, J48 + GA have achieved the 74.83 detection
rate among all systems.
0
10
20
30
40
50
60
70
80
90
100
J48 + GA
J48 + FMInPS
LSSVM + FMInPS
Figure 5. Comparison results of F-measure rate on the Corrected Labels of KDD Cup 99 dataset
Figure 5 illustrates a comparison between J48-IDS+GA, J48-IDS+FMIFS and LSSVM+FMIFS proposed by Ambusaidi [2] in
terms of F-measure rates. This figure makes it obvious that the proposed model outperforms the LSSVM+FMIFS models in
most of the classes including Normal, Probe, U2R, and R2L with 93.90%, 92.08%, 34.50% and 65.13%, respectively.
LSSVM+FMIFS provide the highest result in DoS class of 99.27%. Overall, the results of J48-IDS+GA the shown in this
figure demonstrate satisfying performance compared with the other methods.
Figure 6 shows a comparison of the proposed system with those systems proposed in [2] that have been tested on the three
datasets in terms of the classification accuracy. Among those systems, the proposed detection model achieved the classification
accuracy of 99.55%
All
FM
IFS
GA
cfssubsetvalueRandom
Projection
Random
SubsetLSSVM
+
FM
IFS
0
10
20
30
40
50
60
70
80
90
100
Classification Accuracy
Accuracy
International Journal of Computer Science and Information Security (IJCSIS),
Vol. 16, No. 7, July 2018
107 https://sites.google.com/site/ijcsis/
ISSN 1947-5500](https://image.slidesharecdn.com/journalofcomputerscienceijcsisjuly2018fullvolume-180915043348/75/Journal-of-computer-science-ijcsis-july-2018-full-volume-121-2048.jpg)
![Figure 6. Comparison results of classification accuracy with LSSVM+FMIFS and LIBSVM-IDS on three datasets
All
FM
IFS
GA
cfssubsetvalueRandom
Projection
Random
SubsetLSSVM
+
FM
IFS
0
20
40
60
80
100
Classification Accuracy
Accuracy
Figure 7. Comparison results of classification accuracy with LSSVM+FMIFS and J48-IDS on three datasets
Figure 7 shows a comparison of the proposed system with those systems proposed in [2] that have been tested on the three
datasets in terms of the classification accuracy. Among those systems, the proposed detection model achieved the classification
accuracy of 99.74%
V. Conclusion & Future Scope
Since the current IDS technologies are not sufficient enough to provide a reliable detection rate so work should be carried on to
improve the rate. The speed of detection is another research problem.
The information presented gives how the features selection is an important to increase speed of detection & detection accuracy.
The filter based features selection genetic algorithm is proposed and used combined with J48 and LIBSVM method. The
proposed IDS have been evaluated using three well known datasets as KDD Cup 99, NSL-KDD and Kyoto 2006+ datasets.
The proposed work performance up to the mark in terms of classification accuracy, detection rate, false positive rate and F-
measure with existing detection approaches. Finally based on the experimental results achieved on all datasets, it can be
concluded that proposed detection system has achieved promising performance in detecting intrusions over computer network.
Although the proposed feature selection algorithm has shown encouraging performance, it could be further enhanced by
optimizing search strategy.
References
[1] Min Cai, Kai Hwang and Min Qin “Hybrid intrusion detection with weighted signature generation over anomalous internet
episodes”, IEEE Transactions on Dependable And Secure Computing, Vol.4 No.1, Jan-March 2007.
[2] Mohammed A. Ambusaidi, Priyadarshi Nanda “Building an intrusion detection system using a filter-based feature selection
algorithm”, IEEE Transactions on computers, November 2014.
[3] Gisung Kim, Seungmin Lee, Sehun Kim “A novel hybrid intrusion detection method integrating anomaly detection with
misuse detection”, Expert Systems with Applications, Elsevier Ltd, 2014.
[4] S. Jajodia L., Popyack D. Barbara, J. Couto and N. Wuy. Adam, “Detecting Intrusions by data mining “, Technical report,
Workshop Information Assurance and Security, USA, 2001.
[5] Bharathi M. Sahana Devi K. J.,”Hybrid intrusion detection with weighted signature generation”, Technical report, Dept of
CSE, Chickballapur, 2011.
International Journal of Computer Science and Information Security (IJCSIS),
Vol. 16, No. 7, July 2018
108 https://sites.google.com/site/ijcsis/
ISSN 1947-5500](https://image.slidesharecdn.com/journalofcomputerscienceijcsisjuly2018fullvolume-180915043348/75/Journal-of-computer-science-ijcsis-july-2018-full-volume-122-2048.jpg)
![[6] Siva S. Sivatha Sindhu, S. Geetha, A. Kannan" Decision tree based light weight intrusion detection using a wrapper
approach", Expert Systems with Applications 39 129-141, 2012.
[7] Kapil Kumar Gupta, Baikunth Nath, Ramamohanarao Kotagiri," Layered Approach Using Conditional Random Fields for
Intrusion Detection" IEEE Transactions on Dependable and Secure Computing, Vol.4 No.1, Jan-March 2010
[8] Dr. Saurabh Mukherjeea, Neelam Sharma," Intrusion Detection using Naive Bayes Classifier with Feature Reduction",
Procedia Technology, 119 – 128, 2012.
[9] Bertrand Portier, Froment-Curtil," Data Mining Techniques for Intrusion Detection", The University of Texas at Austin, Dr.
Ghosh - EE380L Data Mining Term Paper, Spring 2000.
[10] L Prema Rajeswari, Kannan Arputharaj," An Active Rule Approach for Network Intrusion Detection with Enhanced C4.5
Algorithm", I. J. Communications, Network and System Sciences, 4, 284-359 Published Online, November 2008.
[11] Nahla Ben Amor, Salem Benferhat," Naive Bayes vs Decision Trees in Intrusion Detection Systems" , SAC’04, March 14-
17, Nicosia, Cyprus,2004.
[12] Ahmed H. Fares and Mohamed I. Sharawy," Intrusion Detection: Supervised Machine Learning", Journal of Computing
Science and Engineering, Vol. 5, No. 4, pp. 305-313, December 2011.
[13] Adetunmbi A.Olusola., Adeola S.Oladele and Daramola O. Abosede, "Analysis of KDD 99 Intrusion Detection Dataset
for Selection of Relevance Features", Proceedings of the World Congress on Engineering and Computer Science 2010,Vol I
WCECS 2010, San Francisco, USA, October 20-22 2010.
[14] Mahbod Tavallaee, Ebrahim Bagheri, Wei Lu and Ali A., Ghorbani, "A Detailed Analysis of the KDD CUP 99 Data Set”,
Proceedings of the 2009 IEEE Symposium on Computational Intelligence in Security and Defense Applications (CISDA
2009).
[15] Taisir Eldos, Mohammad Khubeb Siddiqui and Kanan, “The KDD99 Dataset: Statistical Analysis for Feature Selection",
Journal of Data Mining and Knowledge Discovery ISSN: 2229-6662 & ISSN: 2229-6670, Volume 3, Issue 3, pp.-88-90, 2012.
[16]Yisehac Yohannes, John Hoddinott, Classification and Regression Trees: An Introduction", International Food Policy
Research Institute,2033 K Street, N.W.Washington, D.C., U.S.A, 2006
[17]Peyman Kabiri and Ali A. Ghorbani, “Research on Intrusion Detection and Response: A Survey”, International Journal of
Network Security, Vol.1, No.2, PP.84–102, Sep. 2005.
[18]Wenke Lee and Salvatore J. Stolfo, “Data Mining Approaches for Intrusion Detection”, 7th USENIX Security Symposium,
1998.
[19] Ismail Butun, Salvatore D. Morgera, and Ravi Sankar, “A Survey of Intrusion Detection Systems in Wireless Sensor
Networks”, IEEE Communications Surveys & Tutorials, 2013.
[20] Wenying Feng, Quinglei, Gongzhu Hu, Jimmy Xiangi Huang, “Mining Network data for intrusion detection through
combining SVMs with ant colony networks”, Future Generation Computer Systems, Elsevier, 2013.
[21] Seyed Mojtaba, Hosseini Bamakan, HuadongWang, TianYingjie, YongShi, “An effective intrusion detection framework
based on MCLP/SVM optimized by time-varying chaos particle swarm optimization”, Nerocomputing, Elsevier Ltd, 2016.
[22] S. Mukkamala, A. H. Sung, “Significant feature selection using computational intelligent techniques for intrusion
detection”, Advanced Methods for Knowledge Discovery from Complex Data, Springer, 2005, pp. 285–306.
[23] S. Chebrolu, A. Abraham, J. P. Thomas, “Feature deduction and ensemble design of intrusion detection systems”,
Computers & Security 24 (4) (2005) 295–307.
[24] Y. Chen, A. Abraham, B. Yang, “Feature selection and classification flexible neural tree”, Neurocomputing 70 (1) (2006)
305–313.
International Journal of Computer Science and Information Security (IJCSIS),
Vol. 16, No. 7, July 2018
109 https://sites.google.com/site/ijcsis/
ISSN 1947-5500](https://image.slidesharecdn.com/journalofcomputerscienceijcsisjuly2018fullvolume-180915043348/75/Journal-of-computer-science-ijcsis-july-2018-full-volume-123-2048.jpg)
![[25] Kapil Kumar Gupta, Baikunth Nath, Senior Member, IEEE, and Ramamohanarao Kotagiri, Member, IEEE, “Layered
Approach Using Conditional Random Fields for Intrusion Detection”, IEEE Transactions on Dependable and Secure
Computing, Vol. 7, No. 1, January-March 2010.
[26] Prakash Kalavadekar, Dr. Shirish Sane “Effective Intrusion Detection Systems using Hybrid Approach”International
Journal of Exploring Emerging Trends in Engineering, Volume 3 Issue 2 Mar-Apr-2016
[27] Prakash Kalavadekar, Dr. Shirish Sane “Effective Intrusion Detection Systems using Genetic Algorithm”,International
Journal on Emerging Trends in Technology, Volume 4, Special Issue July-2017, pp.8315-8319.
[28] Prakash Kalavadekar, Dr. Shirish Sane “Effect of Mutation and Crossover Probabilities on Genetic Algorithm and
Signature Based Intrusion Detection System”, To be published in International Journal of Engineering & Technology (UAE),
ISSN-2227-524X.
Mr.Prakash N.Kalavadekar, received Bachelors Degree in Computer Science & Engineering and Masters
Degree ME in Computer Science & Engineering from Walchand College of Engineering, Sangli in the year
1997 and 2007 respectively. Currently he is pursuing his research work at research centre at K K Wagh
Institute of Engineering Education and Research, Nashik affiliated to the Savitribai Phule Pune University,
Pune. His areas of interests include Data Mining, Databases, Computer Network & Security, Cloud
Computing and Image Processing.
Dr. Shirish S.Sane, obtained his Bachelors’ Degree in Computer Engineering from the Pune Institute of
Computer Technology (PICT), Pune, Masters Degree M. Tech (CSE) from IIT Bombay and Ph. D. in
Computer Engineering from Savitribati Phule Pune University, formerly known as University of Pune.
Dr. Shirish is working as the Head of the Computer Engineering Department and Vice Principal at K K
Wagh Institute of Engineering Education & Research, Nashik. He has published more than 60 research
papers at the National and International Conferences and Journals. He has also authored books on the subjects "Data
Structures" and "Theory of Computer Science". His areas of interests include Data Mining, Databases, Compilers and
Cloud Computing.
International Journal of Computer Science and Information Security (IJCSIS),
Vol. 16, No. 7, July 2018
110 https://sites.google.com/site/ijcsis/
ISSN 1947-5500](https://image.slidesharecdn.com/journalofcomputerscienceijcsisjuly2018fullvolume-180915043348/75/Journal-of-computer-science-ijcsis-july-2018-full-volume-124-2048.jpg)
![Master-Slave Clustering Technique for High
Density Traffic in Urban VANET Scenario
Rifat Tasnim Anannya #1
, Md. Abdullah Al Faruk *2
, Md. Manirul Islam #3
Department Of Computer Science, American International University-Bangladesh
Dhaka, Bangladesh
rifat.tasnim@aiub.edu
peash.education@gmail.com
manirul@aiub.edu
Abstract—Moving vehicle is never free of traffic congestion
especially in the cities. Every day commuters wastes hours in
travelling just because of traffic congestion. This has led to the
emergence of vehicular management which will be beneficial for
Road Transport department to control and manage the traffic
flow on congested roads. Thus to support above idea we have
Vehicular Ad-Hoc Network, or VANET technology that turns
every participating car into a node, allowing cars to connect with
each other and in turn create a network. There are wealthy
numbers of approaches were highlighted to solve several thriving
challenges of VANET. Clustering technique in vehicle is one of
them which made a great impact on VANET. But it fails to fulfill
a crucial requirement. Several protocols wanted to build a
cluster in low density traffic where the numbers of vehicles are
less with respect to transmission range & there is a less chance of
broadcast storming which is not a practical scenario. So that
cluster formation in high density traffic has arisen as an issue
where there is a great possibility to broadcast storm. This paper
suggests a “Priority Based Master-Slave Cluster Formation
Process” in high density traffic for an urban scenario using
“fidelity” metric. With the help of this metric it will be easier to
find high density traffic & form priority based Master-Slave
dynamically by reducing broadcast storm problem.
In this paper CHP function runs on the vehicular environment
which carried out to select a vehicle as Master. In this Ad-hoc
wireless environment a dataset is assumed which create a proper
environment & generate a graph. Graph results can be analyzed
to have the highest one selects as a Master. Thus for the final
result, real aspects of vehicular traffic is very essential and
scenarios play a very crucial role.
I. INTRODUCTION
A. Vehicular Ad-hoc Network (VANET)
Vehicular Ad-hoc Network (VANET) has been a focus
point for the researchers for the last few years. Tremendous
amount of developments have taken place in the field of
wireless communication, as well as in vehicle industry.
Disbursing road related safety and non-safety information to
vehicles while running on the roads is the main objective of
VANET. Vehicles get connected and create an ad-hoc
network to accomplish their desired task.
VANET is basically a form Mobile Ad-hoc Network
(MANET). But in the case of VANET, mobility rate of the
nodes, which are the vehicles, is higher than of MANET.
Along this high mobility issue there are several more issues
that have made VANET a challenging sector for research.
Besides of the high mobility rate, number of nodes exists in a
VANET environment. But for the issues and challenges
mentioned previously many new and optimized protocols
were proposed and developed for VANETs.
B. Infrastructure Of VANET
Fig. 1. Infrastructure Of VANET[12]
The structure of VANET is quite different from others.
Integrating on-board devices with the network interface,
different types of sensors and GPS receivers is used to collect
process and disseminate information. According to the IEEE
802.11p architecture standard guidelines, VANETs can be
divided into three domains: the mobile domain, the
infrastructure domain, and the generic domain. First the
mobile domain consists of two parts: the vehicle domain and
International Journal of Computer Science and Information Security (IJCSIS),
Vol. 16, No. 7, July 2018
111 https://sites.google.com/site/ijcsis/
ISSN 1947-5500](https://image.slidesharecdn.com/journalofcomputerscienceijcsisjuly2018fullvolume-180915043348/75/Journal-of-computer-science-ijcsis-july-2018-full-volume-125-2048.jpg)
![the mobile device domain where The vehicle domain
comprises all kinds of vehicles such as cars and buses. The
mobile domain comprises all kinds of portable devices like
navigation devices and smartphones. Within the infrastructure
domain, there are two domains: the roadside infrastructure
domain and the central infrastructure domain. The roadside
infrastructure domain contains roadside unit entities like
traffic lights, lamp etc. . then The central infrastructure
domain contains infrastructure management centers such as
traffic management centers (TMCs) and vehicle management
centers. However, the development of VANETs architecture
varies from domain to domain. In the CAR-2-X
communication system which is pursued by the CAR-2-CAR
communication consortium, the reference architecture is a bit
different.CAR-2-CAR communication consortium (C2C-CC)
is the major driving force for vehicular communication. This
system architecture comprises three domains: in-vehicle, ad
hoc, and infrastructure domain. Infrastructure, Ad-hoc &
Generic Domain. In infrastructure domain it needs to maintain
a relationship in On Board Unit & AU using wired or wireless
communication. Ad hoc domain maintains the relationship
between OBU and road side unit (RSU) such as lamp post or
traffic light. The relationship is build using DSRC medium
which focus physical layer & add the wireless functionality in
vehicle. Application unit (AU) The AU is attached within the
vehicle that uses the applications provided by the provider
with the help of OBU. The AU can be a dedicated device for
safety applications which is utilized to improve the safety on
the road. In any emergency situation, the surrounding vehicle
must be informed as soon as possible. Otherwise, the safety
system works as useless in helping the driver to deal with the
emergency situations. Hence, It is required that the DSRC
safety-related Vehicle to vehicle communication must provide
a service delivering messages within their lifetime with high
reliability but under high-speed. The AU may reside with the
OBU in a single physical unit the distinction between the AU
and the OBU is logical. Then, Roadside unit (RSU) The RSU
which is a wave device usually fixed along the road side or in
dedicated locations such as at near parking spaces. The RSU
is connected via one network device for a dedicated short
range communication based on IEEE802.11p standard, and
can also be attached with other network devices for the
purpose of communication within the infrastructural network.
Extending the communication range of the ad hoc network by
disseminate the information to other OBUs and by sending the
information to other RSUs in order to forward it to other
OBUs. Integrating with this environment VANET
communicate either V2V or V2I depends on the necessity.
C. Motivation
Vehicular Ad-Hoc Networks (VANETS) are a promising
field for increasing comfort and safety on the road in
Bangladesh where the traffic jam is like a nightmare. [14]
According to the world bank data the average traffic rate has
been reduced from 21km per hour to 7km per hour. But
sometimes using some techniques we can avoid these
unbearable traffic jam. Let’s assume that you are on the way
in a car & wants to know the traffic jam condition at the next
turn or want to know that any vehicle met any accidents or not.
Sometimes the answer of these questions are found in
VANET. [16]To find these answers there are several routing
protocols works, such as – Topology Based Routing Protocols,
who utilize the information regarding the links between nodes
for routing protocols. This topological protocols can also be
subcategorized in to proactive, reactive and hybrid. Another
one is Position based routing protocols who decides the packet
routing based on the source to destination node position and
one hop position. Examples are: GyTAR[15], LOUVRE, DIR
etc. .Again Cluster based routing protocols form a group and
select a head among themselves in order to pass packet from a
source to a destination. Examples are : CBLR, LORA-DCBF,
HCB etc. But the drawback of these protocols are most of the
time they applied in a low density traffic area where the no of
vehicles are less with respect to transmission range. As a
result there is a less possibility of broadcast storming which
means at a time less no of vehicles wants to communicate
their head if we applied a clustering scenario. But this is not a
practical scenario in our country like Bangladesh where there
are max no of vehicles exist in one road segment.
So, in this concern a Master Slave clustering technique is
proposed which effectively works in high density traffic in
urban scenario though some key challenges still exist.
This paper divided into the six chapters. The remainder of
this paper is organized as follows: In Section I, we have
discussed the Introduction which gives overview of VANET,
Domain in VANET, Types of routing protocols in VANET &
the overall structure. In Section II, we have described
dedicated pioneering approaches of the literature. In Section
III, we have thoroughly described the proposed scheme of
ours. In Section IV, the environment with parameters and the
preliminary evaluation of our proposed protocol are presented.
We have also shown some graph of the proposed algorithm.
Finally, the paper is concluded in last section which sketches
issues regarding the future work.
II. BACKGROUND STUDY
Researches has found a vast amount of interest in VANET
due to the low cost of embedded sensor but frequent
movement in this environment make the whole scenario more
complex[18]. Strategies focused around the vehicle’s location,
in the same way as the Floating Car Data (FCD).[1] But it is
better to disseminate all the data in a group based so that it can
be easier to control all the vehicles. In the literature, it has
been demonstrated that clustering made a great impact in the
performance of VANETs and can be utilized in various
application. Daeinabi et al.[2] proposed an efficient clustering
algorithm for VANETs getting the direction of vehicle and
number of neighbors to perform clustering. In [3] an open
inter-vehicle communication network, algorithm for clustering
was proposed by taking into account the dynamic topology in
International Journal of Computer Science and Information Security (IJCSIS),
Vol. 16, No. 7, July 2018
112 https://sites.google.com/site/ijcsis/
ISSN 1947-5500](https://image.slidesharecdn.com/journalofcomputerscienceijcsisjuly2018fullvolume-180915043348/75/Journal-of-computer-science-ijcsis-july-2018-full-volume-126-2048.jpg)
![VANET .In [4] Fan et al. suggested a clustering algorithm
based upon the direction of vehicle. In [5] an adaptive
connectivity proposed by Yang et al demonstrated the choice
of the optimal path based on collecting data from diverse
regions by decreasing the total of the weight between source
and Destination. In [6] Wu et al proposed mobility-sensitive
data dissemination protocol for VANET environment. In [7]
Kumar et al proposed an agent learning–based clustering
algorithm to evaluate the performance by taking into different
metrics like node participation, percentage of connectivity,
cluster head period, connectivity preservation ratio,
transmission ratio etc. Due to continuous expansion of this
structure, clustering is a popular means of organizing
clustering process which is attracted by many Researchers.
Many clustering technique, including topology-based
clustering, mobility-based clustering, identifier neighbor-
based clustering, energy-based clustering and weight-based
clustering, have been proposed [8]. In Most of the clustering
technique, the selection of the gateway is based on the speed
of the CH, signal strength and communication connectivity
[9].One of the popular clustering algorithms is the affinity
propagation (AP) algorithm, which is a distance-based
clustering algorithm, results in the frequent changing of CHs
when speed effectively changes[10].Some other literature
works introduced a clustering routing protocol in which CH
selects another head in order to forward packets [11].The
majority of these research works only considered the location
or the speed of the vehicles for constructing the clusters, while
the density or broadcast issue of the vehicles have not been
thoroughly considered. Most importantly, all of these
protocols and solutions have never been investigated in high
density traffic to test the broadcast storm. The majority of
vehicles , maintain a constant distance between them which is
not a practical scenario in Bangladesh perspective .
III. PROPOSED SCHEME
In this paper, first it is assumed that in an urban scenario
where all the vehicles are equipped with Global Position
System (GPS.) Here moving nodes are basically vehicles and
vehicles are equipped with On Board Unit (OBU). Vehicles
can also communicate with Road Side Unit (RSU) and this
communication is based on Dedicated Short Range
Communication (DSRC). DSRC functions at frequency of 5.9
GHz & cover the radius of 1000m.
The proposed method is Master-Slave Clustering
Technique which is consists of RSU, OBU & local DB. OBU
& RSU communicate each other using DSRC as a medium.
Vehicle connects itself to the RSU when it enters the road&
send a request message to RSU.RSU check its local database
that if the vehicle is registered or not. Assumption made in my
scenario that there are n vehicles in the network & each one
has a unique vehicle ID during registration V= {v1, v2….vn}
also there are x roads& each one has a unique road id,
R={r1,r2,r3…rn}.Road length and the number of lanes of road
ri are denoted as Lni & LORi that are saved in road database
which is accessed by RSU.
For selecting a node as Master efficiently it must fulfill four
criteria’s. First, it required to have minimum average distance
to its members. Secondly, the velocity has to be the closest to
the average speed. Third, maximum number of neighbor
vehicle around that node. Fourth, nodal degree of directly
connected node is in same direction. This searching is
repeated to the maximum number of iteration.
Fig. 2. Flow-chart Of Vehicles connectivity with RSU
Fig. 3. Flow-chart of Finding Master & Slave
On the basis of the above requirements, Cluster Head
Probability (CHP) as follows is stated:
International Journal of Computer Science and Information Security (IJCSIS),
Vol. 16, No. 7, July 2018
113 https://sites.google.com/site/ijcsis/
ISSN 1947-5500](https://image.slidesharecdn.com/journalofcomputerscienceijcsisjuly2018fullvolume-180915043348/75/Journal-of-computer-science-ijcsis-july-2018-full-volume-127-2048.jpg)
![CHP=C1.C1.Dvi,j+C2|Avg.vi-Svi.degi|+C3.Nneig.Vi]) (1)
Where, SVi means speed value of vehicle Vi ; Nneig
denoted as the number of the neighbors of vehicle Vi; Nit is
the maximum no of iterations starts from 1; C1, C2, and C3
are acceleration coefficient supplied to this function.
(2)
AvgVi is the average speed of vehicle Vi. It is calculated as
follow:
(3)
Nodal degree for node i (Degi), which is defined that clusters
are formed by vehicles traveling in the same direction,
Degi =|Ni|
Each vehicle initialize itself with position & velocity which
is collected from OBU. After initializing within a given
transmission range R. All the nodes calculate the CHP &
immediately transfer this calculation to RSU because this
calculation is carried out to identify this node as Master.
After receiving the value from each vehicle RSU make a
priority list to its local Db. Master is then selected which has
the highest priority based on the max CHP value. RSU selects
a Master through sending a packet which contains position,
speed of its neighboring vehicle, Cluster_id & Slave_id.
Master save the packet information in its table and set
flag=0 while disseminating a Join Request as a beacon
message within transmission Range R. Beacon message
contains Cluster id, Master id as source_add, Nodal_degree,
Position, Vehicle id as destination. Each time when reply is
sent back to Master, master save all the member info in
member table &OBU calculates fidelity metric.
Fidelity=𝑇𝑜𝑡𝑎𝑙_𝐽𝑜𝑖𝑛𝑒𝑑_𝑉𝑒ℎ𝑖𝑐𝑙𝑒/𝑇𝑜𝑡𝑎𝑙_𝐼𝑛𝑓𝑜𝑟𝑚𝑒𝑑_𝑉𝑒ℎ𝑖𝑐𝑙𝑒
If fidelity is greater than 80%, that means at a time max
vehicle wants to communicate with master resulting broadcast
storm in high density area. So in this case Master send a
packet to slave_id and set flag=1. Now Master share its
member table to slave & according to the transmission range
vehicle connects either Master or Slave. So that, one vehicle
does not need to handle too much traffic all alone.
IV.SIMULATION AND RESULT
In this section, we have evaluated the performance using
our approach described in the previous section. Then we have
presented the performance results of our proposed method.
First we have created an environment.
Fig. 4. High Density Traffic In Road With Neighbor Relationship
The parameters of the simulated environment are briefly
shown in Table 1.
Table I: Simulation Parameters (Distance)
Neighbor relationship with distance
For V1
Neighbor Euclidean Distance
V1,V2 6
V1,V5 5
V1,V24 3
V1,V8 1
V1,V12 2
V1,V7 3
For V2
Neighbor Euclidean Distance
V2,V25 8
V2,V7 8
V2,V5 6
V2,V1 6
V2,V6 2
For V8
Neighbor Euclidean Distance
V8,V1 1
V8,V24 3
V8,V26 4
V8,V9 4
V8,V15 3
V8,V12 3
International Journal of Computer Science and Information Security (IJCSIS),
Vol. 16, No. 7, July 2018
114 https://sites.google.com/site/ijcsis/
ISSN 1947-5500](https://image.slidesharecdn.com/journalofcomputerscienceijcsisjuly2018fullvolume-180915043348/75/Journal-of-computer-science-ijcsis-july-2018-full-volume-128-2048.jpg)
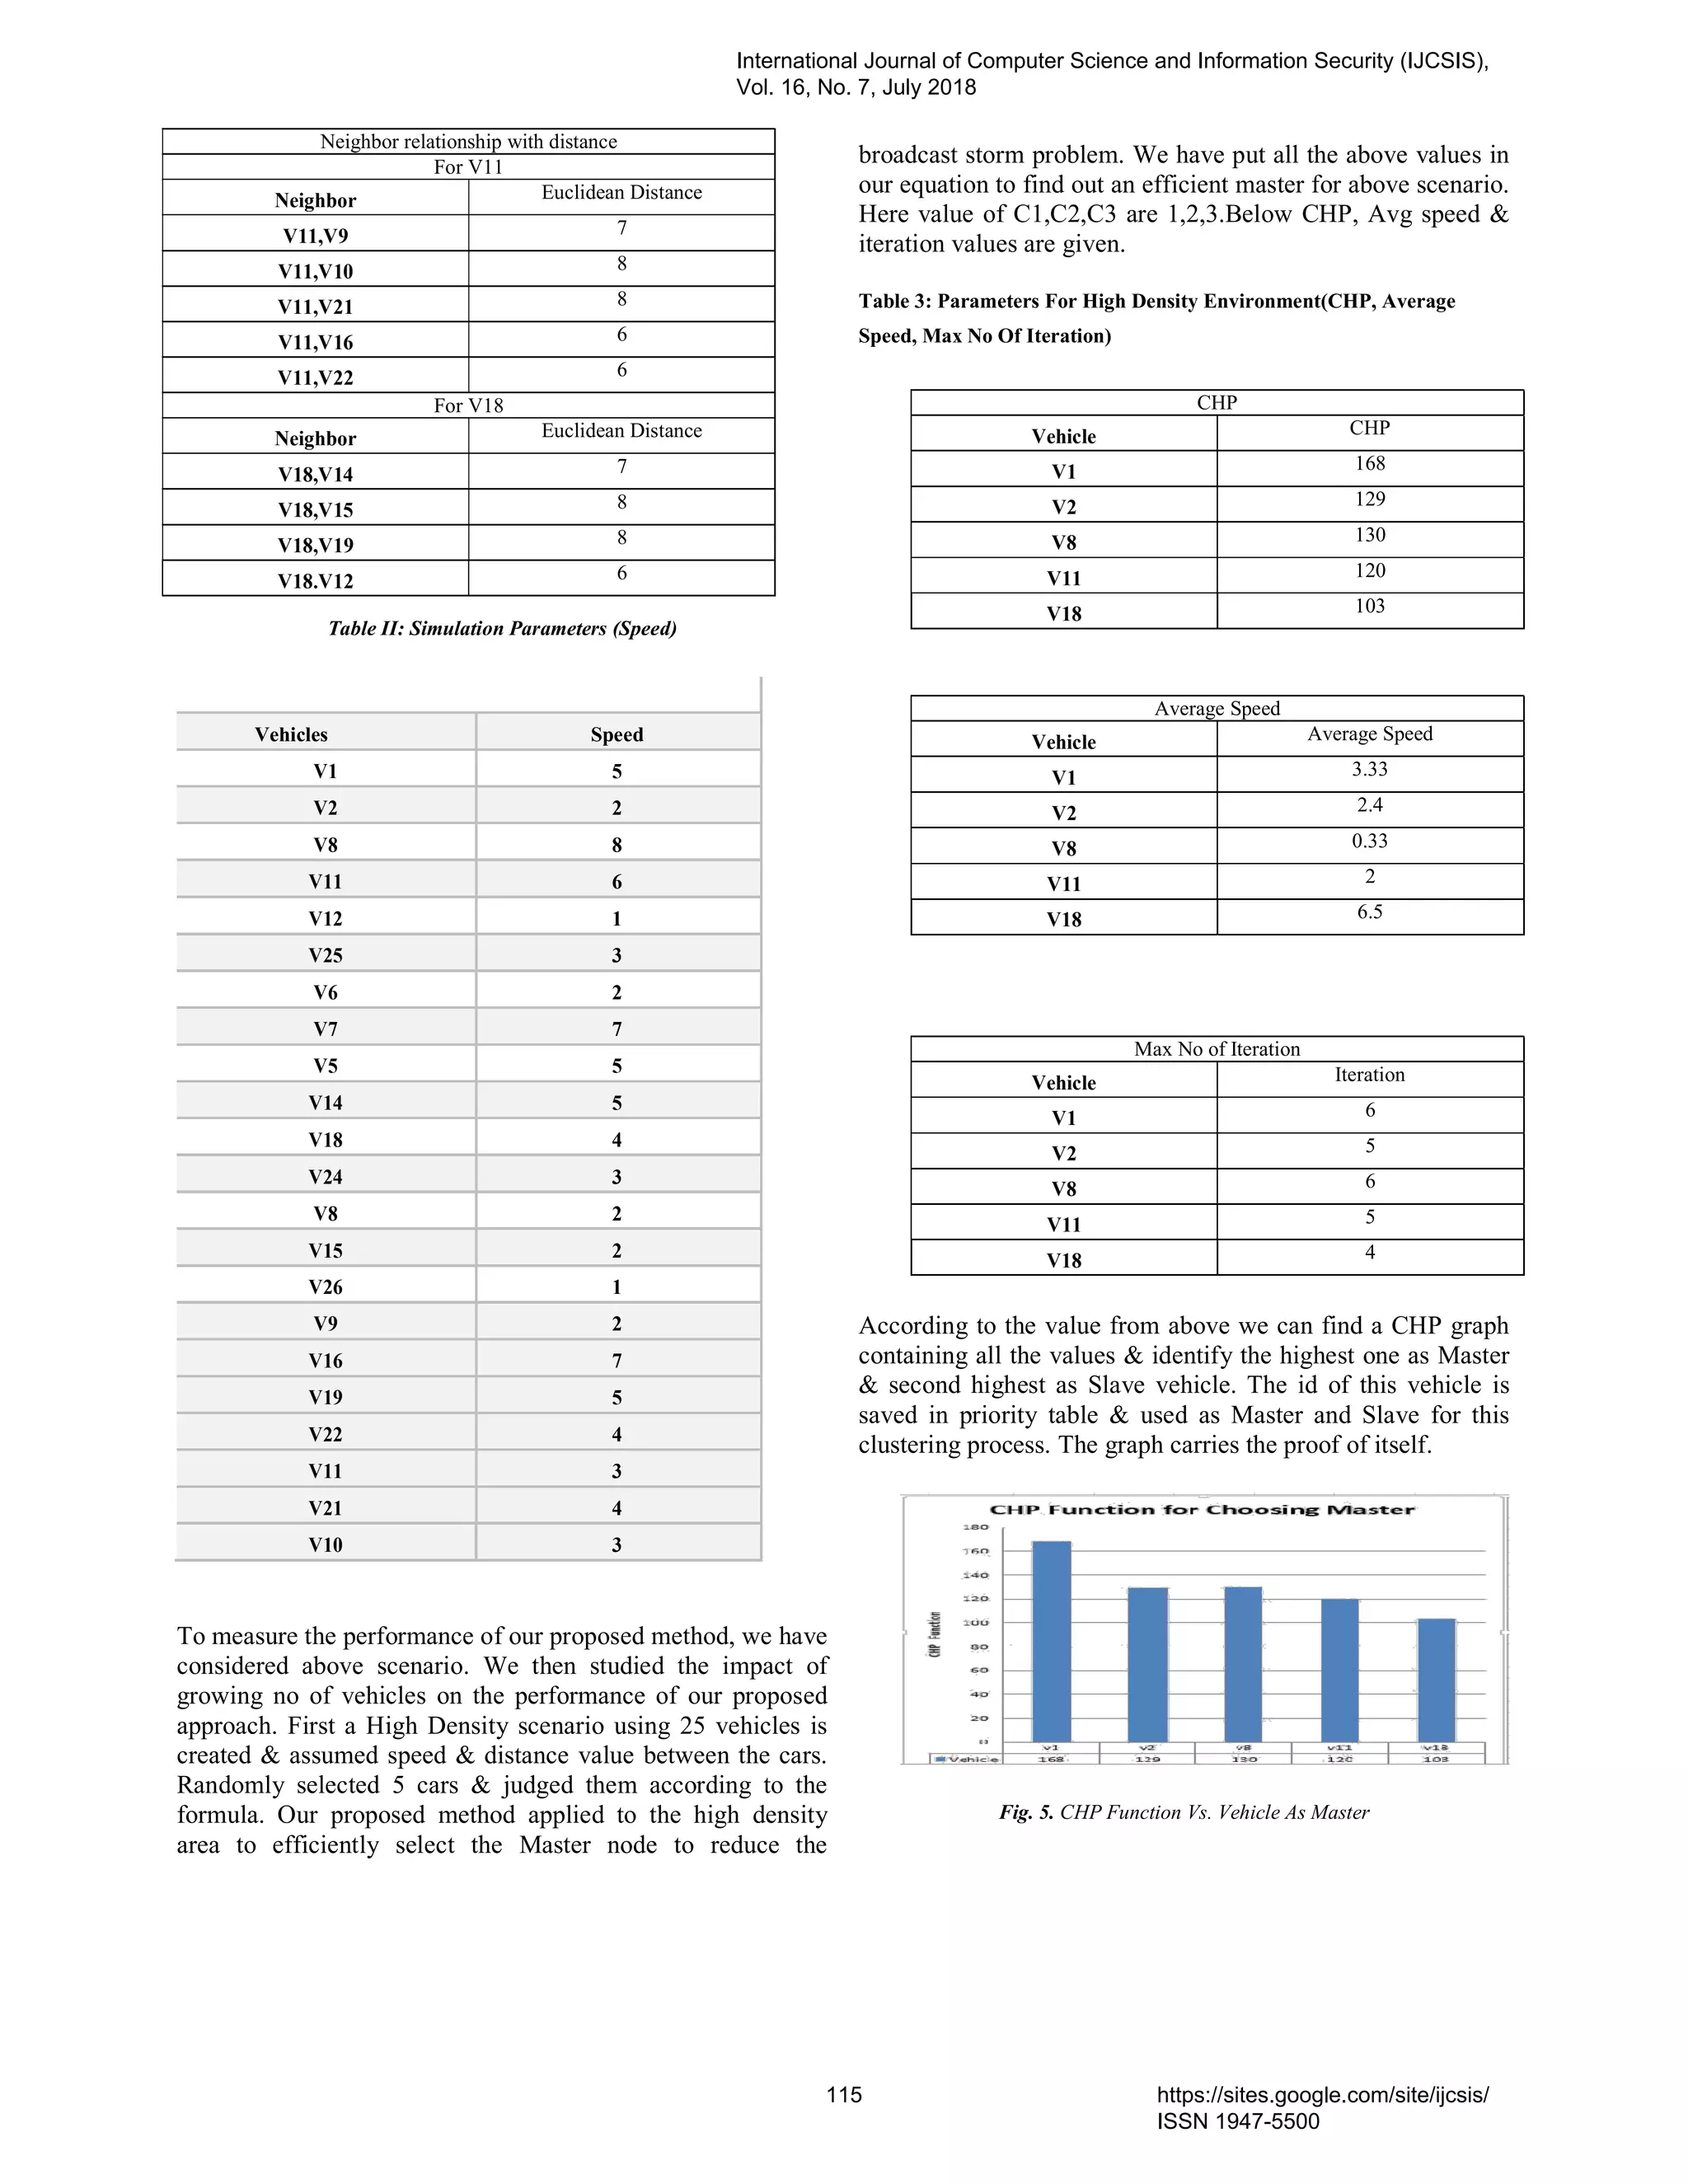
![This graph shows that V1 has the capability to handle entire
member as Master & V8 as slave. So, all these simulation
prove the above scenario that we have done for this research.
V. CONCLUSION
VANET is a hot topic of research for the last decade in the
vehicle industry. Lots of new routing protocols have been
proposed previously for making routing more efficient in the
rapidly changing topology in VANET. In this paper a cluster
based routing method is introduced where the cluster head
will be released from excess pressure while being the leader in
the cluster. The broadcast storm can be mitigated with the
introduced mechanism. In the introduced scheme, a cluster
will be having multiple cluster heads from where the master
and slave heads will be chosen from the value derived from
the CHP function. This slave will be used when the broadcast
will increase in the master CH. This will efficiently reduce the
broadcast overhead of the master CH. In the future the scheme
can be more optimized. Also in real time simulation
environments can be tested to make it more efficient and
trustworthy.
ACKNOWLEDGMENT
First of all we express our gratefulness to the Almighty
Allah, without His divine blessing it would not be possible for
us to complete this research. We sincerely like to thank our
honourable supervisor Md. Manirul Islam, Department of
Computer Science, American International University
Bangladesh (AIUB) for his great inspiration and proper
guidance throughout the whole research work. We are also
grateful to all of our respected teachers without whom we
would never be at this educational stage. We would like to
show our gratitude to our parents for being so understanding.
Last but not least we would like to express gratitude to our
Department Head Dr. Khandaker Tabin Hasan for his proper
direction to complete this work.
REFERENCES
[1] DF Llorca, MA Sotelo,S Sanchez,M. Ocana, JM Rodriguez,
Ascariz,MA Garca-Garrido.Traffic Data Collection for Floating Car Data
Enhancement in V2I Networks EURASIP Journal on Advances in Signal
Processing, 2010;2010;719294;1-13.
[2]. A. Daeinabi, A. G. P. Rahbar, A. Khademzadeh.VWCA: An efficient
clustering algorithm in vehicular ad hoc networks. Journal of Network and
Computer Applications, 2010.
[3]. J. Blum, A. Eskandarian, and L. Hoffman.Mobility Management in
IVC Networks. In IEEE Intelligent Vehicles Symposium, 2003.
[4]. P. Fan, J. G. Haran, J. Dillenburg, and P. C. Nelson. Cluster-based
framework in vehicular ad-hoc networks, Lecture Notes In Computer Science,
October 2005; 3738, p. 32–42.
[5]. Yang Qing , Lim Alvin ,Li Shuang ,Fang Jian And Agrawal Prathima
Acar: Adaptive Connectivity Aware Routing For Vehicular Ad Hoc Networks,
In City Scenarios Mobile Networks And Applications 2010, 15:1, p. 36-60.
[6]. H. Wu, R. Fujimoto, R. Guensler, and M. Hunter.MDDV: A Mobility-
Centric Data Dissemination Algorithm for Vehicular Networks. Vehicular Ad
Hoc Networks, 2004.
[7]. Neeraj Kumar, Naveen Chilamkurti, Jong Hyuk Park .Agent learning–
based clustering algorithm in vehicular ad hoc networks. Personal and
Ubiquitous Computing, September 2012 .
[8]. Bentaleb, A.; Boubetra, A.; Harous, S. Survey of clustering schemes in
mobile ad hoc networks.Commun. Netw.2013,5, 8–14.
[9]. Saleet, H.; Langar, R.; Naik, K.; Boutaba, R.; Nayak, A.; Goel, N.
Intersection-based geographical routing protocol for VANETs: A proposal
and analysis.IEEE Trans Veh. Technol.2011,60, 4560–4574.
[10]. Hassanabadi, B.; Shea, C.; Zhang, L.; Valaee, S. Clustering in
vehicular ad hoc networks using affinity propagation.Ad Hoc Netw.2014,13,
535–548.
[11]. Song, T.; Xia, W.; Song, T.; Shen, L. A cluster-based directional
routing protocol in VANET. In Proceedings of the 2010 12th IEEE
International Conference on Communication Technology (ICCT), Nanjing,
China,11–14 November 2010; pp. 1172–1175.
[12]. Review Article Vehicular Ad Hoc Networks: Architectures, Research
Issues,Methodologies, Challenges, and Trends Wenshuang Liang, Zhuorong
Li, Hongyang Zhang, Shenling Wang, and Rongfang Bie,Beijing 100875,
China.6 November 2014
[13]. H. Hartenstein and K. Laberteaux, VANET-Vehicular Applications
and Inter-Networking Technologies, John Wiley & Sons,2010.
[14]. http://www.worldbank.org/en/news/press-release/2017/07/19/modern-
dhaka-key-bangladesh-upper-middle-income-country-vision
[15]. A.Wahid, H. Yoo, and D. Kim, “Unicast geographic routing
protocols for inter-vehicle communications: a survey,” in Proceedings of the
5th ACM Workshop on Perfor Mance
Monitoring and Measurement of Heterogeneous Wireless and Wired
Networks (PM2HW2N ’10), pp. 17–24, New York, NY, USA, 2010.
[16]. Fan Li and Yu Wang , Routing in Vehicular Ad Hoc Networks: A
Survey , IEEE Vehicular Technology Magazine, June 2007, pp. 12-22
[17]. Harri, J., Filali, F., and Bonnet, C. (2009). Mobility models for
vehicular ad hoc networks: a survey and taxonomy. Communications Surveys
and Tutorials, IEEE, 11(4), 19-41
[18]. Ding, Ranran, and Qing-An Zeng. "A clustering-based multi-channel
vehicle-to-vehicle (V2V) communication system." Master Thesis, University
of Cincinnati, 2009
International Journal of Computer Science and Information Security (IJCSIS),
Vol. 16, No. 7, July 2018
116 https://sites.google.com/site/ijcsis/
ISSN 1947-5500](https://image.slidesharecdn.com/journalofcomputerscienceijcsisjuly2018fullvolume-180915043348/75/Journal-of-computer-science-ijcsis-july-2018-full-volume-130-2048.jpg)
![Prediction of Suicidal Case Poisoning by
Modeling and Simulation of Time Series
Mohammed Kaicera*
, Siham Mahirb
, Wafae Elelem c
, Abdelmajid Soulaymanib
, Rachida
Soumlaymanid
, Latifa Amiare
, Rachid Hmimoud
a
b
Genetic & Biometric laboratory Tofail university, 242, Kenitra - Maroc
c
laboratory of study and research in applied mathematics, EMI, Med 5 university, United Nations Avenue, Agdal, Rabat Morocco B.P: 8007.N.U
d
PPCM, Faculty of Medicine, Med 5 university, United Nations Avenue, Agdal, Rabat Morocco B.P: 8007.N.U
e
Faculty of Sciences and Technology, Old street of Aeroport, Km 10, Ziaten. 416. Tangier - Morocco
*Corresponding authors: mohammed.kaicer@uit.ac.ma
Abstract- In Morocco, poisoning is a real public health challenge with its frequency and severity. In period of 1980 and
2007, more than 77,000 cases are listed by the Poison Control Center of Morocco (PCCM), such as the highest number of
deaths in was the Souss-Massa-Daraa region, it is a PPD. This work aims to study the evolution of health indicators, and to
determine the substance influencing intoxicated patients in the studied region. This study allowed drawing and for the
first time the epidemiology of poisoning in the Souss-Massa-Daraa region during the last 21 years and the treatment is
based on data of period 1992 2012. The forecast, based on modeling and simulation of time series, results show an increase
in cases of suicide attempts in the year 2013Thus, the results show that the number of cases of poisoning and the mortality
rate in our region are far from negligible. Besides, this modeling presents a decision making tools destined to reduce
morbidity and mortality due to poisoning.
I. INTRODUCTION
Poisoning is a set of the organism functioning disorders due to the absorption of a foreign substance, called toxic.
A substance is said to be a poison when, after penetration into the body, by any means, at a relatively high dose (once
or several times very close together) or in small, long-repeated doses, it causes, in the immediate or after a latent
phase more or less prolonged, temporarily or lasting, disorders of one or more functions of the body up to their
complete suppression and bring death [2]. Thus, poisoning is considered a major health problem worldwide (WHO,
2005). The available statistics is not exhaustive. In 2004, the World Health Organization [16] recorded 345,814 cases
of poisoning deaths in the world, or 5.35 deaths per 100,000 of people. The victims were mostly adults (20-74 years
old), but 13% were children (5-14 years old) [12]. In adolescents (15-19 years), poisoning is the 13th leading cause
of death, while among children under 15; they are the 4th cause (2000-2001) after road accidents, fires and drowning
[13].
In Morocco, according to data from the Anti Poison Center and Pharmacovigilance Morocco [17], 77 133 cases of
poisoning were recorded with 1203 deaths in the period 1980-2007 [10]. The geographical distribution of cases of
poisoning in different regions of Morocco shows that there is a difference between the regions of country. The
number of returns, the number of deaths, the type of toxic as suspected, the effect, mortality, with the highest number
of reports reported in the Grand Casablanca region (17.5% of the total cases). And, the highest number of deaths
observed in the Souss-Massa region Daraa area (187 deaths) with a 3.9% case fatality rate [10].
Thus, the development of the strategies of antitoxic control is not uniform for all the regions, requires knowledge
of the epidemiology of poisoning in each region. To evaluate the incidence, the mortality and to determine the risk
factors, so to reduce the morbidity and mortality of these poisonings. Unfortunately, the exact dimensions of this
phenomenon in the Souss-Massa-Daraa region are still poorly defined. This study is a retrospective epidemiological
International Journal of Computer Science and Information Security (IJCSIS),
Vol. 16, No. 7, July 2018
117 https://sites.google.com/site/ijcsis/
ISSN 1947-5500](https://image.slidesharecdn.com/journalofcomputerscienceijcsisjuly2018fullvolume-180915043348/75/Journal-of-computer-science-ijcsis-july-2018-full-volume-131-2048.jpg)
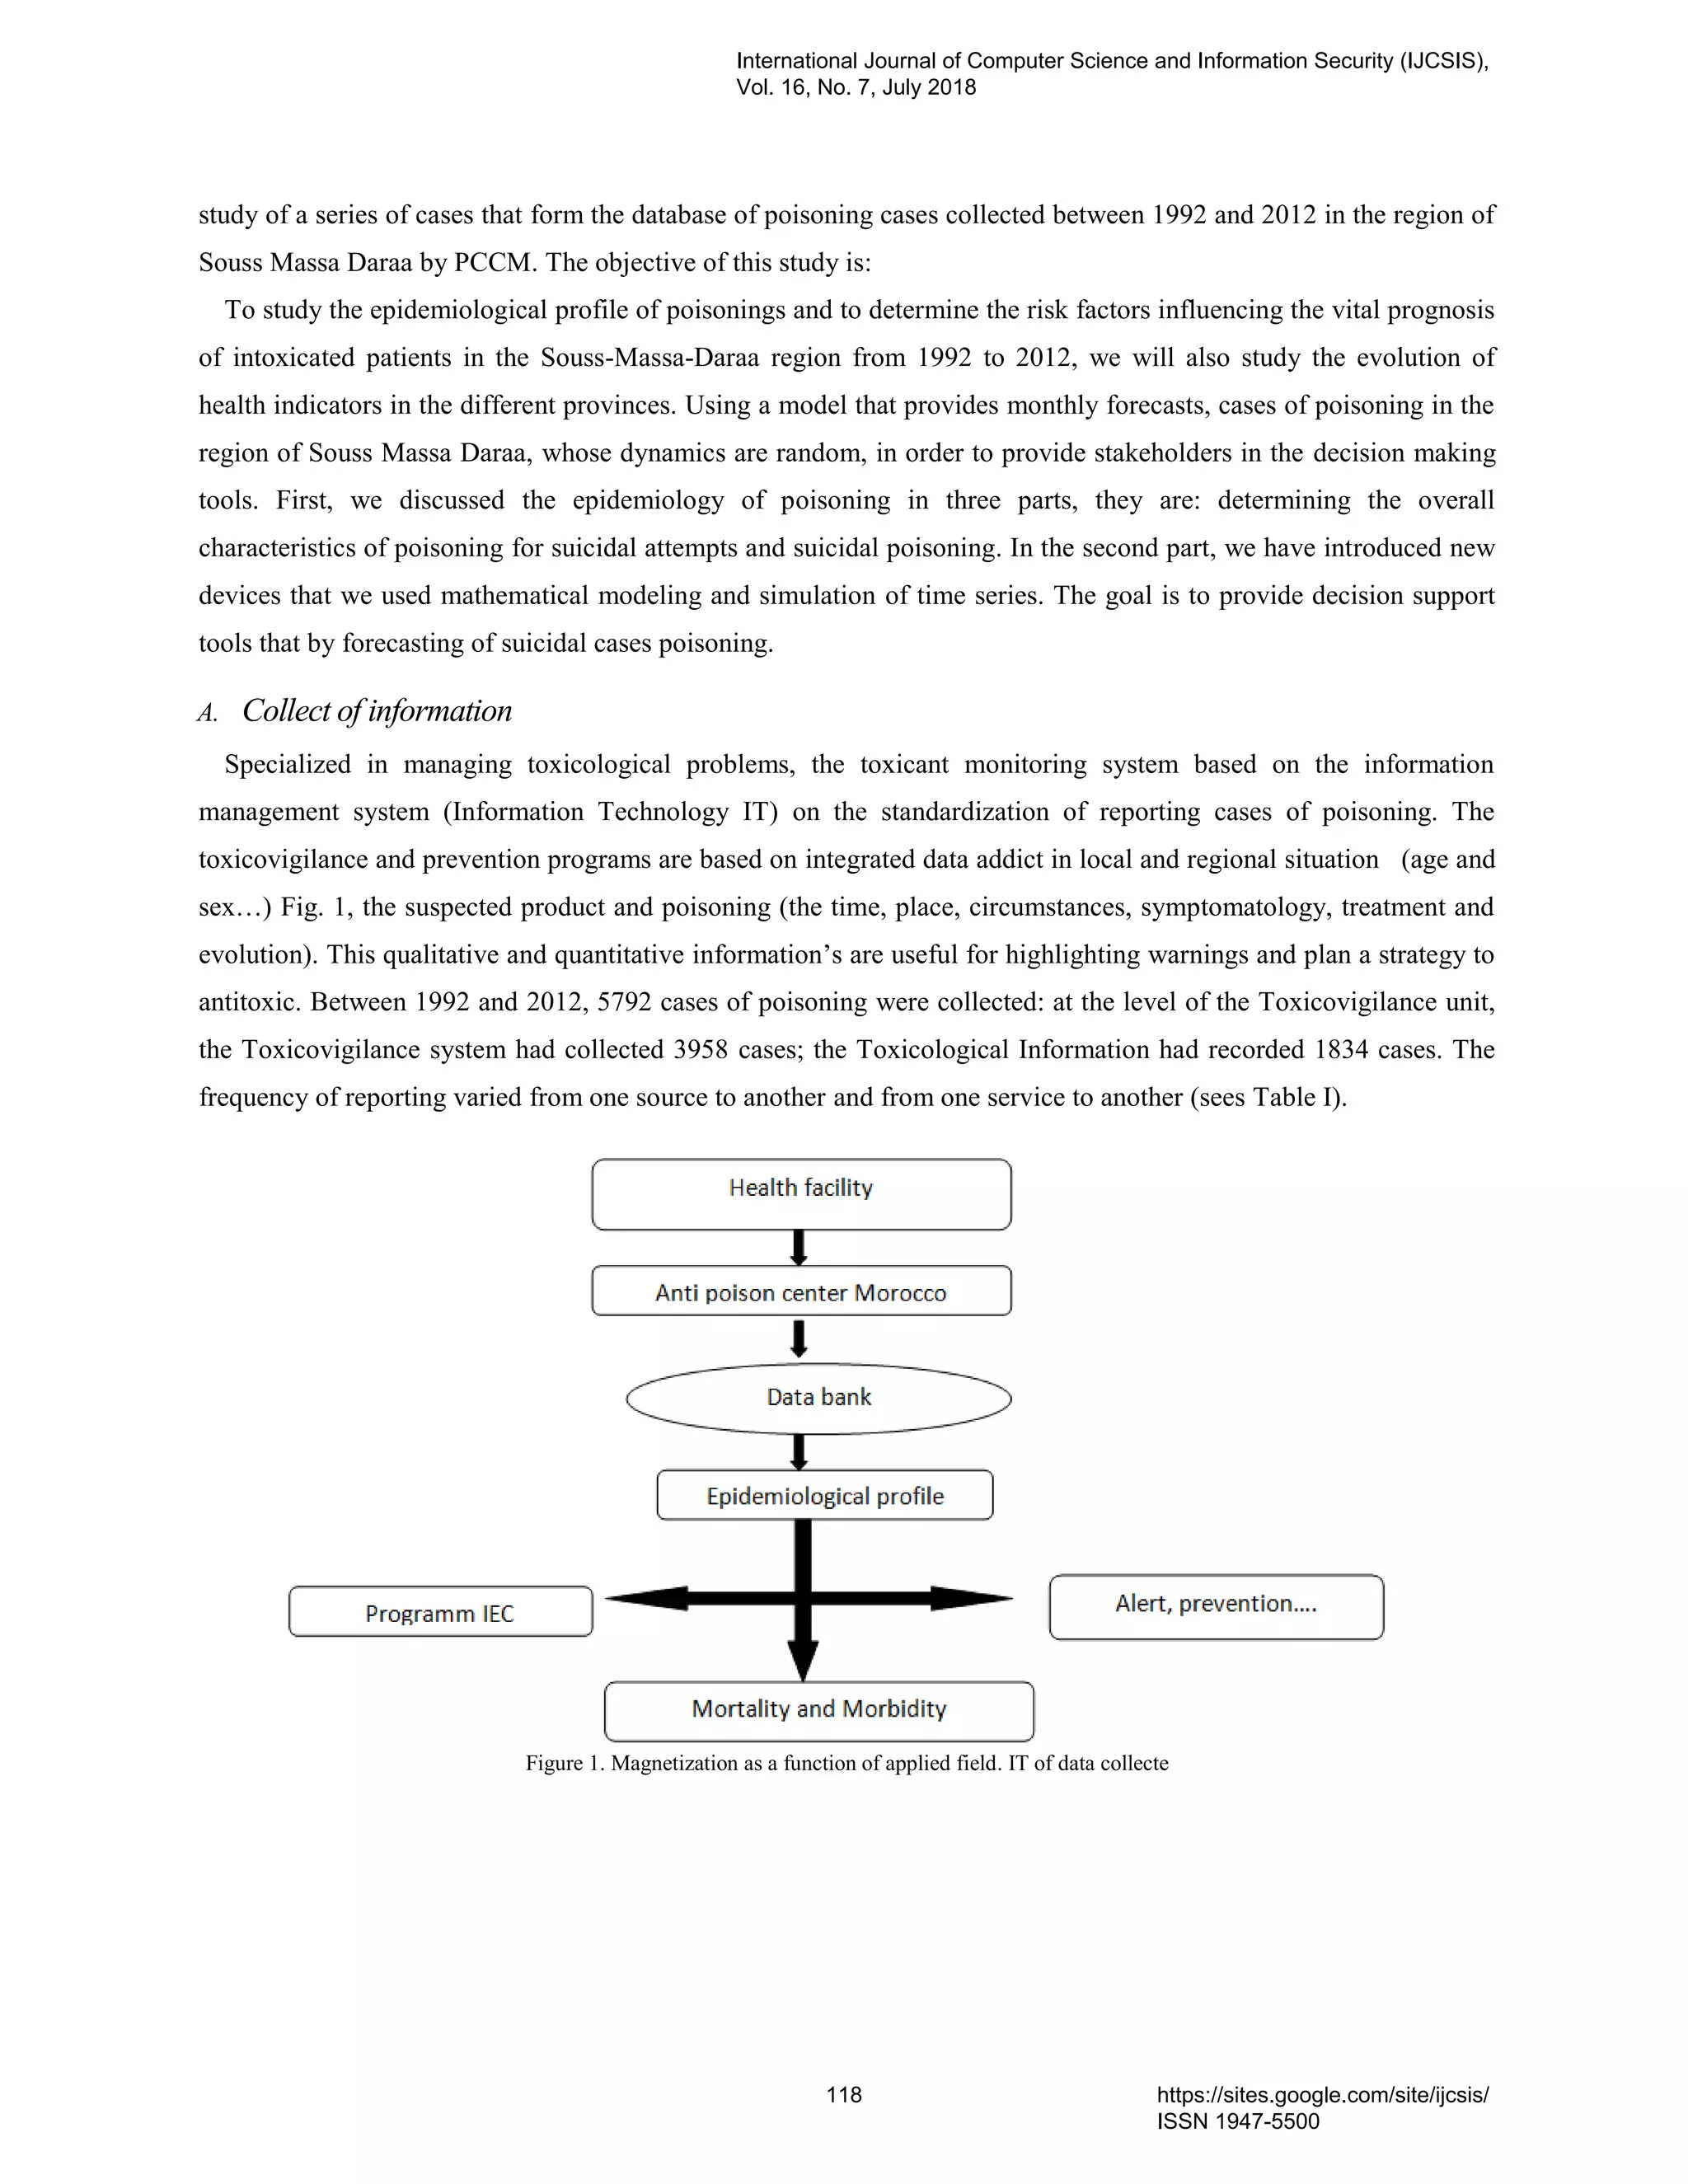
![Table I
Number of cases recorded by information system, by source and by service
Center Information Technology Provenance Service n (%)
Information of Toxicology
(31,66%)
Home - 217 (11,83)
Hospital structure
Emergency 1364 (74,37)
Pediatrics 33 (01,79)
Resuscitation
Dermatology
Psychiatry
16 (00,87)
3 (00,16)
1 (00,05
Pharmacy - 42 (02,29)
Telephone Cabinet - 7 (00, 38)
Other - 5 (00,27)
Unknown - 247 (13,46)
1834 (100,00)
Toxicovigilance
(68,34%)
Hospital Structures
Emergency 3864 (90,67)
Medicine 60 (00,08)
Dermatology 6 (00,05)
Pediatrics 28 (00,02)
3958 (100,00)
Total 5792 (100,00)
The Toxicovigilance system had collected the most information. He was able to collect up to 68.34% of all reports,
coming only from hospitals. The vast majority came from emergencies, most likely because of the dangerousness of
poisoning. The telephone response, she had particularly interested the home, which could show that the population
alert, declare and frequently seeks advice and recommendations.
The objective of the descriptive statistics is to describe, that is to summarize or represent by statistics, the available
data when they are numerous. It consists of identifying the frequencies and characteristics of each studied parameter,
which allowed us to draw up an epidemiological profile of poisoning in the Souss-Massa-Daraa region.
The results are expressed in raw values for the qualitative and average variables ± 1 the standard deviation for
quantitative variables. The analytic statistics was based on association tests such as the Khi-2 test (2). (for more
details) [15].
B. Data analysis
Time parameters
The average annual number of reports was 275 cases. The year 1994 had the lowest number of cases (174 cases).
While the year 2010 had notified the most cases ( 424 cases). Fig 2, illustrates the distribution of cases of poisoning
reported by year, from 1992 to 2012 [4].
International Journal of Computer Science and Information Security (IJCSIS),
Vol. 16, No. 7, July 2018
119 https://sites.google.com/site/ijcsis/
ISSN 1947-5500](https://image.slidesharecdn.com/journalofcomputerscienceijcsisjuly2018fullvolume-180915043348/75/Journal-of-computer-science-ijcsis-july-2018-full-volume-133-2048.jpg)
![Figure 2. Annual distribution of cases of poisoning
The annual distribution of reported cases shows that reporting has been increasing since 1994 with a first peak in
1999, coinciding with the period when awareness became increasingly active in the reporting of PCCM poisoning
cases. Through provincial stimulus letters, continuing education of health staff and open awareness days. The period
between 2003 and 2004 had resulted in a remarkable decrease in the number of poisonings, with a minimum of cases
in 2004. This decrease can be explained by the fact that in 2003, several awareness campaigns were conducted
intensively and good dissemination of information has been done [9].
III. PREDICTION OF CASES OF SUICIDAL POISONING BY TIME SERIES
A. Annual distribution of suicidal poisonings by the P-PhenyleneDiamine (PPD)
Ref. [15] the results presented in Fig. 3, show that each year, the suicidal poisonings by the PPD appear, on
average in 6 cases, generating 2 deaths per year. In addition, the results of the evolution of the cases of attempted
suicide by the PPD show a decrease in cases of suicide attempts and deaths between 1992 and 2012. It is also
observed that between 2005 and 2012, there were no deaths at all been registered.
Frequency
Year
International Journal of Computer Science and Information Security (IJCSIS),
Vol. 16, No. 7, July 2018
120 https://sites.google.com/site/ijcsis/
ISSN 1947-5500](https://image.slidesharecdn.com/journalofcomputerscienceijcsisjuly2018fullvolume-180915043348/75/Journal-of-computer-science-ijcsis-july-2018-full-volume-134-2048.jpg)
![Figure 3. The annual evolution of suicidal poisonings by the PPD
Ref. [6] the number of addicts varies according to the year, such that the year 1994 had recorded the least number
of cases, while the year 2010 had notified the most cases, after the year 2010 there was a slight decrease in the
number of reports. This study was limited to 2012 due to lack of data (the databases are not always easy to grasp
because the declarations are very numerous). Because of this, it is necessary to know the future forecasts.
The preceding remarks therefore lead to the conclusion that decision-makers (in the field of health, education,
politics, etc.) have great difficulty in making the best decision for reducing the morbidity and mortality of poisoning
in our region. For this reason, that we are using a model that allows obtaining monthly forecasts, cases of poisoning
in the Souss-Massa-Daraa, whose dynamics are random, in order to offer stakeholders of the decision making tools
in public health sector.
B. Problematic and objective
According to the epidemiological profile results of poisoning in the Souss-Massa-Daraa and the risk factors we
recorded 1154 cases of suicide attempts with 91 cases of death and a risk of 3 times more than the other
circumstances of death. Poisoning which shows the seriousness of suicidal poisoning [15, chapter 2].
Indeed, the annual distribution of cases of suicidal poisoning shows that the year 1996 had recorded the most
cases, or 118 cases, while the year 2009 had notified the least case, or 20 cases. According to the results of the
distribution of the evolution of suicide attempts, the years 1993, 1995 and 2002 recorded the most cases of fatal
suicidal poisoning, with respectively, 11 deaths, 12 deaths and 11 deaths.
After 2003, there has been a remarkable decrease in cases of suicide attempts and suicide during the period 2003
and 2009. Starting in 2010, cases of suicide attempts and suicide have increased again Fig. 4,. This can be explained
by the following events:
Prohibiting the sale of PPD (a toxic substance widely used in this region for suicide) in 2003 plays a
very important role in reducing cases of suicide attempts during the period 2004-2009.
Number of suicide of attempts by PPD
Number of suicide by PPD
International Journal of Computer Science and Information Security (IJCSIS),
Vol. 16, No. 7, July 2018
121 https://sites.google.com/site/ijcsis/
ISSN 1947-5500](https://image.slidesharecdn.com/journalofcomputerscienceijcsisjuly2018fullvolume-180915043348/75/Journal-of-computer-science-ijcsis-july-2018-full-volume-135-2048.jpg)
![ After the year 2010, we recorded a successive increase of suicide attempts. This may be because of,
people are looking for other toxic products for use in suicide after the prohibition of PPD. It has been
confirmed by [15], which shows an increase in the use of drugs, pesticides and agricultural products [4,
9].
Figure 4. Annual distributions of cases of suicide and suicide attempts by toxic products between 1992 and 2012
Increased cases of suicide attempts through the use of toxic products ranging from 20 cases in 2009 to 58 cases in
2012. So, given this dynamic of this series, we are obliged to know its tendency. At least general, to understand this
dynamic, using a model that provides monthly forecasts, suicidal poisoning cases in the Souss-Massa-Daraa , in
order to offer industry stakeholders decision-making tools to minimize the damage.
C. The methodology of forecasting
The development forecasts cases of suicidal poisonings in this area is based on historical statements of cases of
suicidal poisoning have been recorded by the PCCM for the period 1992 and 2012. Thus, the data are a series of case
of suicidal poisoning evolved over time. So the prediction of many of the suicide attempts is based on past values to
predict future values. The most appropriate prediction technique with data by time series modeling.
To decrease the uncertainty of prediction, we chose a short-term horizon to predict the number of cases of suicidal
poisoning in the Souss-Massa-Daraa. Thus, we measured the monthly number of cases of suicidal poisoning during
2013.
Indeed, there are several predictive models for time series. We chose a basic model, it is "Autoregressive
Integrated Moving Average" (ARIMA), developed by Box & Jenkins (1976) [3], which treats only phenomena that
are linear or approximately but does not allow “capture "the properties of nonlinear phenomena. In addition, the
ARIMA model is used in short-term forecasting.
International Journal of Computer Science and Information Security (IJCSIS),
Vol. 16, No. 7, July 2018
122 https://sites.google.com/site/ijcsis/
ISSN 1947-5500](https://image.slidesharecdn.com/journalofcomputerscienceijcsisjuly2018fullvolume-180915043348/75/Journal-of-computer-science-ijcsis-july-2018-full-volume-136-2048.jpg)
![Ref. [3] the Box & Jenkins methodology aims to formulate a model to represent a chronicle with the purpose of
predicting future values. As such, the purpose of this methodology is to model a time series based on its past and
present values to determine the appropriate ARIMA process by parsimony [1]. This methodology suggests a
following procedure: Identification, Model estimation, Model validation and Prediction.
D. Analysis and simulation of the prediction model
1. Identification
Before using the ARIMA procedure, we must first examine the series and verify its stationarity with a time chart
Fig.5,. If the average of the series or its variance shows a variation over time, then it is necessary to differentiate the
series or to use a transformation which makes the series stationary and to verify the stationarity.
2. Sequential diagram
The sequence diagram is very important because it allows us to determine if a series is stationary or not. It is
important to begin the study with this diagram.
Figure 5. Monthly distributions of suicidal poisonings between 1992 and 2012
Apparently, this series is not stationary: it seems to be present on the one hand a break of trend and on the other
hand a volatility of values which diminished over time
3. Stationarity of serie:
To improve the trend, it gives the difference in the value 1 this variable corresponds to the ARIMA model.
International Journal of Computer Science and Information Security (IJCSIS),
Vol. 16, No. 7, July 2018
123 https://sites.google.com/site/ijcsis/
ISSN 1947-5500](https://image.slidesharecdn.com/journalofcomputerscienceijcsisjuly2018fullvolume-180915043348/75/Journal-of-computer-science-ijcsis-july-2018-full-volume-137-2048.jpg)
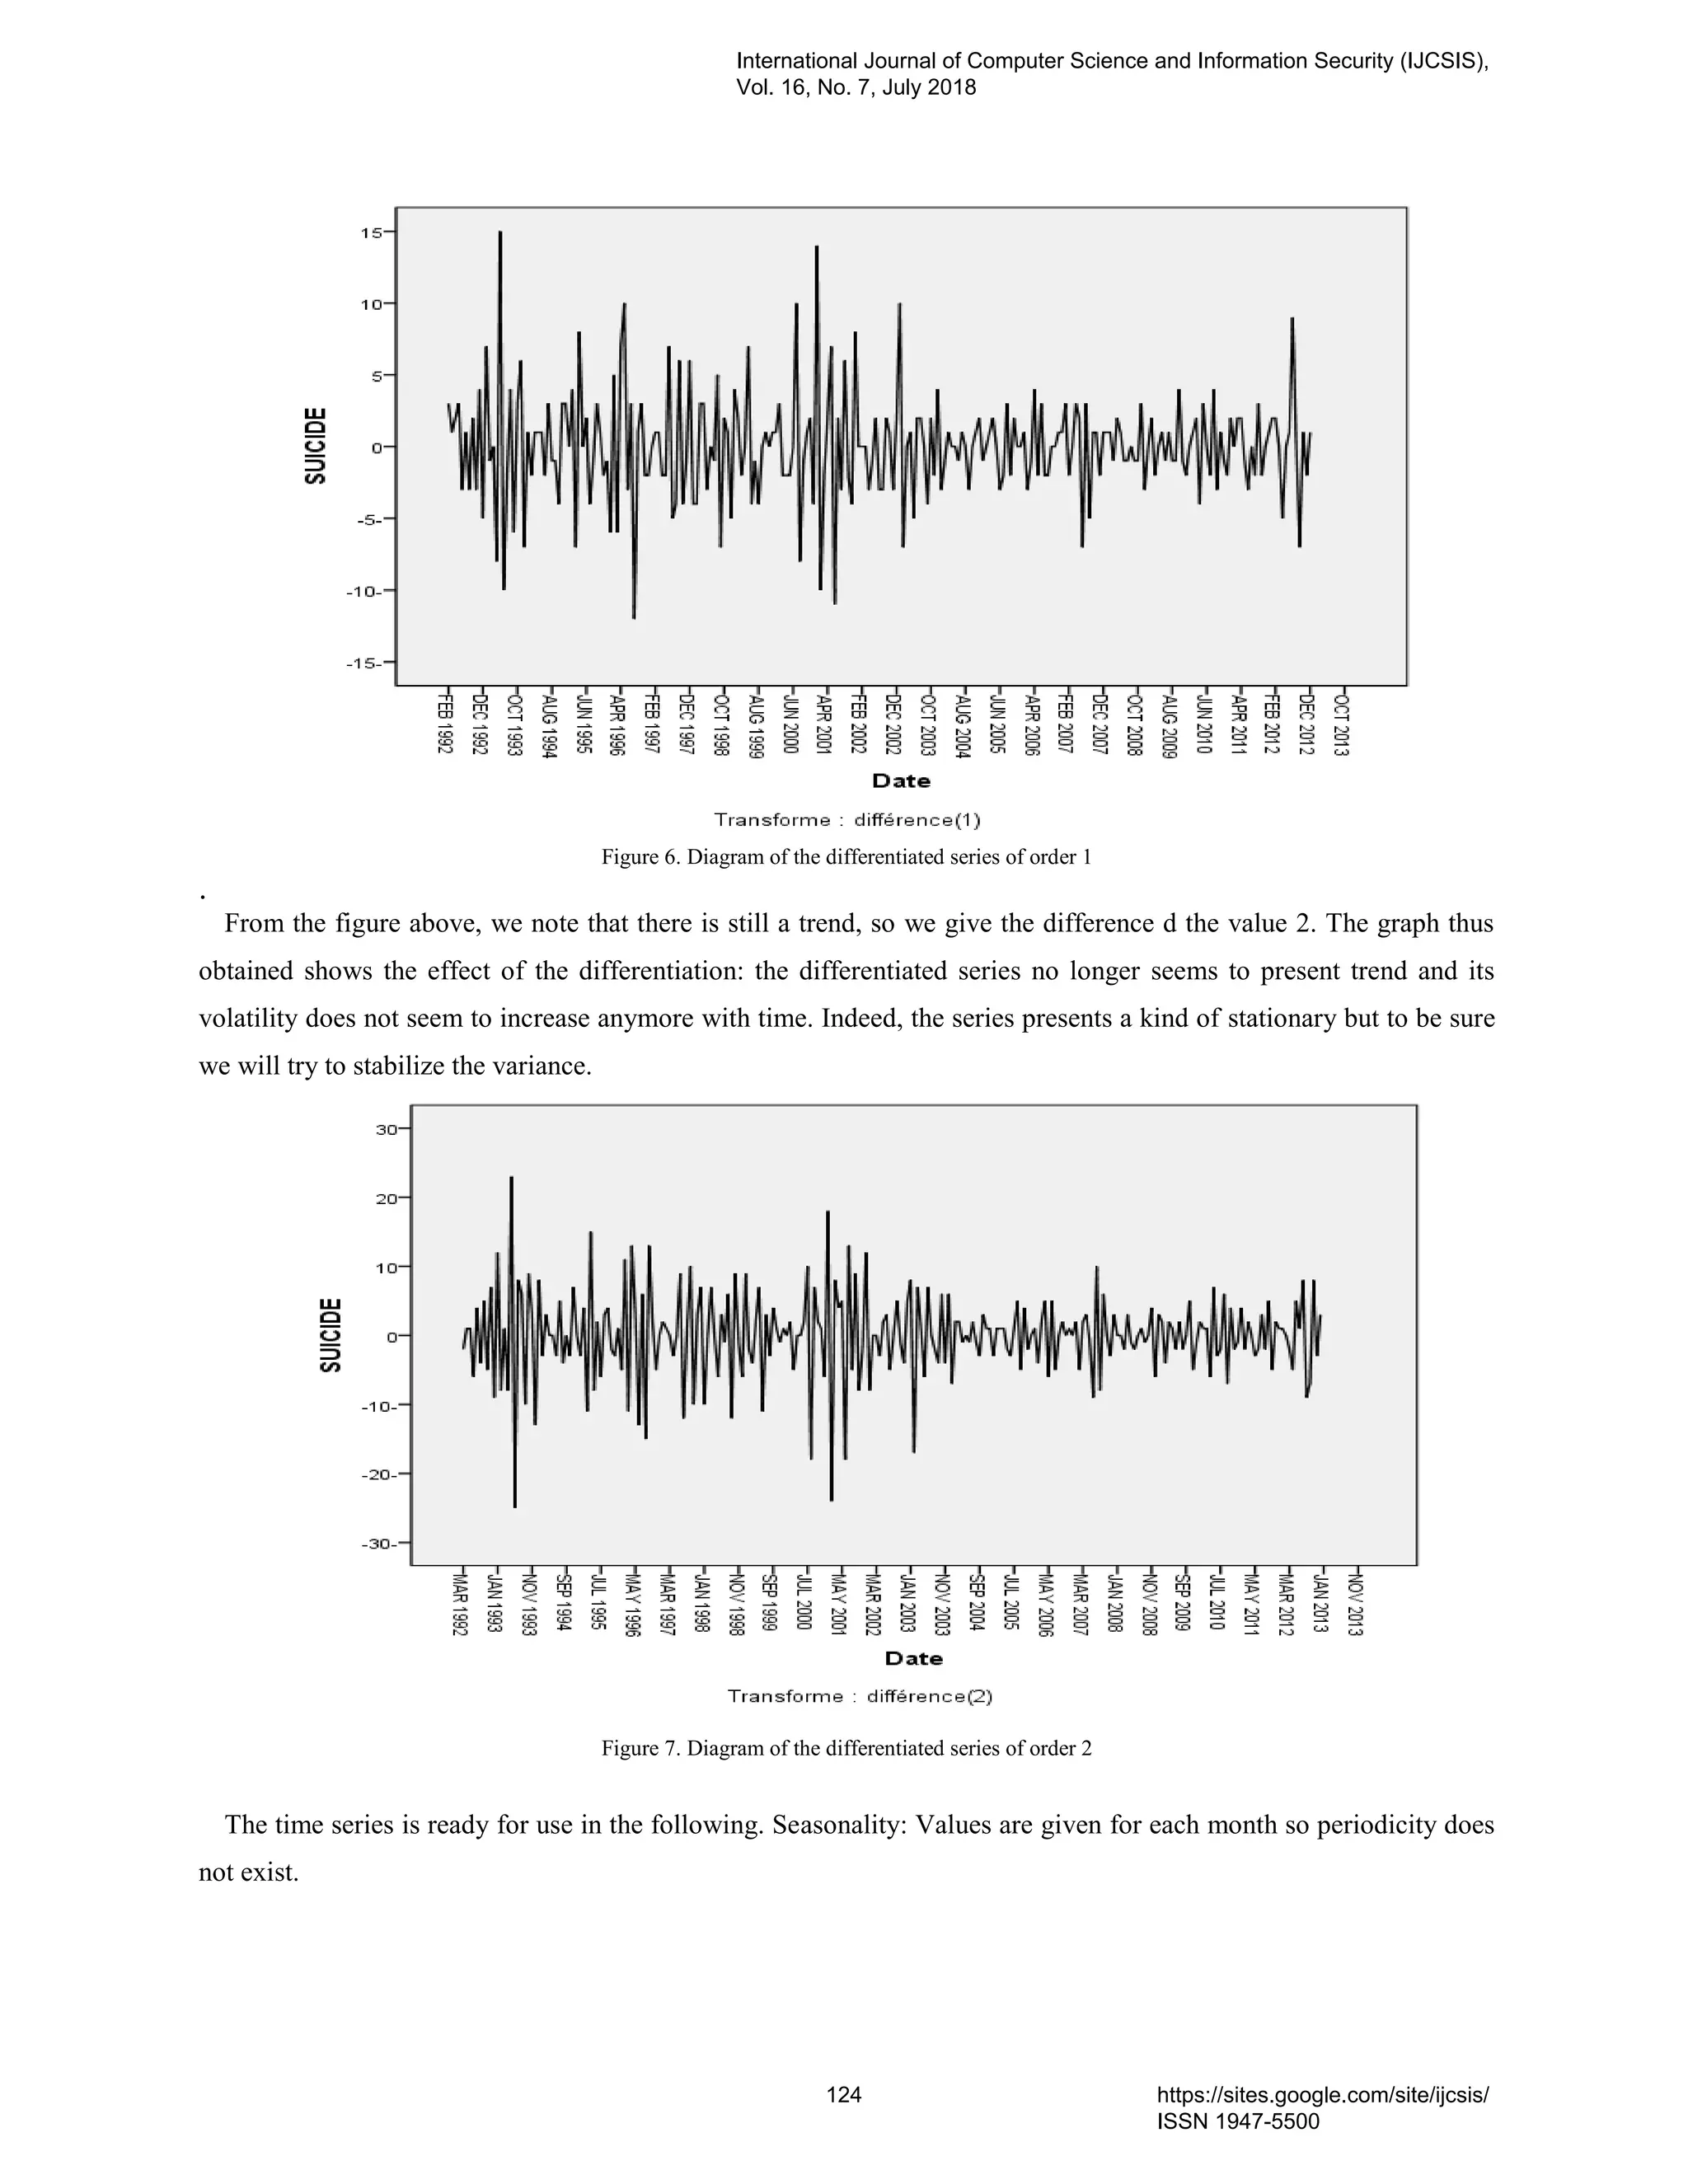
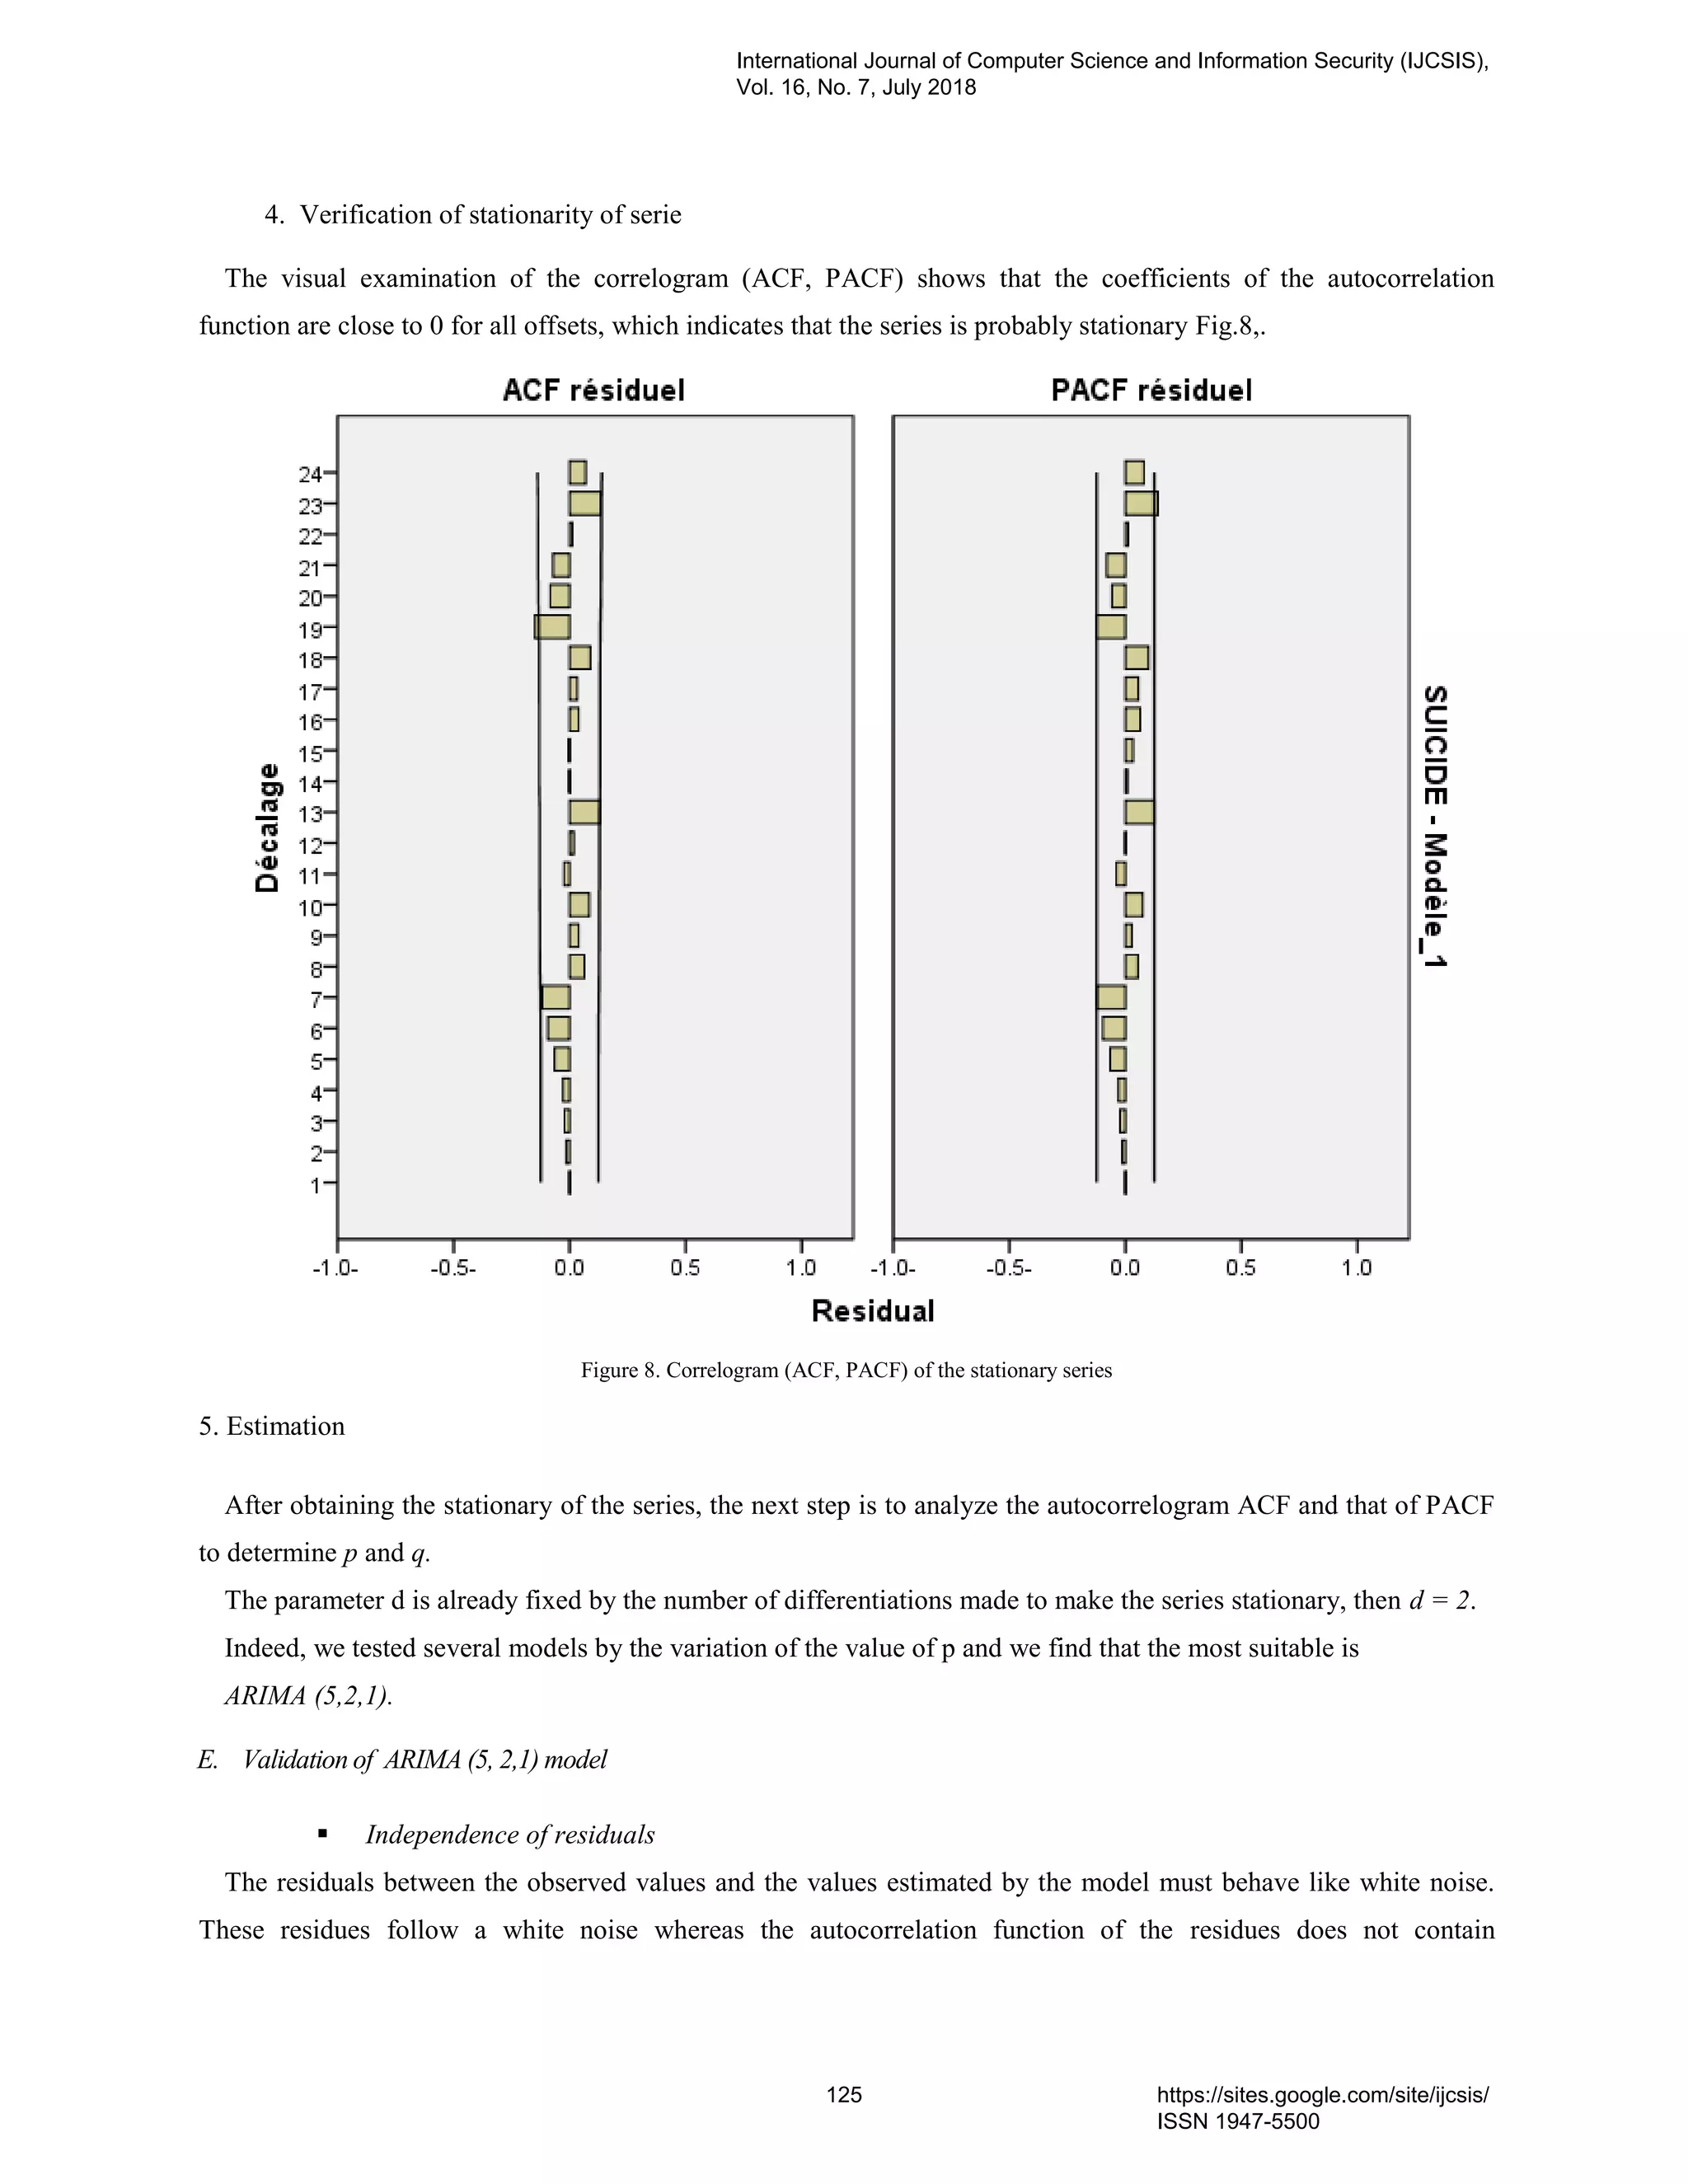
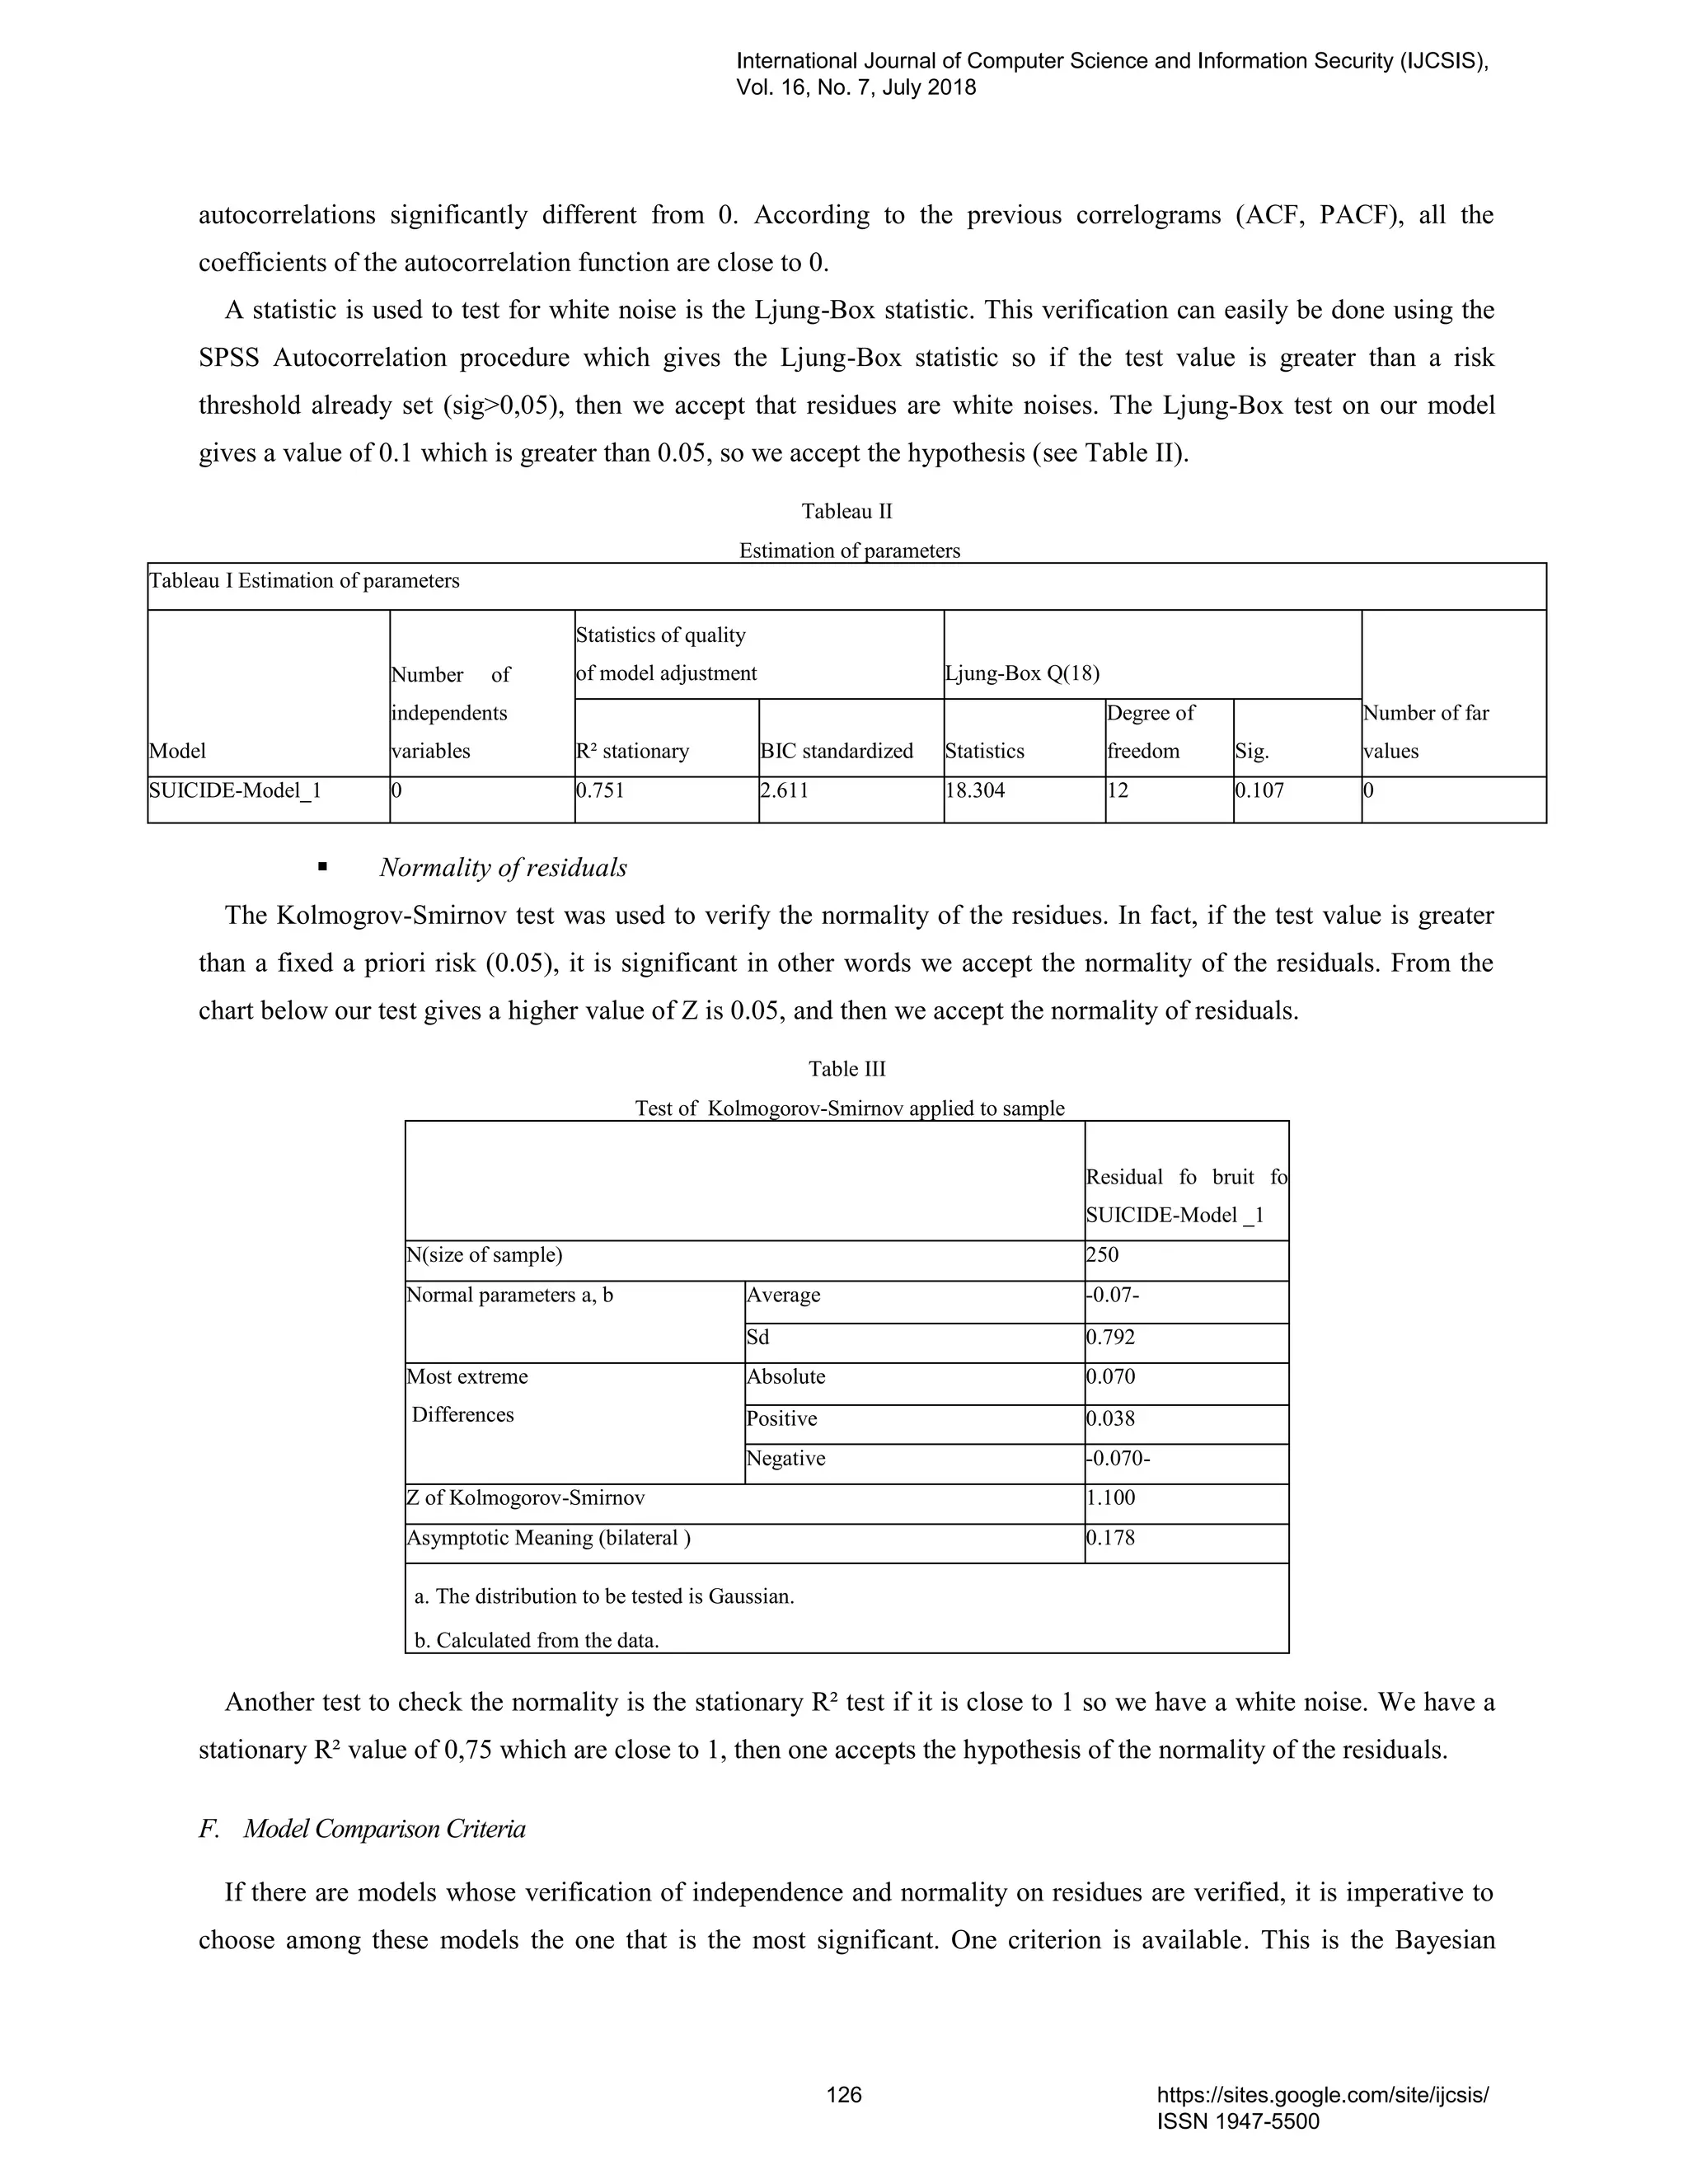
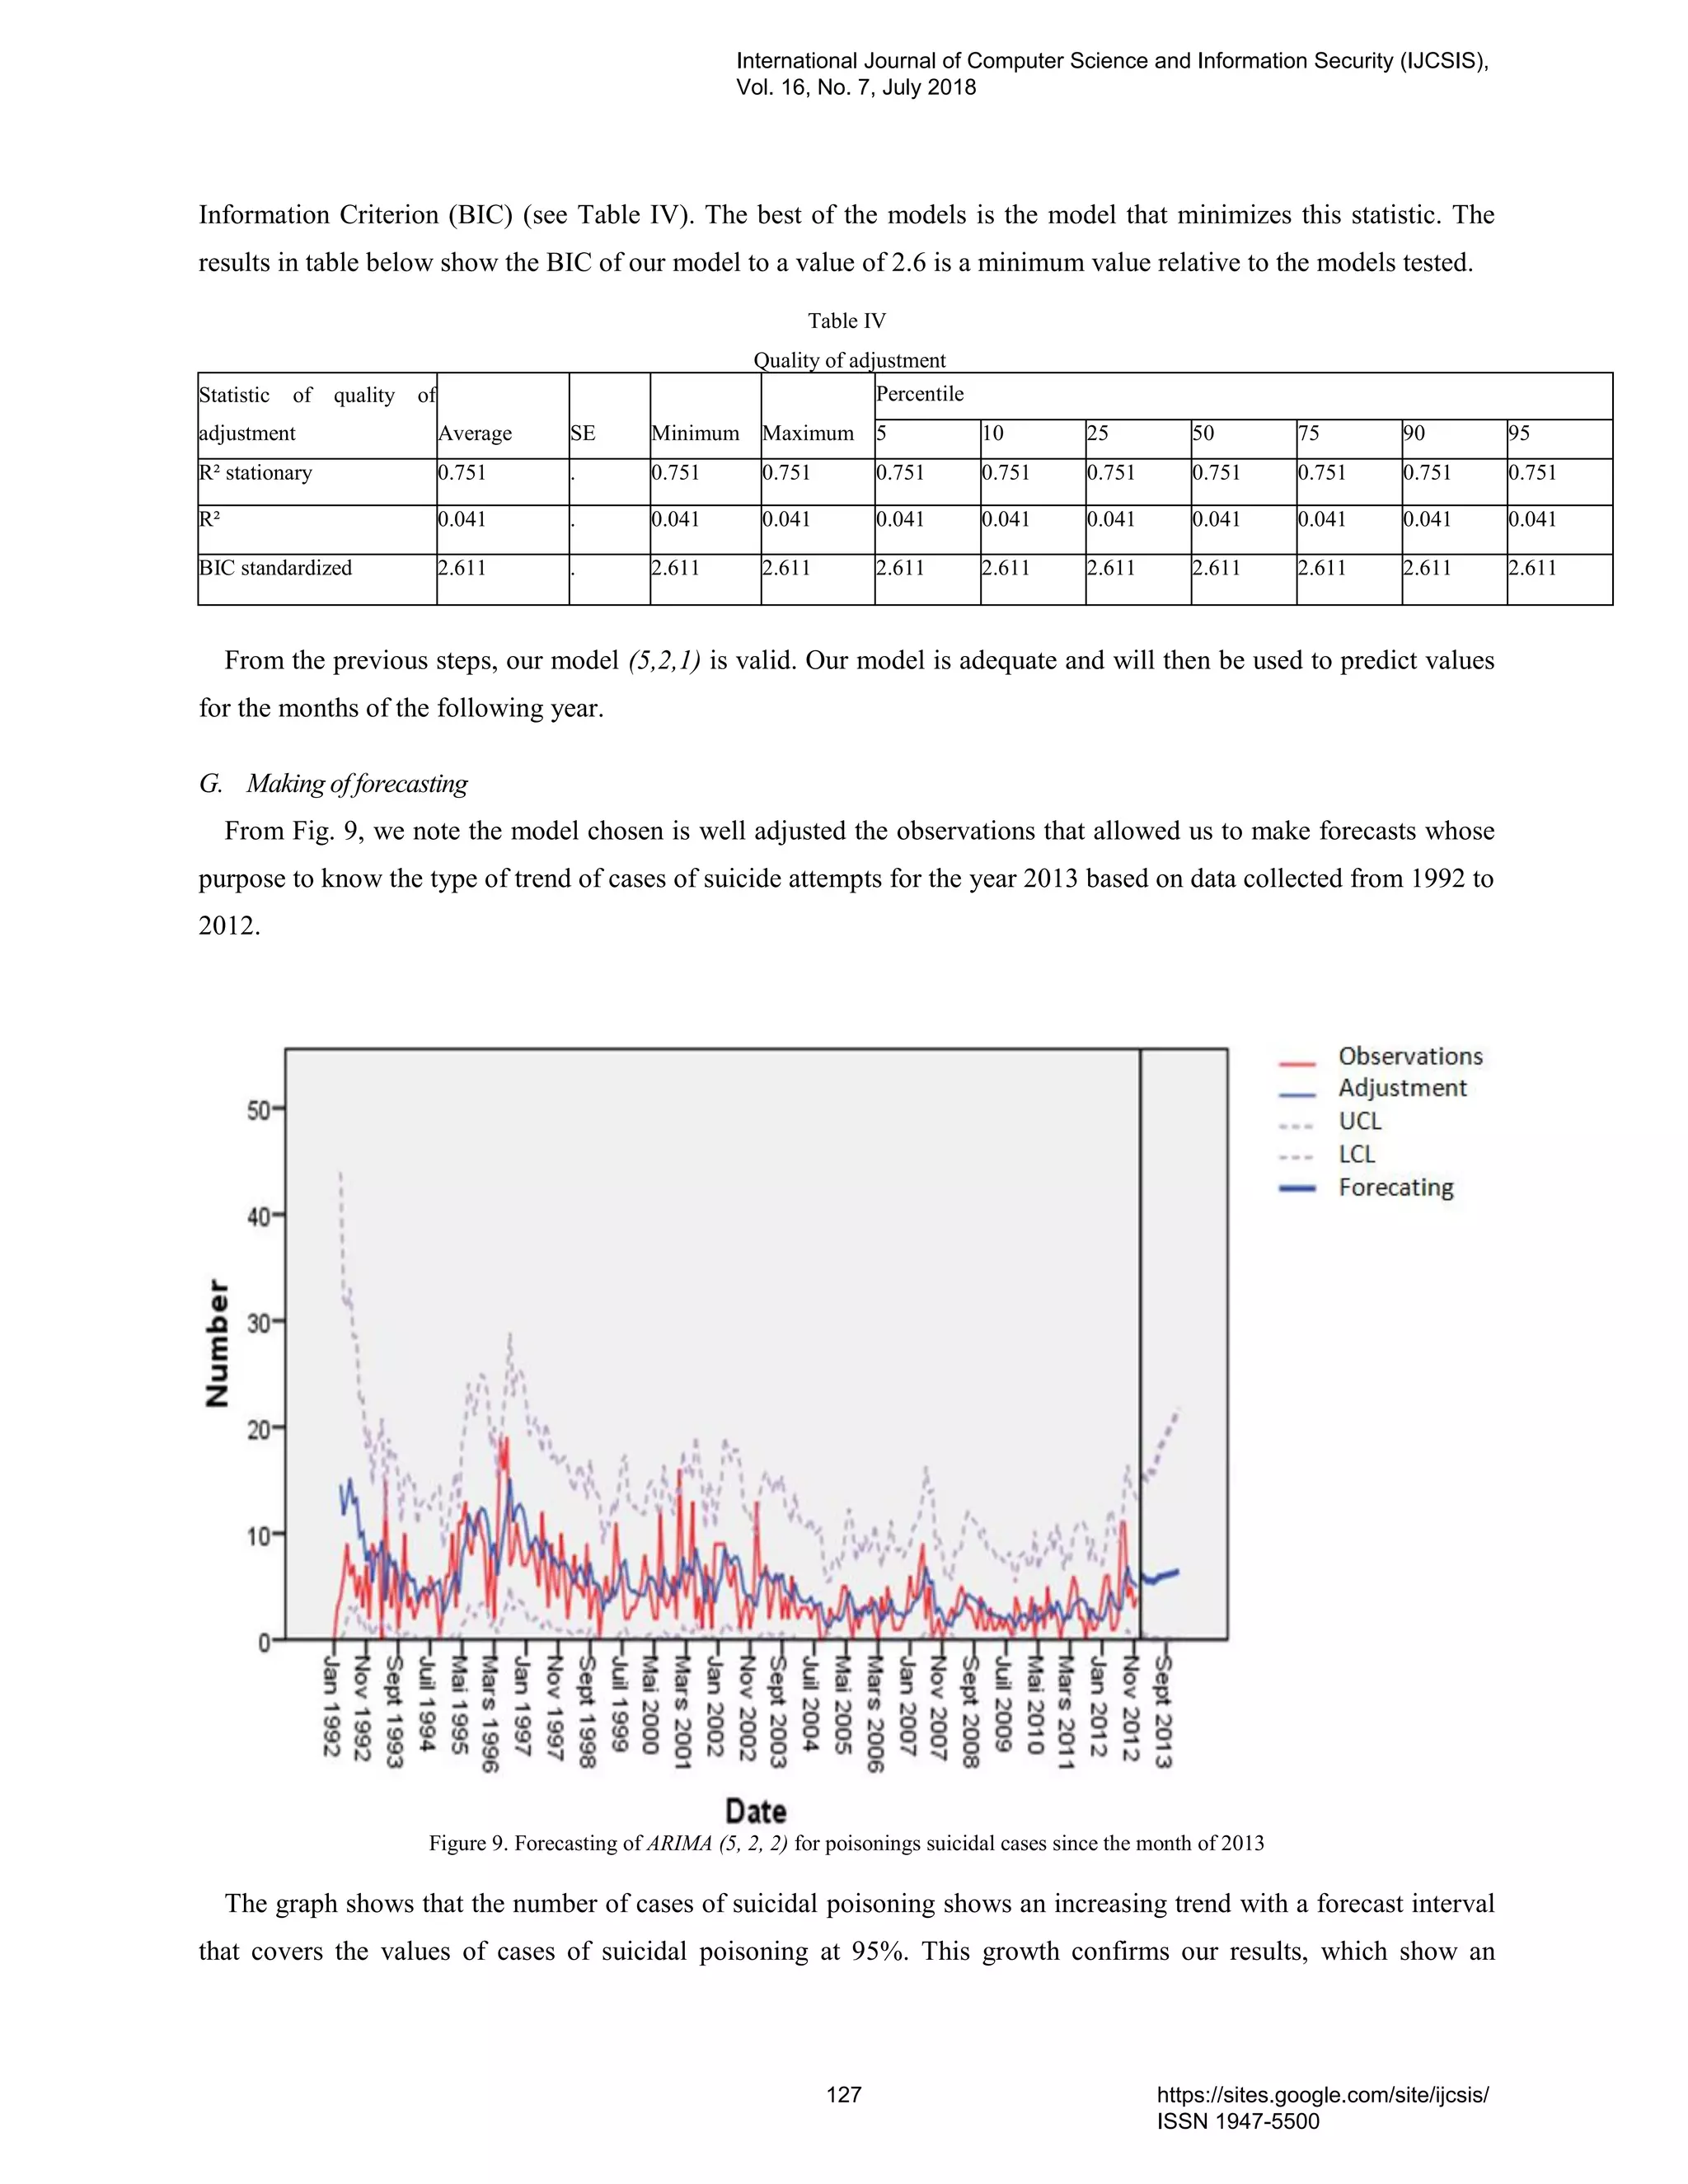
![increase in cases of suicide attempts through the use of other toxic products (drugs, pesticides and agricultural
products, etc.) after the ban on the sale of PPD.
VI. CONCLUSION
The results of the predictions showed that the growth of the number of cases of suicidal poisoning in 2013 in our
region studied is far from negligible. These data are important to consider in public health, especially in the area of
mental health. The majority of cases of suicidal poisoning are preventable, and in many cases, preventive measures
are available. the databases are not always easy to grasp because the declarations are very numerous.
The development of forecasts could be carried out for each category of products, in order to better determine the
evolution of the use of each type of toxic product in suicides. The regulation and control of the sale of drugs,
pesticides and agricultural products is mandatory in order to limit the use of these products in suicides.
ACKNOWLEDGMENT
We would like to thank the PCCM for its longstanding and cooperation.
REFERENCES
[1] B. P.J. Brockwell, and R.A. Davis, Time Series: Theory and Method. New York: Springer-Verlag, 1991.
[2] S. Kernbaum, Dictionnaire de médecine Flammarion. Flammarion Médecine-Sciences, Paris : 5th edition, 1994
[3] G.E.P. Box and G.M. Jenkins. “Time Series Analysis: forecasting and control,” . Holden-Day (1976).
[4] N. Attazagharti, A. Soulaymani, D. Benali, A. Mokhtari, BR. Soulaymani. “Poisoning à la paraphénylène diamine au Maroc et facteurs de
risque influençant l’évolution des patients, ”. Médecine du Maghreb, vol. 187, pp: 13-20, 2011
[5] J. Emsley. “The Elements of Murder: A History of Poison,“ Oxford University Press, “ New York, may 2005
[6] M. Kaicer and al, ‘’ Vital Prognosis of Intoxicated Patients, Modeling by SVM, Evidence from Souss-Massa Daraa- Morocco,’’ Procedia
Computer Science, Vol. 127, pp:154-160, 2018
[7] S. Mahir, A. Soulaymani , H. Hami , A. Mokhtari, D. Benali, BR. Soulaymani, “Les caractéristiques épidémiologiques des poisonings dans
la région de Souss-Massa-Drâa au Maroc, “ Research fr, pp :1:619, 2014
[8] S. Mahir, A. Soulaymani , H. Hami , A. Mokhtari, D. Benali, BR. Soulaymani, L. Ouammi , M. Windy . “Les poisonings suicidaires dans la
région de souss-massa-draa au maroc, “ Sante Publique. Vol. 25(3), pp : 343-50 May-Jun.2013.
[9] S. Moutaouakkil, B. Charra, A. Hachimi, H. Ezzouine, H. Guedari, H. Nejmi, A. Benslama. ‘’Rhabdomyolyse et poisoning à la
paraphénylène-diamine,’’ Ann Fr Anesth Réanim. Vol ; 25, pp :708–713, 2006
[10] L. Ouammi, N. Rhalem, R. Aghandous, I. Semllali, M. Badri, G. Jalal, and al. ‘’Profil épidémiologique des poisonings au Maroc de 1980 à
2007,’’. Toxicologie Maroc. Vol. 1, pp : 8-13, 2009
[11] L. Ouammi. ‘’Mémoire sur l’élaboration d’une stratégie nationale de lute antitoxique basée sur l’épidémiologie des poisonings au Maroc,’’.
Mémoire, Centre anti poison et de pharmacovigilance du Maroc 2009
[12] M. Peden, K. Oyegbite, J.O. Smith, A. Hyder, C. Branche, A.K.M. Rahman, ‘’ Rapport mondial sur la prévention des traumatismes chez
l’enfant,’’. WHO, Geneve: 2008
[13] C. Taft and all. (Washington, DC, 2002). Childhood unintentional injury worldwide: meeting the challenge. Avaible:
http://www.safekids.org/pdf/WW-Study-Ltr.pdf, consulté le 6 avril 2008).
[14] H. Yagi, A.M. El Hendi, ‘’Acute poisoning from hair dye,’’ East Afr Med J. pp: 68:404, 1991;
[15] S. Mahir, ‘’ Facteur Risk factor, forecasting and modeling of poisoning in Souss Massa Daraa area,’’ M.S thesis, Dept ; Bio., Ibn tofail
university, Kenitra, Morroco, 2015.
[16] World Health Ogranization: http://www.who.int/
[17] the Anti Poison Center and Pharmacovigilance Morocco: http://www.capm.ma/
International Journal of Computer Science and Information Security (IJCSIS),
Vol. 16, No. 7, July 2018
128 https://sites.google.com/site/ijcsis/
ISSN 1947-5500](https://image.slidesharecdn.com/journalofcomputerscienceijcsisjuly2018fullvolume-180915043348/75/Journal-of-computer-science-ijcsis-july-2018-full-volume-142-2048.jpg)
![A New Communication Architecture Model for
Smart Grid
Zahid Soufiane, Institut National des Postes et Télécommunications, Morocco
zahidsoufiane@gmail.com
En-Nouaary Abdeslam, Institut National des Postes et Télécommunications, Morocco
abdeslam@inpt.ac.ma
BAH Slimane, Ecole Mohammadia d'Ingénieurs, Morocco
slimane.bah@emi.ac.ma
Abstract-Nowadays, the power grid infrastructure becomes more intelligent by using advanced information and
communication technologies (ICT). The Smart Grid, which is the new generation power grid, requires a scalable,
sophisticated, reliable and fast communication infrastructure. Countries around the world are dealing with the problem of
finding the most appropriate architecture that can satisfy their future communication needs. This article focuses on the
Smart Grid communication architecture. We describe the conceptual models proposed by international organizations:
NIST (National Institute for Standards and Technology), IEEE and ITU. A simulation study is performed to understand
the requirements and limitations of these models. Then, we present a new model based on these international roadmaps
and guides, with the possible communication technologies that can be used to interconnect the components and standards
for each section. This model fulfills the six functionalities that Smart Grid network must achieve. Finally, we give attention
to the customer side or the Home Area Network.
Keywords: Smart Grid; Communication infrastructure; SG services; HAN
I. INTRODUCTION
Smart Grid is a vision, a collection of technologies and services, and a series of projects to upgrade our current
electrical system, using two-way communication technologies and computer processing. The main role of a Smart
Grid is to perform continuous self assessments to monitor and analyze its interconnected elements, and to predict
potential failures and future outages. It is composed of a large number of heterogeneous entities which forms a whole
system hard to predict and hard to describe. For this reason, Smart Grid is classified as a complex system [1].
On the other hand, Smart Grid requires a flexible and efficient framework to ensure the collection of real-time and
accurate information from various locations in power grid to provide continuous and reliable operation. Most of the
technologies required to create a Smart Grid are available today, and many utility companies are also implementing
Smart Grid in their countries (e.g. US, China, India, Finland) [2]. However, in order to analyze this system of
systems, the network architecture must be defined. Many international organizations, such as NIST, ITU-T
(Telecommunication Standardization Sector) and IEEE, propose their own models. These models are conceptual and
can’t be used to grasp the relationship between the system components. They represent only guides and roadmaps to
understand the general operation of the system, and introduce basis to discuss the characteristics, uses, behavior,
interfaces, requirements, and standards of the Smart Grid. So, these models are only a tool to describe Smart Grid
architecture.
One of the most challenging aspects in Smart Grid is the communication and information network. The later has
not been clearly investigated. In this article we intend to propose our own Smart Grid architecture, based on the
international guides mentioned above. This architecture supports the six functionalities that Smart Grid must fulfill,
as described in the U.S. Department of Energy (DOE) [3]. This issue has been investigated by many researchers.
Aggarwal et al [4] modeled the communication bandwidth requirements for the distribution network in the future
International Journal of Computer Science and Information Security (IJCSIS),
Vol. 16, No. 7, July 2018
129 https://sites.google.com/site/ijcsis/
ISSN 1947-5500](https://image.slidesharecdn.com/journalofcomputerscienceijcsisjuly2018fullvolume-180915043348/75/Journal-of-computer-science-ijcsis-july-2018-full-volume-143-2048.jpg)
![grid using mathematical formulas. They focused on the advanced metering infrastructure (AMI) and proposed an IP-
based network to provide predictive information and suggestions to both customers and utilities. Nagesh et al [5]
studied also the AMI network, and especially the real time management system. They used the business intelligent
tools to study the distribution network and extend the study to the transmission network. They present the benefits of
this new architecture. Another work [6] presents a new architecture security model for Smart Grid communication
network. This architecture incorporates three services among the six Smart Grid functionalities, namely, the
Advanced Metering Infrastructure (AMI), the Demand Response and the Distributed Energy Resources (DER).
Authors identified the security requirements for this group and proposed a model that fulfills these requirements and
focused on the communication aspect.
Unlike the aforementioned contributions, we defined an architecture that takes into account all the six services. We
aim mainly to identify the requirements and limitations for communication architecture to get an efficient topology
from the customer side to the utility. And we explain the functioning of essential components of a robust
architecture. We divide the analysis into three parts depending on the network studied: Home Area Network (HAN),
Neighborhood Area Network (NAN) or Wide Area Network (WAN). Once the architecture is detailed and the
interaction between its components is explained, we propose, for each communication interface, the possible
technologies and standards that we can use for these links.
This article is structured as follows. The next section provides a brief review of the Smart Grid history and the
international models proposed by NIST, ITU and IEEE. Moreover, it introduces the six services and details the
architecture's three parts of our analysis. Then we identify the communication requirements of a simple architecture
model between the customer side and the utility. The section after, describes our new model architecture based on
the international guides and roadmaps, the interfaces between sections and the communication standards and
technologies used in the interconnection. In the fifth section, we give attention to customer side which is the HAN
network. We detail its interfaces and communication network, before concluding.
II. BACKGROUND
The first official definition of smart grid has been published in the Energy Independence and Security Act of 2007
[7]. This act aimed to move the United States toward greater energy independence and security, by increasing the
utilization of renewable energy sources, the development of smart technologies including appliances, devices and
vehicles, and the development of standards for communication and interoperability of appliances and equipment
connected to the grid [7]. Many international organizations have integrated the movement and presented their own
models. In this section, we present the well-known international models, the services or functionalities that Smart
Grid architecture must fulfill, and the sections of this architecture.
A. International architecture models
In order to establish a standard and develop recommendations for the Smart Grid from the communication
technologies perspective, the international organizations of standardization have proposed their own models. We
discuss here three of the famous models.
The Smart Grid is comprised of many networks (domains) that have to be interconnected to provide end-to-end
services. The challenge is to design network architectures that can meet the interoperability requirements for inter-
International Journal of Computer Science and Information Security (IJCSIS),
Vol. 16, No. 7, July 2018
130 https://sites.google.com/site/ijcsis/
ISSN 1947-5500](https://image.slidesharecdn.com/journalofcomputerscienceijcsisjuly2018fullvolume-180915043348/75/Journal-of-computer-science-ijcsis-july-2018-full-volume-144-2048.jpg)
![domain and intra-domain communications. One of the first and well known models is the NIST conceptual mode [8].
It developed a framework that includes protocols and standards for information management to achieve
interoperability of Smart Grid devices and systems. This model is composed of seven domains, as shown in Fig.1.
These four domains in the lower layer (bulk generation, transmission, distribution and customer) are related to
electrical power system. The three remained domains (the market, operations, and service providers) are related to
the regulatory operation. Each domain embodies the Smart Grid actors and applications. Actors include devices,
systems, or software programs that make decisions and exchange information, with other actors, necessary for
performing applications. On the other hand, applications are tasks performed by actors within a domain [8]. This
model provides a foundation for utilities in the development of their particular Smart Grid architectures and to serve
as a guide for implementing specific features designed to make their electric grid smarter. It defines the potential
communication and information flow and the interconnection between domains. So, this is a descriptive model that
does not define any solution for the implementation purpose, but it can be used only to understand the functioning of
Smart Grid.
Figure 1. Conceptual Reference Diagram for Smart Grid [8]
Explicit efforts have been made to adopt the terminology used by NIST to ensure a consistent architectural
framework for the Smart Grid. IEEE Std 2030 SGIRM (Smart Grid Interoperability Reference Model) provides
alternative approaches and best practices for achieving Smart Grid interoperability [9]. It is a conceptual
International Journal of Computer Science and Information Security (IJCSIS),
Vol. 16, No. 7, July 2018
131 https://sites.google.com/site/ijcsis/
ISSN 1947-5500](https://image.slidesharecdn.com/journalofcomputerscienceijcsisjuly2018fullvolume-180915043348/75/Journal-of-computer-science-ijcsis-july-2018-full-volume-145-2048.jpg)
![representation of the Smart Grid architecture from three perspectives: 1) power systems; 2) communications; and 3)
information technology. This model aims to provide organizations with standards-based architectural direction to
achieve Smart Grid interoperability, and the ability to communicate effectively and transfer meaningful data, even
though they may be using a variety of different information systems over widely different communication
infrastructures. It is composed of many domains. Within each domain or between different domains, the entities are
connected to each other through one or more interfaces. The number of interfaces connecting one or more entities
represents the available, future and most relevant interconnection alternatives. However, it is not meant to give all
details required for the designer of new architectures, it provides only generic and standard framework elements and
view of domains and how they are connected to each other, with coded entities and interfaces that can be detailed
and refined for particular needs by each organization.
The third model we discuss is the ITU-T model [10, 11]. This is another conceptual model, which is a simplified
reference model derived from the NIST one. It reduces the number of domains from seven to five as shown in Fig. 2,
and defines five external interfaces between various domains, that should be the focal point of standardization
efforts, named: reference points. However, this model can be used only as roadmap for Smart Grid implementation.
Also, the choice of what type of network is needed to support a particular Smart Grid function shall be driven by the
requirements of that function.
Figure 2. Simplified reference architecture for Smart Grid [10]
International Journal of Computer Science and Information Security (IJCSIS),
Vol. 16, No. 7, July 2018
132 https://sites.google.com/site/ijcsis/
ISSN 1947-5500](https://image.slidesharecdn.com/journalofcomputerscienceijcsisjuly2018fullvolume-180915043348/75/Journal-of-computer-science-ijcsis-july-2018-full-volume-146-2048.jpg)
![B. Smart Grid services and sections
In 2010, the U.S Department of Energy published a report on the communications requirements of electric utilities
and proposes specific recommendations for next steps to support these requirements [3]. This report is built upon
Federal Energy Regulatory Commission (FERC) work, completed by NIST. It identified six key priority
functionalities of the Smart Grid as follow: AMI, DR, EV (Electric Vehicles), DER, WASA (Wide-Area Situational
Awareness), and DA (Distribution Automation).
Based on communication requirements (data rate, coverage range...), the Smart Grid architecture can be divided
into three sub-networks, which we will detail later: HAN, NAN, and WAN. Each network supports different
functionalities as shown in Table I.
TABLE 1. SMART GRID FUNCTIONALITIES BY NETWORK
AMI DR DER EV DA WASA
HAN X X X X
NAN X X X X X
WAN X X X X X X
III. ANALYSIS OF SMART GRID REQUIREMENTS
In this section, we study a simple Smart Grid architecture named the last mile. This is a part of the network that
connects the customer side or HAN to utility network. The goal of this study is to show the limitations of
communication network in Smart Grid, and that this network needs a more attention. The architecture is shown in
Fig. 3. Each customer has an Energy Services Interface (ESI), also known as HAN gateway through which a
customer's HAN communicates with the utility. This device sends data to concentrators or Data Aggregation Points
(DAP) via multiple nodes associated to feeders and then the aggregated information is sent to the Substation via a
backbone network. We basically consider a linear communication chain that is a radial multi-hop topology formed
by nodes in top of feeders. The first node is the one that receive that receive traffic from ESI, and the last one is the
DAP. Distance between poles varies by country and grid architecture. We choose an average of 100 meters in our
example. So, nodes are separated by a constant inter-node distance of 100m. We can use either the wired or wireless
technologies. However, the implementation of wireless technologies offers many advantages over wired ones, e.g.
low installation cost, mobility, rapid installation, etc. So, we choose WiFi as an example. Data traffic in the feeder
network can be estimated by a few hundred kilobytes. Nodes transmit data continuously and in regular intervals.
Since data is sampled periodically, Continuous Bit Rate (CBR) traffic is assumed in our model to simulate the traffic
in the network. For simulation we have used NS-2 (Network Simulator-2 version 2.34) under fedora 14. The routing
protocol is AODV; it is the best choice for ad-hoc network and performs better than other reactive and proactive
protocols [12, 13]. We define two metrics to measure the performance of our chain:
1) Packet Delivery Fraction: defined as the number of packets successfully received by a receiver over the
expected number of packets. The Smart Grid network comprises millions and even billions of devices. The generated
traffic is high, and then the transmission of lost packets once again will generate an additional traffic. This parameter
is used to show the ability of the network to send data without loss.
2) Average End-to-end Delay: defined as the average time taken for packets to be transmitted from the sending
application to the receiving application. This metric measures the network ability to send packets in a real-time or
International Journal of Computer Science and Information Security (IJCSIS),
Vol. 16, No. 7, July 2018
133 https://sites.google.com/site/ijcsis/
ISSN 1947-5500](https://image.slidesharecdn.com/journalofcomputerscienceijcsisjuly2018fullvolume-180915043348/75/Journal-of-computer-science-ijcsis-july-2018-full-volume-147-2048.jpg)
![near-real-time manner depending on the NAN application. In this article, we will not discuss the requirement latency
for NAN functions. We will only try to minimize as much as possible the value of this metric.
Figure 3. NAN communication architecture
In the first three scenarios, we suppose that only the first node generates the traffic and the DAP is the sink. Other
nodes just route data from the source to the destination.
A. Scenario 1
In our first scenario, we fixed the length of the radial chain to 10 km, which is the maximum communication range
requirement for Smart Grid NAN network [14]. We varied data rate from a low value to 1 Mbps. Results are shown
in Fig. 4. We can see that when the data rate is less than 0.2 Mbps, the packet delivery fraction is approximately
100%. However, when data rate exceeds this value the packet delivery fraction would decrease from 100% to a value
less than 20%. The average end-to-end delay also increases significantly after 0.2 Mbps. The exact value from which
the fraction of packets received successfully decrease from 100% and the average delay increases is 0.12 Mbps.
From these results we can conclude that the optimum value for communication data rate for a length chain of 10 km
to achieve a good performance is 0.12 Mbps.
Figure 4. Results for different data rate
International Journal of Computer Science and Information Security (IJCSIS),
Vol. 16, No. 7, July 2018
134 https://sites.google.com/site/ijcsis/
ISSN 1947-5500](https://image.slidesharecdn.com/journalofcomputerscienceijcsisjuly2018fullvolume-180915043348/75/Journal-of-computer-science-ijcsis-july-2018-full-volume-148-2048.jpg)
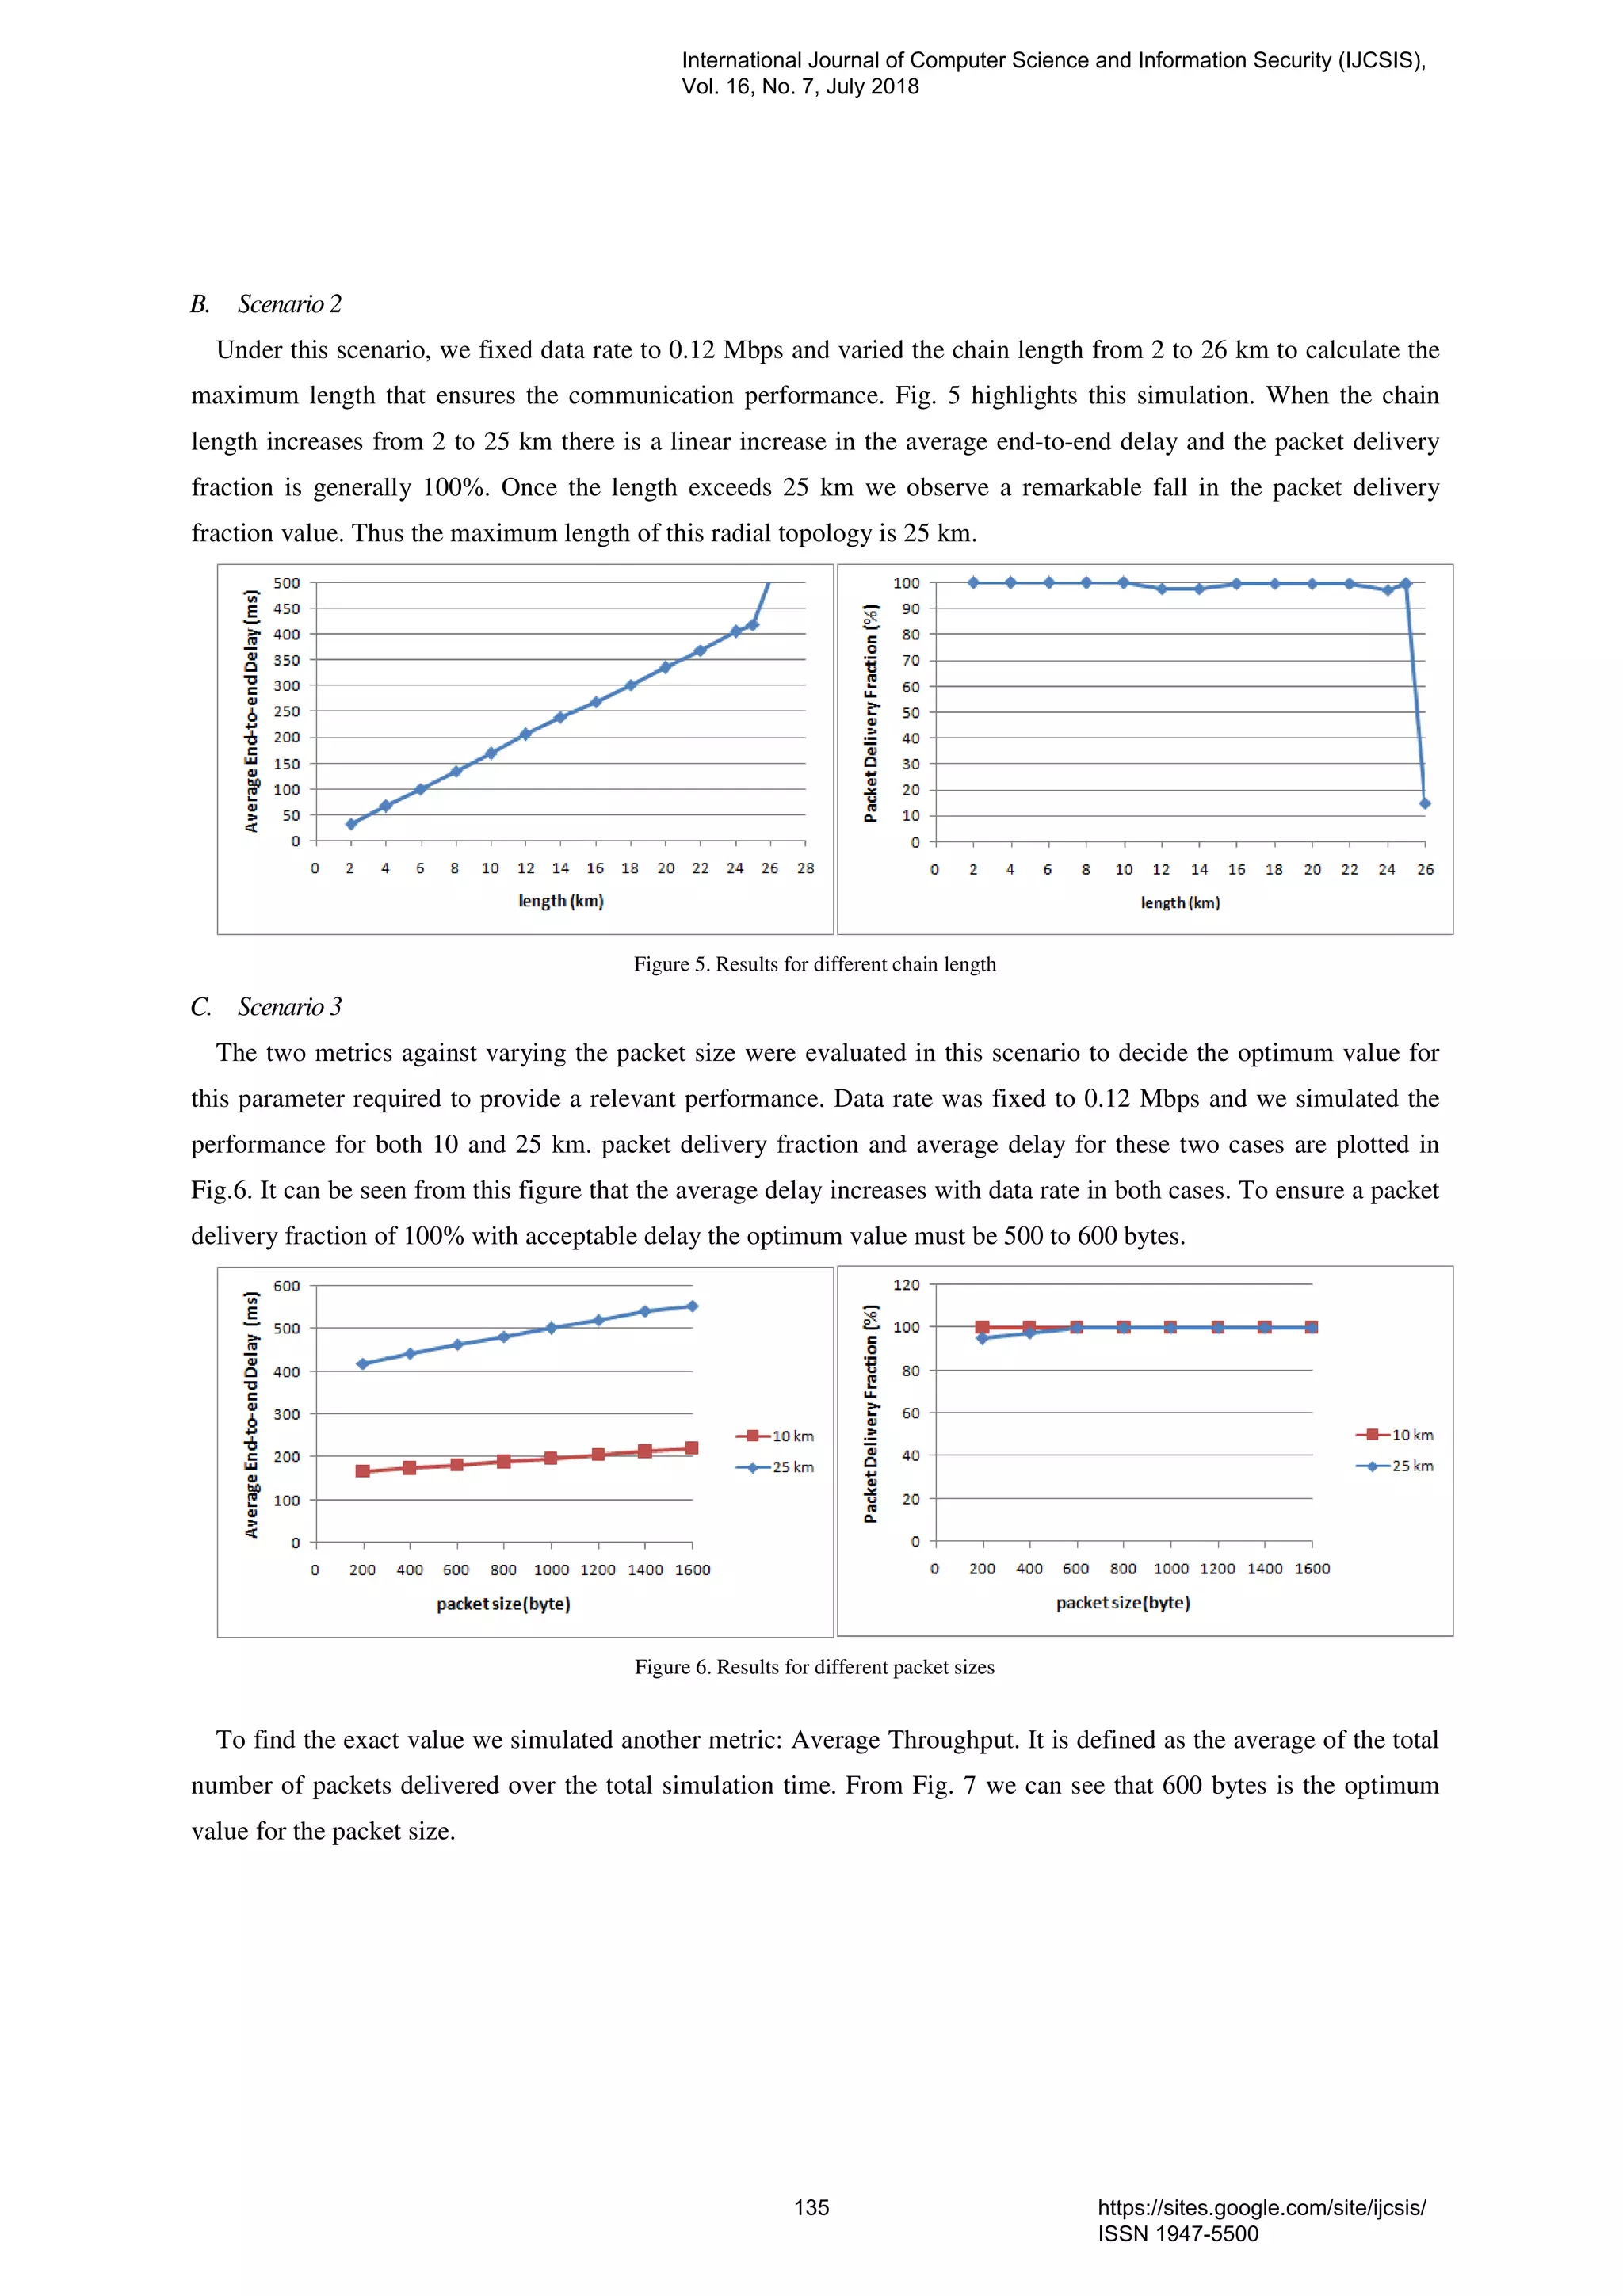
![Figure 7. Average Throughput vs packet size
D. Scenario 4
In the previous simulations we assumed that only the first node sends data which is an ideal scenario. If all nodes
send packets to the sink node we would see performance degradation (Fig. 8). The packet delivery fraction decrease
from 100% (one node sends data in 25 km) to 2.44% (all nodes send data in 25 km) and 6.25% (all nodes send data
in 10 km). Nodes cannot transmit together without packet collisions. The network model suffers from other
problems. However, finding solutions for these problems is out the scope of this article.
Figure 8. Real scenario vs ideal scenario
To summarize, when data rate exceeds 0.12 Mbps, the queuing and transmission operations take more time than
the small data rate value (less than 0.12 Mbps). So, the delay and packet loss augment due to collision. The 25 km
limitation is related to the route discovery which is an obstacle in multi-hop network. It takes longer time to complete
as the number of hops increases. However, this length can be increased by using a multi-tier multi-hop architecture
[15]. The idea of this architecture is to divide a very long chain-topology network into several shorter segments and
each segment is connected to neighboring segments using a longer-distance communication approach, such as
WiMAX, to greatly reduce the number of hops required for route discovery and data forwarding. For the packet size,
the optimum value is 600 bytes. It minimizes the delay and avoids congestion in the network by avoiding
fragmentation. We presented here a simple architecture for the last mile, with an ideal communication network.
International Journal of Computer Science and Information Security (IJCSIS),
Vol. 16, No. 7, July 2018
136 https://sites.google.com/site/ijcsis/
ISSN 1947-5500](https://image.slidesharecdn.com/journalofcomputerscienceijcsisjuly2018fullvolume-180915043348/75/Journal-of-computer-science-ijcsis-july-2018-full-volume-150-2048.jpg)

![The traffic sent by Smart Meters is concentrated at Data Collection Unit (DCU) on the border between HAN and
NAN. This equipment transmits the metering data receiving from a set of Smart Meters to equipment named Head
End System (HES). This later is a central data collection point for AMI network [16]. It receives data several times a
day (e.g., 4–6 times per residential meter per day or 12–24 times per commercial/industrial meter per day). Another
main system in the NAN is the Meter/Load Controller [17]. It routes messages (commands, requests) between the
WAN and customer side, and it is designed to perform demand response service.
The last part of Smart Grid architecture is the WAN. It is a robust network with many systems and components
interconnected to each other forming a complex architecture. It covers vast zone from NAN to control center, and
provides communication between the electric utility and substations. It also supports real-time monitoring, control
and protection applications, which help detecting problems in real-time and diagnose the network state to prevent
cascading outages. Here, we describe the most important and mandatory systems for the Smart Grid.
The first system we present is Meter Data Management System (MDMS). This is the main system in WAN. It acts
as a database system for storing and analyzing metering data. In fact, it collects raw data sent by HES, via two-way
communication network, stores and processes it before making it available to other applications [10]. Moreover, it
has other capabilities such as managing all kinds of meters (electric, gas, heat), transmitting other type of data than
tariff and turn electricity on/off, etc. This system is directly affects some critical applications such as DR, outage
management and dynamic pricing that need information provided by MDMS. It is interconnected with the
Distribution Management System (DMS), responsible for monitoring, controlling and optimizing the distribution
system performance as an attempt to manage its complexity [18]. The ultimate goal of a DMS is to enable a smart,
self-healing distribution system and to provide improvements in supply reliability and quality, efficiency and
effectiveness of system operation. It is one of the most important systems in the power industry, and it was qualified
as the actual brain of future distribution grids [19], because DMS leads to better asset management, the provision of
new services and greater customer satisfaction. Nowadays, DMS systems are based on existing Supervisory Control
And Data Acquisition (SCADA) system. This last is the core system in the DA service. Indeed, DA can be defined as
the use of SCADA for the remote monitoring and control of the distribution network [20]. Its basic functions include
data acquisition, remote control, historical data analysis and report writing. But generally it is used for remote
manipulation to allow dispatchers to see the system failures and make remote changes easier. To achieve these goals,
it coordinates with other systems, i.e., SCADA/Automatic Generation Control (AGC), EMS, DMS and Distribution
Automation System (DAS) [20]. We can classify the DAS system role into three groups: for the substation
automation, feeder automation and customer automation. So, it provides utilities with the capability to monitor
distribution equipments remotely, gather information from a widespread network of equipments and sensors, and,
then, take appropriate control actions, even automatically or with human supervision [21]. For the EMS system, it
manages the energy generation and storage from different sources (wind, solar…).
On the other hand, the service DR is managed by two essential systems. The first is the DR Manager that generates
the DR messages (commands, requests) to be transferred to the meters/load controllers [17]. And the second one is
Demand Response Management System (DRMS). This is the utility system managing the DR capabilities from the
International Journal of Computer Science and Information Security (IJCSIS),
Vol. 16, No. 7, July 2018
138 https://sites.google.com/site/ijcsis/
ISSN 1947-5500](https://image.slidesharecdn.com/journalofcomputerscienceijcsisjuly2018fullvolume-180915043348/75/Journal-of-computer-science-ijcsis-july-2018-full-volume-152-2048.jpg)
![utility down to the consumer. The DRMS also interfaces and operates with other utility operational and information
systems, such as DMS, Outage Management System (OMS), and Customer Information System (CIS) [22].
Until now, we discussed five among the six services. The remainder service, WASA, aims at providing system
data in real-time from a group of Intelligent Electronic Devices (IEDs) and Phasor Measurement Units (PMUs), and
then passes to the decision-making process (Perception, Comprehension, Projection) [23]. IEDs transmit snapshots
of device status and measurement data to SCADA over a WAN communication. PMUs, on the other hand, enable
time-synchronized snapshots of a power network including voltage and current phase angles. The data generated by
the PMU/IED sensors is sent, via a Phasor Data Concentrator (PDC), to the Central Equipment (CE)/ Wide-Area
Measurement Systems (WAMS). This information, measured over a wide area, is used to create a countermeasure
which is the control scenario to be used when the instability phenomenon occurs as expected from simulation of
severe power system faults and sends it to the IED.
In addition to systems above, the architecture is composed of other systems, specifically; OMS, CIS and billing
system. The OMS identify, diagnose and locate faults, then isolate the problems and restore supply. It notifies
customers affected by the faults, analyses the event and maintains historical records of the outage as well as
calculating statistical indices of interruptions. The CIS maintains databases of customers’ names, addresses, and
network connection. And the billing system preserves all necessary information about the billing process.
B. Communication technologies
Once the architecture is defined, we resume the communication technologies for the majority of the linked
interfaces between its components. Many technologies to be adopted by Smart Grid have already been used in other
industrial applications, such as sensor networks in manufacturing and wireless networks in telecommunications, and
are being adapted for use in new intelligent and interconnected paradigm. In fact, technical standards underpinning
the Smart Grid are being developed by several Standard Development Organizations (SDOs) such as the American
National Standards Institute (ANSI), The International Electrotechnical Commission (IEC), IEEE, the International
Organization for Standardization (ISO), and ITU organizations. Also, Independent Organizations (e.g. NIST) and
Alliances (e.g. ZigBee alliance) proposed their solutions for Smart Grid [24-26]. Since all the standards need to work
together to support an overall system, coordination of efforts by these organizations is critically important.
Our architecture is presented in Fig.9. It indicates the components and the communication interfaces between
them. The Energy Market is considered as an external component, so we will not take it into account in this article.
TABLE II resumes the technologies and standards for each communication interface between two components based
on the networks requirements in terms of transmission range, scalability, latency. We indicate the Smart Grid
components involved, the technologies used and the underlying standards/ recommendations. For instance, the
interface C1 concerns the communication between appliances and IHD. This interface is used by customers to
control their HAN devices through protocols such as ZigBee, PLC or other short range protocols. Another interface
related to IHD is C3, which is used to transmit information regarding customer energy consumption to the smart
meter and then all the way to the utility via the AMI network. However, the interface C16, between the ESI and the
meter/load controller, is used, as mentioned above, to route HAN information to utility through a TCP/IP network.
International Journal of Computer Science and Information Security (IJCSIS),
Vol. 16, No. 7, July 2018
139 https://sites.google.com/site/ijcsis/
ISSN 1947-5500](https://image.slidesharecdn.com/journalofcomputerscienceijcsisjuly2018fullvolume-180915043348/75/Journal-of-computer-science-ijcsis-july-2018-full-volume-153-2048.jpg)
![Figure 9. Our Smart Grid Architecture
Other examples are given in the table. We cite the well-used standards for each section, but other standards may be
added. The communication with the energy market is out the scope of this article. In HAN network, we can use a
hybrid mix of technologies like TCP/IP technologies, ZigBee, PLC (Power Line Communication), RS232C [27] and
others. Generally, the choice between these technologies depends either on the constraints imposed by the utilities
network (according to each country), or, in case this network supports more than one technology, the choice is up to
the user especially for the appliances and EV. While NAN is responsible for transferring data from HANs to WAN,
it is connected through a multiple of Wireless or wired technologies like PLC, TCP/IP etc. However; the NAN can
be developed with the use of small range coverage network technologies, especially in the last mile network, as we
showed before in the third section. On the other hand, WAN can be developed using one or many technologies
including wired and/or wireless technologies like fiber optics, WIMAX, cellular (GPRS/UMTS/LTE), ICCP [28]
(Inter Control Center Protocol), ModBus [29], DNP [30] (Distributed Network Protocol), MMS [31] (Manufacturing
Message Specification).
TABLE II: Communication TECHNOLOGIES AND STANDARDS FOR SMART GRID ARCHITECTURE
Interfaces 1st component 2nd component Technologies Standard
C1 Appliance IHD PLC, ZigBee, TCP/IP IEC61968-9, C12.19, TCP/IP
C2 Appliance Smart Meter PLC, ZigBee, TCP/IP IEC61968-9, C12.19, TCP/IP
C3 IHD Smart Meter PLC, ZigBee, TCP/IP IEC61968-9, C12.19, TCP/IP
C4 IHD ESI PLC, ZigBee, TCP/IP IEC61968-9, C12.19, TCP/IP
C5 Customer EMS Smart Meter PLC, ZigBee IEC61968-9, C12.19
C6 Customer EMS Customer Storage RS232C IEC 61850 -7-420
C7 Customer EMS Customer DER RS232C IEC 61850 -7-420
C8 Smart Meter ESI PLC, ZigBee IEC61968-9, C12.19
C9 Smart Meter PEV PLC, ZigBee IEC 61851
C10 ESI PEV PLC, ZigBee IEC 61851
C11 ESI Customer EMS PLC, ZigBee IEC61968-9, C12.19
C12 Smart Meter DCU PLC, ZigBee IEC61968-9, C12.19
C13 HES DCU PLC, ZigBee, Binary CDMA IEC61968-9, C12.19
C14 ESI Billing System TCP/IP TCP/IP
International Journal of Computer Science and Information Security (IJCSIS),
Vol. 16, No. 7, July 2018
140 https://sites.google.com/site/ijcsis/
ISSN 1947-5500](https://image.slidesharecdn.com/journalofcomputerscienceijcsisjuly2018fullvolume-180915043348/75/Journal-of-computer-science-ijcsis-july-2018-full-volume-154-2048.jpg)
![C15 ESI REP TCP/IP TCP/IP
C16 ESI Load Controller TCP/IP TCP/IP
C17 ESI DRE TCP/IP TCP/IP
C18 HES OMS PLC, ZigBee, Binary CDMA IEC61968-9, C12.19
C19 HES CIS PLC, ZigBee, Binary CDMA IEC61968-9, C12.19
C20 HES DRE PLC, ZigBee, Binary CDMA IEC61968-9, C12.19
C21 HES MDMS PLC, ZigBee, Binary CDMA IEC61968-9, C12.19
C22 HES DMS PLC, ZigBee, Binary CDMA IEC61968-9, C12.19
C23 CIS DRE PLC, ZigBee IEC61968-9, C12.19
C24 CIS MDMS PLC, ZigBee IEC61968-9, C12.19
C25 OMS DAS ICCP IEC 60870-6
C26 Billing System MDMS TCP/IP TCP/IP
C27 Billing System REP TCP/IP TCP/IP
C28 DRE SCADA/AGC ICCP IEC 60870-6
C29 DRE DMS TCP/IP TCP/IP
C30 DRE DR Manager TCP/IP OpenADR, TCP/IP
C31 DRE MDMS TCP/IP TCP/IP
C32 DMS MDMS TCP/IP TCP/IP
C33 DMS REP TCP/IP TCP/IP
C34 DMS SCADA/AGC ICCP IEC 60870-6
C35 DR Manager Load Controller TCP/IP OpenADR, TCP/IP
C36 Operator EMS SCADA/AGC MMS, DNP, ModBus IEC 61850
C37 Operator EMS Operator DER RS232C IEC 61850 -7-420
C38 Operator EMS Operator Storage RS232C IEC 61850 -7-420
C39 PMU/IED Operator DER TCP/IP IEC61850
C40 PMU/IED Operator Storage TCP/IP IEC61850
C41 PMU/IED PDC TCP/IP IEC61850-90-1, IEC61850-90-1, C37.118.2
C42 CE/WAMS PDC TCP/IP IEC61970
C43 CE/WAMS SCADA/AGC ICCP IEC61970
C44 DAS SCADA/AGC ICCP IEC61970
V. THE HOME AREA NETWORK
To understand the functioning of HAN network, we present here a use case diagram. Generally, this network is
related to three actors: the customer, the utility and the environment. Fig.10 represents this diagram. The
"generalization" relationship between the "control device" use case and the two use cases "control appliance" and
"control EV", show that a customer can control all devices inside the home. He can power on/off any appliances,
plug/unplug the EV and launch the charge process. While the Smart Grid is characterized by its two way power flow,
the actor can also define parameters to authorize the storage change (allowing the sale of energy) generated by the
environment (wind, solar...). The last actor is the utility. It can read the metering data from the Smart Meter, propose
an offer to buy energy and also control the devices in customer side.
In order to satisfy these customer needs, the HAN must meet the communication requirements of each component.
For example, in term of latency, some Smart Grid applications require real-time communication. They may not
tolerate any latency. For other applications, such as advanced metering infrastructure (AMI) or home energy
management (HEMS), latency is not critical. But in general, latency must not exceed a few seconds [14]. On the
other side, the communication nodes should always be reliable for the continuity of communications. Even though
some of applications can tolerate some outages in data transfer, reliability must be higher than 98% [14].
International Journal of Computer Science and Information Security (IJCSIS),
Vol. 16, No. 7, July 2018
141 https://sites.google.com/site/ijcsis/
ISSN 1947-5500](https://image.slidesharecdn.com/journalofcomputerscienceijcsisjuly2018fullvolume-180915043348/75/Journal-of-computer-science-ijcsis-july-2018-full-volume-155-2048.jpg)
![Figure 10. The use case diagram of the HAN
VI. CONCLUSION
Technologies involved in the Smart Grid communication represent a fundamental element in the growth and
performance of Smart Grid. A scalable, sophisticated, reliable and fast communication infrastructure is crucial in
both construction and operation of the network. In this article we introduced the international guides and roadmaps
for Smart Grid architecture. Then we identified the requirements and limitations of these conceptual models, in
particular the last mile network, through simulation scenarios. This led us to propose a new architecture model based
on the models above. This model takes into account the six functionalities that a Smart Grid must fulfill. We propose
a set of possible standard and technologies for the communication purpose. And finally, we give more attention to
the Home Area Network. In the next step, we aim at modeling this network and validating it using reachability
analysis and model checking methods; before we will trait the NAN and WAN.
REFERENCES
[1] D. Chavalarias et aI., "French roadmap for complex systems 2008-2009, " Mar. 2009. [Online]. Available: https://hal.archives-
ouvertes.fr/hal-00392486/en/ [Accessed July 14, 2018].
[2] M. Hashmi, "Survey of smart grid concepts worldwide", Julkaisija - Utgivare Publisher VTT Technical Research Centre Finland Tech. Rep.,
2011, ISBN 1459-7683
[3] "Communications requirements of Smart Grid technologies", pp. 1-69, 2010, [online] Available:
http://energy.gov/gc/downloads/communications-requirements-smart-grid-technologies [Accessed July 14, 2018].
[4] A. Aggarwal, S. Kunta, P. K. Verma, "A proposed communications infrastructure for the smart grid", Proc. Innovative Smart Grid
Technologies Conf., pp. 1-5, 2010.
[5] D.Y.R. Nagesh, J.V.V. Krishna, S.S. Tulasiram, "A real-time architecture for smart energy management", IEEE Innovative Smart Grid
Technologies (ISGT), 2010.
[6] H. Lim et al., "Security architecture model for smart grid communication systems", Proc. Int. Conf. IT Convergence Security (ICITCS), pp.
1-4, Dec. 2013.
[7] F. Sissine, Energy Independence and Security Act of 2007: A summary of major provisions, Dec. 2007.
International Journal of Computer Science and Information Security (IJCSIS),
Vol. 16, No. 7, July 2018
142 https://sites.google.com/site/ijcsis/
ISSN 1947-5500](https://image.slidesharecdn.com/journalofcomputerscienceijcsisjuly2018fullvolume-180915043348/75/Journal-of-computer-science-ijcsis-july-2018-full-volume-156-2048.jpg)
![[8] Framework, N. I. S. T. "Roadmap for smart grid interoperability standards. National Institute of Standards and Technology", January 2010
[online] Available: https://www.nist.gov/sites/default/files/documents/smartgrid/NIST_Framework_Release_2-0_corr.pdf. [Accessed July
14, 2018].
[9] IEEE Guide for Smart Grid Interoperability of Energy Technology and Information Technology Operation with the Electric Power System
(EPS), End-Use Applications, and Loads, IEEE Standard 2030-2011, Coordinating Committee 21, 2011
[10] G. M. Lee and D. Su. Standarization of smart grid in ITU-T. IEEE Communications Magazine, 51(1):90-97, january 2013.
[11] Editors (2011, December 18-21). "Smart Grid overview" deliverable. [Online]. Available: https://www.itu.int/en/ITU-
T/focusgroups/smart/Documents/smart-o-0034r4-overview-output.doc [Accessed July 14, 2018].
[12] R. Jain, N. B. Khaimar, and et al. Comparitive study of three mobile ad-hoc network routing protocols under different traffic source. In
Communication Systems and Network Technologies (CSNT20lJ), 2011.
[13] S. Shah et al., "Performance Evaluation of Ad Hoc Routing Protocols Using NS2 Simulation", Proceedings of the National Conference on
Mobile and Pervasive Computing (CoMPC-2008), August 2008.
[14] M. Kuzlu, M. Pipattanasomporn, S. Rahman, "Communication network requirements for major smart grid applications in HAN NAN and
WAN", Comput. Netw., vol. 67, pp. 74-88, Jul. 2014.
[15] P. Mahasukhon, H. Sharif, M. Hempel, T. Zhou, T. Ma, P. L. Shrestha, "Multi-tier Multi-hop Routing in Large-Scale Wireless Sensor
Networks for Real-time Monitoring," IEEE Sensors, 2010.
[16] Z. Popovic, V. Cackovic, "Advanced Metering Infrastructure in the context of Smart Grids", IEEE International Energy Conference
(ENERGYCON), pp. 1509-1514, May 2014.
[17] Salman Mohagheghi, James Stoupis, Zhenyuan Wang, Zhao Li, Hormoz Kazemzadeh, "Demand Response Architecture: Integration into the
Distribution Management System". First IEEE International Conference on SMART Grid Communications, 4-6 Oct, 2010.
[18] J. Ekanayake, N. Jenkins, K. Liyanage, J. Wu, A. Yokoyama, Smart Grid: Technology and Applications, New York:Wiley, 2012.
[19] S. Bruno, L. Silvia, R Giuseppe, S. Ugo, M. La Scala, "Unbalanced Three-Phase Optimal Power Flow for Smart Grids", IEEE Trans. Ind.
Electron., vol. 58, no. 10, pp. 4504-4513, Oct. 2011.
[20] Mini S. Thomas, Seema Arora, Vinay Kumar Chandna, "Distribution automation leading to a smarter grid", Innovative Smart Grid
Technologies-India (lSGT India) 2011 IEEE PES, 2011.
[21] S. Bavarian, L. Lampe, C. Siew, S. Lancashire, K. Adeleye, "Leveraging the smart metering infrastructure in distribution automation", 2012
IEEE Third International Conference on Smart Grid Communications, 2012.
[22] S. Borlease, Smart Grids: Infrastructure Technology and Solutions, Boca Raton, FL, USA:CRC Press, 2016.
[23] Panteli Mathaios, P. A. Crossley, Daniel S. Kirschen, "A multi-state model for assessing the impact of insufficient wide-area situational
awareness", pp. 81-81, 2012.
[24] D. Niyato, N. Kayastha, E. Hossain, Z. Han, "Smart grid sensor data collection communication networking: A tutorial", Wireless Commun.
Mobile Comput., vol. 14, no. 11, pp. 1055-1087, Aug. 2014.
[25] IEC Smart Grid Standardization Roadmap, Prepared by SMB Smart Grid Strategic Group (SG3); Edition 1.0, June 2010.
[26] "IEEE Standards Activities in the Smart Grid Space (ICT Focus)", IEEE Standards Association, [online] Available:
http://standards.ieee.org/develop/intl/msp/smartgrid.pdf [Accessed July 14, 2018].
[27] Bo Wang, "Frame Collision Model and Queueing Strategy of Multiple Callings Based on RS232C Protocol", Communications and Mobile
Computing 2009. CMC'09. WRI International Conference on., vol. 3, 2009.
[28] Kavya J. Mohan et al., "Self healing ICCP", Innovative Smart Grid Technologies-Asia (ISGT Asia) 2013 IEEE. IEEE, 2013
[29] Modbus, 1979, [Online]. Available: http://www.modbus.org/ [Accessed July 14, 2018].
[30] DNP, oct 2012 [Online]. Available: http://www.dnp.org/ [Accessed July 14, 2018].
[31] F.-Y. Wang, K. Gildea, H. Jungnitz, D. D. Chen, "Protocol design and performance analysis for manufacturing message specification: a Petri
net approach", IEEE Trans. Ind. Electron., vol. 41, no. 6, pp. 641-653, Nov./Dec. 1994.
International Journal of Computer Science and Information Security (IJCSIS),
Vol. 16, No. 7, July 2018
143 https://sites.google.com/site/ijcsis/
ISSN 1947-5500](https://image.slidesharecdn.com/journalofcomputerscienceijcsisjuly2018fullvolume-180915043348/75/Journal-of-computer-science-ijcsis-july-2018-full-volume-157-2048.jpg)
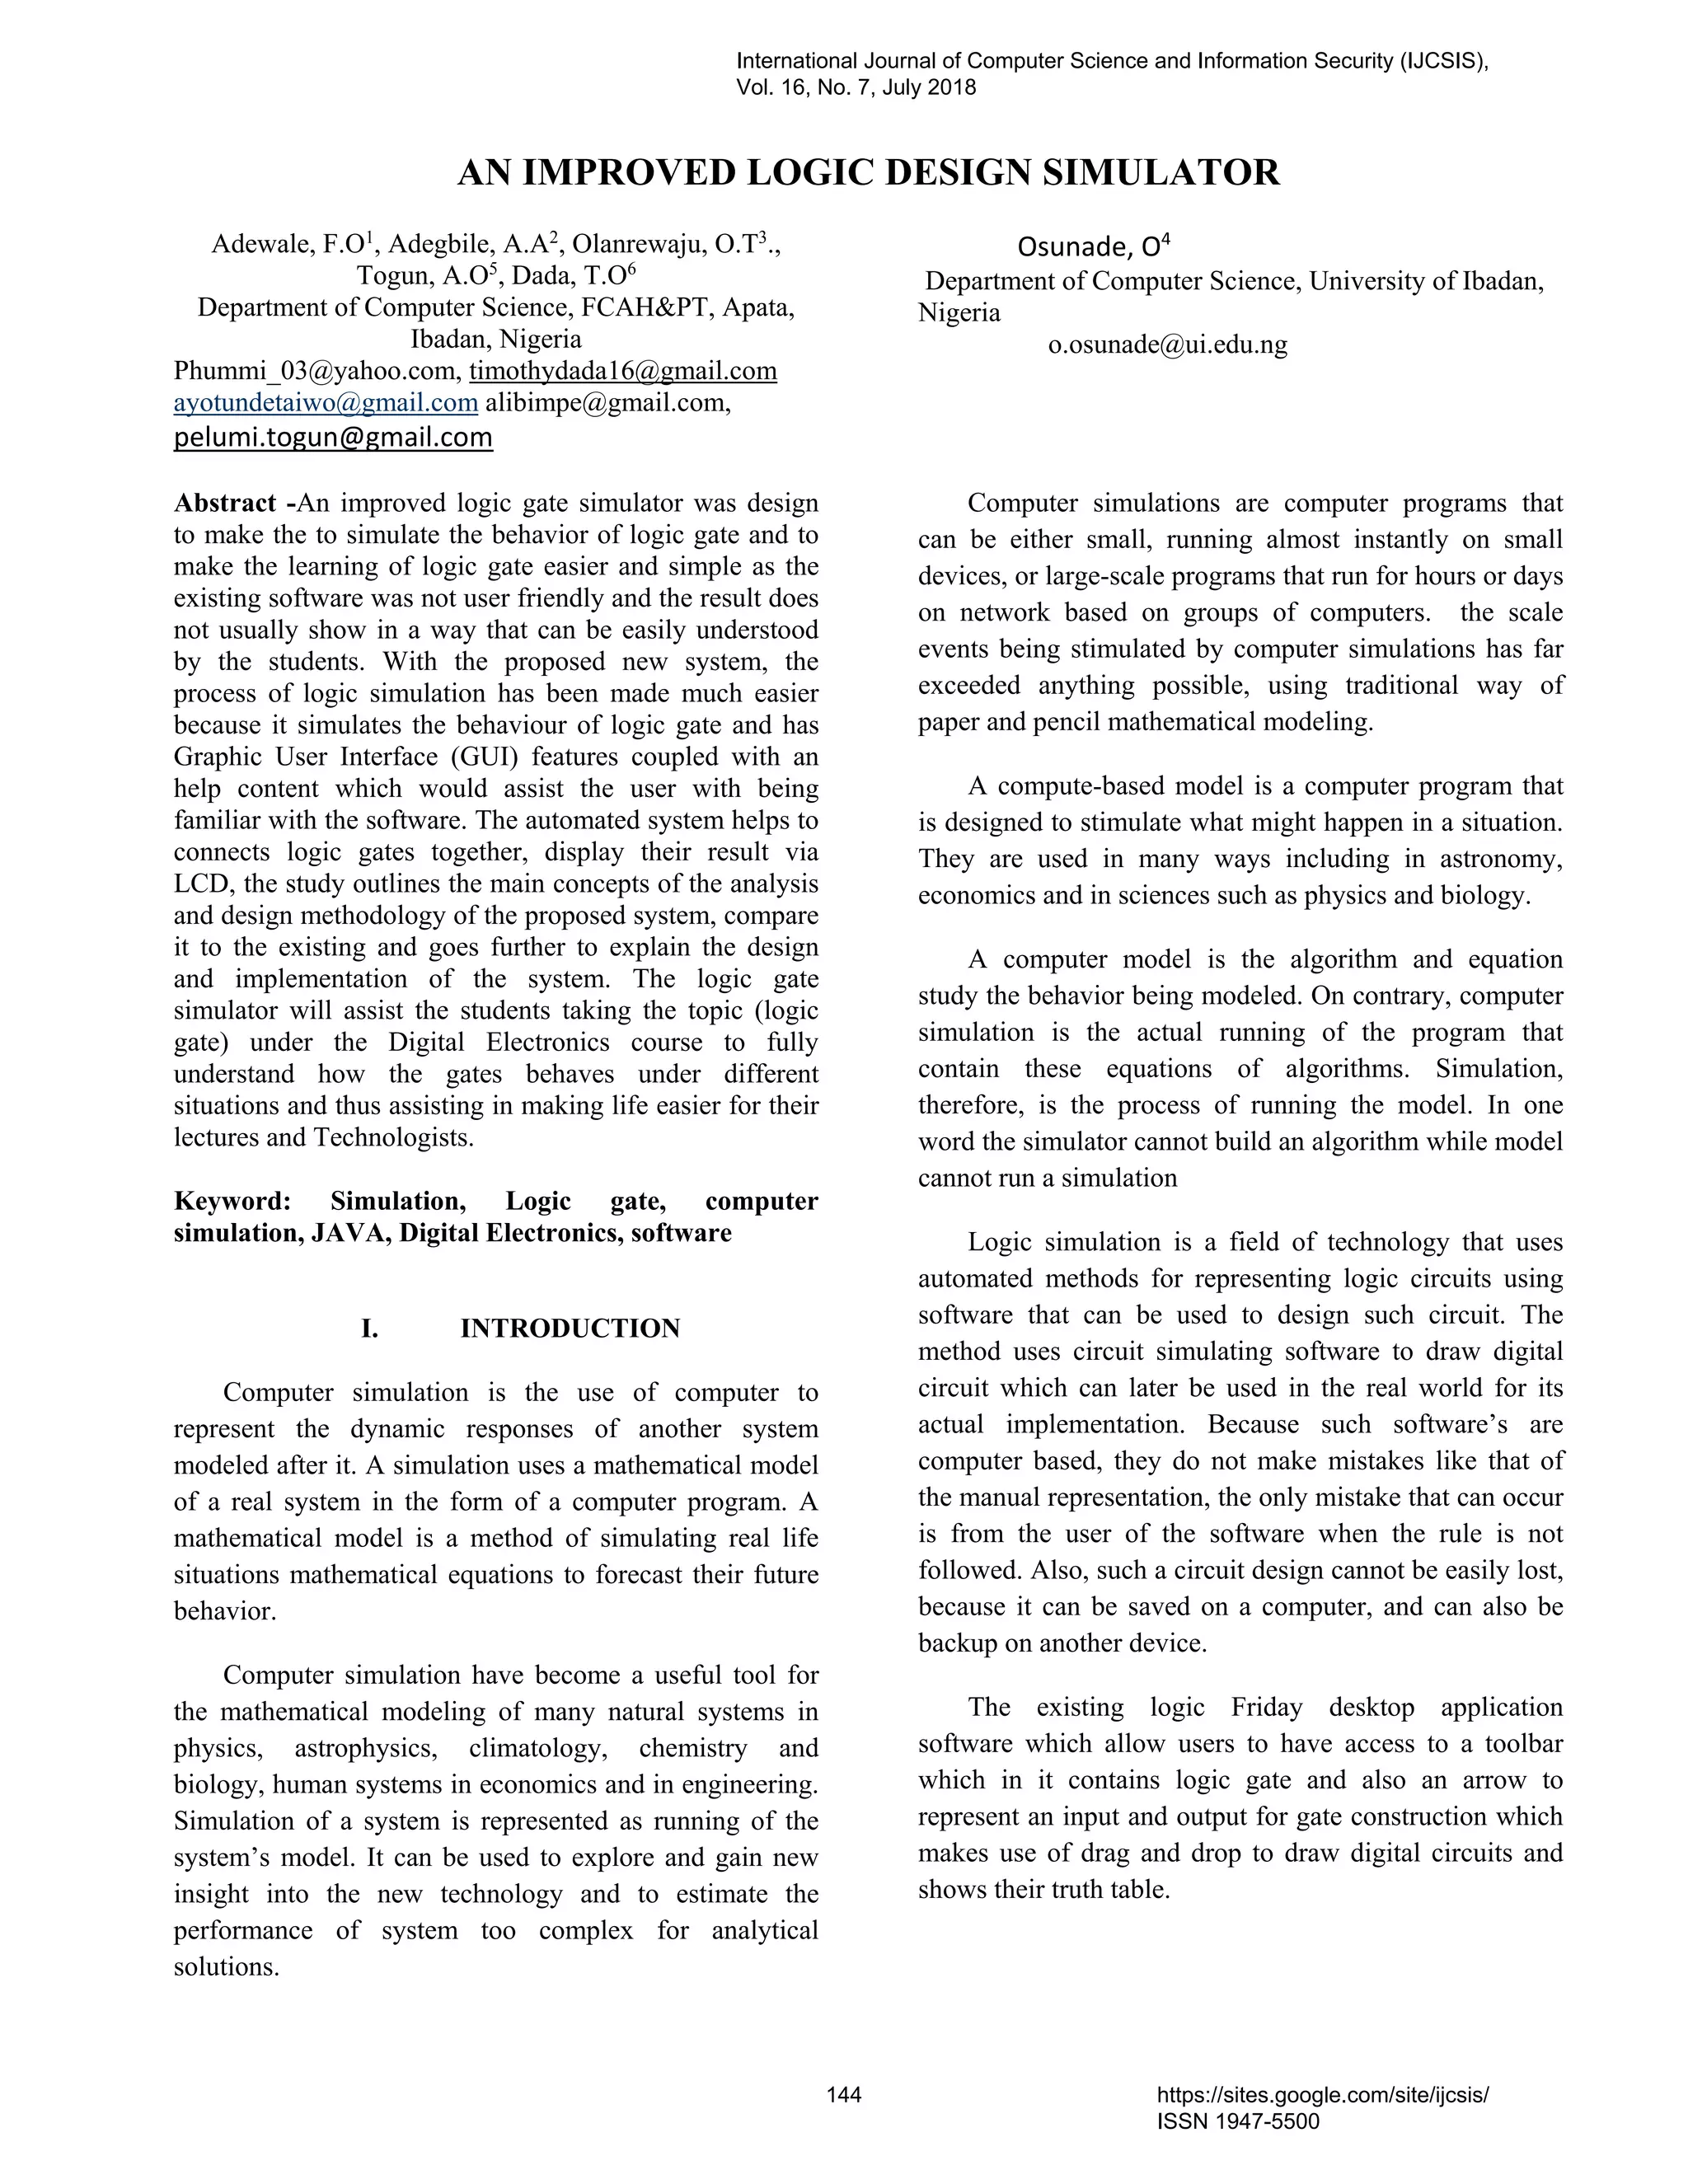
![Logic Friday lets you design logic circuit and convert
the digital logic circuit into truth table as well as the logic
expression for the same, this approach does not show how
the circuit would work. The proposed logic simulation
software deals with this problem by creating an approach
that shows how the circuit would work, and that is the
simulation aspect of it. The application will help student
to have better understanding of what they are being taught
and thereby help students build their skills on this logic
aspect of electronics. It allows the users to draw logic
components and know how it works
The proposed system is a simulation software which
simulates logic circuit diagram, this diagram would be
drawn by the user, it automatically shows how the circuit
would work while the user is drawing the circuit.
II. RELATED WORKS
HISTORY OF SIMULATION
Simulation is used in many contexts, such as
simulation of technology for performance optimization,
safety engineering, testing, training, education, and video
games. Simulation is also used with scientific modeling of
natural systems or human systems to gain insight in their
functioning. Simulation is also used when the real system
cannot be engaged, because it may be accessible.
Historically, simulation used in different fields developed
largely independently, but 20th
century studies of system
theory and cybernetics combined with spreading use of
computer across all those field have led to some
unification and a more systematic view of concept.
The binary number system was by Gottfried Wilhelm
Leibniz (published in 1705), influenced by the ancient I
Ching’s binary system. [4]
In an 1886 letter, Charles Sanders Peirce described how
logical operations could be carried out by electrical
switching circuits. Lee De Forest’s modification, in 1907,
of the Fleming valve can be used as an AND logic gate.
Ludwig Wittgenstein introduced a version of the 16-row
truth table as proposition 5.101 of TractatusLogico-
Philosophicus (1921).
[10,] His work was later cited by Claude E. Shannon, who
elaborated on the use of Boolean algebra in the analysis
and design of switching circuits in 1937. ([11] Using this
property of electrical switches to implement logic is the
fundamental concept that underlies all electronic digital
computers. As it became widely known in the electrical
engineering community during and after world war 11,
with theoretical rigor superseding the ad hoc methods that
had prevailed previously. [11]
SIMULATION SOFTWARE
Simulation software’s are programs that imitate of the
operation of real world process or system over time. The
act of simulating something first requires that a model be
developed; the model represents the system itself,
whereas the simulation represents the operation of the
system overtime.
LOGIC FRIDAY
This is the previous system. Logic Friday is free
Windows program that provides a graphical interface to
ESPRESSO, as well as to miss II, another module in the
Berkeley octtools package.
COMPUTER SIMULATION
A computer simulation is an attempt to model a
real life of hypothetical simulation on a computer so that
it can be study to see how it can be study to see how the
system works.
TYPES OF COMPUTER SIMULATION
1. Deterministic
This is an algorithm which given a particular
input, will always produce the same output, with
the underlying machine always passing through
the same sequence of state. (Edward A.Lee)
2. Dynamic system simulation
This is the use of computer to model the time
varying behavior of a system.
3. Stochastics models
This model uses random number generators to
model chance or random events
4. Discrete event simulation(DES)
Manages events in time. Logic test and fault free
simulations are of this type. its often more
important to be able to access the data produced
by the simulation and to discover logic defects in
the design or the sequence or events. [13]
5. Continuous dynamic simulation
It performs the numerical solutions of
differential algebraic equation or differential
equation (partially or ordinary)
International Journal of Computer Science and Information Security (IJCSIS),
Vol. 16, No. 7, July 2018
145 https://sites.google.com/site/ijcsis/
ISSN 1947-5500](https://image.slidesharecdn.com/journalofcomputerscienceijcsisjuly2018fullvolume-180915043348/75/Journal-of-computer-science-ijcsis-july-2018-full-volume-159-2048.jpg)
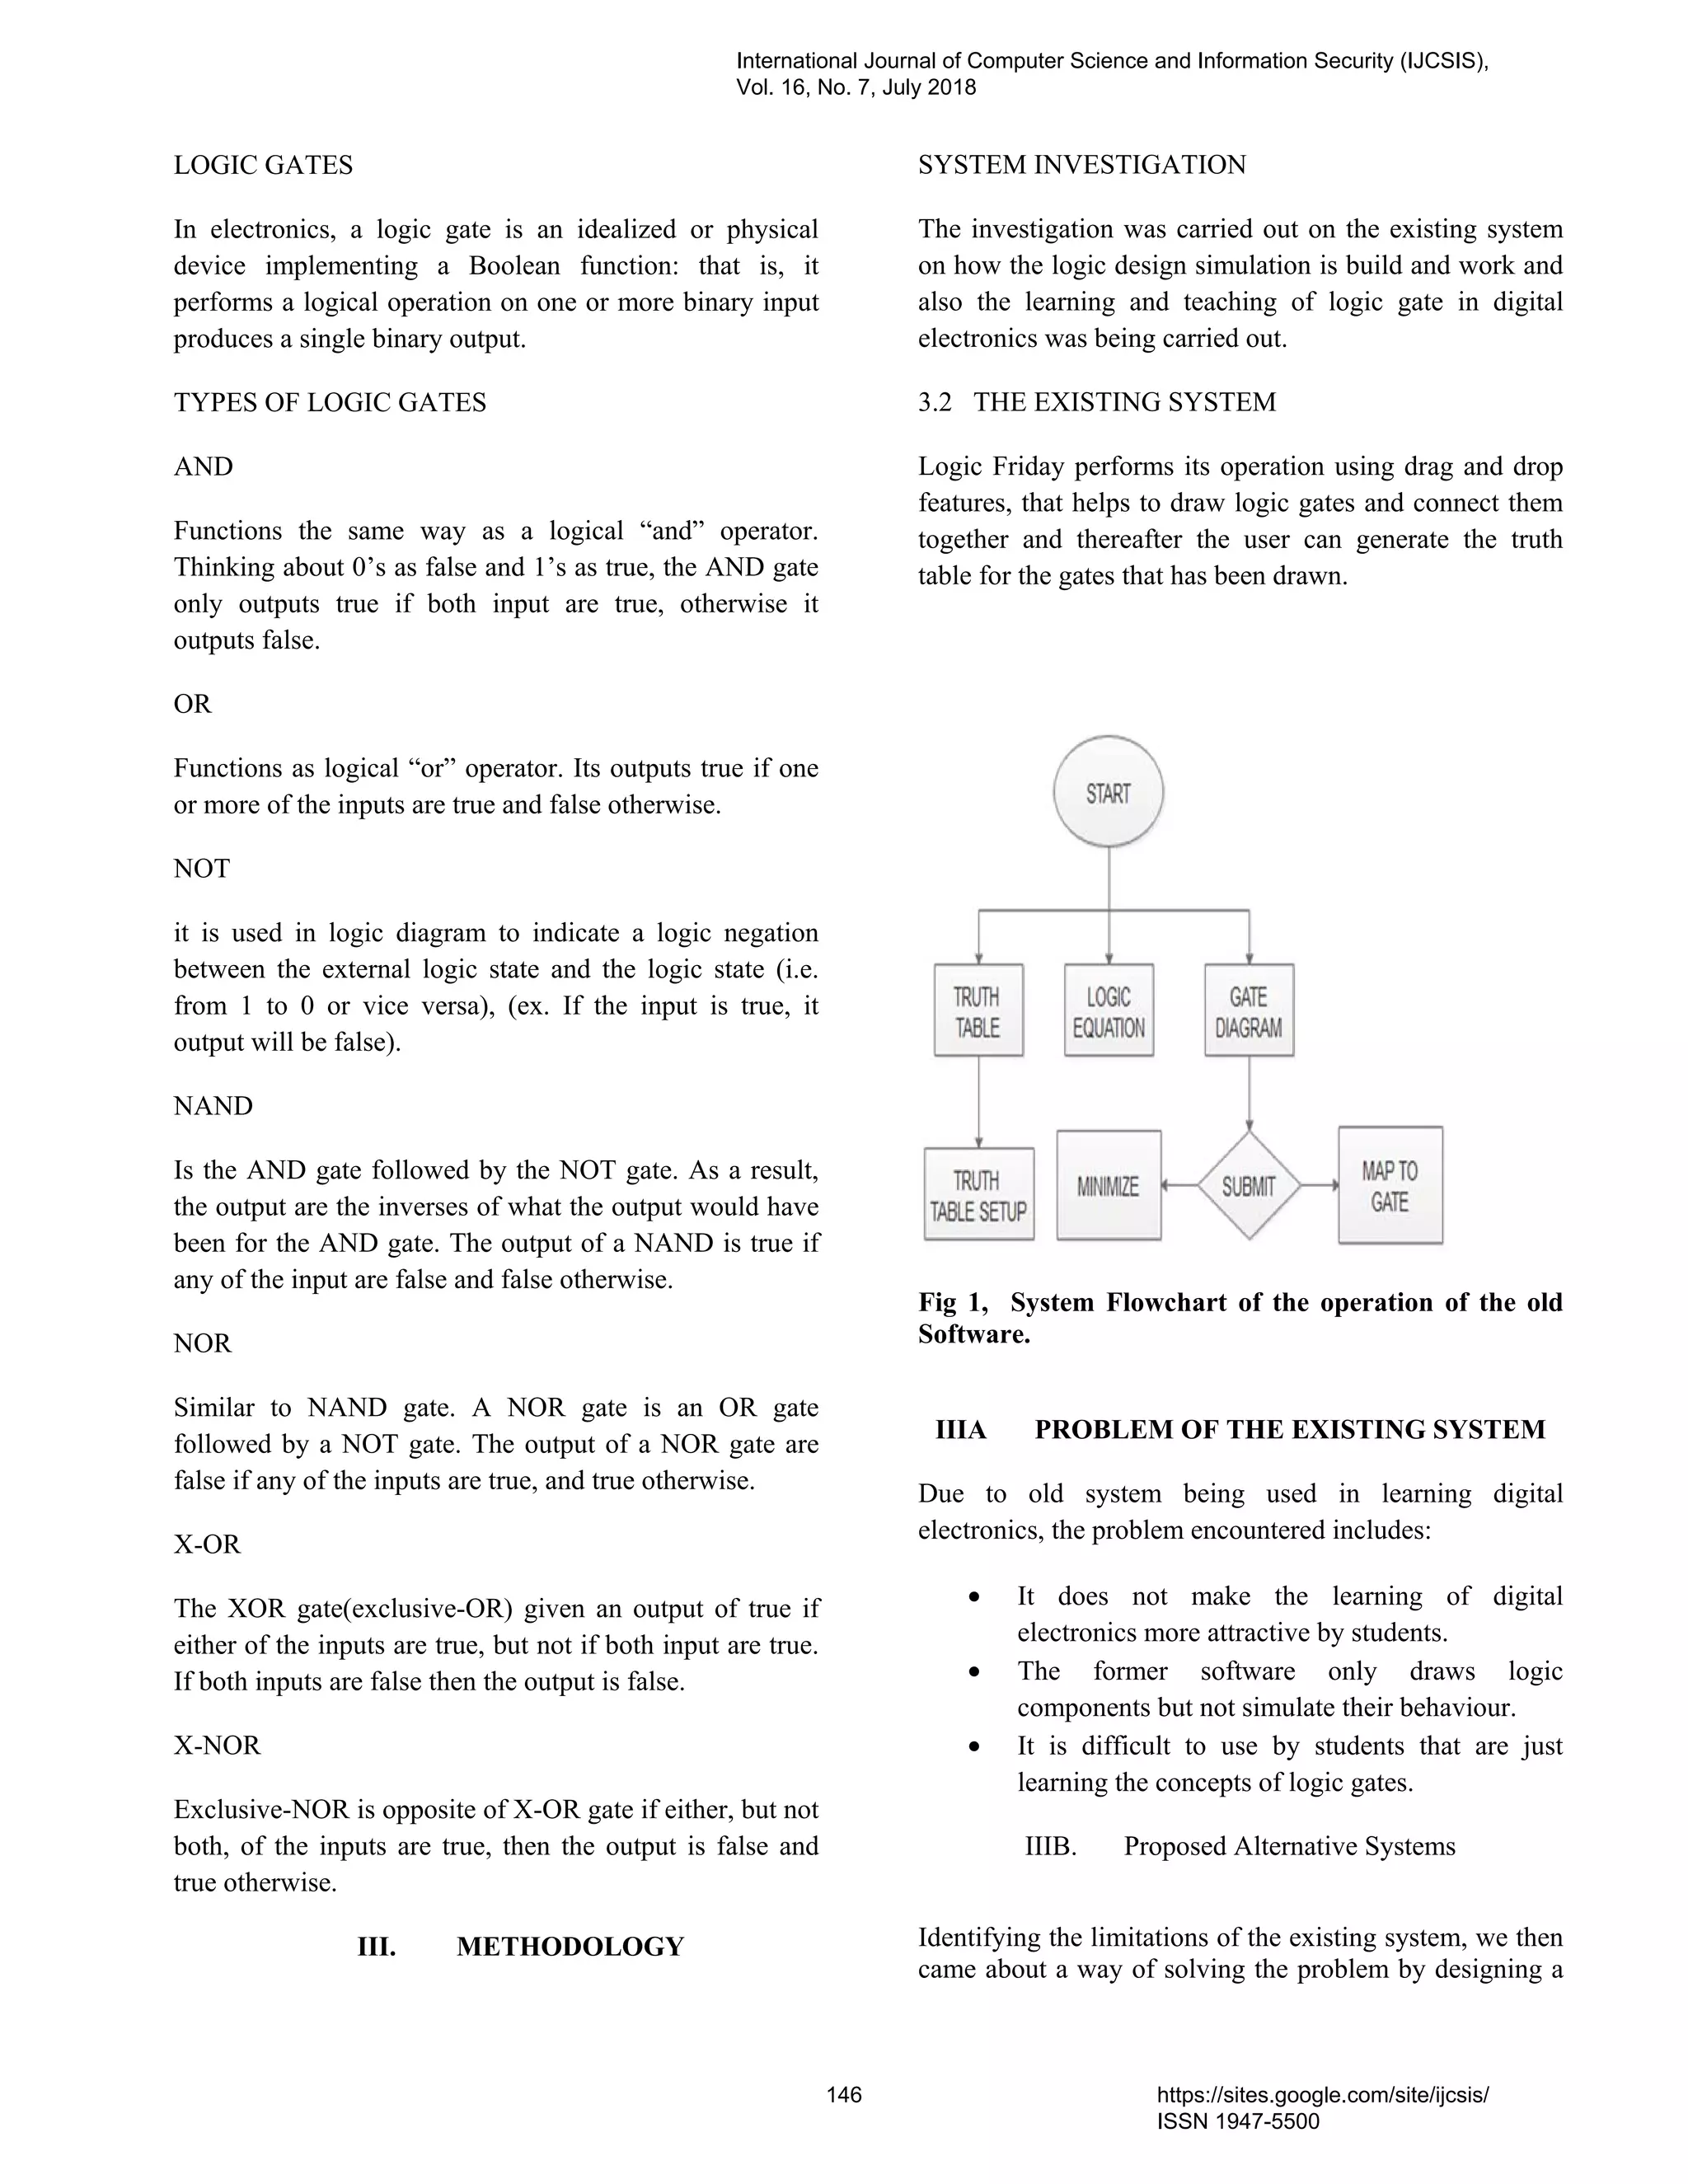
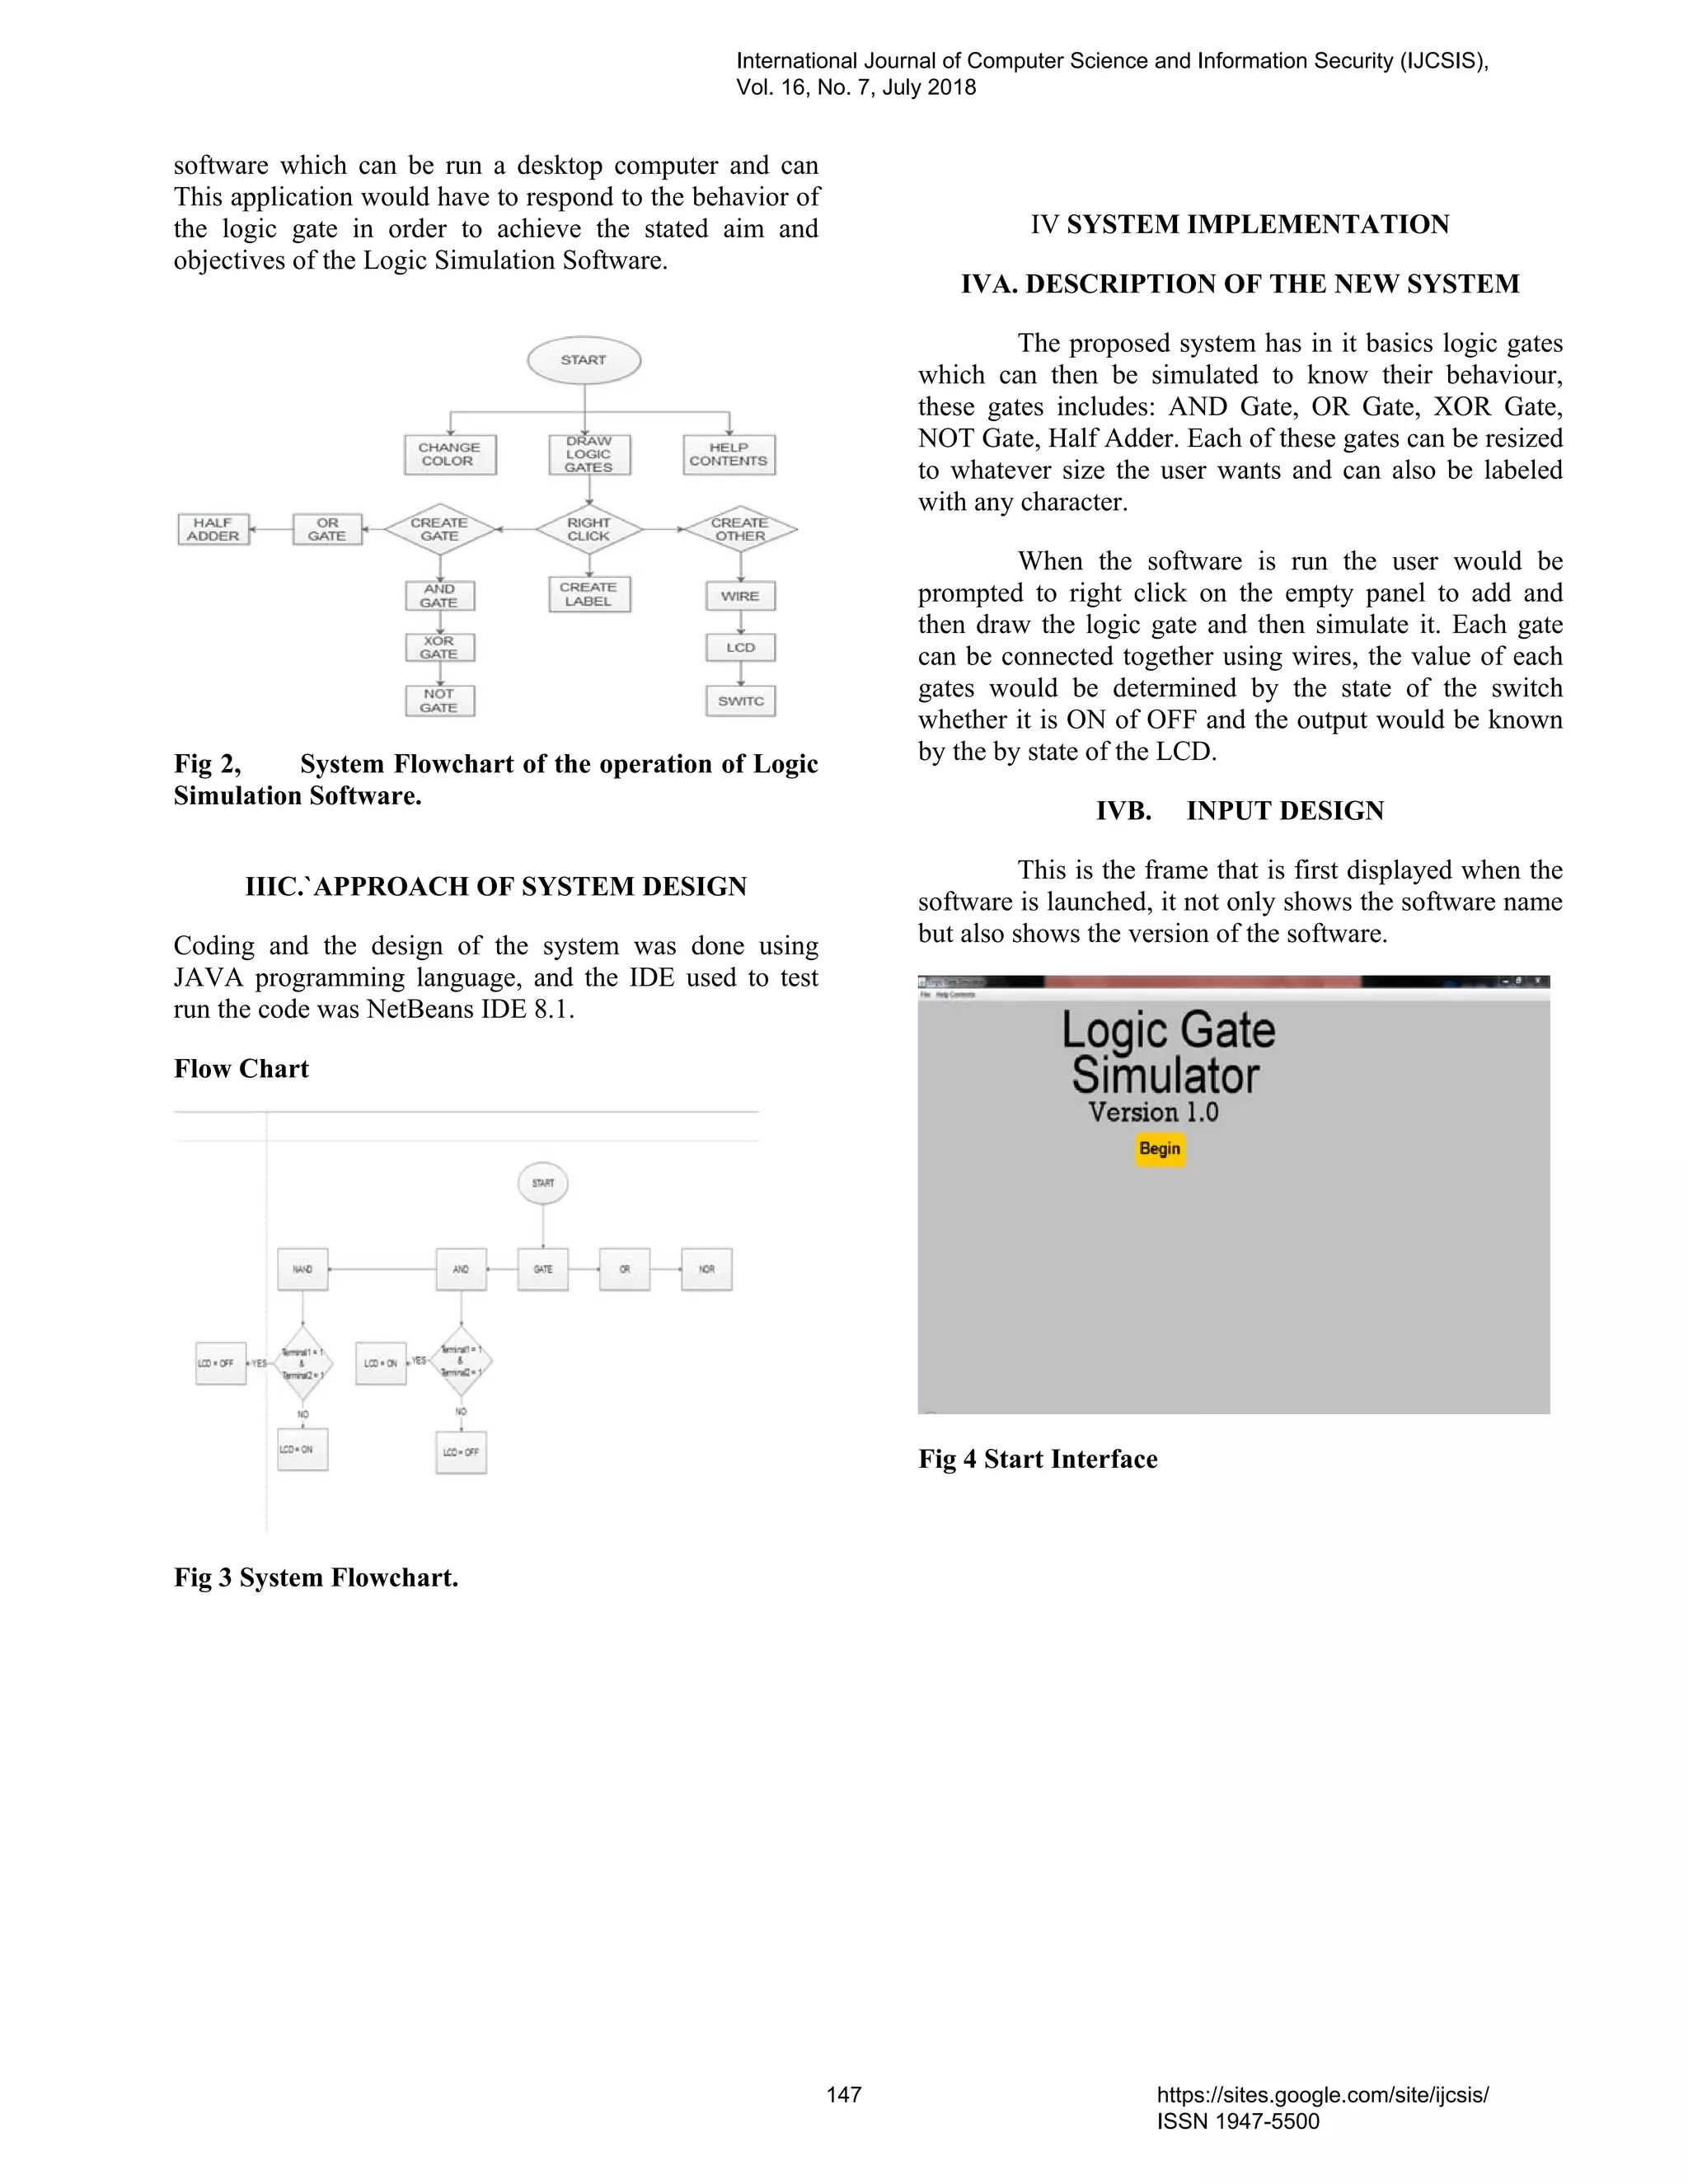
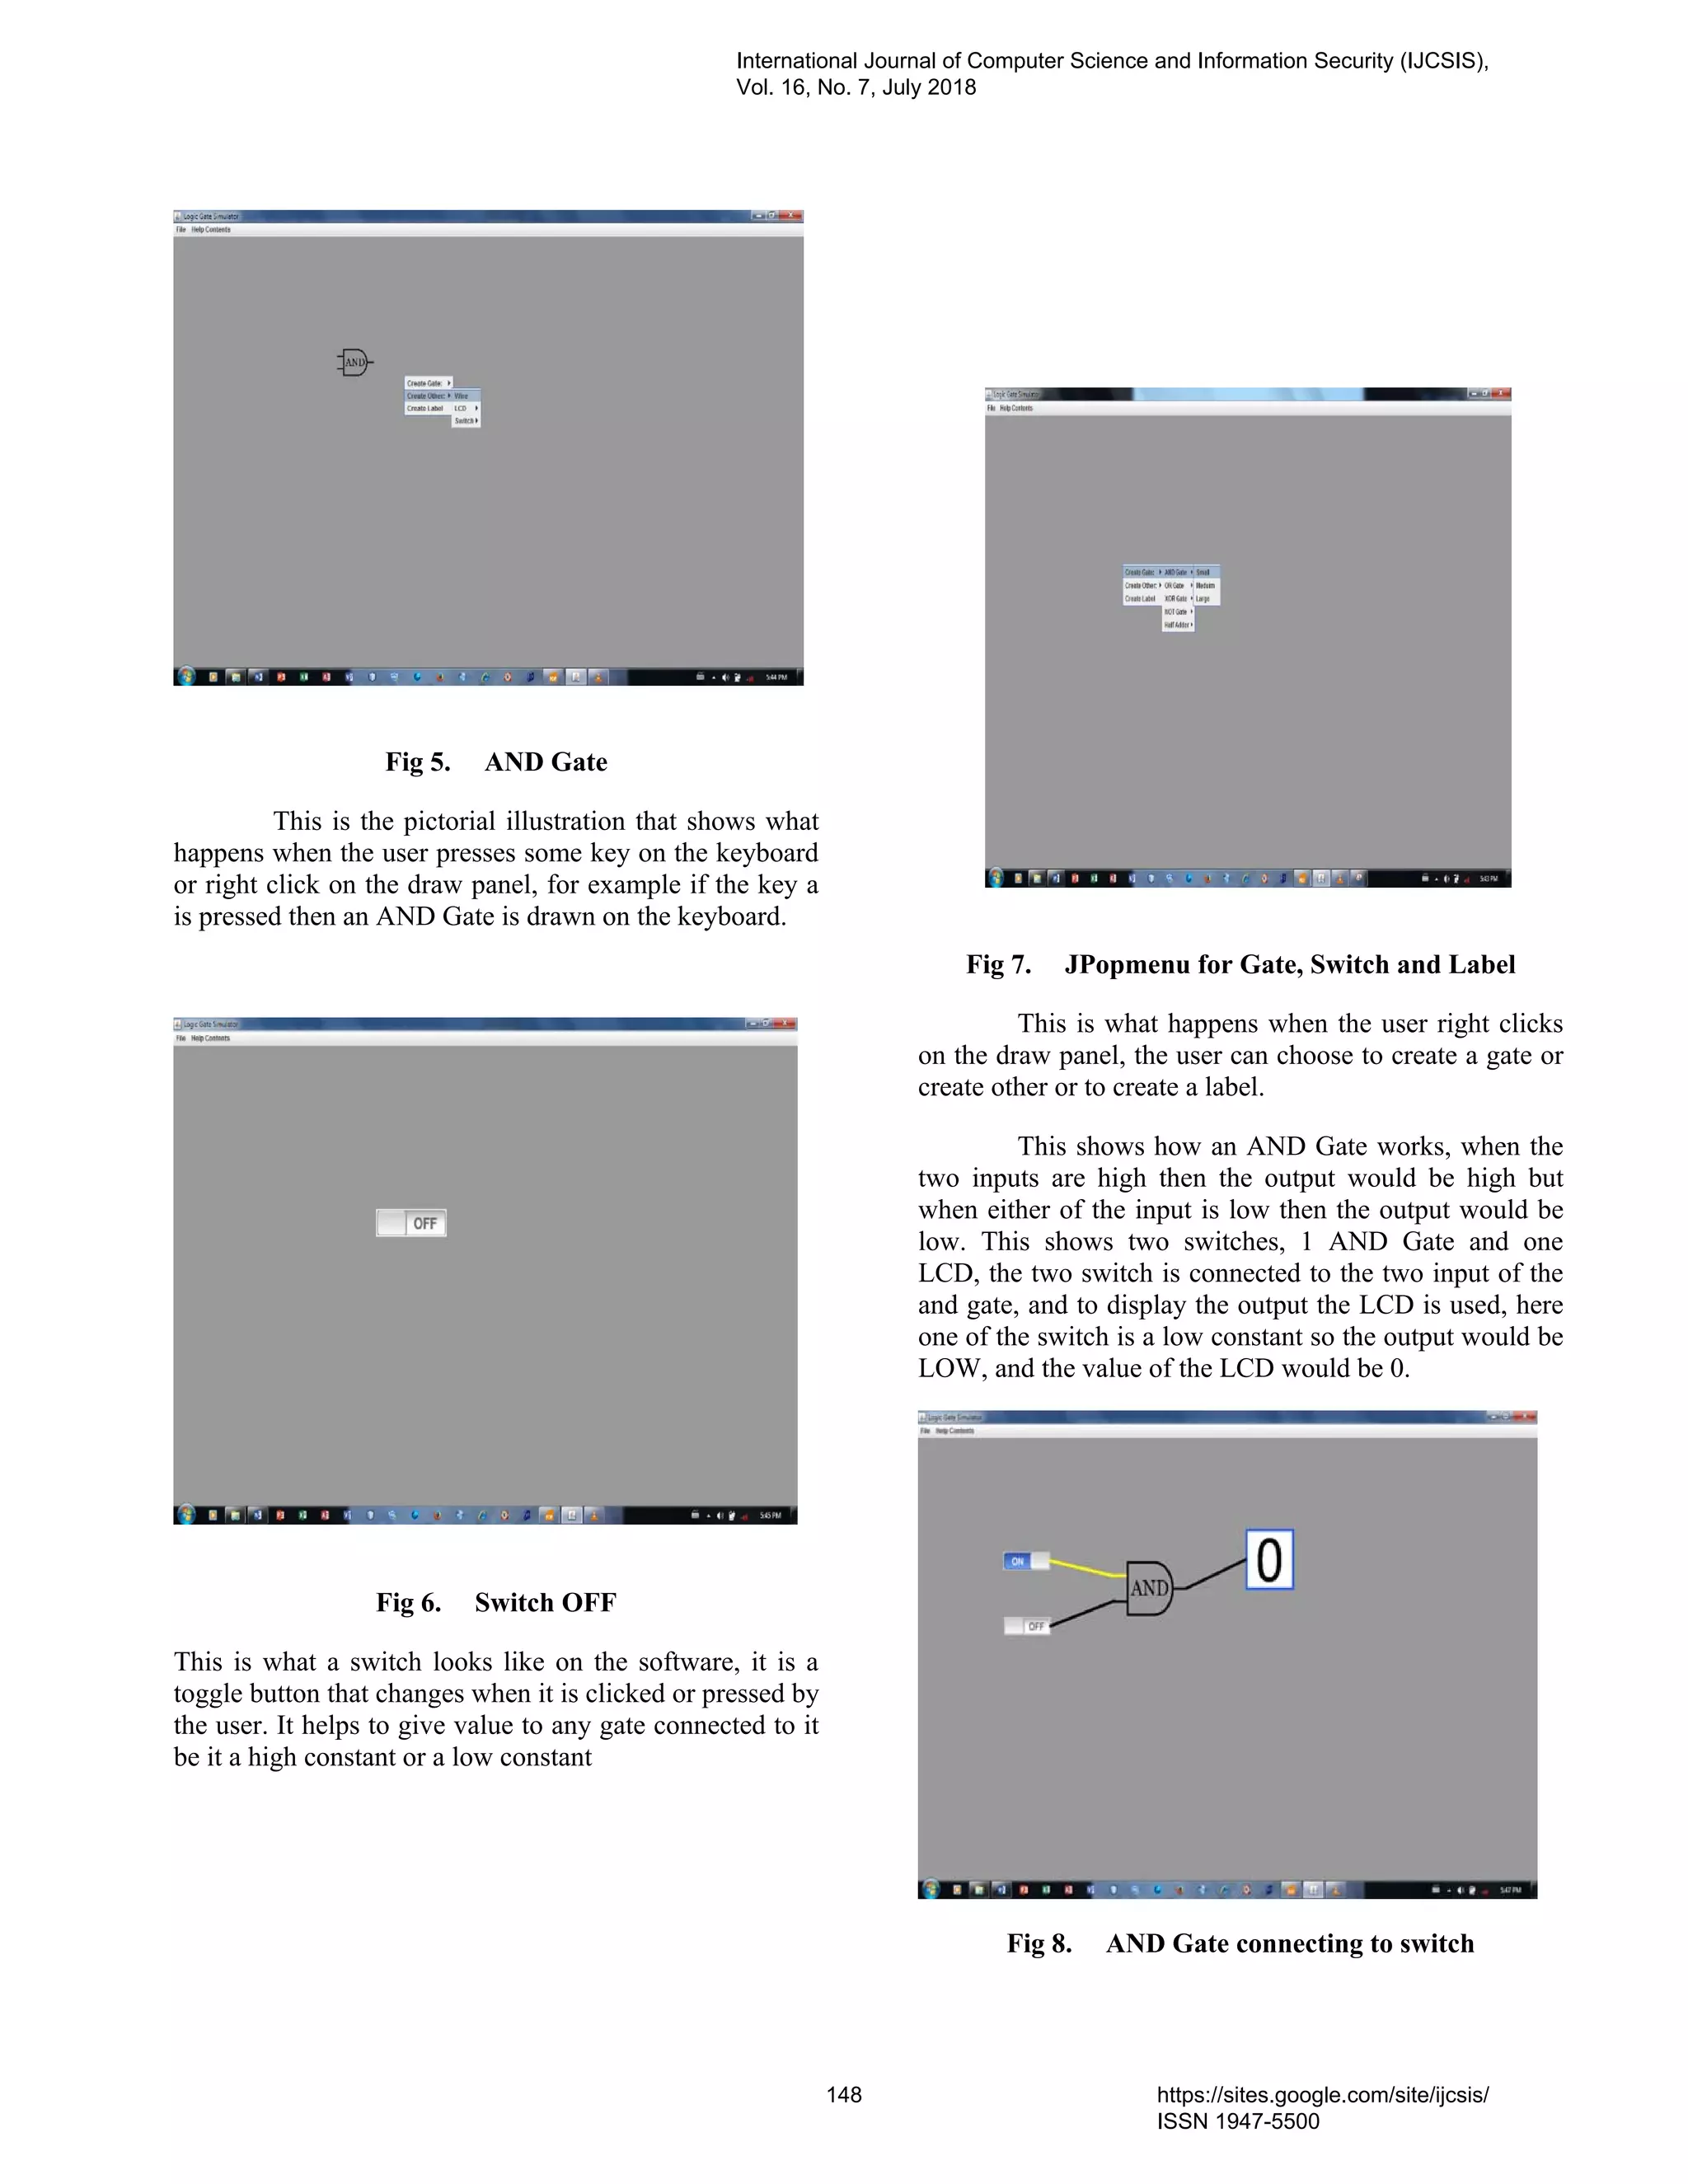
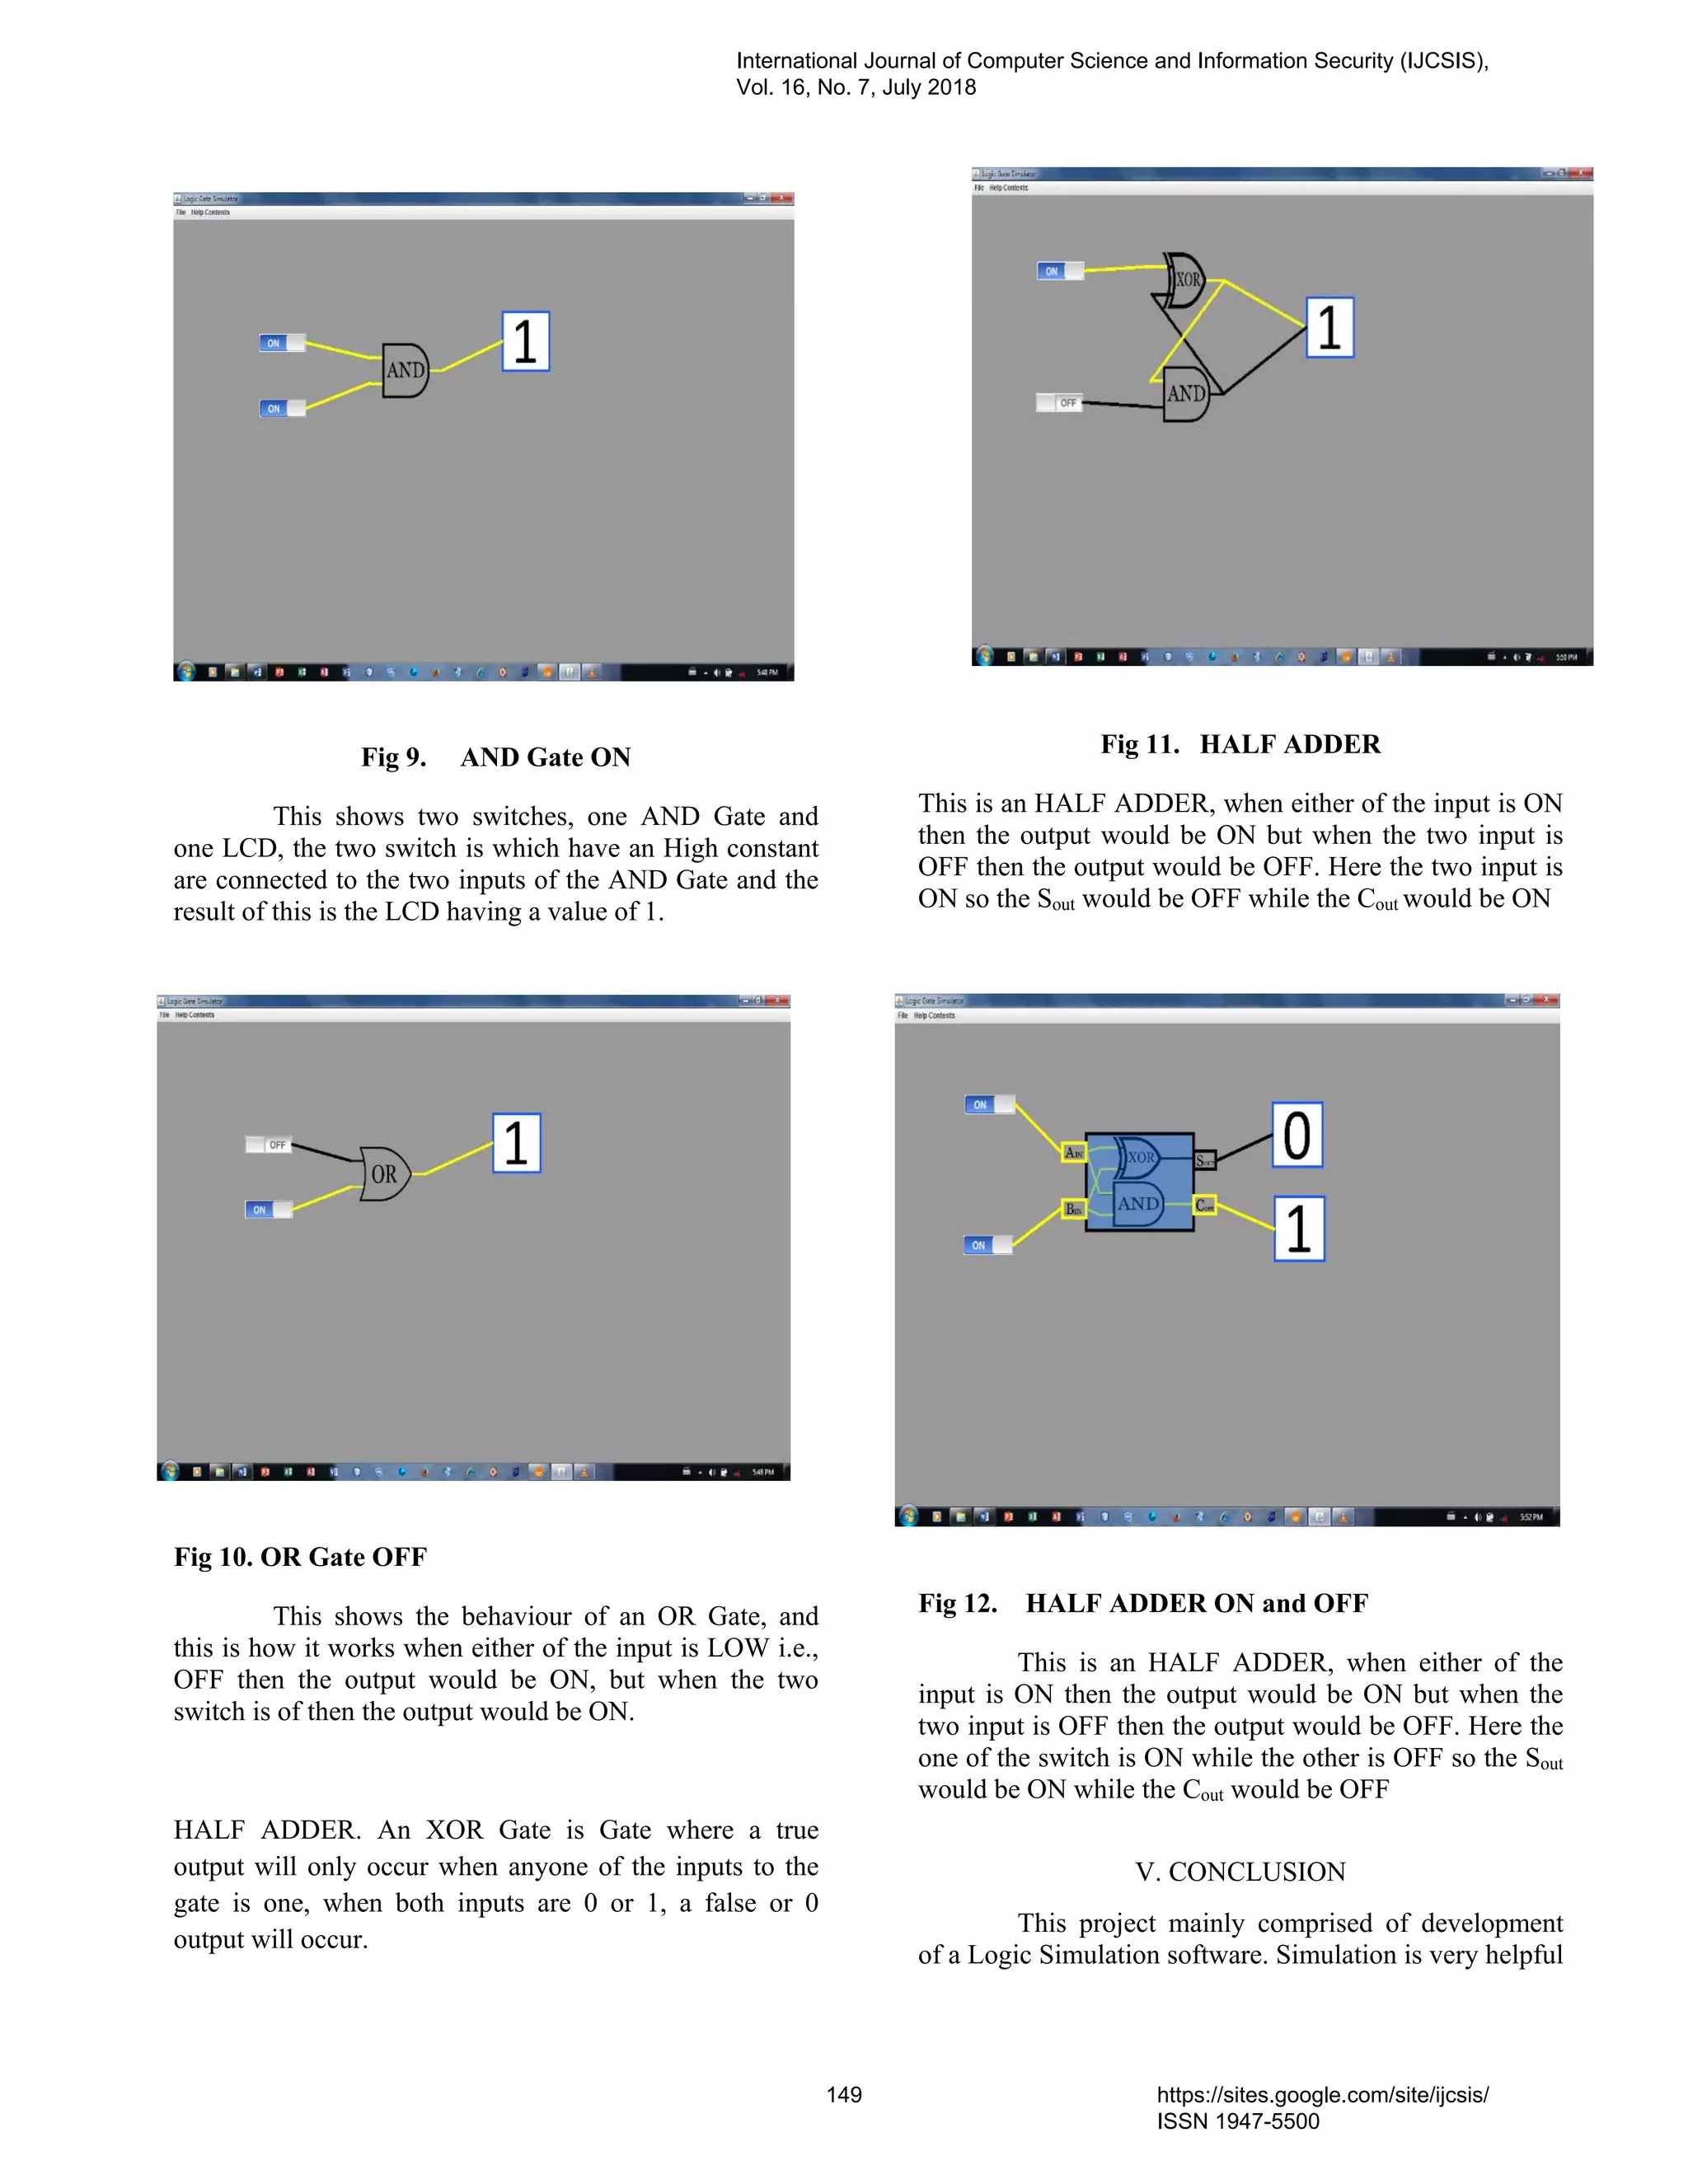
![in showing the behaviour of a system or how a system
would work, Logic Simulation is very helpful in helping
students to better understand the properties of each Logic
gate and how they would respond even when different
gates are connected to together. This project has been able
to connect logic gate together and also shows their
behaviour when connected to different gates. The success
of this project is a solution to the problems with the
manual system of drawing and connecting logic gate.
It is hoped that This work will help students to
better understand Logic gate operation and behaviour and
also serve as an aid for lecturers to teach students the
topic. It will also have a positive impact on the students as
knowing the behaviour of each logic gates, and will help
students to have more interest in the course and also in
electronics
REFERENCES
[1] Alan MathisonTuring (1947). “Modeling and
Simulation”. InHoboken, NJ: Wiley. Principles
of Modeling and Simulation P.6. ISBN 978-0-
470-28943-3 ISBN 1780061414950. doi:
09.2626/346585626484(retrievedfrom
https://en.m.wikipedia.org/wiki/Computer_simul
ation)
[2] Baase, Sara. A Gift of Fire (2007). “Social,
Legal, and Ethical Issues for Computing and the
Internet”. 3. Upper Saddle River: Prentice Hall.
Pages 363- 364. ISBN0-13-6008848-8.
(retrieved from
https://en.m.wikipedia.org/wiki/Computingandin
ternet ).
[3] Deitel Paul J., "Java: how to program / P.J.
Deitel, H.M. Deitel. -- 9th ed.",Writings of
Deitel S. v. 5, 1993, pp. 421–23. See Burks,
Arthur H., "Introduction to Computers and Java.
Ch.2 pp.40, see 1535. PDF Eprint.
[4] Edward A. Lee. “The problems with Threads”.
Retrieved 2009-05-29. (retrieved from
https://en.m.wikipedia.org/wiki/Deterministic
Algorithm).
[5 ] Nylan, Michael (2001). The Five "Confucian"
Classics. Yale University Press. pp. 204–206.
ISBN 978-0-300-08185-5. Retrieved 8 June
2010.
[6] Overview of IEEE Standard 91-1984
Explanation of Logic Symbols, Doc. No.
SDYZ001A, Texas Instruments Semiconductor
Group, 1996.
[7] Perkins, Franklin. Leibniz and China: A
Commerce of Light. Cambridge: Cambridge
University Press, 2004. p 117. Print.
[8] Deitel Paul J., "Java: how to program / P.J.
Deitel, H.M. Deitel. -- 9th ed.",Writings of
Deitel S. v. 5, 1993, pp. 421–23. See Burks,
Arthur H., "Introduction to Computers and Java.
Ch.2 pp.40, see 1535. PDF Eprint.
[9] Peirce, C. S., "Letter, Peirce to A.
Marquand", (1886).Writings of Charles S.
Peirce, v. 5, 1993, pp. 421–23. See Burks,
Arthur W., "Review: Charles S. Peirce, the new
elements of mathematics", Bulletin of the
American Mathematical Society v. 84, n. 5
(1978), pp. 913–18, see 917. PDF Eprint.
[10] Radomir S. Stanković (University of Nis),
Jaakko T. Astola (Tampere University of
Technology), Mark G. Karpovsky (Boston
University), Some Historical Remarks on
Switching Theory, 2007h, DOI 10.1.1.66.1248.
[11] Radomir S. Stanković, Jaakko Astola (2008),
Reprints from the Early Days of Information
Sciences: TICSP Series On the Contributions of
Akira Nakashima to Switching Theory, TICSP
Series #40, Tampere International Center for
Signal Processing, Tampere University of
Technology.
[12]Santer, Thomas J, Brain J, Notz William I
(2003). The design and analysis of computer
experiments. Springer Verlag. (retrieved from
https://slidesharecdn.comésimulation/all-types-
of-modelisimulationoselling
[13]Smith J.E (2002). “Simulation Symposium”. In
Brockman, John. Statistical Simulation of
Symmetric Multiprocessor Systems. Pages 233.
ISSN 1082-241X. doi:
10.1109/SIMSYM.2002.10000093 (retrieved
from
https://en.m.wikipedia.org/wiki/Comput
er_simulation).
[14]Strogatz, Steven (2007). “The End of Insight”.
In Brockman, John. What is the dangerous idea?
HarperCollins. Pages 233. ISBN
9780061214950. doi:10.1787/603233448430
(retrieved from
https://en.m.wikipedia.org/wiki/Computer_simul
ation).
International Journal of Computer Science and Information Security (IJCSIS),
Vol. 16, No. 7, July 2018
150 https://sites.google.com/site/ijcsis/
ISSN 1947-5500](https://image.slidesharecdn.com/journalofcomputerscienceijcsisjuly2018fullvolume-180915043348/75/Journal-of-computer-science-ijcsis-july-2018-full-volume-164-2048.jpg)
![EDUCATION GAME FOR TEACHING STACK AND LINK- LIST AS AN
ASPECT OF DATA STRUCTURE AND ALGORITHM
Olanrewaju, O.T1
, Adegbile, A.A2
, Ogunbade, A.O4
,
Dada, T.O5
, Adewale, F.O6 ,
Aguda O.O7
.
Department of Computer Science, FCAH&PT, Apata,
Ibadan, Nigeria
{ayotundetaiwo@gmail.com, alibimpe}@gmail.com,
timothydada16@gmail.com,phummi03@yahoo.com,
wale_ogunbade@yahoo.com, aguda@fcahptib.edu.ng
Osunade, O3
Department of Computer Science, University of Ibadan,
Nigeria
o.osunade@ui.edu.ng
Abstract -This project focused on designing educational
games for teaching stack and link-list which are the most
challenging and difficult aspect of Data structure and
Algorithm. Due to the nature of the course, and from
research findings, it was observed that most students find
it difficult to understand stack and linked list despite the
effort of the lecturer. Therefore, the introduction of this
educational game will enable the student to learn fast and
understand the major content of the course. This
application was developed to eradicate the abstractness of
teaching stack and link-list and make the learning an
interactive one, it is application software that can be
installed java mobile environment for the use of students
most especially those in the higher institutions. This
application can be installed in a JAVA environment just
like any other app and can be updated from time to time
which makes the application accessible on the mobile
device for students. It’s also help in the simplification of
the teaching of stack and link-list in tertiary institutions
most especially for Computer Science students.
Keywords: Data Structure, Java, Stack, Link-list,
Educational game, Algorithm
I. INTRODUCTION
Computer Games are software systems that involve
interaction with a user interface to generate visual
feedback on a computer or a video device and utilize
many elements, such as fun, play, winning/losing, and
competition. Computer games that involve learning of
certain knowledge are called Educational Computer
Games [20]
Computer games have made a significant cultural, social,
economic, political, and technological impact on society
[16]. Given the widespread popularity of computer games,
and their ability to sustain long engagement with
challenging tasks, it should come as no great surprise that
educators have become increasingly interested in the
potential of such games as learning tools. Since computer
games have the capacity to engage children in learning
experiences, it is important to assess the extent that
computer game technology had an impact on childhood
education. However, it appears that very few games on
the commercial market have educational value; some
evidence suggests that important skills may be built or
reinforced by computer game. For example, spatial
visualization ability (i.e. mentally, rotating and
manipulating two- and three-dimensional objects)
improve with video game playing.
The educational games are computer games that can be
integrated into the educational domain to generate new
trend in technologies and make learning process more
effective and efficient [10].
[15], defined teaching as an intimate contact between a
more mature personality and less mature one which is
designed to further education of the letters. Effective
teaching is an approach to help teacher to change their
teaching practices to meet the need of the students by data
gathering, provide information to assist in monitoring
student’s engagement progress and achievement adapting
learning program and identifying students who needs
further challenges for additional support. Teaching is also
an act, practice and profession of impacting knowledge or
is an act of interpretation and self-expression on the part
of education.
Data structure is a way of organizing data in a computer
memory so that it can be use efficiently. An algorithm is a
formula or set of steps for solving a particular problem.
An Algorithm is defined as “a sequence of computational
steps that takes a value, or set of values, as input and
produces a value, or set of values, as output” [8].
Algorithms usually model complicated concepts, refer to
abstract mathematical notions, or describe complex
dynamic changes in data structures to solve relatively
difficult problems. Stack and linked list is an aspect of
data structure and algorithm.
A stack is an Abstract Data Type (ADT), commonly used
in most programming languages. It is named stack as it
behaves like a real-world stack, for example – a deck of
cards or a pile of plates, etc. ADT allows all data
operations at one end only. At any given time, we can
only access the top element of a stack, this feature makes
it LIFO (Last-in-first-out). Here, the element which is
placed (inserted or added) in last, is accessed first. In
stack terminology, insertion operation is
called PUSH operation and removal operation is
called POP operation.
International Journal of Computer Science and Information Security (IJCSIS),
Vol. 16, No. 7, July 2018
151 https://sites.google.com/site/ijcsis/
ISSN 1947-5500](https://image.slidesharecdn.com/journalofcomputerscienceijcsisjuly2018fullvolume-180915043348/75/Journal-of-computer-science-ijcsis-july-2018-full-volume-165-2048.jpg)
![A linked list is a sequence of data structures, which are
connected together via links. Linked List is a sequence of
links which contains items. Each link contains a
connection to another link. Linked list is the second
most-used data structure after array. Linked list can be
visualized as a chain of nodes, where every node points
to the next node.[3]
However, most student find it difficult to understand the
basic concept of stack and linked list, not that the lecturer
did not know it but it is not explainable despite the effort
of the lecturer students still find it difficult to understand
because of the nature of the course, it requires much
explanation and illustration. Teaching aids other than
chalkboard and view-graph are always needed to help
students learn and understand stack and linked list better
and that is the reason this game is been implemented.
The aim of this project work is design an educational
game for teaching stack and linked list on data structure
and algorithm which will motivate and arouse the interest
of student towards learning. It can also increase their
thinking ability by giving them confidence to do things by
themselves with or without supervision.
II RELATED WORKS
IIA. THE HISTORY OF EDUCATIONAL
GAME
The history of educational game can generally be broken
down into two separate areas of interest. First, is the
conception of educational gaming and further justification
of why the gaming paradigm lends particularly strong
synergy with classical approaches to the way people
learn? Second, is the study of what’s known about good
educational game design – in essence, what works well
and with whom?
[6], recorded that educational video games are importance
for individualized learning, given that every learner is
different, teachers are always looking for adequate
resources that will provide every learner with an
individualized learning plan. Video games allow students
to learn new concepts at their own pace without having a
constant overlook from parents and teachers.
Furthermore, the experience of the players can be tailored
based on their preferences and performance. The game
automatically adjusted to prevent high level challenges
after solving each problem, if they are having difficulty
with concept in a different manner until the student
understand it. Video games balance enjoyment with
appropriate challenge level, which keeps players in an
optimally engaging and challenging learning zone.
IIB. EDUCATIONAL GAME BASED LEARNING
According to Dickers [9] Game Based Learning (GBL) is
a type of game play that defined learning outcome.
Generally, game base learning is designed to balance
subject matter with game play and ability of the player to
retain and apply said subject matter to the real-world .The
built in learning processes of game is what makes a game
enjoyable. The progress of a player makes in a game is
through learning, it is the process of the human mind
grasping and able to understand a new system. The
progress of understanding a new concept through gaming
makes an individual feel a sense of reward whether the
game is considered entertainment or edutainment.
[4], reported that Game based teaching and learning can
be quite effective if one understood what is and how it can
be implemented to enhance instruction and learning.
Game based learning is not gamification, game based
learning is using games to enhance the learner in the
classroom, when discussing game for learning it is
essential that educators see a benefit to the use of the
game. Gamification can be described as a way to add
game elements to a non- game situation.
[5] explain that one difference between gaming for fun
and gaming for educational purposes is that educators
start with learning goals,; and gaming media choices will
be made based on the games potential to meet those goals
[13], recorded four keys ingredients to game which are:
• Goal-a game has to have a desired outcome that
everyone is working to accomplish.
• Rules-in order to achieve a goal there has to be
some parameters put into place that eliminate or
make it difficult to achieve the goal.
• Feedback system- this is a process where the
player knows where they are in system to
achieve the goal.
• Voluntarily participation- basically this means
that everyone involved in the game understands
the rules, has a clear sense of the goal, and how
to receive feedback.
[14] discovered that educational games have been a
common place part of the K-12 experience since the
beginning of the 1980s (and in some places well before
that), with early titles introducing students to fundamental
math, history, and problem solving concepts just as games
do today. While the graphics may not have been great, the
games helped to engage a generation of kids with
technology and laid a solid foundation for the educational
games that were to come.
IIC. REVIEW OF EXISTING TEACHING SYSTEM
This involve the collection of information in respect to the
existing operations, procedures with respect to this project
study, the existing method of teaching is the manual and
traditional way which does not involve the use of
computer device to stimulate the teaching and learning
International Journal of Computer Science and Information Security (IJCSIS),
Vol. 16, No. 7, July 2018
152 https://sites.google.com/site/ijcsis/
ISSN 1947-5500](https://image.slidesharecdn.com/journalofcomputerscienceijcsisjuly2018fullvolume-180915043348/75/Journal-of-computer-science-ijcsis-july-2018-full-volume-166-2048.jpg)
![process. In this existing system student assemble in
classroom where teachers will present in order to pass
knowledge to them.
IID. REVIEW OF PAST PROJECT ON THE RELATED
RESEARCH
In the decades following the establishment of the original
psychological basis for education gaming, many studies
looked not only at valuable subjects such as the genres of
learners and how game design can be applied to these
varied behaviours, but also the different game play
activity modes and how these can be best applied based
on individual preferences.
A landmark studied by [12] provided the basis for
differentiation in learning behaviour not in accordance
with classically known educational psychology, but rather
specifically in the paradigm of education and gaming. In
his study, the genre of learner’s game behaviour was
divided into six categories: creative learners, exploring
learners, collaborate learners, trial and error learners,
inquiring learners, and entertaining learners. Each of these
different types of learners required that specific design
strategies should be used regardless of their learning type
and all students remain engaged. These categories are
explained below:
I. Creative learners need an environment that
allows for a diverse set of solutions, whereas
exploring learners need the game to lead them
freely.
II. Collaborative learners need effective interaction
and communication, trial and error learners need
a large base of support and help, inquiring
learners need the ability to discuss and play
different roles, and entertaining learners need
choices, challenges, and an engaging story.
He concluded that these various types of needs provide
the basis for good game design – taking into account the
differentiation in player preferences in vital for creating
educational games that have widespread appeal and
efficacy.
Junjie’s study was built upon by [12], they divided types
of gameplay into six corresponding categories that
mirrored some of Junjie’s chosen areas, and looked at
play preferences among test subjects. The categories of
play their study focused were:
i. Active play was characterized as involving
intensely performative input that involved
response time and combination input.
ii. Explorative play, on the other hand, is where
physical travel is simulated so that the player is
allowed to discover new areas and challenges.
iii. Problem-solving play and strategic play have the
same basis of interaction, but problem-solving
focuses more on short-term puzzles and
challenges, whereas strategic play focuses more
on long-term resource management.
iv. Social play focuses on the interactions and
collaborations between characters.
v. Creative play focuses on the ability to create and
interact with elements during the game.
[12], also gave breakdowns of preferences between
the two genders, Boys actually preferred active play
most by a fair margin, but active play was least
preferential for girls tied for last with strategic play.
Boys preferred explorative play second best and
girls’ preferred explorative play most the reason why
explorative play is, on average, the most preferred
genre of game. For reference purposes, the top three
types of play for boys were active, explorative, and
strategic, the top three for girls were explorative,
creative, and problem solving, the bottom three for
boys were creative, social, and problem solving, and
the bottom three for girls were strategic, active, and
social.
IIE. RESEARCH RELATED GAME
SNAKE AND LADDER GAME
[18] recorded that the game has been interpreted and used
as a tool for teaching the effects of good deeds. The board
was covered with symbolic images, the top featuring
gods, angels, and majestic beings, while the rest of the
board was covered with pictures of animals, flowers and
people. The ladders represented virtues such as
generosity, faith, and humility, while the snakes
represented vices such as lust, anger, murder, and theft.
The morality lesson of the game was that a person can
attain salvation through doing well, whereas by doing evil
one will inherit rebirth to lower forms of life.
[2], recorded that the central mechanism of Snakes and
Ladders makes it an effective tool for teaching young
children about various subjects. In two separate
Indonesian schools, the implementation of the game as
media in English lessons of fifth graders not only
improved the students' vocabulary but also stimulated
their interest and excitement about the learning process.
[19], found that pre-scholars from low income
backgrounds who played an hour of numerical board
games like Snakes and Ladders matched the performance
of their middle-class counterparts by showing
improvements in counting and recognizing number
shapes. the game was also used to teach students and
teachers about climate change and environmental
sustainability.
READER RABBIT GAME
[11], explained that Reader Rabbit game has taught scores
of toddlers and young students how to read and spell
International Journal of Computer Science and Information Security (IJCSIS),
Vol. 16, No. 7, July 2018
153 https://sites.google.com/site/ijcsis/
ISSN 1947-5500](https://image.slidesharecdn.com/journalofcomputerscienceijcsisjuly2018fullvolume-180915043348/75/Journal-of-computer-science-ijcsis-july-2018-full-volume-167-2048.jpg)
![through simple but fun mini-games, is among the most
influential and successful educational games of all time.
The Learning Company has added many more titles to
the Reader Rabbit series (branching out to math and
higher grade levels), which continue to be popular
educational titles in homes and schools today. Reader
Rabbit was one of the first educational gaming brands to
become a household name and with a new title for the
Nintendo Wii announced in 2011, it remains a powerful
force in the edutainment market today.
SNOOPER TROOPS GAME
According to [1] Snooper Troops was one of several
popular and successful educational titles released by
Spinnaker Software (others
included FaceMaker, Kidwriter, and The Story Machine)
in the early 1980s and is comprised of two episodes: The
Case of the Granite Point Ghost and The Case of the
Disappearing Dolphin. Players comb the streets looking
for clues, question witnesses, investigate homes while
occupants are away, and use the Snoop Net computers to
solve crimes.
[7] recorded that the games are fun, interesting, and boost
problem solving and creative thinking skills while
teaching kids how to take notes, organize information,
and expand their knowledge about police work. While the
series would be short-lived, the problem-solving game
play geared towards kids would inspire many games.
III METHODOLOGY
The educational game design and development model for
this work is based on agile game development
methodology.
IIIA THE PROPOSED SYSTEM
This new system is design at working out how best
educational computer game application can be used in
teaching most especially stack and link-list as an aspect in
data structure and algorithm.
This new system will reduce the slim less effort of
Fig. 1 The proposed methodology development process
the lecture in charge, because the game will be designed
in a way that a dullard in the class will understand the
course.
The learning package application has a home page where
the user will select the game to be played, after which a
question will be displayed to test the ability of the user.
The game is being design in a way that the user can play a
single game more than one time, just a matter of making
selection through the home page.
IIIB. FLOW CHART DIAGRAM FOR THE PROPOSED
SYSTEM
Fig 2: Flow Chart Diagram for Teaching Stack and
Linked list.
IV.RESULTS AND DISCUSSION
IVA.PROCEDURE FOR USE OF THE SYSTEM
a. Homepage
b. Selected game
c. Game displayed
d. Quiz interface
International Journal of Computer Science and Information Security (IJCSIS),
Vol. 16, No. 7, July 2018
154 https://sites.google.com/site/ijcsis/
ISSN 1947-5500](https://image.slidesharecdn.com/journalofcomputerscienceijcsisjuly2018fullvolume-180915043348/75/Journal-of-computer-science-ijcsis-july-2018-full-volume-168-2048.jpg)
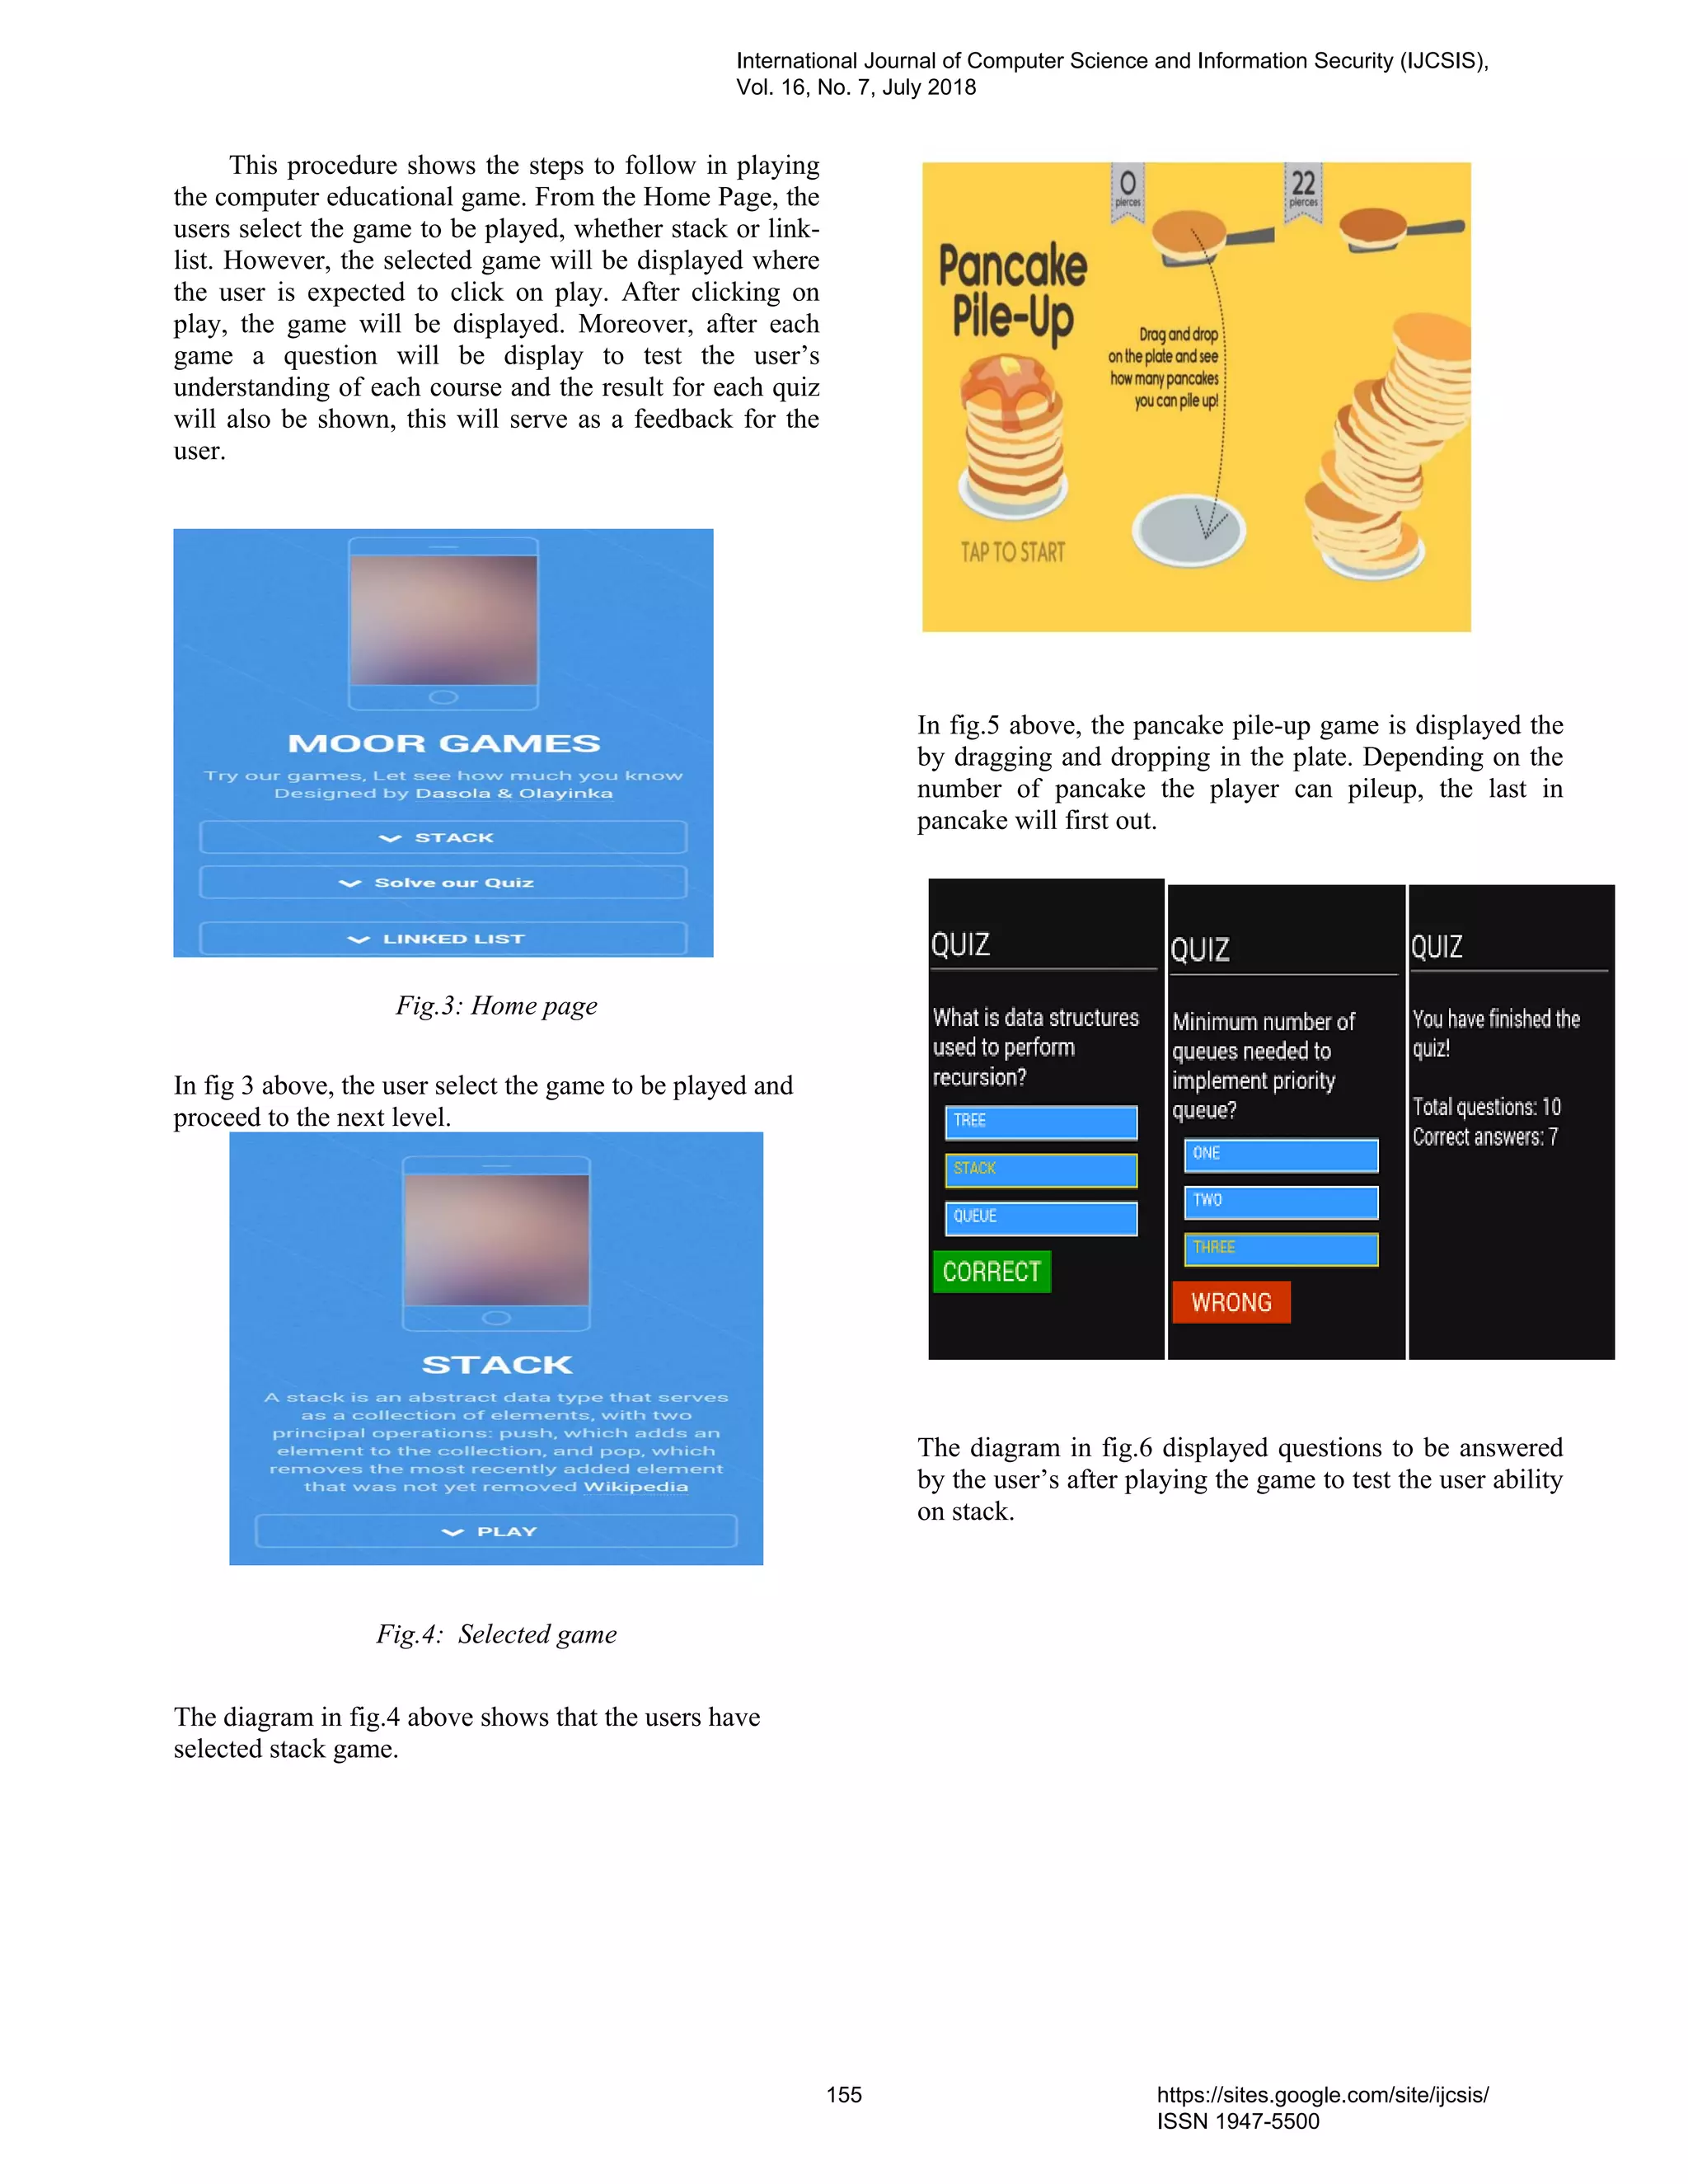
![Fig.7: Selected game
The diagram in fig.7 above shows that the users have
selected linked list game. The user can select on the play
mode.
Fig.8: Display game
In fig.8 above the snake game is displayed. The user will
tap to start by making the nodes to allocate at heap, the
nodes continue until it is explicitly de-allocated.
Fig.9: Quiz interface
The diagram in fig.9 display questions to be answered by
the user after playing the game to test the user’s ability on
linked list.
V. CONCLUSION AND RECOMMENDATIONS
The educational game for teaching stack and linked list on
data structure and algorithm has been the main focus of
this project. When it was implemented, it helps to remove
a lot of problem and explain more effective of learning for
teaching stack and linked list.
The educational game was been tested by the student after
the game has been designed properly and was confirmed
working on any android phone running (android OS 4.0
and above). This project was designed in such a way that
it will be very convenient for users to play.
We hereby recommend that
• Student should make use of the game effectively
to have positive impact on their academics.
• The lectures in charge of the course should make
use of it in the classroom for physical and better
explanation.
• Due to the time constraint, this work covers on
stack and linked list under data structure and
algorithm therefore, it is recommended that
student who which to proceed on this word
should work on other topic in data structure and
algorithm.
REFERENCES
[1] Abelson, Hal. (2001). "snooper troops ". Artificial
Intelligence Lab, Massachusetts Institute of Technology.
Retrieved August 28, 2016.
International Journal of Computer Science and Information Security (IJCSIS),
Vol. 16, No. 7, July 2018
156 https://sites.google.com/site/ijcsis/
ISSN 1947-5500](https://image.slidesharecdn.com/journalofcomputerscienceijcsisjuly2018fullvolume-180915043348/75/Journal-of-computer-science-ijcsis-july-2018-full-volume-170-2048.jpg)
![[2] Bell, R. C. (1983). "Snakes and Ladders". The
Boardgame Book. Exeter Books.
pp. 134–35.ISBN 0-671-06030-9.
[3] Black, Paul E (2004-08-16), " linked list"Dictionary of
Data structure and Algrithm.national institute of
standards and technology. Retrieved 2004-12-14.
[4] Blogger J (1998) " how game based teaching can be
implemented to enhance instruction and learning". 31,(
21-32).
[5] Blunt R (2006 ) Exploration of the Relationship
Between Game for Fun and for Educational Purpose:
Teaching Management with videos. Applied Management
and Decision Sciences; Walden university (2006)
[6] Chang M, Sinclair, Brendan (2009 ) "Learning by
Playing Game-based Learning System Design and
Development ".4th international conference on E-
learning,Edutainment 2009,Banff, Canada,August9-
11,2009, proceedings.5670.springerScience& Business
Media.
[7] Charles, M, Bustard, D, and Black, M. (2009) "Game
Inspired Tool Support for e-Learning Processes"
Electronic Journal of e-Learning Volume 7 Issue 2,
(pp101 - 110), available
online at www.ejel.org
[8] Cormen Thomas H, Leiserson Charles E, Rivest
Ronald L,( 2003 ). " Introduction to Data structure and
Algorithm " MIT Press. pp,203-209 ISBN 0-26203293-7.
[9] Dickers Seann (2001) Game-based Learning Moving
learning games forward: Obstacles,opportunities, and
openness. The Education Arcade: Massachusetts Institute
of Technology.Retrieved from
http://www.educationarcade.org/
[10] Elman, J. Incremental Learning, or the Importance of
Starting Small. Technical Report 9101, Center for
Research in Language, University of California at San
Diego. San Diego: CA, 2002.
[11] Jinny Gudmundsen, USA Today. "Reader Rabbit
hops over to the Wii." May 29, 2011. Retrieve June 7,
2011.
[12] Junjie B (2008) Categories of learning behavior. The
Cambridge handbook of multimedia learning (pp.525-
547) Cambridge New York, Melbourne. Cambridge
University Press.
[13] McGonigal (2011) " Four keys ingredients to game".
Journal of interactive learning
23(3), 51-71
[14] Moreno-Ger, .(1998) Educational game design for
online education, Computers in Human Behavior.
Retrieved from
http://merlin.germinus.com/c/document_library/get_file?f
olderId=12452&name=DLFE -2705.pdf
[15] Morrison Henry (2007) Effective learning. The
British journal of educational psychology 83:2
Newman Paul(2004) Using video games to support
science education. Retrieved April 29, 2005.
pp.14-15
[16] Parkes A (2003) “Educational game not just tools for
teaching” international computer game
association journal 31(1),pp 13-34
[17] Pritchard, D. B. (1994), "Snakes and Ladders", The
Family Book of Games, Brockhampton Press, p.
162,ISBN 1-86019-021-9
[18] Siegler, Robert S., and Geetha B. Ramani.(2003)
"Playing Linear Numerical Board Games Promotes Low-
income Children’s Numerical Development."
Developmental Science 11.5 (2008): 655-61. Web.
[19] Thompson K. and Haninger,K. (2002).“ interaction
on Video Games.” Journal of the
American Medical Association, [Online Document],
(2001 Aug), Available at: HTTP:
http://www.kidsrisk.harvard.edu/faqs3.htm.
International Journal of Computer Science and Information Security (IJCSIS),
Vol. 16, No. 7, July 2018
157 https://sites.google.com/site/ijcsis/
ISSN 1947-5500](https://image.slidesharecdn.com/journalofcomputerscienceijcsisjuly2018fullvolume-180915043348/75/Journal-of-computer-science-ijcsis-july-2018-full-volume-171-2048.jpg)
![DESIGN AND IMPLEMENTATION OF A VIRTUAL PROJECT
REPOSITORY SYSTEM
(A CASE STUDY OF FEDERAL COLLEGE OF ANIMAL HEALTH AND PRODUCTION TECHNOLOGY)
Adegbile, A.A.1
, Ayobiolaja, S.P.2
, Olanrewaju,
O.T.3
, Togun, O.A.,5
Nwufoh, C.V.6
Department of Computer Science, FCAH&PT,
Moor Plantation Apata, Ibadan, Nigeria
Email: ayotundetaiwo@gmail.com,
alibimpe@gmail.com,pelumi.togun@gmail.com,
chinonyelum.tabansi@yahoo.com
Osunade, O4
Department of Computer Science, University of
Ibadan, Nigeria
o.osunade@ui.edu.ng,
Abstract-The project work emphasizes
the application of Project Repository System to
educational administration as an alternative to
the manual method of storing past project
documents and class materials. It takes Federal
College of Animal Health and Production
Technology as a case study. However, the
application of Project Repository System focus
on the past project works of the institution with
a view to reducing the stress, errors, loss and
other damages which arises as a result of
manual method of keeping past project works in
an educational institution like Federal College of
Animal Health and Production Technology,
Ibadan in particular. This project has been
specifically carried out and presented in a
concise manner to cover the necessary
background information and to satisfy the needs
for designing a project repository system. Visual
Basic programing language and Windows form
application was used to in order to satisfy the
needs for designing a project repository system
for an institution. The software developed will
be able eradicate the difficulties experienced in
the old system and make work easier, timely,
reliable, efficient in work flow which in turn will
assist management in decision making to meet
up with global challenges of the recent age.
Keywords: Repository, Project, Educational
institution, Information
I. INTRODUCTION
The present technology age is faster moving to
the digital level and almost everyone has accessed
to the electronic versions of textbooks, projects
reports, and notes whether there are online or
offline. Many students found it difficult to have
access to past project materials due to factors
beyond their control, some of those factors may
include lack of digital content in schools etc.
A Repository System which is also referred to
as digital repository according to Larry lannom of
the Corporation for National Research Initiatives
(CNRI) is a collection of digital objects that include
text, visual materials, audio materials, video
materials stored as electronic media formats (as
opposed to print, micro form, or other media),
along with means for organizing, storing, and
retrieving the files and media contained in a library
collection. [1]., A digital repository is a mechanism
for managing and storing digital content and can be
subject or institutional in their focus. therefore,
deriving maximum value from it and in the process
supporting research, learning, and administrative
processes [7].
Reference [4]. explained that the term digital
library is used synonymously with e-library,
universal library, future library, virtual library and
library without walls.
Digital libraries can be very immense in size
and scope, and can be maintained by individuals,
organizations or can be affiliated with established
physical library buildings or institution or with
academic institutions. The electronic content may
be stored locally, or accessed remotely via
computer networks, [6]. A Project Repository
System can therefore be regarded to as a type of
information retrieval system.
II. RELATED WORKS
Reference [2]. defines a repository as a digital
archive of the intellectual product created by the
faculty, research staff, and students of an
institution.
There are different types of Project Repository
System for the diverse information needs of the
targeted group of users. Some are developed by
groups or organizations, higher education
institutions, research centers, national libraries, as
well as public libraries. They include contents that
are born digital and those that have been digitized
[3].
Reference [5]. observes that is the ability to
make efficient and effective use of information
sources, and that an information literate person
today should possess specific online searching
International Journal of Computer Science and Information Security (IJCSIS),
Vol. 16, No. 7, July 2018
158 https://sites.google.com/site/ijcsis/
ISSN 1947-5500](https://image.slidesharecdn.com/journalofcomputerscienceijcsisjuly2018fullvolume-180915043348/75/Journal-of-computer-science-ijcsis-july-2018-full-volume-172-2048.jpg)
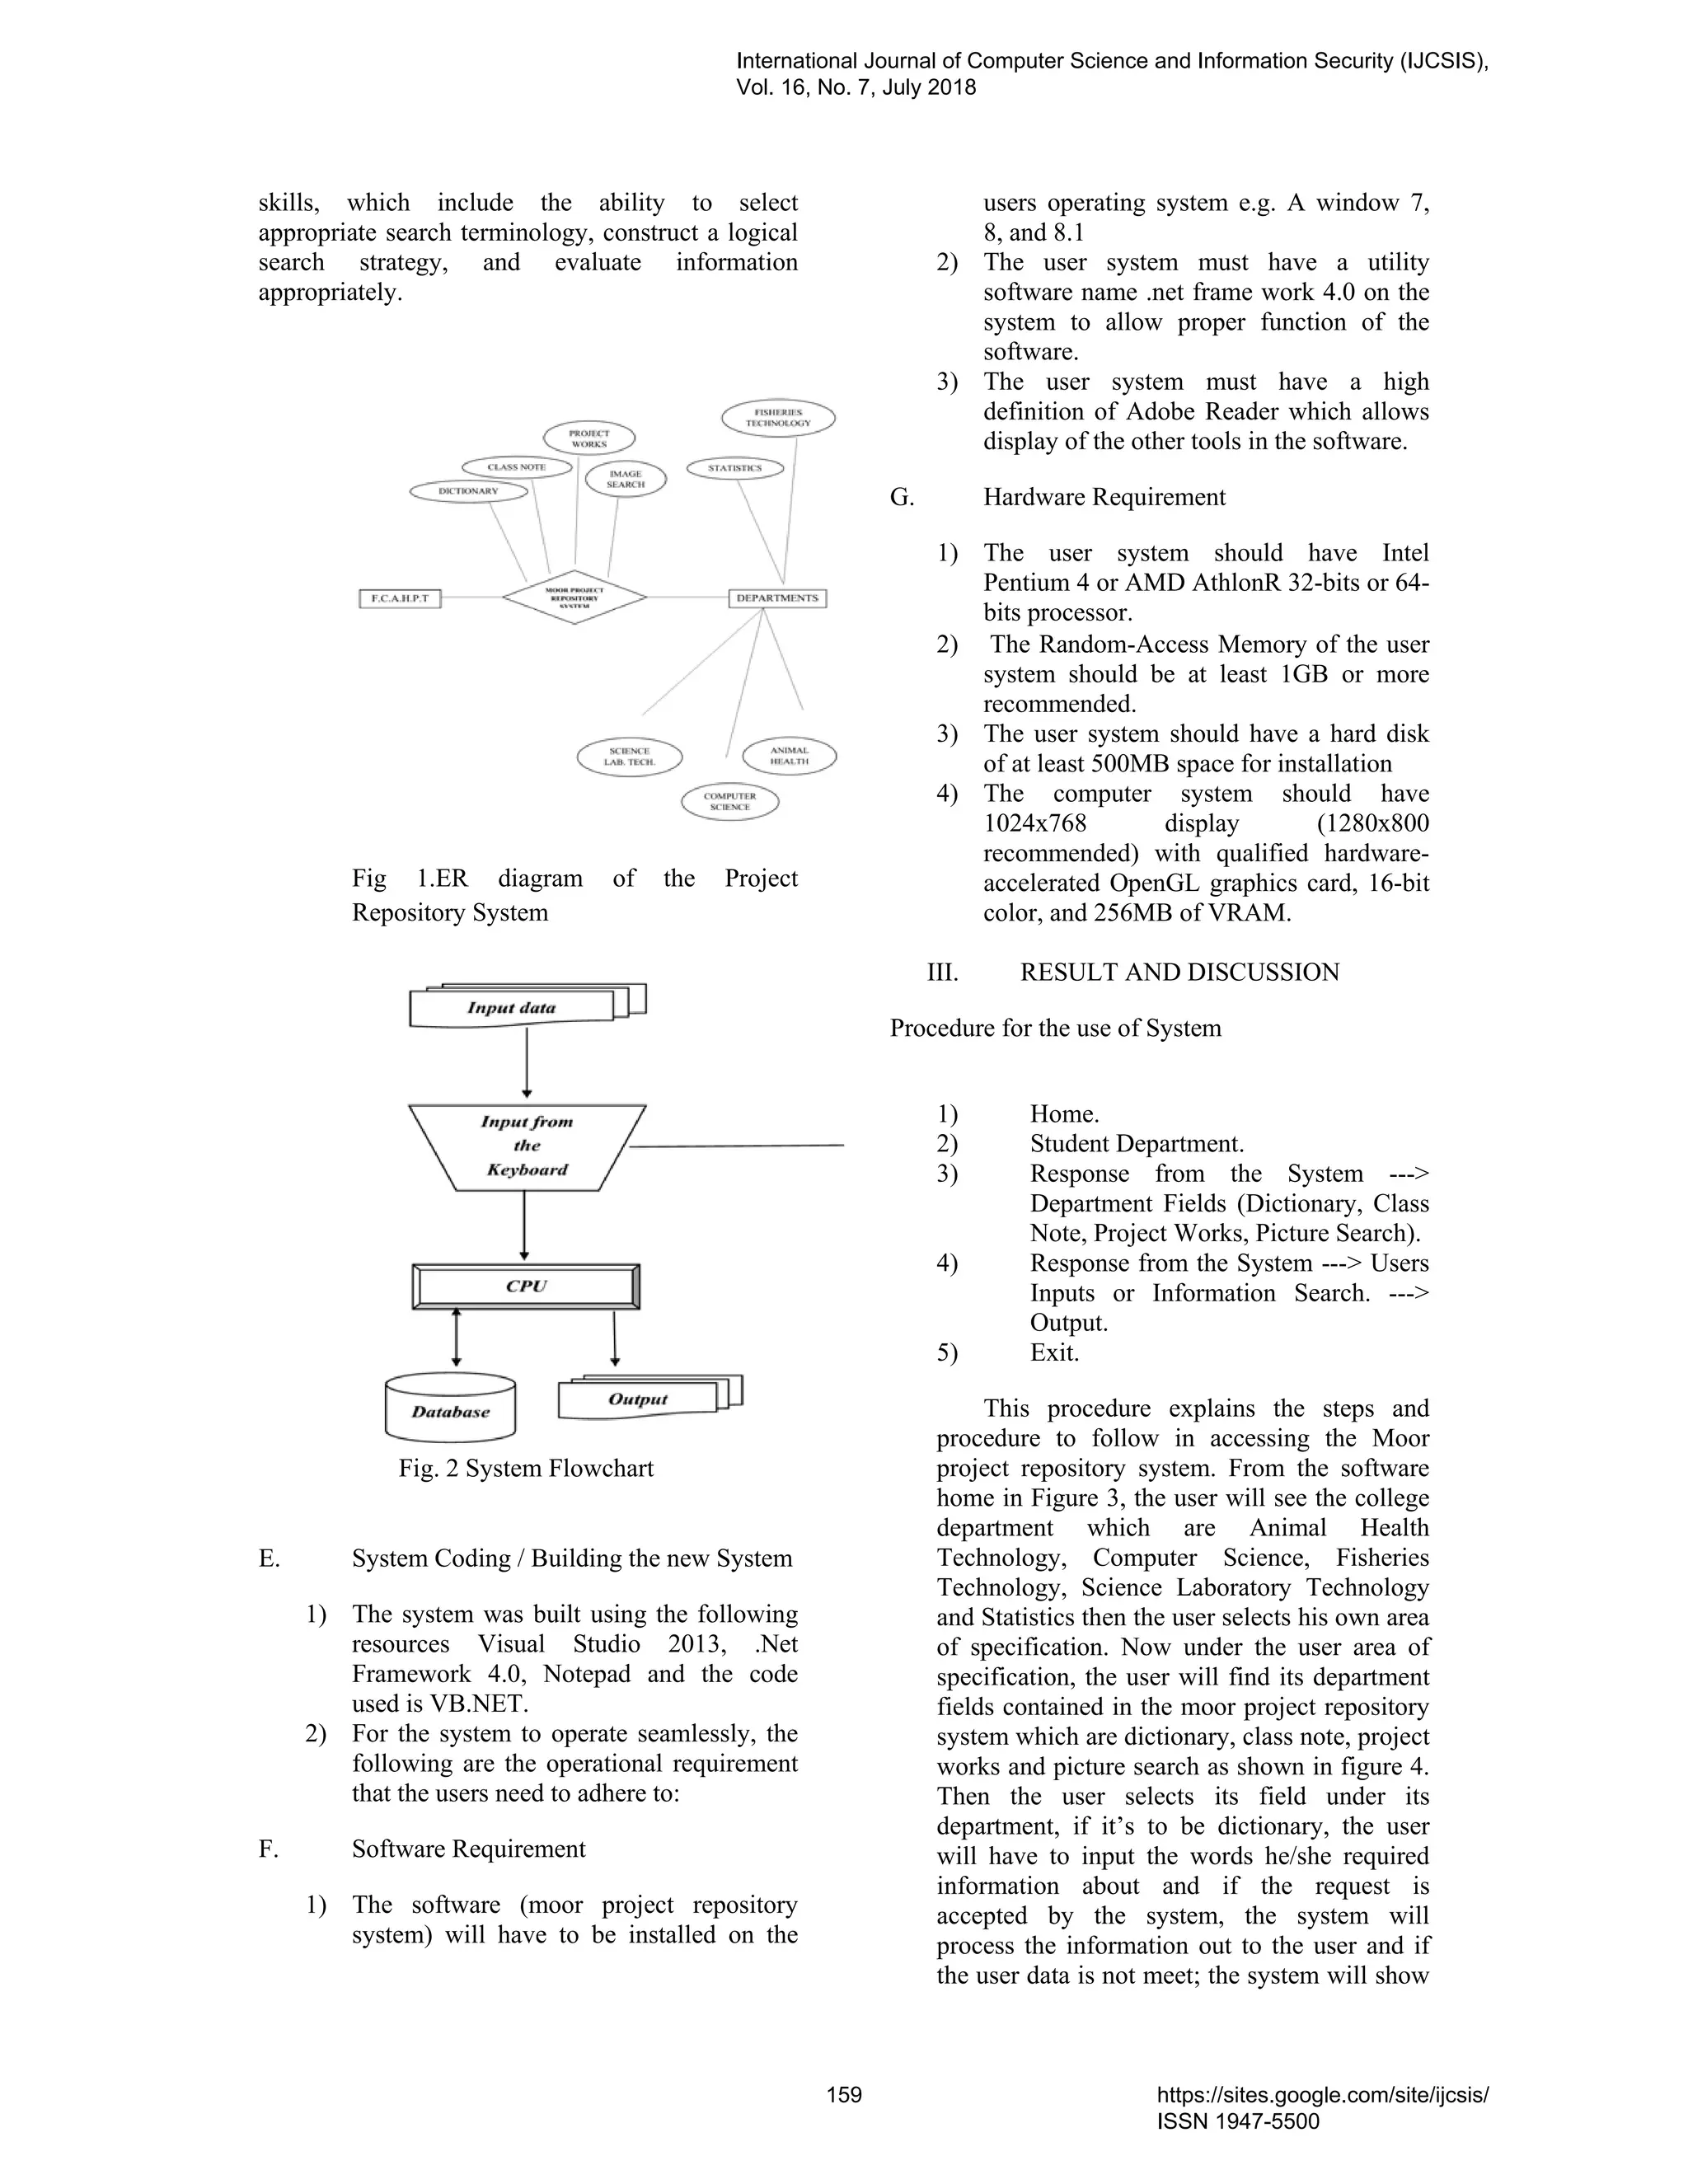
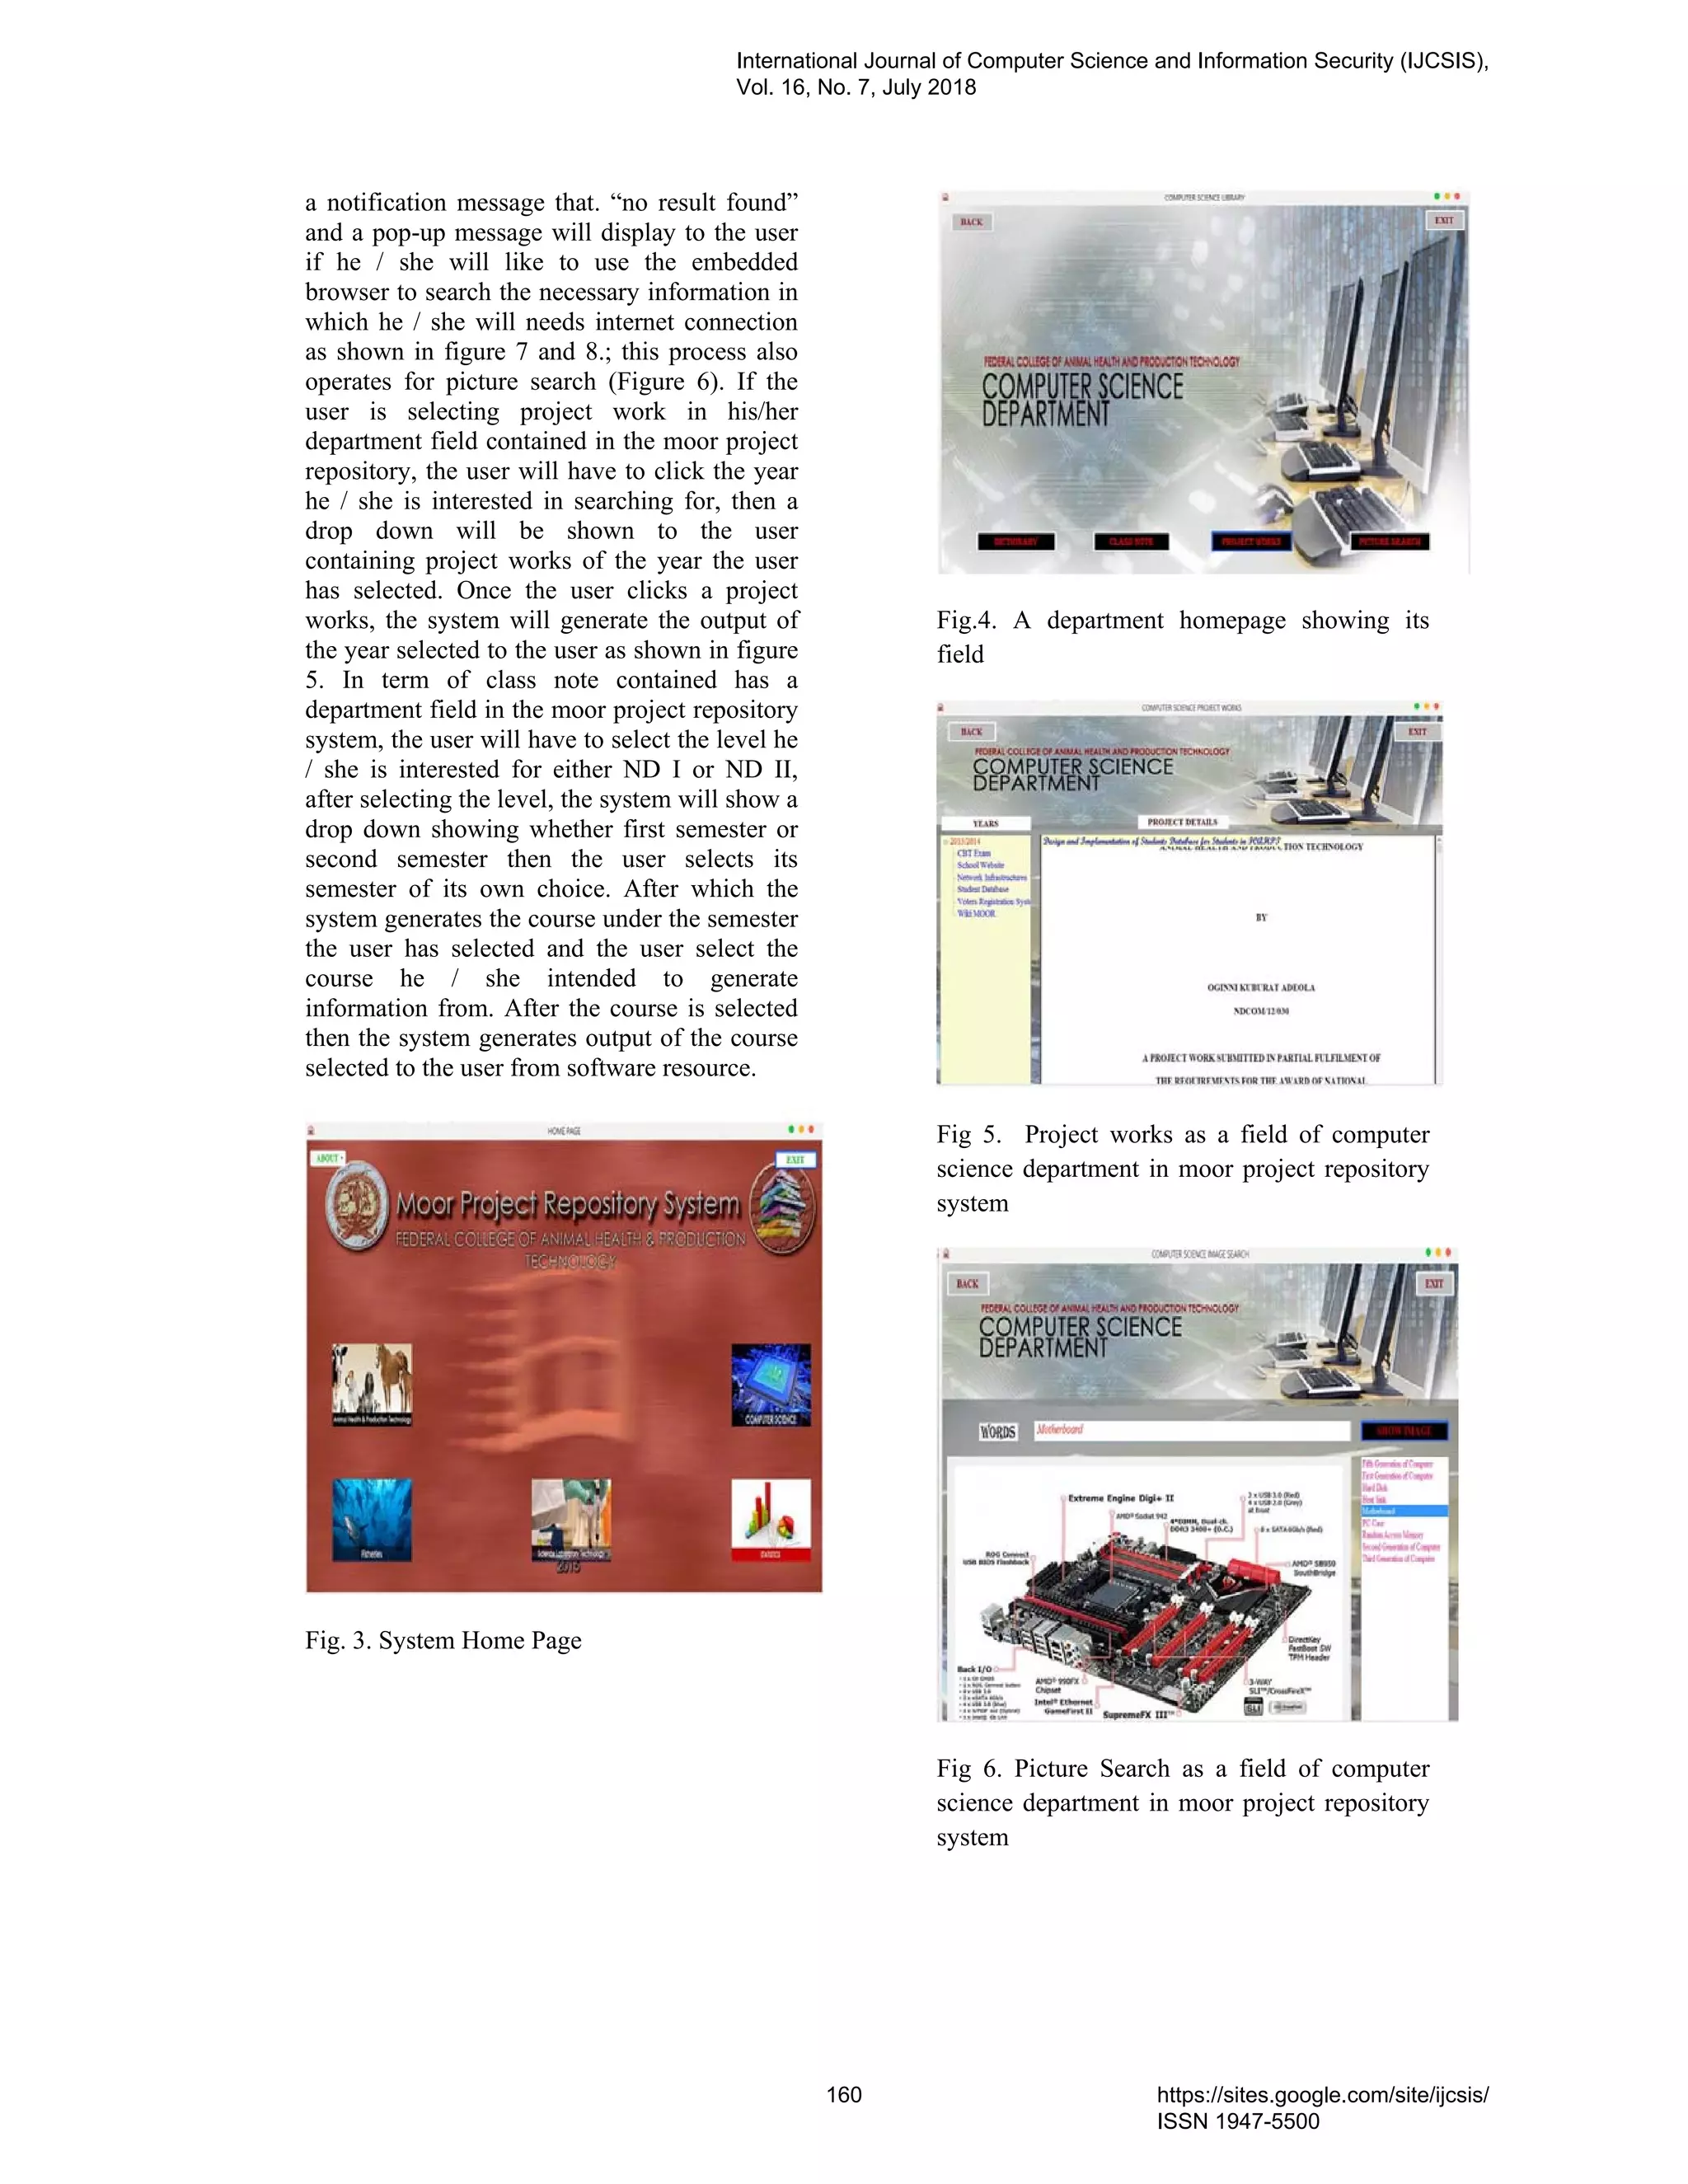
![Fig 7. Moor Project Repository System
Browser
Fig. 8 Browser embedded in moor project
repository system to display more information
if the result is not meet
IV. CONCLUSION
The overall aim of this study was to develop a
flexible and yet easy to use repository system that
will contains student project, the repository system
will assist students and their lecturers in accessing
past projects work done by the graduating students
in the National Diploma programme.
The design and implementation of a project
repository system for the Federal College of
Animal Health and Production Technology, Moor
Plantation Ibadan has provided a solution to most
of the challenges encountered in keeping hardcopy
of past project works done by the students and also
aided in the process of digitization of student’s
project work.
This repository system tool is expected to impact
positively on the process of digitization of student’s
projects write up in the school and other places
where there may be needed. The system helps
librarians and other people that are concern with
the process of digitization and making project
writeup more accessible to students.
References
[1] Akst, D. (2003). The Digital Library: Its
Future Has Arrived. Carnegie Reporter , 2(3), 4-8.
[2] Crow, R. (2002). The case for institutional
repositories: a SPARC position paper. Washington,
D.C.: Scholarly Publishing & Academic Resources
Coalition. Available at: http://www.arl.org/sparc/IR
/ir.html
[3] Digital library (2009), in Wikipedia, The
Free Encylopedia, retrieved from
http://en.wikipedia.org/w/index.php?title=Digital_li
brary&oldid=272431571
[4] Issa, A.O., Amusan B., and Daura, U.D.
(2009). Effects of Information Literacy Skills on
the Use of eLibrary Resources among Students of
the University of Ilorin, Kwara State,
Nigeria(2009). Library Philosophy and Practice (e-
journal). page 245. Retrieved http://digitalcomm
ons.unl.edu/libphilprac/245
[5] Julien , H. (2002). Use of Information,
Encylopedia of Communication and
Information.USA: Macmillan Reference page
1051-1056.
[6] Lanagan, Smeaton, james, Alan F . (2017).
Video digital libraries: contributive and
decentralized". Springer: page 273–284.
[7] Repositories Support Project (RSP)
(2017), What is a repository? Retrieved from
http://www.rsp.a c.uk/start/before-you-start/w hat-
is-a-repository/ on the 27 of February, 2018
International Journal of Computer Science and Information Security (IJCSIS),
Vol. 16, No. 7, July 2018
161 https://sites.google.com/site/ijcsis/
ISSN 1947-5500](https://image.slidesharecdn.com/journalofcomputerscienceijcsisjuly2018fullvolume-180915043348/75/Journal-of-computer-science-ijcsis-july-2018-full-volume-175-2048.jpg)
![Anonymous Safe Routing Scheme for Compromised
Network Environment
William Asiedu
Department of information Technology Education
University of Education, Winneba
Kumasi Campus, Ghana
asiedu2@gmail.com
Dr. Rajan John
College of Computer Science
Jazan University
Jazan, Kingdom of Saudi Arabia
rsubbaiah@jazanu.edu.sa
Abstract— The security of communication in Ad hoc wireless
networks is very vital, particularly in military applications.
Providing security in MANET has been a great issue since these
nodes have a lot of constraints. Hiding the identity of nodes that
participate in routing will be the most efficient and reliable way
of ensuring packet delivery. This paper proposes a protocol that
stops strong adversaries from tracing a packet flow from source
to destination and compare it to other existing anonymous
routing protocol which based on hop-to-hop encryption. This
protocol also inhibits attackers or compromised nodes from
interfering with uncompromised routes made up of
uncompromised nodes and prevents many types of Denial of
service attacks.
Keywords-communication; security; anonymouse; denial of
service attacks; MANET
I. INTRODUCTION
Designing a foolproof security protocol for an ad hoc
wireless network is an exceptional task. This is largely as a
result of some distinctive features of ad hoc wireless
networks[1]. The operating environments where ad hoc
wireless networks are utilized might not always be secure. One
vital use of such network is in war zones. The system topology
in an ad hoc wireless network is extremely dynamic because of
the movement of nodes, therefore, an on-going session’s
regular path breaks. Interruption happens either because of the
movement of the intermediate nodes in the path or because of
the movement of end nodes. Such conditions do not happen
due to dependable links in wired networks. Although the wired
network protocols discover alternative routes during breaks,
their convergence occurs slowly. Hence, wired network routing
protocols to be utilized in ad hoc wireless networks where the
movement of nodes lead to recurrently changing network
topologies. Routing protocols for ad hoc wireless networks
should be able to carry out efficient and effective mobility
management [2]. The broadcast nature of the radio channel
presents peculiar issues in ad hoc wireless networks. The
wireless links possess time-varying features in relation to link
capacity and link-error possibility. This necessitates that the ad
hoc wireless network routing protocol communicates with the
MAC layer to discover alternative routes through better-
quality links. Likewise, transmissions in ad hoc wireless
networks lead to clash of data and control packets. This is
ascribed to concealed terminal issues [1]. Therefore, it is
necessary that ad hoc wireless network routing protocols
discover routes with less traffic [3].
Moreover, in wireless networks, the radio band is restricted
and therefore, the data levels it can provide are lesser than the
amount a wired network can give. This necessitates that the
routing protocols utilize the bandwidth optimally by ensuring
that the overhead is as low as possible. The restricted
bandwidth availability also places a limitation on routing
protocols in keeping regular topological information. Owing to
the regular alterations in topology, keeping consistent
topological information at all the nodes involves more control
overhead which leads to the wasting of more bandwidth.
II. RELATED WORK
Many studies have suggested protected routing protocols. For
instance, Pathak [4] suggested the flooding NPBR, an on
demand protocol developed for wired networks that floods
each packet via the network. Flooding NPBR allots a fraction
of the bandwidth beside every link to every node and utilizes
digital signatures to verify all packets. However, this protocol
possesses high overhead with regard to the computational
resources required for digital signature authentication and in
relation to the bandwidths it requires. Also, estimation and
guarantee of available bandwidth in a wireless environment is
complicated [5].
Other wired network protocols possess safe or protected
periodic routing protocols with asymmetric cryptography, like
Defray et al. [6], Pathak’s link-state NPBR, Hu’s secure link
state protocol [7], and Hubaux et al. [8, 9]. Nevertheless, nodes
in an ad hoc network might not have enough resources to
authenticate an asymmetric signature; specifically, a hacker can
trivially flood a victim with packets which contain invalid
signatures, but authentication can be excessively expensive for
the victim. Additionally, these protocols might suffer in some
cases as periodic protocols might not be able to handle the high
levels of movement in an ad hoc network. Similarly, Hubaux
analyzes threats to both distance-vector protocols and link-state
protocols and defines procedures for protecting distance-vector
protocols. Nevertheless, these procedures are susceptible to the
compromise of just one node.
Beresford and Stajano [12], X. Wu [10], and El-Khatib et al.
[14] suggest the utilization of asymmetric cryptography to
International Journal of Computer Science and Information Security (IJCSIS),
Vol. 16, No. 7, July 2018
162 https://sites.google.com/site/ijcsis/
ISSN 1947-5500](https://image.slidesharecdn.com/journalofcomputerscienceijcsisjuly2018fullvolume-180915043348/75/Journal-of-computer-science-ijcsis-july-2018-full-volume-176-2048.jpg)
![protect ondemand ad hoc network routing protocols.
Nonetheless, as indicated above, when the nodes in an ad hoc
network are usually not able to authenticate asymmetric
signatures fast enough, or when the network bandwidth is not
enough, these protocols might not be appropriate. Zhu [11],
Ratnasamy et al. [15], and Raymond [16] describe symmetric-
key approaches to the validation of link-state updates; however,
they do not discuss techniques for the detection of the status of
these links. In wired networks, a common procedure for
verifying HELLO packets is to confirm that the incoming
network’s interface is the anticipated interface and that the IP
TTL of the packet is 255. In a wireless ad hoc network, this
procedure cannot be utilized. In addition, these protocols take
up the utilization of periodic routing protocols, which are not at
all times appropriate in ad hoc networks. Wu [20] utilizes
cryptographic techniques similar to the ones utilized in Ariadne
with TESLA but positively integrates routing data before it is
verified, which seriously affects security.
Several other studies have similarly suggested the utilization
of symmetric schemes for verifying routing control packets.
Hong [18] suggests a technique which requires shared keys
between all communicating routers. This technique might not
scale to huge ad hoc networks and might be open to single-
node compromise. Camp et al. [17] utilizes symmetric
primitives to protect routing between nodes and a reliable base
station. Mokbel et al. [21] utilize a network-wide symmetric
key to protect routing communication that is open to single
node compromises, even though they specify the utilization of
secure hardware to reduce the harm that can be caused by a
compromised node. Xue,Li and Nahrstedt [23] have developed
a mechanism that offers protection against non-colluding
attackers, and they do not verify intermediate nodes which pass
on route requests, and therefore, do not run authorization.
Jannotti et al. [22] analyze challenges related to authorization.
SEAD [26] utilizes hash chains to verify routing updates sent
by a distance-vector protocol; nonetheless, that method builds
on a periodic protocol, and protocols like that are likely to have
higher overhead than on-demand protocols and might not
therefore be appropriate in highly mobile networks. A previous
version of the Ariadne protocol was discussed in [22]. In
addition, Routing protocol intrusion detection has been
analyzed as a technique for the detection of malfunctioning
routers [7, 11, 24].
III. THREATS IN MOBILE NETWORKS
There are many different forms of attacks against MANETs,
therefore, in this section, we do not attempt to give a
comprehensive list of all mobile routing attacks. We based on
few ones that have direct effect on this research.
A. Black Hole:
This form of attack is generally performed against reactive
protocols through the injection of route reply which
advertises the attacker as possessing the shortest path,
which compels the data flow to pass by the attacker so as
to alter or simply to listen in on the exchanged traffic [15].
It can also be utilized to make the attacker appear as the
actual node.
B. Replay:
The attacker introduces into the network routing
information that had been taken earlier to disturb the
functioning of routing in the network or to promote the
attacker as an authentic node and execute a black hole
attack [12]. This attack can only be performed against
poorly developed routing protocols since any extra security
mechanism such as digital signature can end this attack.
C. Blackmail:
This attack is carried out against routing protocols that are
based on node behaviour to detect malicious nodes [16],
which are saved in a black list to be utilized for route
selection. The attacker normally creates such messages
against real nodes. A mechanism of digital signature and
PKI are useful against these attacks.
D. Routing table poisoning:
This attack is carried out against table driven routing
protocols, in the manner that the attacker diffuses false
routing data to its neighbours so as to interfere with or
block the traffic over the network. In addition, the attacker
can introduce fabricated routing information to entice all
the network activity to him so as to alter or just listening to
the data flow [16].
E. Denial of service attacks:
These attacks attempt to stop the activity on the network
by disrupting the routing function in the network [17].
IV. SECURING ROUTING PROTOCOLS
Available studies indicate that there are many techniques
for securing routing protocols by including new security
challenges over existing routing techniques utilized by these
protocols. In this part of the study, a summary of some secured
routing protocols is provided:
A. The Secure Routing Protocol (SRP):
is a set of security extensions which can be used in any ad
hoc routing protocol that uses broadcasting as its route
querying technique [18]. It utilizes a security connection
between the source and the destination so as to share a secret
key to encrypt traffic over the discovered path.
International Journal of Computer Science and Information Security (IJCSIS),
Vol. 16, No. 7, July 2018
163 https://sites.google.com/site/ijcsis/
ISSN 1947-5500](https://image.slidesharecdn.com/journalofcomputerscienceijcsisjuly2018fullvolume-180915043348/75/Journal-of-computer-science-ijcsis-july-2018-full-volume-177-2048.jpg)
![B. The Authenticated Routing for Ad hoc Networks (ARAN):
suggested in [19], is a stand-alone solution to secure on
demand routing protocols in ad hoc networking utilizing
asymmetric cryptography and certificates to guarantee both
verification and non-repudiation. It requires the presence of a
trusted certificate authority to provide certificates.
C. Secure Ad hoc On-demand Distance Vector (SAODV):
is a security extension used in the AODV protocol [7]. The
recommended extensions use digital signatures and hash
chains so as to protect route discovery by the application of a
digital signature on particular fields of the header of routing
packets, the aim of this suggestion is to guarantee the
authentication of the discovered routes.
D. The Secure Link State Routing Protocol (SLSP):
has been proposed in [21] to give safe proactive routing
for mobile ad hoc networks. It protects the detection and the
supply of link state information utilizing public key
cryptography in order to circumvent the burden because of the
deployment of a certificate authority; nodes communicate their
certificate during flooding routing information which ensures
the verification of routing messages.
V. PUBLIC KEY INFRASTRUCTURE (PKI)
A PKI is a set of mechanisms which take care of digital
certificates as publishing, distributing, renewing and
cancellation in a given community or network. A PKI is
basically made up of Certificate Authority (CA), Registration
Authority (RA) and Certificate Revocation List (CRL).
Contingent on the application and the setting where a PKI is
sent all or just a subset of these elements are utilized. The most
vital element of a PKI is the certificate authority since it is the
trusted party which signs and authenticates certificates. A
certificate is an electronic document which ties pieces of
information (name, serial numbers, address, IP and MAC
address) signed by the certificate authority. The present version
of certificate is X.509 V3, nevertheless, based on the
requirement of each system new fields can be added to permit a
perfect identification within the community. For instance, in a
wireless ad hoc network, an IP or MAC address [13] can be
added to be utilized so as to directly localize the corresponding
node without using other servers or infrastructure.
PKI is perceived as the most effective tool for provision of
authentication and nonrepudiation in conventional networks.
However, the provision of such infrastructure for MANETs is a
challenging mission because of the nature of these networks.
Many studies propose several solutions like partially
distributed certification suggested in [22] and completely
distributed certification proposed in [23]. Nevertheless, present
studies propose solutions that exploit some new features like
clustering so as to make the management of PKI services easier
[13].
To secure routing protocols in MANETs it appears that PKI
is a very great tool to guarantee verification and data integrity
utilizing digital signature. Nonetheless, the challenge is how to
issue certificates and how to keep them safe.
The proposed scheme in this paper attempts to utilize the
underlying routing protocol thought to be reactive as a support
for certificate publishing. In the manner that the route
discovery and reply mechanisms are utilized to publish
certificate within the entire network; the route discovery is
flooded over the whole network which guarantees that the
certificate is known by all nodes in the network with the least
overhead.
VI. DESIGN ELEMENTS
• Zone Leader: These nodes create a key and share it
with other nodes to form a zone. General accessibility
of location information: every node will be fortified
with a device that is able to obtain position
information. In addition, it is in charge of the
administration of the group; introducing the group and
controlling who joins and leaves (revocations).
Likewise, it is in charge of revealing the owner of a
signature in the event of a dispute.
• Group Members: users/entities that stand for the
present set of authorized signers. Every member
should have a unique private key which enables the
member to sign on behalf of the group.
VII. ANONYMOUS ROUTING
The proposed secure anonymous routing protocol is made up of
two parts: the route construction phase and the data transfer
phase.
A. Route construction phase
The simple approach of this protocol during the route creation
phase is to create a route by flooding RouteRequest packets in
the network.
Location-aid routing protocol [5] uses the location information
to improve on the effectiveness of routing by the reduction of
the control overhead. LAR takes up the accessibility of the
global positioning system (GPS) to obtain the geographical
position information required for routing. LAR assigns two
geographical regions for selectivity forwarding of control
packets known as ExpectedZone and RequestZone. The
ExpectedZone is the location where the destination node is
required to be available, providing information in relation to
its location in the past and its mobility information. In case of
non-availability of the past information about destination, the
whole network area is thought to be the ExpectedZone of the
destination. Likewise, with the accessibility of more data
about its mobility, the ExpectedZone of the destination can be
fixed with more accurately and efficiency enhanced. The
RequestZone is a geographic area within which the route
discovery control packets are allowed to be circulated. This
region is decided by the sender of a data transfer session. The
control packets utilized for route discovery are sent by nodes
which are available in the RequestZone and are disposed of by
nodes outside the zone. In circumstances where the sender or
the intermediate relay nodes are absent from the RequestZone,
an extra zone is add for forwarding the packets. This is done
when the initial attempt to obtain a route to a destination
International Journal of Computer Science and Information Security (IJCSIS),
Vol. 16, No. 7, July 2018
164 https://sites.google.com/site/ijcsis/
ISSN 1947-5500](https://image.slidesharecdn.com/journalofcomputerscienceijcsisjuly2018fullvolume-180915043348/75/Journal-of-computer-science-ijcsis-july-2018-full-volume-178-2048.jpg)
![utilizing the first RequestZone does not yield a route within an
adequately long waiting period. In this instance, the second
attempt repeats the procedure with a bigger RequestZone size
to account for mobility and error in location estimation.
For instance, when the source node S needs to interact with the
intended destination node D, it must create a secure
anonymous route between them in the network and then data
traffic can be securely transmitted on the route.
1) The RREQ in source node:
Source node S generates a key pair (pk, sk) and random
number rS before it interacts with destination node D. It is
assumed that the localized trust management has separated
trust nodes and circulated trust key K to them. Likewise, it is
assumed that sk will be known by all the zone leaders. At this
point node S will communicate a route request (RREQ)
message to all of its neighbors and fills ”null” in the zone
leader node field of its route table. The message will be gotten
by the leader in that zone. In other words, the zone leaders will
decrypt the message to identify whether the destination node is
within its zone.
There are two features in the proposed protocol:
• The whole RREQ message is encrypted with trust key
before the node sends the RREQ.It ensures that a
malignant node cannot take part in the path-finding.
Although the localized trust management has
quarantined malignant nodes from the network, the
circumstance must be considered as a node that had
been previously confirmed as trusted has been seized
by an enemy and its neighbors or central nodes do not
know about that. It is serious whenever on the
processes of route establishment or data transfer.
Nevertheless, since trust key is distributed from time to
time and malicious nodes cannot determine the trust
key K of this session, it cannot decode a received
message and take part in the protocol.
• When a trust node receives the RREQ, it transmits
Hello message to its zonal leaders within the message
expiration time e. The aim of this is to verify that it is a
trust node to its zonal leader. This phase together with
the encryption of the whole RREQ message can
completely bar malicious nodes and shield attacks.
Fig1: network topology
2) The intermediate node:
As presented in Fig.1, when the intermediate nodes get the
RREQ, it passes through the following process:
• Check if the intermediate node has the trust key to decode
the message, if this is the case, it is a trusted node as Z.
• Without the trust key, the intermediate node is deemed a
malicious node and cannot transmit Hello message to its
leader node within the time e. At the end of the waiting period,
the leader marks this specific node as a malicious node and
notifies its central nodes, then the node is separated from the
network.
3) The RREQ in destination node: Decrypting
Node D discovers that it is the intended destination node and
forwards Hello message to its zone leader. Here, the leader
can identify the route. Also, it can identify the shortest route
between the two nodes. The zone leader will encrypt the route
to the source node.
B. How it works
It is computationally simple for a party S to generate a pair
(public key sk, private key pk).
It is computationally simple for a sender S knowing the public
key and the message to be encrypted, M, to generate the
corresponding ciphertext
Χ= Ε(σκ, Μ) (1)
It is computationally simple for the receiver D to decode the
resultant ciphertext utilizing the private key to retrieve the
original message:
M= D(pk, C)=D[pk,E(sk,M)] (2)
It is computationally not possible for an attacker which knows
the public key sk to define the private key pk
It is computationally not possible for an attacker which knows
the public key sk and a ciphertext C to retrieve the original
message, M.
These are difficult requirements as is evident by the fact that
just some algorithms (RSA, elliptic curve cryptography, Diffie
Hellman, DSS) have been widely accepted in over the decades
since the notion of public key cryptography was proposed.
Fig. 2 Different node density
z
z
z
z
S
D
International Journal of Computer Science and Information Security (IJCSIS),
Vol. 16, No. 7, July 2018
165 https://sites.google.com/site/ijcsis/
ISSN 1947-5500](https://image.slidesharecdn.com/journalofcomputerscienceijcsisjuly2018fullvolume-180915043348/75/Journal-of-computer-science-ijcsis-july-2018-full-volume-179-2048.jpg)
![Fig. 3 Different moving speed
VIII. PERFORMANCE EVALUATION
In this area, empirical valuation of the scheme was done,
which shows uniformity with the analytical results. The
proposed scheme shows more superior performance in
providing anonymity with low computation cost overhead.
The performance of the proposed scheme is compared with
two recently proposed anonymous geographical routing
protocols: AO2P [10] and ALARM [5], which are supported
on hop-by-hop cryptography and redundant traffic. The
proposed scheme, AO2P and ALARM are all based on
geographic routing, therefore, the present scheme is compared
with the baseline routing protocol GPSR[15] in its evaluations.
In GPSR, a packet is forwarded to the nodes close to the
direction of destination node.
When close nodes are not available, GPSR utilizes perimeter
furtherance to discover nodes that are very close to the
destination device. In ALARM also, nodes frequently send
and receive information about their current position on the
network with its true neighbors. Therefore, the nodes are able
to build good map for geographical routing. During routing
processes, each node encrypts the packet using its key which
can be substantiated by the true neighbors (next hop).
In AO2P, the protocol has a contention phase in which the
neighboring nodes of the current packet holder will try to be
the next hop. AO2P uses contention phase to group nodes
based on their distance from the destination node and choose a
node in the group that is closer to the destination node.
Fig. 2 shows the performance of our scheme, ALARM, AO2P,
and GPSR at different delivery rate. We can observe that the
delivery rate all close to 1, the in the sparse settings where
node density is 50 nodes/km2. in In Fig. 16b, when there is
destination update, the scheme and other protocols can also
maintain a delivery rate steadily with different node moving
speeds from 2 to 8 m/s.
Fig 4 demonstrate the performance of end-to-end delay versus
mobility. The figure shows that our scheme has lower end-to-
end delay. During light traffic load of 2 packets/second our
scheme’s delay increases from 0.1ms to 0.75ms when node
speed increases from 0m/s to 10m/s but other protocols have
longer latency.
Fig. 4 End-to-End delay Vs Mobility
Fig. 5 illustrates the routing cost for delivery a unit of data
payload. Our scheme has less overhead than AO2P, ALARM
and GPSR because we based on one-time cryptographic
encryption.
Fig. 5 Routing packet Overhead
Fig. 6 Throughput vs Mobility
International Journal of Computer Science and Information Security (IJCSIS),
Vol. 16, No. 7, July 2018
166 https://sites.google.com/site/ijcsis/
ISSN 1947-5500](https://image.slidesharecdn.com/journalofcomputerscienceijcsisjuly2018fullvolume-180915043348/75/Journal-of-computer-science-ijcsis-july-2018-full-volume-180-2048.jpg)
![In terms of throughput, our scheme provides a better
throughput than other protocols as shown in fig. 6. The
throughput decreases as node speed increases in all the
protocols.
IX. SIMULATION
The random way point model [17] is used as the default
settings and set the environment range of every group to 150m
with 10 groups[8] and 200m with five groups.
The test was done on NS2 simulator utilizing 802.11 as MAC
protocol with a standard wireless transmission range of 250 m
and UDP/CBR traffic [16] with a packet size of 512 bytes. The
field in the trial was set to a 1000m X 1000 m area with 200
nodes moving at a speed of 2 m/s. The concentration was set
to 50, 100, 150, and 200 nodes per square meters. The length
of every simulation was set to 100 s. The number of pairs of S-
D communication nodes was set to 10 and S-D pairs were
randomly produced. S transmits a packet to D at an interval of
2 s. The final results are the average of results of 30 runs. For
encryption, the symmetric encryption algorithm is AES and
the public key encryption is RSA. Data are produced randomly
based on the packet size indicated in the paper. Packets are
encrypted whenever necessary. The encryption algorithm is
single threaded running besides other parts of the experiment
on a 1.8 Ghzprocessor. A typical symmetric encryption costs
quite a few milliseconds while public key encryption operation
costs 2-3 hundred milliseconds.
X. CONCLUSION
This study has highlighted the design and assessment of our
scheme, a new safe ad hoc network routing protocol. This
scheme offers protection against a compromised node and
arbitrary active attackers. It depends on solely on effective
symmetric cryptographic processes. It also runs on-demand,
dynamically finding paths between nodes only as required.
The model is centered on the simple operation of the DSR
protocol. Instead of the application of cryptography to an
existent protocol to attain protection, this study cautiously
recreated each protocol message and its processing. The
protection techniques which were developed are very effective
and general. This is so that they can be used to secure different
types of routing protocols.
However, due to the fact that the optimizations of DSR in our
scheme were not secured, the subsequent protocol is not as
effective as the much optimized version of DSR that runs in a
trustworthy environment
REFERENCES
[1] A. Pfitzmann, M. Hansen, T. Dresden, and U. Kiel, “Anonymity,
Unlinkability, Unobservability, Pseudonymity, and Identity Management
a Consolidated Proposal for Terminology, Version 0.31,” technical
report, 2005.
[2] Sk.Md.M. Rahman, M. Mambo, A. Inomata, and E. Okamoto, “An
Anonymous On-Demand Position-Based Routing in Mobile Ad Hoc
Networks,” Proc. Int’l Symp. Applications on Internet (SAINT), 2006.
[3] Z. Zhi and Y.K. Choong, “Anonymizing Geographic Ad Hoc Routing
for Preserving Location Privacy,” Proc. Third Int’l Workshop Mobile
Distributed Computing (ICDCSW), 2005.
[4] V. Pathak, D. Yao, and L. Iftode, “Securing Location Aware Services
over VANET Using Geographical Secure Path Routing,” Proc. IEEE
Int’l Conf. Vehicular Electronics and safety (ICVES), 2008.
[5] K.E. Defrawy and G. Tsudik, “ALARM: Anonymous Location- Aided
Routing in Suspicious MANETs,” Proc. IEEE Int’l Conf. Network
Protocols (ICNP), 2007.
[6] K.E. Defrawy and G. Tsudik, “PRISM: Privacy-Friendly Routing in
Suspicious MANETs (and VANETs),” Proc. IEEE Int’l Conf. Network
Protocols (ICNP), 2008.
[7] Y.-C. Hu, A. Perrig, and D.B. Johnson, “Ariadne: A Secure On-
Demand Routing Protocol for Ad Hoc Networks,” Wireless Networks,
vol. 11, pp. 21-38, 2005.
[8] I. Aad, C. Castelluccia, and J. Hubaux, “Packet Coding for Strong
Anonymity in Ad Hoc Networks,” Proc. Securecomm and Workshops,
2006.
[9] C.-C. Chou, D.S.L. Wei, C.-C. Jay Kuo, and K. Naik, “An Efficient
Anonymous Communication Protocol for Peer-to-Peer Applications over
Mobile Ad-Hoc Networks,” IEEE J. Selected Areas in Comm., vol. 25,
no. 1, pp. 192-203, Jan. 2007.
[10] X. Wu, “AO2P: Ad Hoc On-Demand Position-Based Private Routing
Protocol,” IEEE Trans. Mobile Computing, vol. 4, no. 4, pp. 335-348,
July/Aug. 2005.
[11] B. Zhu, Z. Wan, M.S. Kankanhalli, F. Bao, and R.H. Deng,
“Anonymous Secure Routing in Mobile Ad-Hoc Networks,” Proc. IEEE
29th Ann. Int’l Conf. Local Computer Networks (LCN), 2004.
[12] A.R. Beresford and F. Stajano, “Mix Zones: User Privacy in Location-
Aware Services,” Proc. IEEE Second Ann. Conf. Pervasive Computing
and Comm. Workshops (PERCOMW), 2004.
[13] X. Wu, J. Liu, X. Hong, and E. Bertino, “Anonymous Geo-Forwarding
in MANETs through Location Cloaking,” IEEE Trans. Parallel and
Distributed Systems, vol. 19, no. 10, pp. 1297-1309, Oct. 2008.
[14] K. El-Khatib, L. Korba, R. Song, and G. Yee, “Anonymous Secure
Routing in Mobile Ad-Hoc Networks,” Proc. Int’l Conf. Parallel
Processing Workshops (ICPPW), 2003.
[15] S. Ratnasamy, B. Karp, S. Shenker, D. Estrin, R. Govindan, L. Yin, and
F. Yu, “Data-Centric Storage in Sensornets with GHT, a Geographic
Hash Table,” Mobile Network Applications, vol. 8, no. 4, pp. 427-442,
2003.
[16] J. Raymond, “Traffic Analysis: Protocols, Attacks, Design Issues, and
Open Problems,” Proc. Int’l Workshop Designing Privacy Enhancing
Technologies: Design Issues in Anonymity and Unobservability
(WDIAU), pp. 10-29, 2001.
[17] T. Camp, J. Boleng, and V. Davies, “A Survey of Mobility Models for
Ad Hoc Network Research,” Wireless Communications and Mobile
Computing, vol. 2, pp. 483-502, 2002.
[18] X. Hong, M. Gerla, G. Pei, and C.C. Chiang, “A Group Mobility Model
for Ad Hoc Wireless Networks,” Proc. Second ACM Int’l Workshop
Modeling, Analysis and Simulation of Wireless and Mobile Systems
(MSWiM), 1999.
International Journal of Computer Science and Information Security (IJCSIS),
Vol. 16, No. 7, July 2018
167 https://sites.google.com/site/ijcsis/
ISSN 1947-5500](https://image.slidesharecdn.com/journalofcomputerscienceijcsisjuly2018fullvolume-180915043348/75/Journal-of-computer-science-ijcsis-july-2018-full-volume-181-2048.jpg)
![[19] Debian Administration, http://www.debian-administration.org/
users/dkg/weblog/48, 2012.
[20] X. Wu, “DISPOSER: Distributed Secure Position Service in Mobile Ad
Hoc Networks: Research Articles,” Wireless Comm. and Mobile
Computing, vol. 6, pp. 357-373, 2006.
[21] M.F. Mokbel, C.-Y. Chow, and W.G. Aref, “The New Casper: Query
Processing for Location Services without Compromising Privacy,” Proc.
32nd Int’l Conf. Very Large Databases (VLDB), 2006.
[22] J. Li, J. Jannotti, D.S.J. De, D.S.J. De Couto, D.R. Karger, and R.
Morris, “A Scalable Location Service for Geographic Ad Hoc Routing,”
Proc. ACM MobiCom, 2000.
[23] Y. Xue, B. Li, and K. Nahrstedt, “A Scalable Location Management
Scheme in Mobile Ad-Hoc Networks,” technical report, 2001.
[24] J. Li, J. Jannotti, D.S.J. De, C. David, R. Karger, and R. Morris, “A
Scalable Location Service for Geographic Ad Hoc Routing,” Proc. ACM
MobiCom, 2000.
[25] Y.-C. Hu, D.B. Johnson, and A. Perrig, “SEAD: Secure Efficient
Distance Vector Routing for Mobile Wireless Ad Hoc Networks,” Proc.
IEEE Workshop Mobile Computing Systems and Applications
(WMCSA), 2002.
[26] L. Sweeney, “k-Anonymity: A Model for Protecting Privacy,” Int’l J.
Uncertainity Fuzziness Knowledge-Based Systems, vol. 10, no. 5, pp.
557-570, 2002.
.
International Journal of Computer Science and Information Security (IJCSIS),
Vol. 16, No. 7, July 2018
168 https://sites.google.com/site/ijcsis/
ISSN 1947-5500](https://image.slidesharecdn.com/journalofcomputerscienceijcsisjuly2018fullvolume-180915043348/75/Journal-of-computer-science-ijcsis-july-2018-full-volume-182-2048.jpg)
![A Multi-metric and Multi-deme Multiagent System
Applied on Some Multiobjective Optimization
Problems
Jamshid Tamouk and Adnan Acan
Eastern Mediterranean University, Computer Engineering Department
Gazimagusa, TRNC, 99628, Turkey
E-mail: (jamshid.tamouk@cc emu.edu.tr, adnan.acan@emu.edu.tr)
Abstract: This article proposes a multiagent system consisting of a number of multiobjective metaheuristic agents working
towards the optimization of a Pareto front using multiple performance metrics in a session wise manner. At the beginning of
each session, main population is divided into a number of subpopulations that are assigned to individual agents randomly. The
system runs in consecutive sessions such that agents start running after being assigned with a subpopulation and return the
optimized subpopulations together with the corresponding set of nondominated solutions at the end of the session. There are
three multiobjective assessment metrics in use and a different metric is considered for each session to measure the success of
each metaheuristic agent. Evaluation of individual agents using a particular assessment metric is used in two ways: first,
number of fitness evaluations for each agent is adjusted based on their performance; second, the subpopulation improved by
an individual agent might be rejected based on its evaluation score. At the end of each session, individual subpopulations are
merged to get the updated main population while individual sets of nondominated solutions are combined to form the global
Pareto front. In addition to the individual multiobjective metaheuristic agents, the system also contains a number of
coordination and synchronization agents that run the whole system towards its objectives. The proposed system is tested using
ZDT and DTLZ real-valued multiobjective benchmark problems. Experimental results and statistical evaluations exhibited that
the achieved success is better than many of state-of-the-art algorithms.
Keywords: Multi-agent systems, Metaheuristics, Multi-objective optimization, Multiobjective assessment metrics.
1 Introduction
Modeling real-world usually involves the simultaneous optimization of a number of objectives which usually
contradict with each other. In this respect, a multiobjective optimization (MOO) method aims to provide more than
one solutions (so-called Pareto-optimal set) representing a number of tradeoff alternatives among the problem
objectives. The main goal is to obtain a global Pareto optimum set of feasible solutions (so-called Pareto Front) such
that all solutions within this set are pairwise non-dominated [1].
For a decade, metaheuristic-based approaches gain high popularity due to their low computational complexity and
success in extracting optimal or very close-to-optimal Pareto fronts for high-dimensional difficult problems. Among
numerous proposals of MOO metaheuristics, some of those that are well-known by their success are non-dominated
sorting genetic algorithm (NSGA II) [2], multiobjective genetic algorithm (MOGA) [3], strength Pareto evolutionary
algorithm (SPEA 2) [4], multiobjective differential evolution (MODE) [5], multiobjective simulated annealing
(AMOSA) [6], and multiobjective particle swarm optimization (MOPSO) [7]. The method proposed in this article
implements a multiagent system in which the above mentioned MOO metaheuristics act as individual agents.
A multiagent system (MAS) is a social environment for a population of agents that perform a goal-oriented task
on the environment using their own operators. Basically, each agent gets a set of percepts from their environment,
International Journal of Computer Science and Information Security (IJCSIS),
Vol. 16, No. 7, July 2018
169 https://sites.google.com/site/ijcsis/
ISSN 1947-5500](https://image.slidesharecdn.com/journalofcomputerscienceijcsisjuly2018fullvolume-180915043348/75/Journal-of-computer-science-ijcsis-july-2018-full-volume-183-2048.jpg)
![processes the percepts under light of their accumulated knowledge, and act on the environment through their available
operators to achieve a predefined design goal. MASs are designed to carry out a particular task through social
interaction of its agents. This social interaction is also usually of two types, namely cooperation or competition. Both
of these social interactions require agents to use communication mechanisms through which they can share or
exchange information.
This paper presents a novel multiagent system for the solution of real-valued multiobjective optimization problems.
The proposed architecture contains implementations of a number of MO metaheuristics as individual agents that
cooperatively work on different randomly sampled subpopulations and returns the improved subpopulation and the
extracted Pareto front. Individual agents have their own local archives of non-dominated solutions extracted in a
session, while there is a global archive keeping all non-dominated solutions found so far. At the end of each session,
all subpopulations are combined into one global population to be used for the initialization of the next session.
Similarly, all local archives are merged with the global archive to get the set of all non-dominated solutions found by
all metaheuristics. This way, the metaheuristics cooperate with each other by sharing their search experiences through
collecting them in a common population and a common global archive. The proposed MAS is experimentally
evaluated using the well-known sets of ZDT and DTLZ benchmark problems [8, 9] and comparative analysis of the
experimental results demonstrated that the proposed architecture achieves better performance than majority of its
state-of-the-art competitors in most of the problem instances. Detailed descriptions of the proposed MAS are given in
Section 4.
The rest of this paper is organized as follows: Fundamental subjects and components of a multiagent system are
illustrated in Section 2. The proposed heterogeneous, multi-deme multi-metric MAS for real valued multiobjective
optimization is described in detail in Section 3. Section 4 comprises description of experimental suit, test problems,
algorithm parameters, results and comparative analyses in terms of quantitative and statistical computations. Section
5 presents conclusions and some future research directions.
2 Multiagent systems
Fundamentally, a MAS comprises a set of agents and their environment in which the agents are designed to perform
particular tasks. In this respect, individual agents are computational procedures that perceive their environment, make
inferences based on the received percepts and their learned experience and acts on their environment to reach
predefined design goals [10]. In intelligent MASs, individual agents are required to be autonomous that means learning
capability through interactions with the environment as well as adapting to changes in the environment caused by
agents’ actions internally and the environments’ dynamics externally [11]. Communication channel is another
major part of a MAS which let the agents in a MAS to interact and communicate with each other through it [12].
The other fundamental part of a MAS is the environment which is sensed and changed by its agents to reach their
goals. The environment is a shared common resource for all agents and it takes the role of specifying positions, locality,
and limitations on actions of agents [13].
Multiagent systems including metaheuristics as individual agents are widely used to provide
cooperative/competitive frameworks for optimization [12, 14]. There exists significantly large literature in this field
and a detailed literature review together with descriptions of some of the pioneering studies are presented in [15].
The method proposed in this paper comprises some MOO metaheuristic agents acting on subsets of a common
population. In addition to an assigned subset of population elements, agents also maintain their local archives keeping
the non-dominated solutions extracted during a particular session. The proposed method runs in consecutive sessions
International Journal of Computer Science and Information Security (IJCSIS),
Vol. 16, No. 7, July 2018
170 https://sites.google.com/site/ijcsis/
ISSN 1947-5500](https://image.slidesharecdn.com/journalofcomputerscienceijcsisjuly2018fullvolume-180915043348/75/Journal-of-computer-science-ijcsis-july-2018-full-volume-184-2048.jpg)

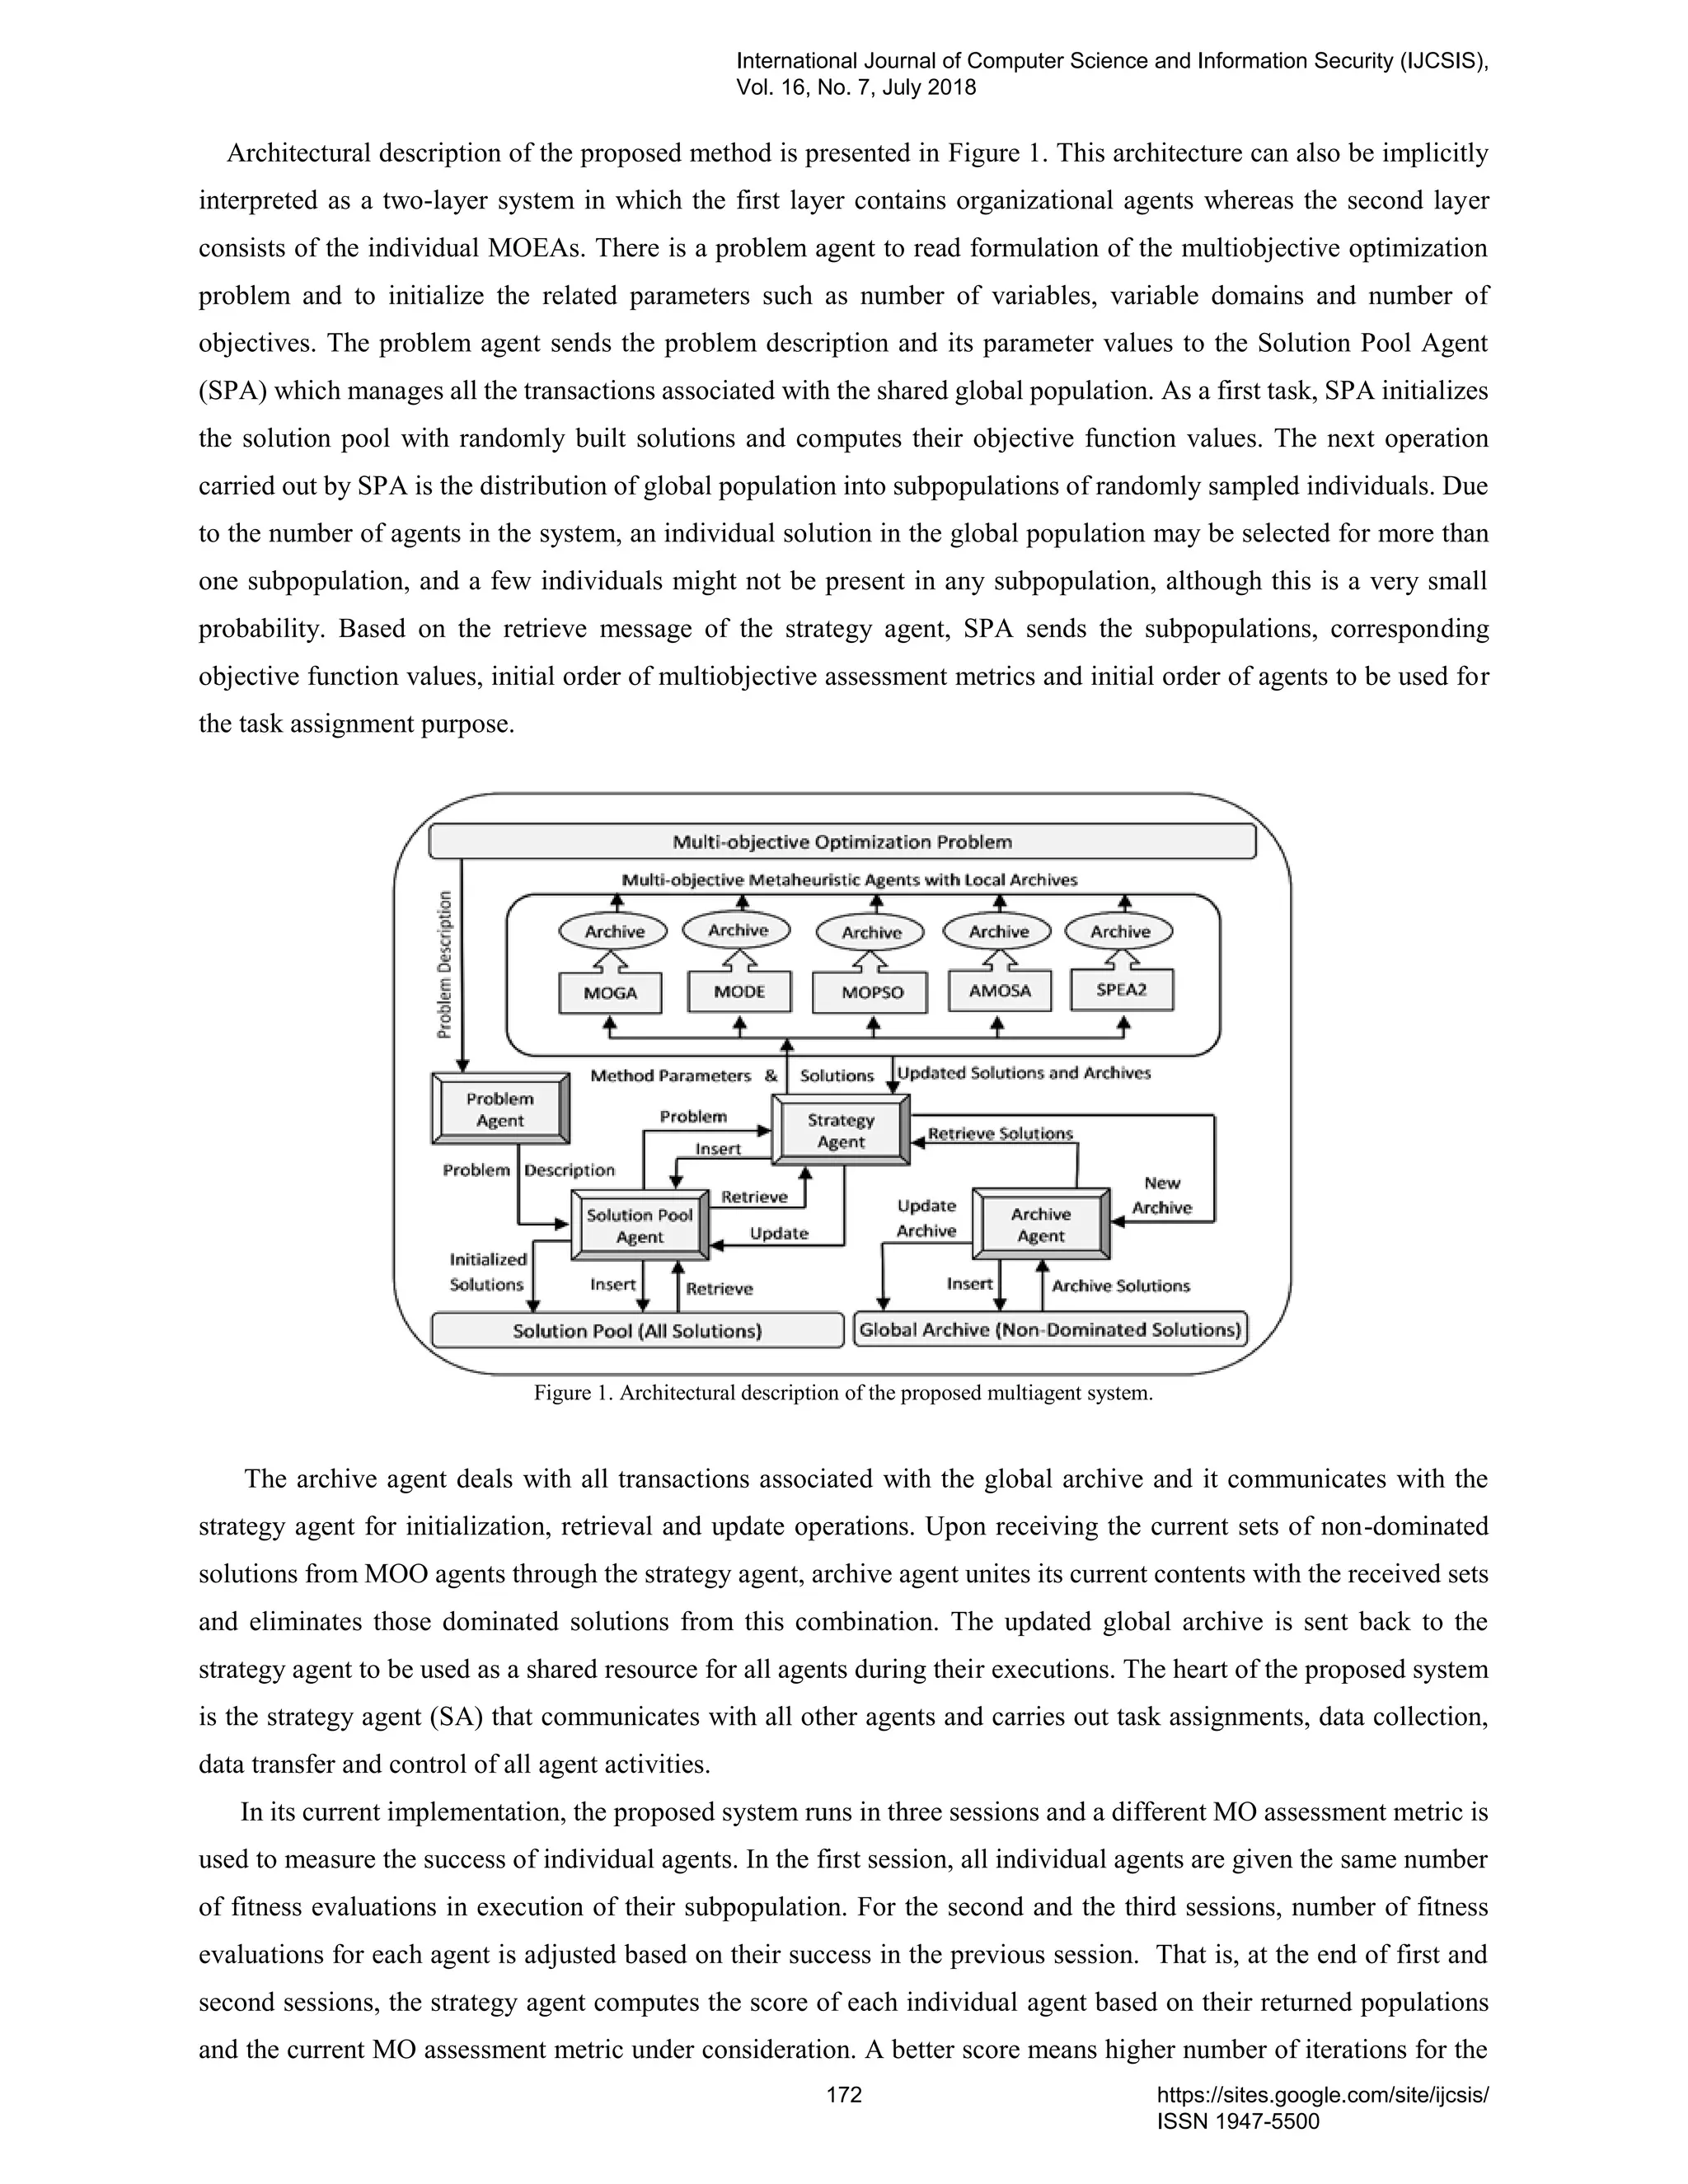
![next session. For this purpose, a weight wi is computed for each agent i based on its current metric score and the
number of fitness evaluations for the next sessions is computed as wi times the number of fitness evaluations for the
first session. For the first session, number of fitness evaluations for each agent is set to a fixed value . However, in
every session, number of fitness evaluations for each individual agent is limited to an interval [1* ,2* ].
Calculation of the weights wi is based on the following idea: wi’s take values from the range [wmin,wmax] such that
the best performing agent is assigned with the weight wmax, whereas the worst performing one takes the weight wmin.
Weights of other agents are determined linearly based on the following simple formula,
𝑤𝑖 = 𝑤 𝑚𝑖𝑛 +
𝑤 𝑚𝑎𝑥 − 𝑤 𝑚𝑖𝑛
𝑆 𝑚𝑎𝑥 − 𝑆 𝑚𝑖𝑛
(𝑆𝑖 − 𝑆min )
where Si, Smax and Smin represents the metric score of agent i, maximum metric score and minimum metric score,
respectively, at the end the current session. Agents’ weights are also used for accepting or rejecting their
subpopulations. In this respect, if Si/Sbestwi, then the subpopulation returned by agent i is rejected. However, the set
of nondominated solutions extracted by agent i is sent to the archive agent for a possible inclusion of some its elements
within the global set of nondominated solutions. As it was also mentioned above, the strategy agent is performing the
most critical operations of the proposed MAS. A flowchart description of the strategy agent that describes the flow of
above explained operations is given below in Figure 2.
In each session, the best Pareto front found so far, stored in the global archive, is taken as the reference Pareto front
needed to compute the associated performance metrics. Also, at the beginning of each session, the algorithmic
parameters of individual agents are set as described in Table 1.
4 Experimental results and evaluations
Performance evaluations of the proposed algorithm are carried out over the difficult ZDT and DTLZ benchmark
[8, 9] problems. For each of the test functions, number of variables, number of independent runs and the termination
criterion, in terms of the number of fitness evaluations, are set the same as the ones mentioned in these references so
that fairness is guaranteed for comparative evaluations. Algorithmic parameters of the proposed method are kept the
same for all the test functions and no interactive intervention is made throughout the program executions.
Algorithmic parameters of the metaheuristic methods used within the proposed multiagent system are given in
Table 1 where the proposed multi-metric multi-deme MAS is named as M3
D/MAS. All of the parameters in Table 1
are collected from well-known conventional implementations of the corresponding metaheuristic algorithms. Except
for AMOSA, that is a trajectory based metaheuristic running over single solutions, initial population size, , is set to
20 individuals for all other metaheuristic agents. Implementation of the proposed system is carried out using Matlab®
programming language environment and a personal PC with 8 GB main memory and 2.1 GHz clock speed.
International Journal of Computer Science and Information Security (IJCSIS),
Vol. 16, No. 7, July 2018
173 https://sites.google.com/site/ijcsis/
ISSN 1947-5500](https://image.slidesharecdn.com/journalofcomputerscienceijcsisjuly2018fullvolume-180915043348/75/Journal-of-computer-science-ijcsis-july-2018-full-volume-187-2048.jpg)
![Figure 2. Process flowchart of the proposed multi-agent system
Table 1. Algorithmic parameters of the metaheuristic methods used within the proposed system.
Metaheuristic
Agent
Algorithm Parameters
MOGA PC =0.7, Pm=0.2, Gaussian_Sigma_Pm=20
MOPSO C1=2.0, C2=2.0, ωmax=0.9, ωmin=0.4
MODE Scaling_Factor=0.5, PC =0.7
SPEA2 PC =0.9, Pm=1.0/Num_Vars, Distribution_Index=20
AMOSA Archive_Hlimit=20, Archive_Slimit=50, Max_Temp=200, Gamma=2.0,
Min_Temp=0.00025, Cooling_Rate=0.95, Hill_Climbing_Num=20,
NSGAII PC =0.9, Pm=1.0/ Num_Vars, Distribution_Index=20,
M3
D/MAS =20, wmin= 0.6 wmax=1.4 1=0.1 2=1.9
In the recent decade, a number of MOO assessment metrics have been proposed to quantify the performance and
facilitate the comparative evaluation of MOO algorithms. In this research two well-known MOO assessment metrics,
namely ε –indicator and inverted generational distance (IGD) are used to evaluate the success of MOO algorithms in
terms of additive distance, diversity, and Euclidean mean distance, respectively. Detailed description of these metrics
are given in [16, 17, 18, and 19].
Average scores of M3
D/MAS for ZDT and DTLZ benchmark problems over 30 runs are compared to published
values in [20, 21, and 22]. In all the tables within this section, results of best performing algorithms are indicated in
International Journal of Computer Science and Information Security (IJCSIS),
Vol. 16, No. 7, July 2018
174 https://sites.google.com/site/ijcsis/
ISSN 1947-5500](https://image.slidesharecdn.com/journalofcomputerscienceijcsisjuly2018fullvolume-180915043348/75/Journal-of-computer-science-ijcsis-july-2018-full-volume-188-2048.jpg)
![bold. Table 3 and Table 4 illustrate the Min, Max and Average IGD and ε –indicator values associated with the
proposed M3
D/MAS algorithm for the 10 mentioned above. It can be seen from these tables that small values of
standard deviations indicate that the proposed algorithm is a stable and robust alternative numerical MOO.
Additionally, small values of IGD and ε –indicator metrics show that the proposed algorithm successfully extracts
Pareto fronts that close to the optimal one.
Table 2. Variable ranges, number of variables and maximum number of fitness evaluations for each benchmark problem instance
Instance Number and Range of Variables # Fitness
Evaluations
ZDT1 [0, 1] 𝑛
n = 30 300 000
ZDT2 [0, 1] 𝑛
n = 30 300 000
ZDT3 [0, 1] 𝑛
n = 30 300 000
ZDT4 𝑥1∈[0,1] , 𝑥𝑖∈[−5,5], n = 30 300 000
ZDT6 [0, 1] 𝑛
n = 30 300 000
DTLZ1 [0, 1] 𝑛
n = 30 300 000
DTLZ2 [0, 1] 𝑛
n = 30 300 000
DTLZ3 [0, 1] 𝑛
n = 30 300 000
DTLZ4 [0, 1] 𝑛
n = 30 300 000
DTLZ7 [0, 1] 𝑛
n = 30 300 000
Table 3. Min, Max and Average IGD values of M3D/MAS in 30 runs.
Function Average Min Max Std
ZDT1 3.19e – 03 2.96e – 03 3.58 e – 03 2.1e – 04
ZDT2 3.33e – 03 3.08e – 03 3.63 e – 03 2.0e – 04
ZDT3 3.77e – 03 3.50e – 03 4.33e – 03 2.2e – 04
ZDT4 3.01e – 03 2.59e – 03 3.52e – 03 2.3e – 04
ZDT6 2.54e – 03 2.30e – 03 2.89e – 03 1.9e – 04
DTLZ1 1.40e – 03 1.37e – 03 1.55e – 03 1.2e – 04
DTLZ2 2.97e – 03 2.77e – 03 3.23e – 03 2.0e – 04
DTLZ3 3.47e – 03 3.36e – 03 3.59e – 03 1.8e – 04
DTLZ4 2.95e – 03 2.82e – 03 3.17e – 03 1.7e – 04
DTLZ7 5.55e – 03 5.35e – 03 5.95e – 03 4.2e – 04
Table 4. Min, Max and Average ε values of M3D/MAS in 30 runs.
Function Average Min Max Std
ZDT1 5.30e – 03 4.80e – 03 5.66e – 03 3.6e – 04
ZDT2 4.96e – 03 4.75e – 03 5.13e – 03 2.7e – 04
ZDT3 5.34e – 03 4.90e – 03 5.78e – 03 4.3e – 04
ZDT4 4.36e – 03 4.08e – 03 4.88e – 03 4.1e – 04
ZDT6 4.04e – 03 3.89e – 03 4.47e – 03 3.2e – 04
DTLZ1 2.27e – 03 2.16e – 03 2.44e – 03 1.8e – 04
DTLZ2 4.29e – 03 3.79e – 03 4.70e – 03 3.2e – 04
DTLZ3 5.63e – 03 5.40e – 03 6.05e – 03 3.8e – 04
DTLZ4 5.87e – 03 5.72e – 03 6.22e – 03 3.1e – 04
DTLZ7 8.75e – 03 8.31e – 03 9.32e – 03 5.4e – 04
Tables 5 exhibit IGD results of M3D/MAS and 5 other recently published state-of-the-art MOO methods for
comparative evaluations. For ZTD benchmarks, the best performing algorithm is BX-NU that achieved the best IGD
scores for 3 test problems whereas M3D/MAS took the second position and exhibited the best scores for 2 of ZDT
instances. For the 6 DTLZ instances, BLX-NU and SBX-PN are the best performing methods while the proposed
algorithm is taking the third position.
Table 5. Comparing average IGD values of M3
D/MAS with 5 MOO methods
Function BLX-NU
[20]
SBX-PN
[20]
MOEA/D
[21]
MOEA/D-
DE+PSO [21]
MOEA/D-
CPDE [21]
M3D/MAS
ZDT1 5.58e − 03 2.99e – 02 4.05e − 03 4.14e − 03 4.03e − 03 3.19e – 03
ZDT2 4.37e − 03 7.44e − 03 3.81e − 03 3.87e − 03 3.80e − 03 3.33e – 03
ZDT3 3.10e − 03 5.92e – 03 7.08e − 03 9.02e − 03 7.08e − 03 3.77e – 03
ZDT4 7.90e − 04 2.15e – 03 1.96e − 01 7.55e − 03 3.95e − 03 3.01e – 03
ZDT6 1.07e − 03 1.22e – 03 1.34e − 02 1.45e − 02 5.97e − 03 2.54e – 03
DTLZ1 2.70e − 04 5.50e – 04 NA NA NA 1.40e – 03
DTLZ2 7.60e − 04 2.68e – 03 NA NA NA 2.97e – 03
DTLZ3 4.00e − 04 3.90e – 04 NA NA NA 3.47e – 03
DTLZ4 2.93e − 03 2.74e – 03 NA NA NA 2.95e – 03
DTLZ7 6.96e − 03 1.17e − 02 NA NA NA 5.55e – 03
International Journal of Computer Science and Information Security (IJCSIS),
Vol. 16, No. 7, July 2018
175 https://sites.google.com/site/ijcsis/
ISSN 1947-5500](https://image.slidesharecdn.com/journalofcomputerscienceijcsisjuly2018fullvolume-180915043348/75/Journal-of-computer-science-ijcsis-july-2018-full-volume-189-2048.jpg)
![Tables 6 illustrates ε-indicator values of 7 MOO metheuristics including M3
D /MAS and 6 other well-known MOO
methods. It clear that the proposed methods is the winner against its competitors and achieved the best scores for 6 of
the 10 benchmark problems. The second best performing method is SMPSO that took the first position for 4 test
instances.
Table 6. Comparing average ε values of M3
D/MAS with 6 MOO methods [22]
Function NSGA-II SPEA2 OMOPSO AbYSS MOCell SMPSO M3D/MAS
ZDT1 1.37e – 02 8.69e – 03 6.36e – 03 7.72e – 03 6.23e – 03 5.39e − 03 5.30e – 03
ZDT2 1.28e – 02 8.73e − 03 6.19e − 03 7.10e − 03 5.57e – 03 5.33e − 03 4.96e – 03
ZDT3 8.13e – 03 9.72e − 03 1.32e − 02 6.10e – 03 5.66e – 03 5.10e − 03 5.34e – 03
ZDT4 1.49e – 02 3.42e − 02 5.79e + 00 1.14e − 02 8.17e – 03 6.02e − 03 4.36e – 03
ZDT6 1.47e – 02 2.42e − 02 4.65e − 03 5.06e − 03 6.53e – 03 4.43e − 03 4.04e – 03
DTLZ1 7.13e – 03 5.89e − 03 1.92e + 01 5.85e − 03 4.02e – 03 2.97e − 03 2.27e – 03
DTLZ2 1.11e – 02 7.34e − 03 6.72e − 03 5.39e − 03 5.09e – 03 5.17e − 03 4.29e – 03
DTLZ3 1.04e + 0 2.28e + 00 8.86e + 01 1.66e + 00 7.91e – 01 5.39e − 03 5.63e – 03
DTLZ4 1.13e – 02 7.66e − 03 3.18e − 02 5.39e − 03 5.74e – 03 5.39e − 03 5.87e – 03
DTLZ7 1.04e – 02 9.09e − 03 7.13e − 03 5.51e − 03 5.19e – 03 4.95e − 03 8.75e – 03
a) PF true and extracted PF for ZDT1 b) PF true and extracted PF for ZDT2 c) PF true and extracted PF for ZDT3
d) PF true and extracted PF for ZDT4 e) PF true and extracted PF for ZDT6
International Journal of Computer Science and Information Security (IJCSIS),
Vol. 16, No. 7, July 2018
176 https://sites.google.com/site/ijcsis/
ISSN 1947-5500](https://image.slidesharecdn.com/journalofcomputerscienceijcsisjuly2018fullvolume-180915043348/75/Journal-of-computer-science-ijcsis-july-2018-full-volume-190-2048.jpg)
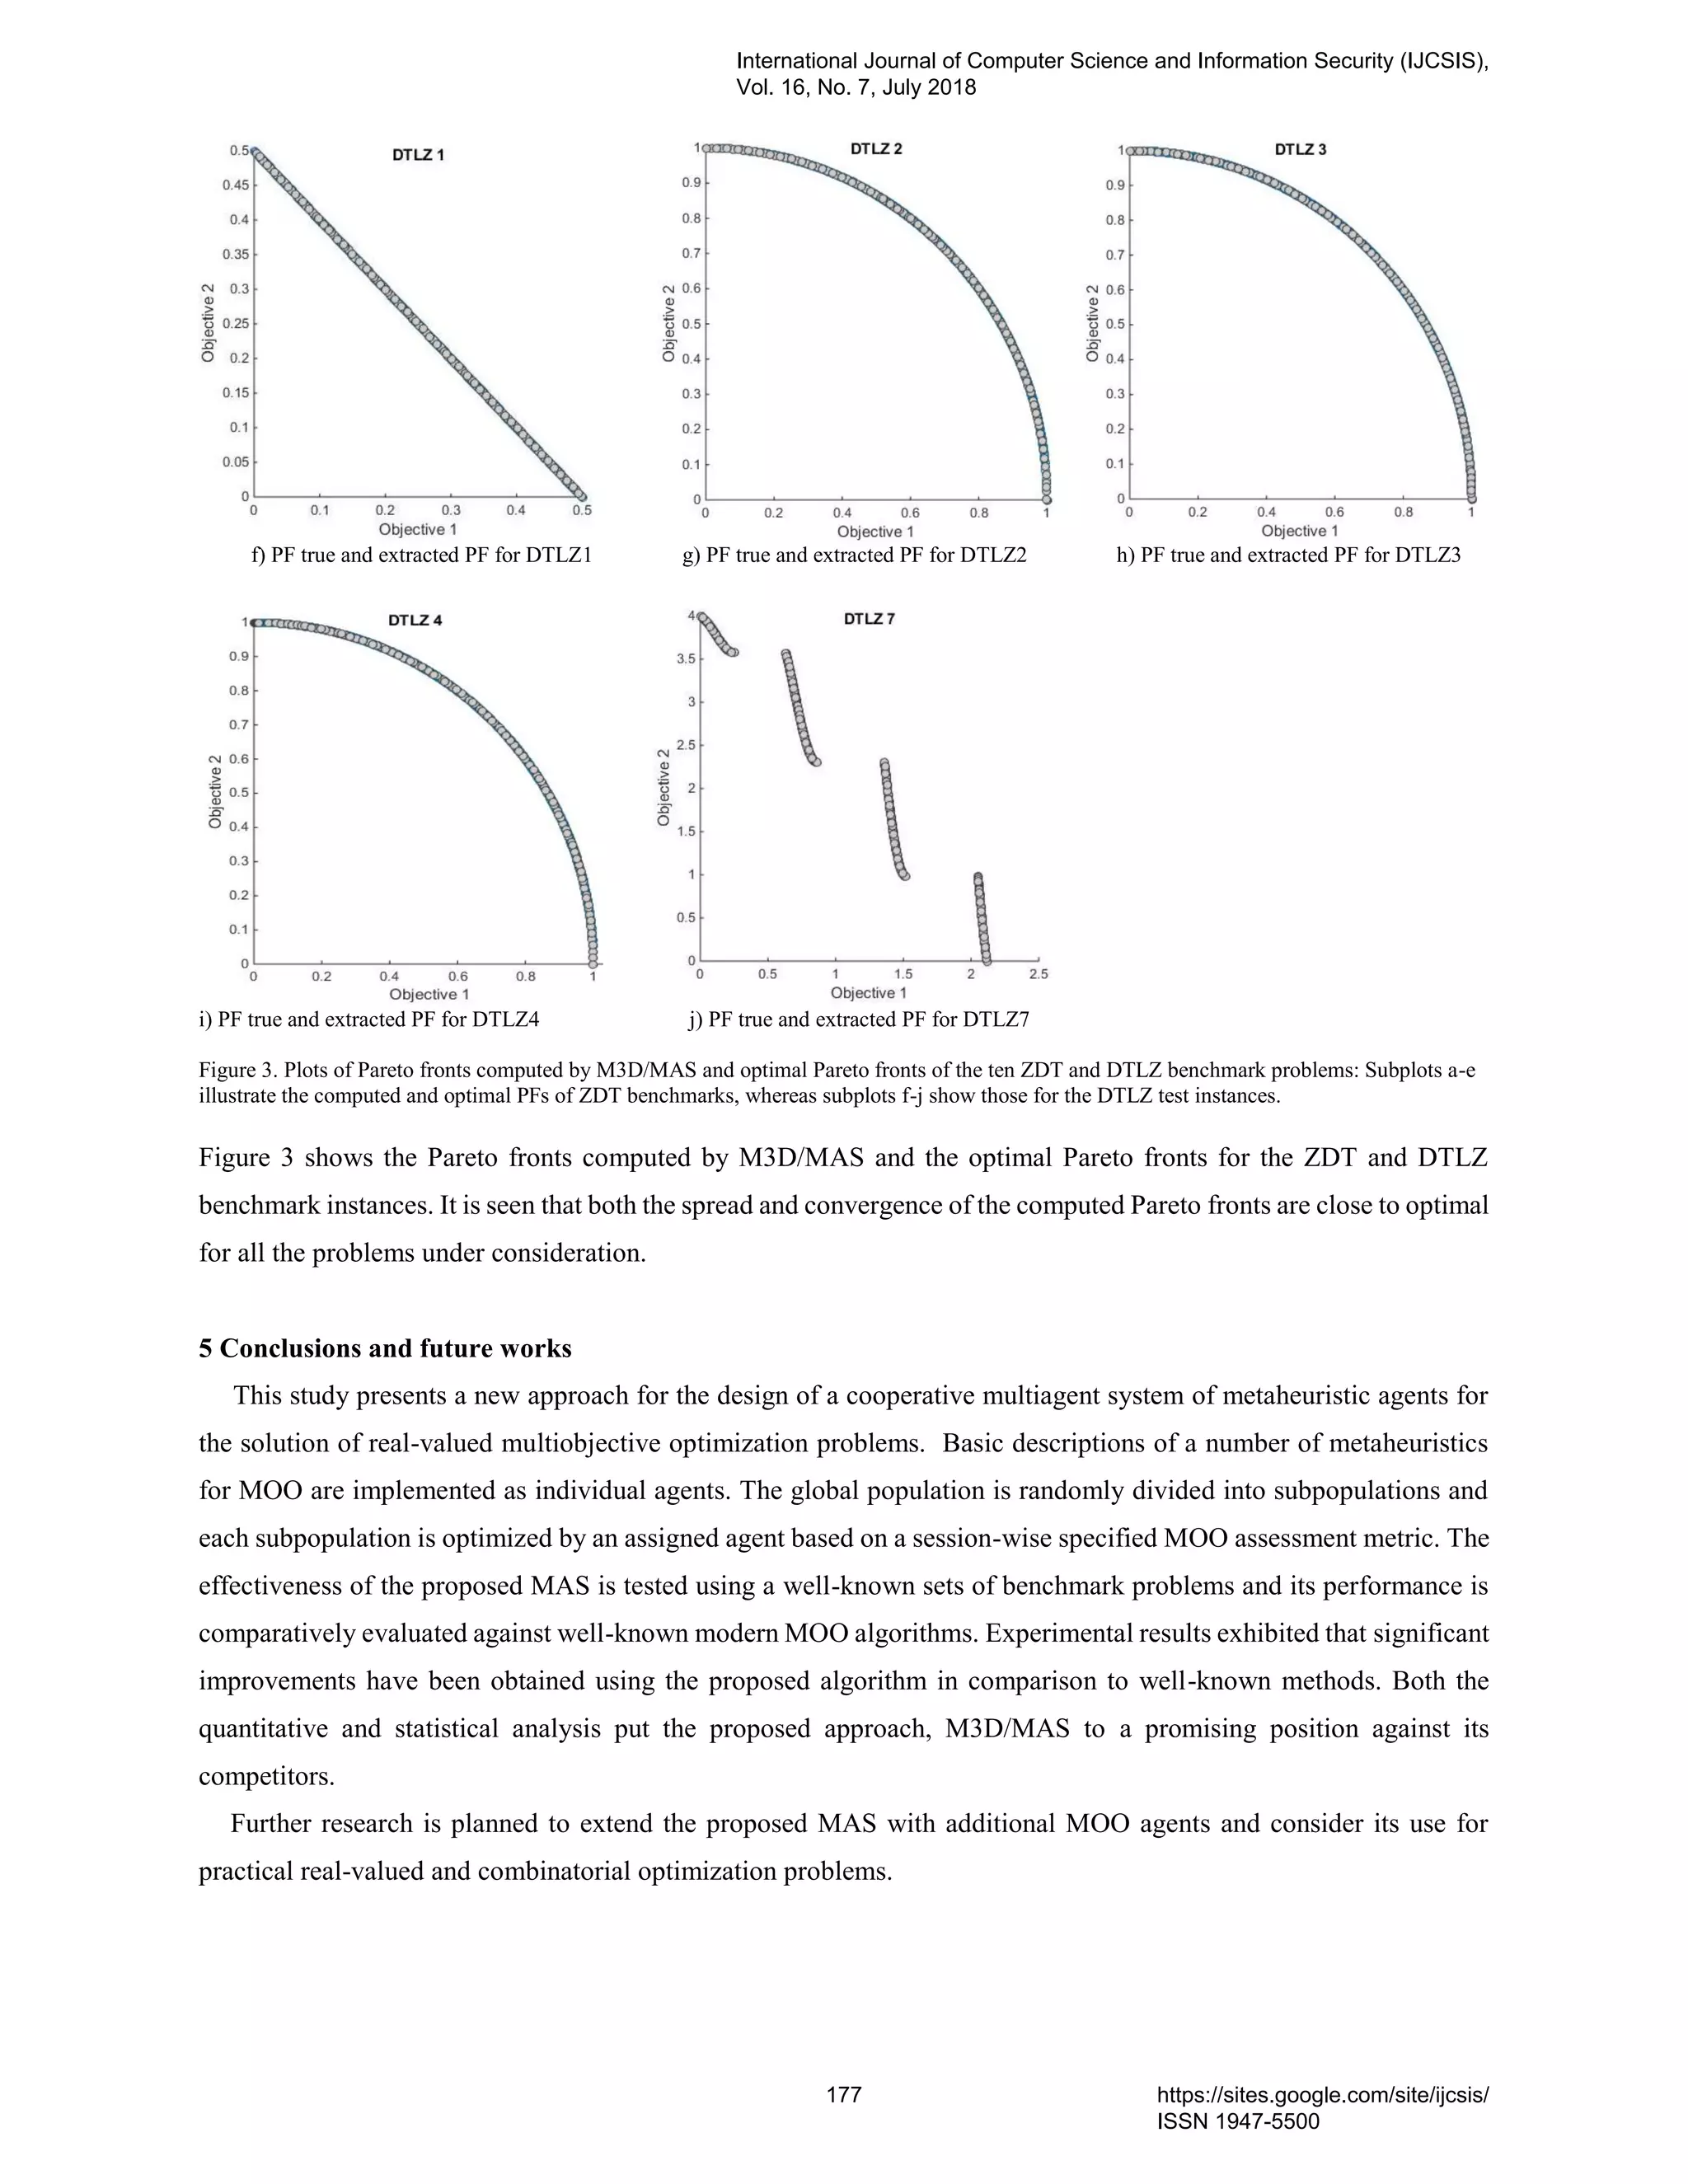

![ABSTRACT- A innovative Double Faced
watermarking scheme Using histogram changing
inflection which flexible takes care of the confined
specification of the picture contented. By registering
it to the picture calculation-problems and by making
an allowance for their next locality, the techniques
we used to placing information in textured areas
that should be encrypted & decrypted properly. in
addition, our methods makes utilize of a
categorization process for notifying the parts of the
picture so it has been watermarkened with the
nearly everyone suitable double faced (spasmodic)
intonation. These categorization can be done on a
orientation picture derived from the original picture
itself, a predict of which have the resources of being
relative to the watermark embeded. In this method,
these watermark implanted plus extractor stay
coordinated for message removal and image
rebuilding. The test arrangement happening on a
number of general images and on medicinal picture
as of variety of modalities, our plan can include
more data with subordinate twist than any existing
method
with lower twist than any existing technique In
histogram changing the pixel can be well-organized
and lesser difficulty than applying it on calculation-
errors. since, the histogram maxima corresponds to
the void gray value; capability is increased and
underflow are simply evade by changing pixel value
to the correct, i.e. by adding up a productive gray
scale value.
Keyword - Double Faced , Proportional, Histogram
Changing, DWT.
At present digital acoustic watermark have been
recognized as latent as well as sensible answer toward
the problem of the acoustic reasonable assets right
guard and acknowledged extensive attraction [1, 2].
The majority of the acoustic watermark techniques uses
the permanent values devoid of some optimization
inside the text [3-6]. As an alternative can be used by
permanent parameter, one more trend is witness clever
systems in addition to inventing algorithms are included
into watermark technique to optimize the variables [7-
12]. A popular intellectual devoid of using its incline, If
SPASMODIC WATERMARKING OF
COMPARATIVE IMAGES USING
DISCRETE WAVELET TRANSFORM
(DWT) AND HISTOGRAM CHANGING
S.Venkatesh1
, Dr.M.A.Dorairangaswamy2
1
Research Scholar, Faculty of Computer Science and Engineering
Sathyabama University, Chennai, Tamilnadu.
2
Professor and Registrar, St Peter’s University, Avadi Chennai, Tamilnadu.
1
venkyjep@gmail.com
2
drdorairs@yahoo.co.in
International Journal of Computer Science and Information Security (IJCSIS),
Vol. 16, No. 7, July 2018
179 https://sites.google.com/site/ijcsis/
ISSN 1947-5500](https://image.slidesharecdn.com/journalofcomputerscienceijcsisjuly2018fullvolume-180915043348/75/Journal-of-computer-science-ijcsis-july-2018-full-volume-193-2048.jpg)
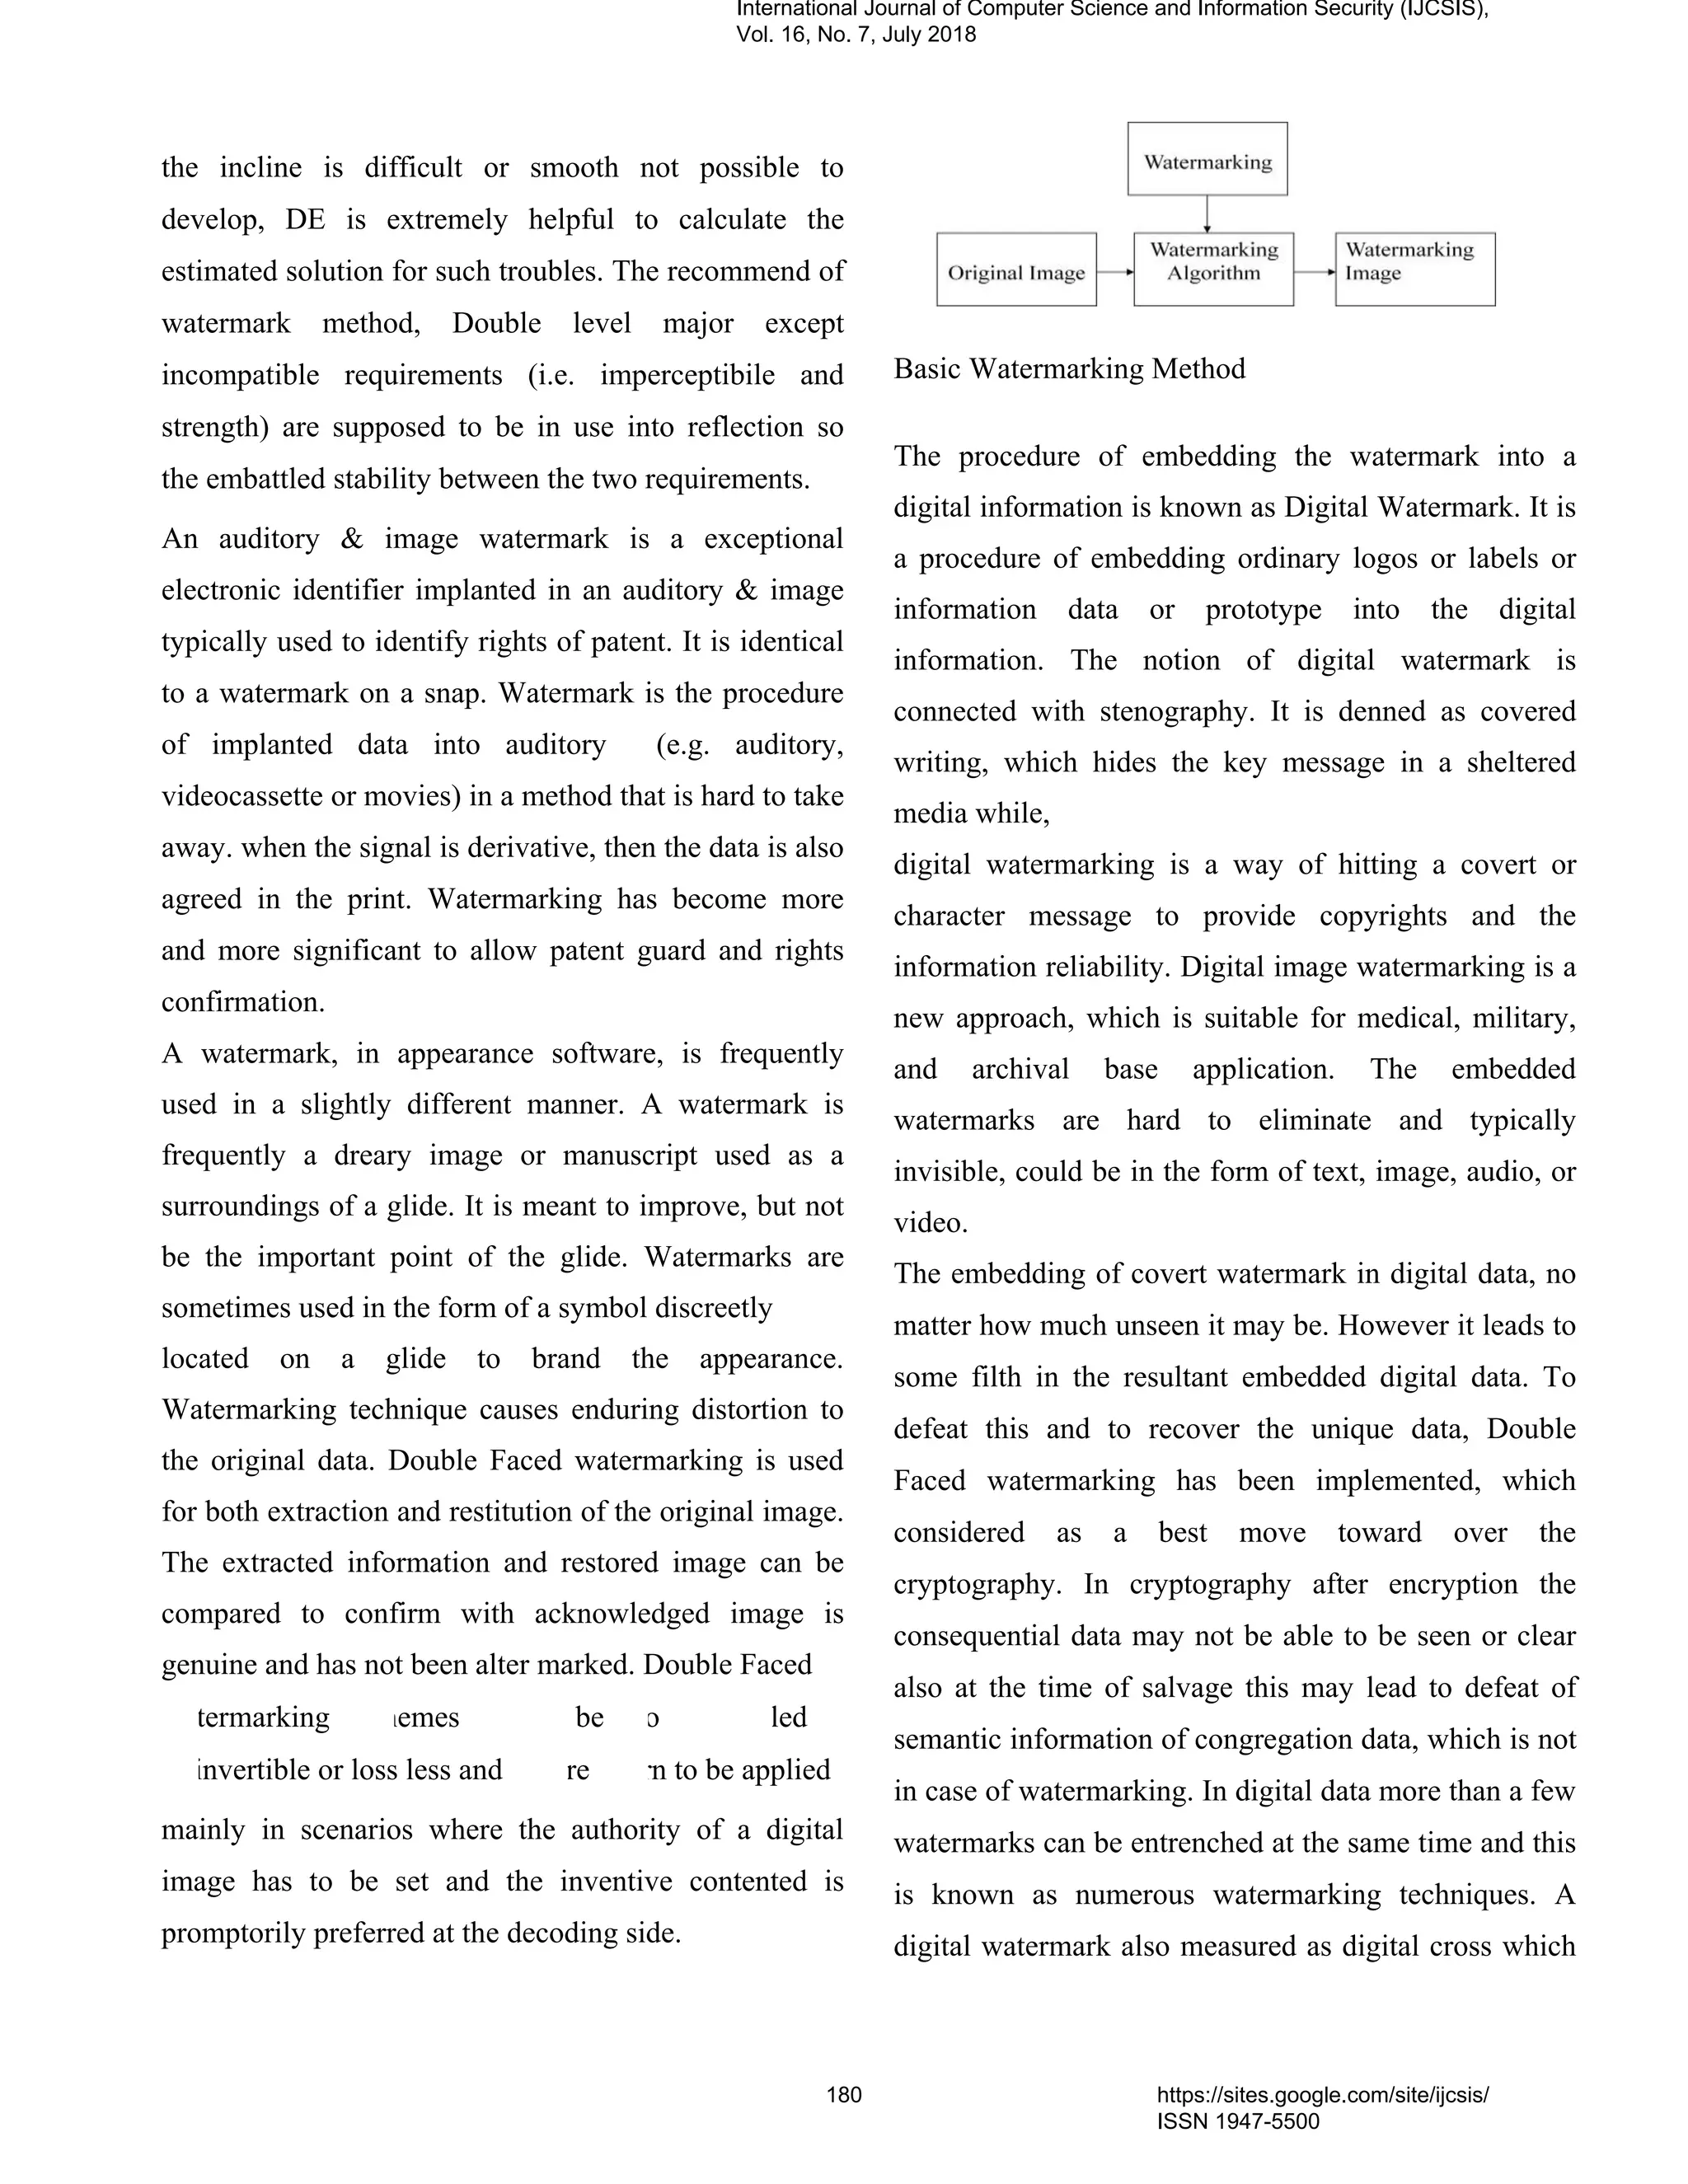
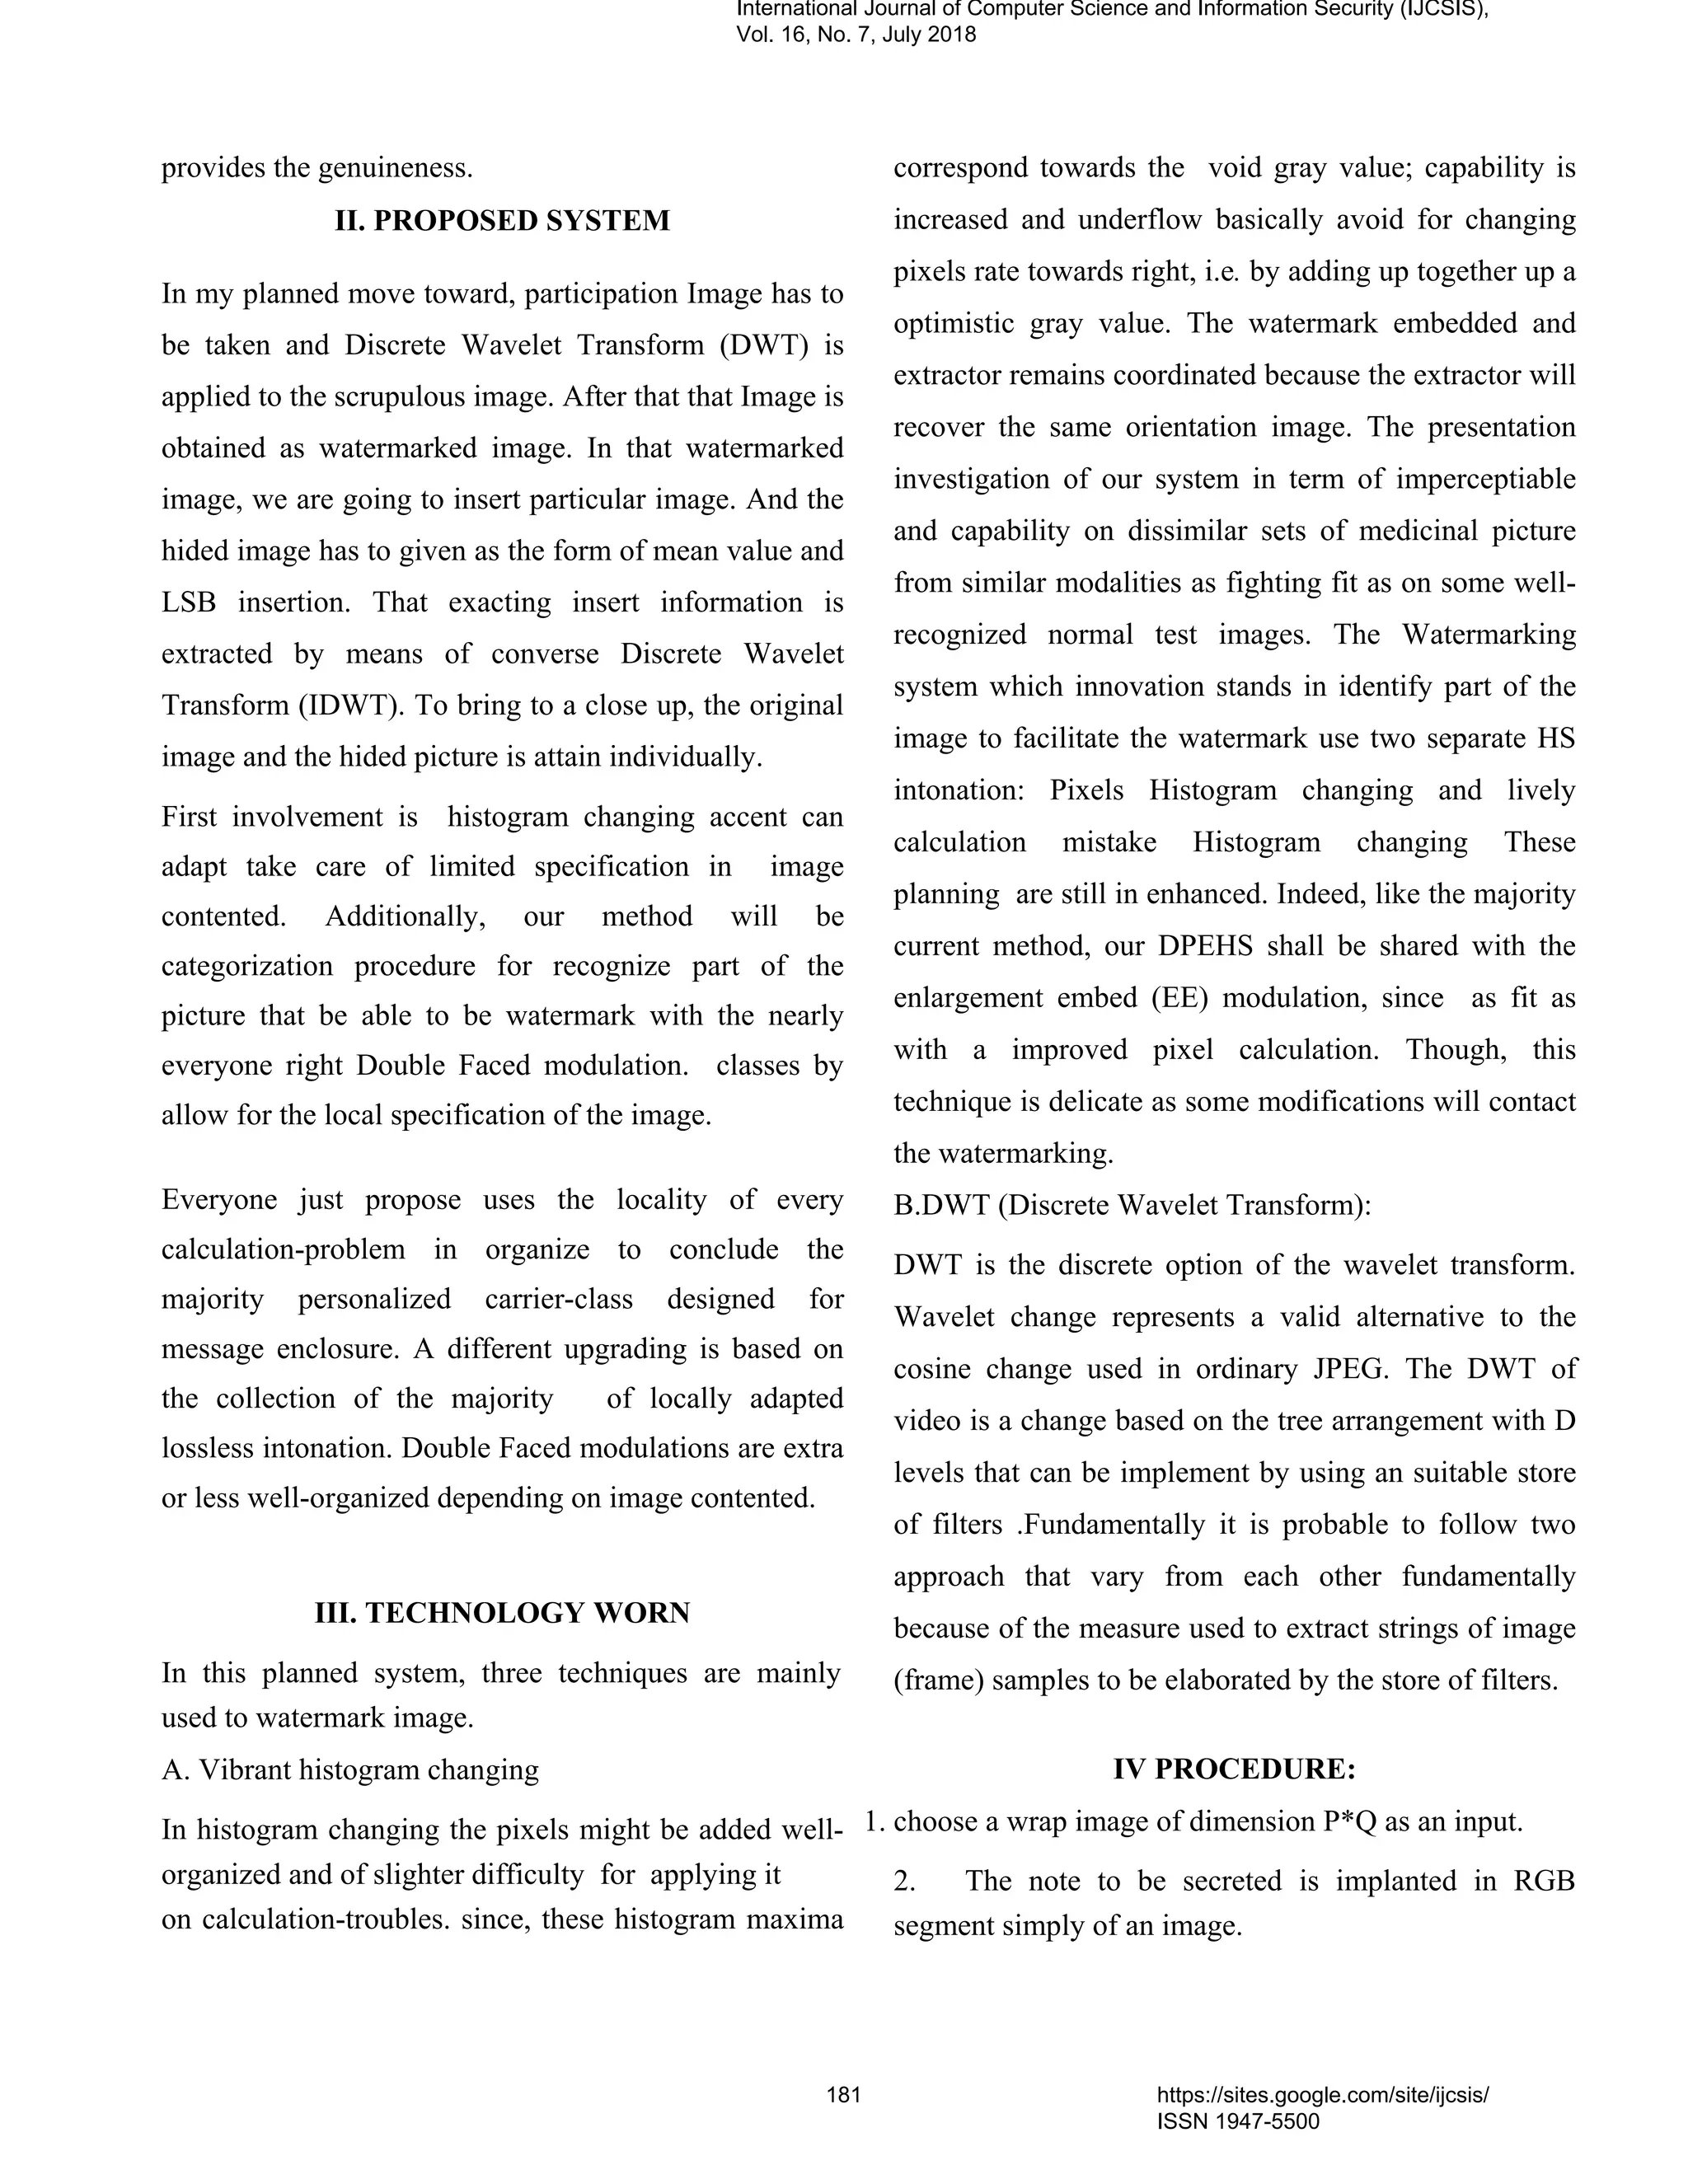
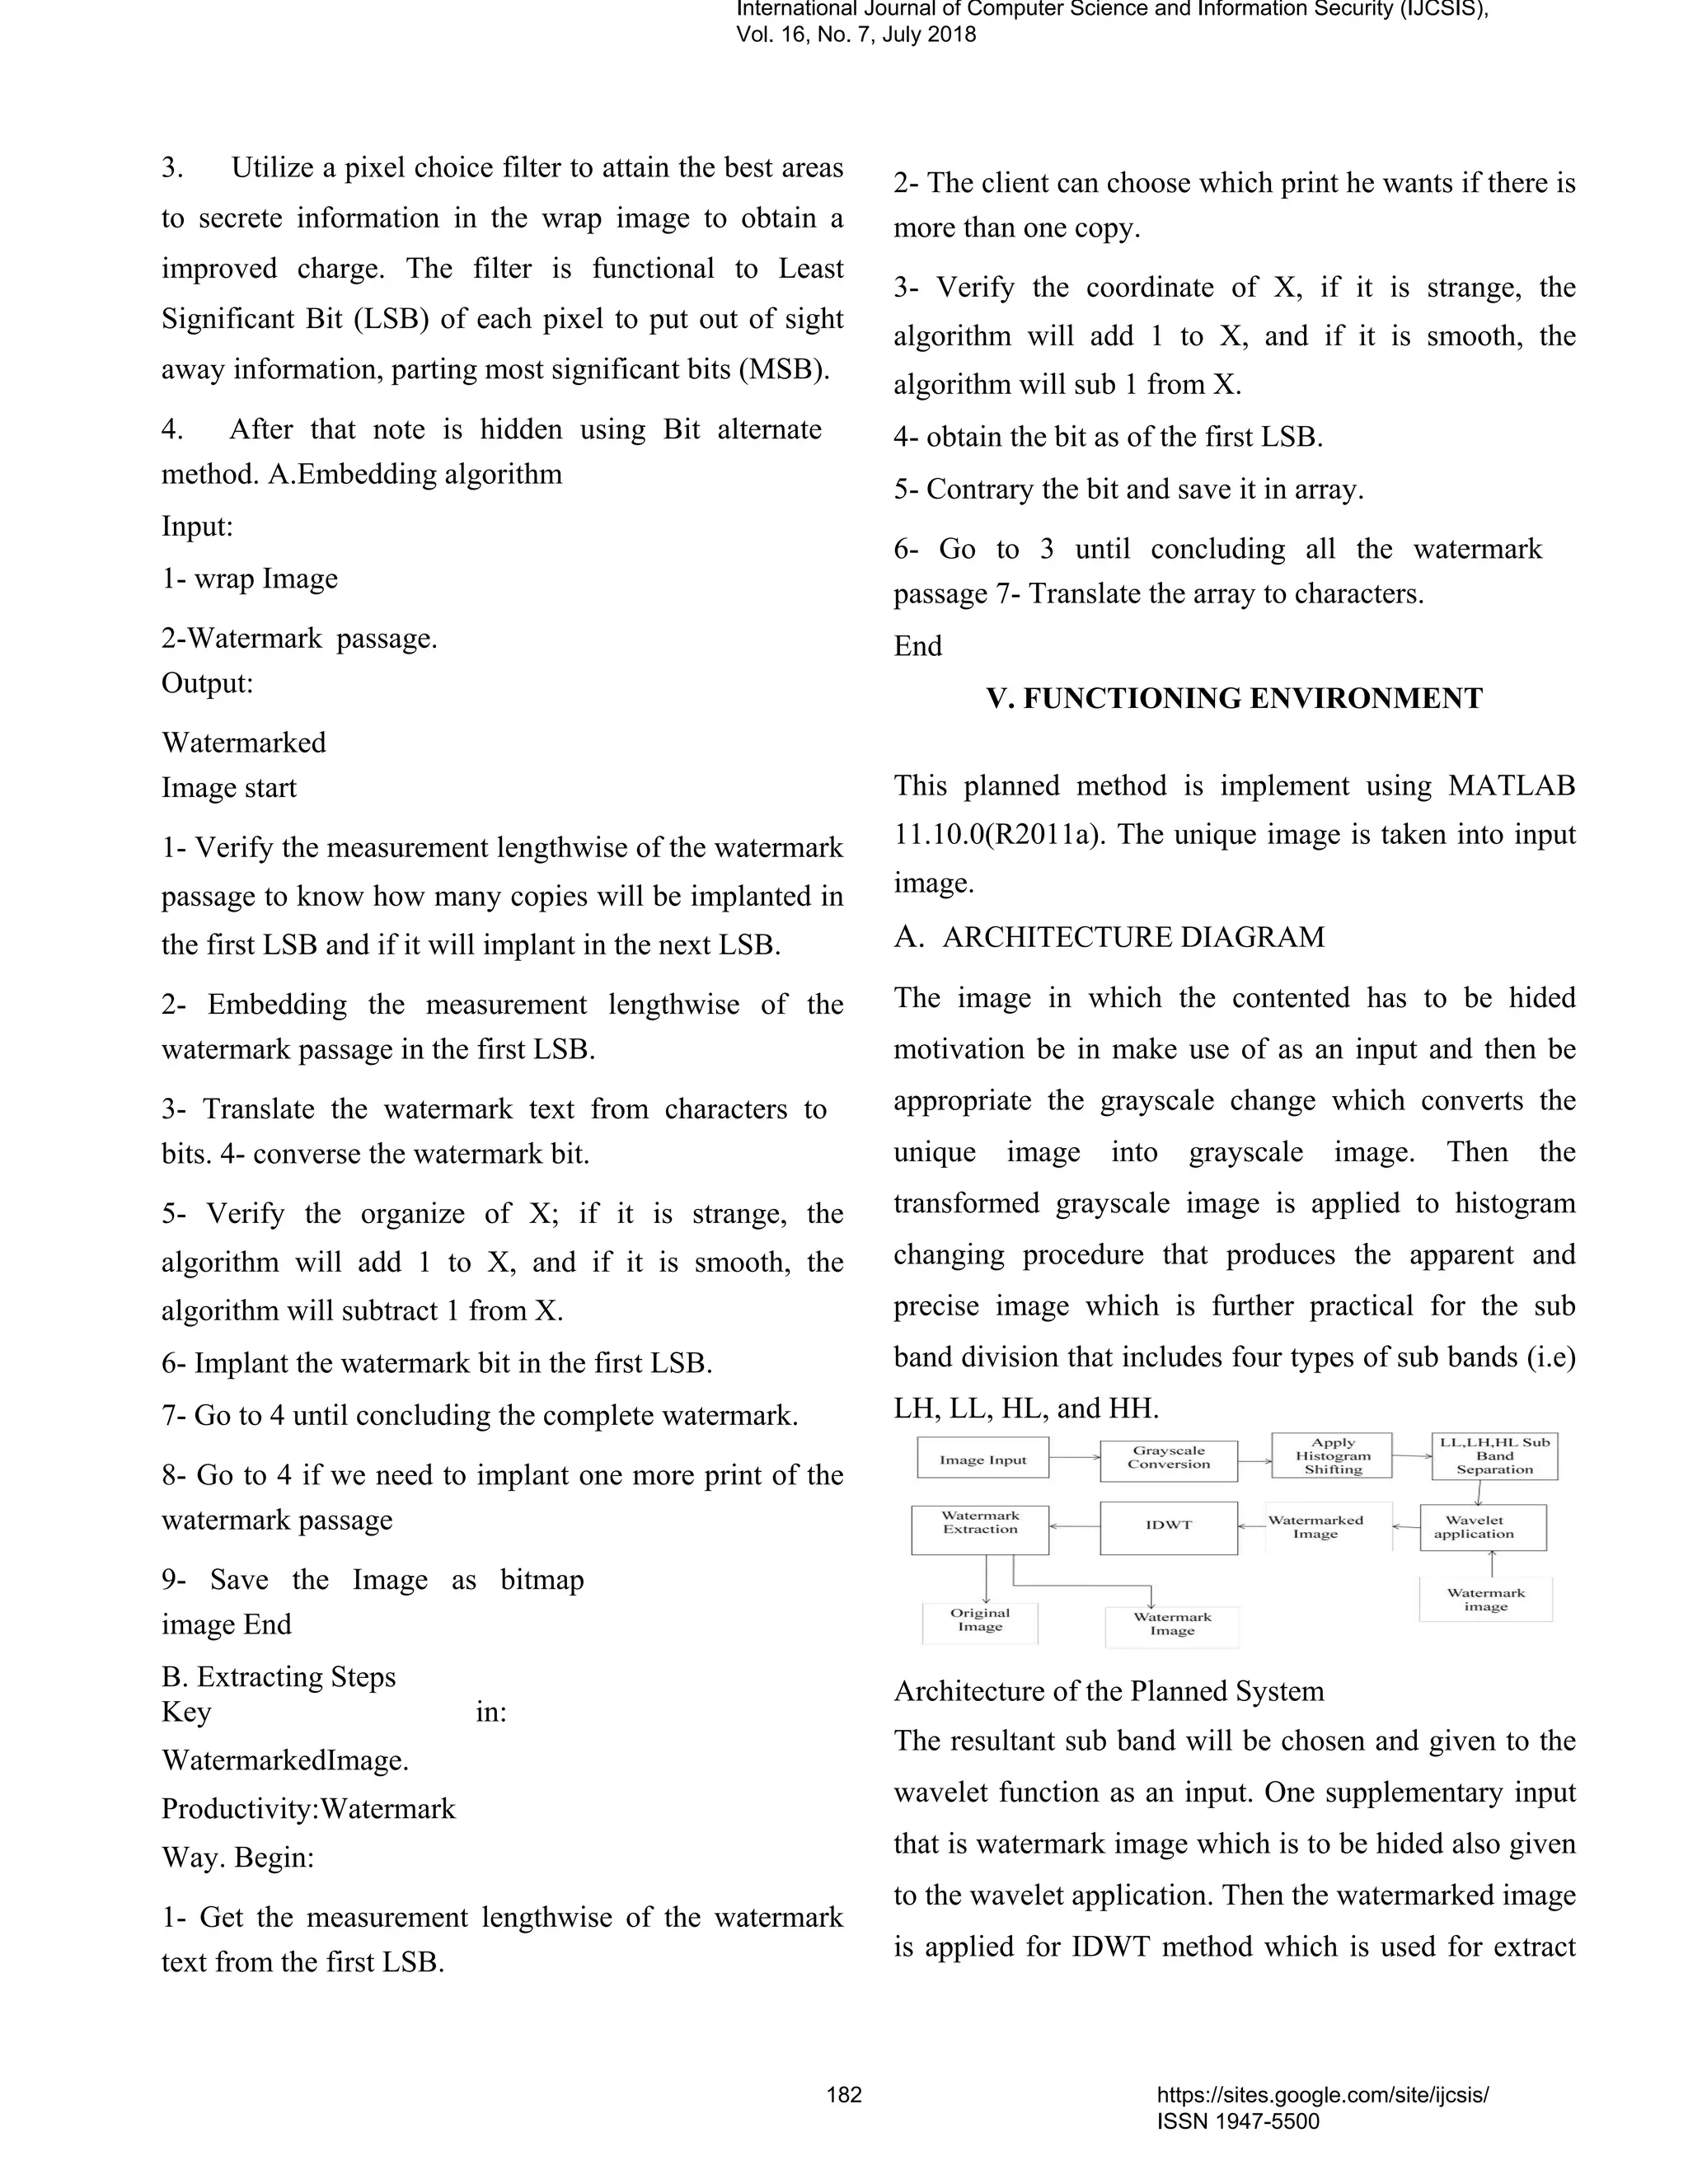
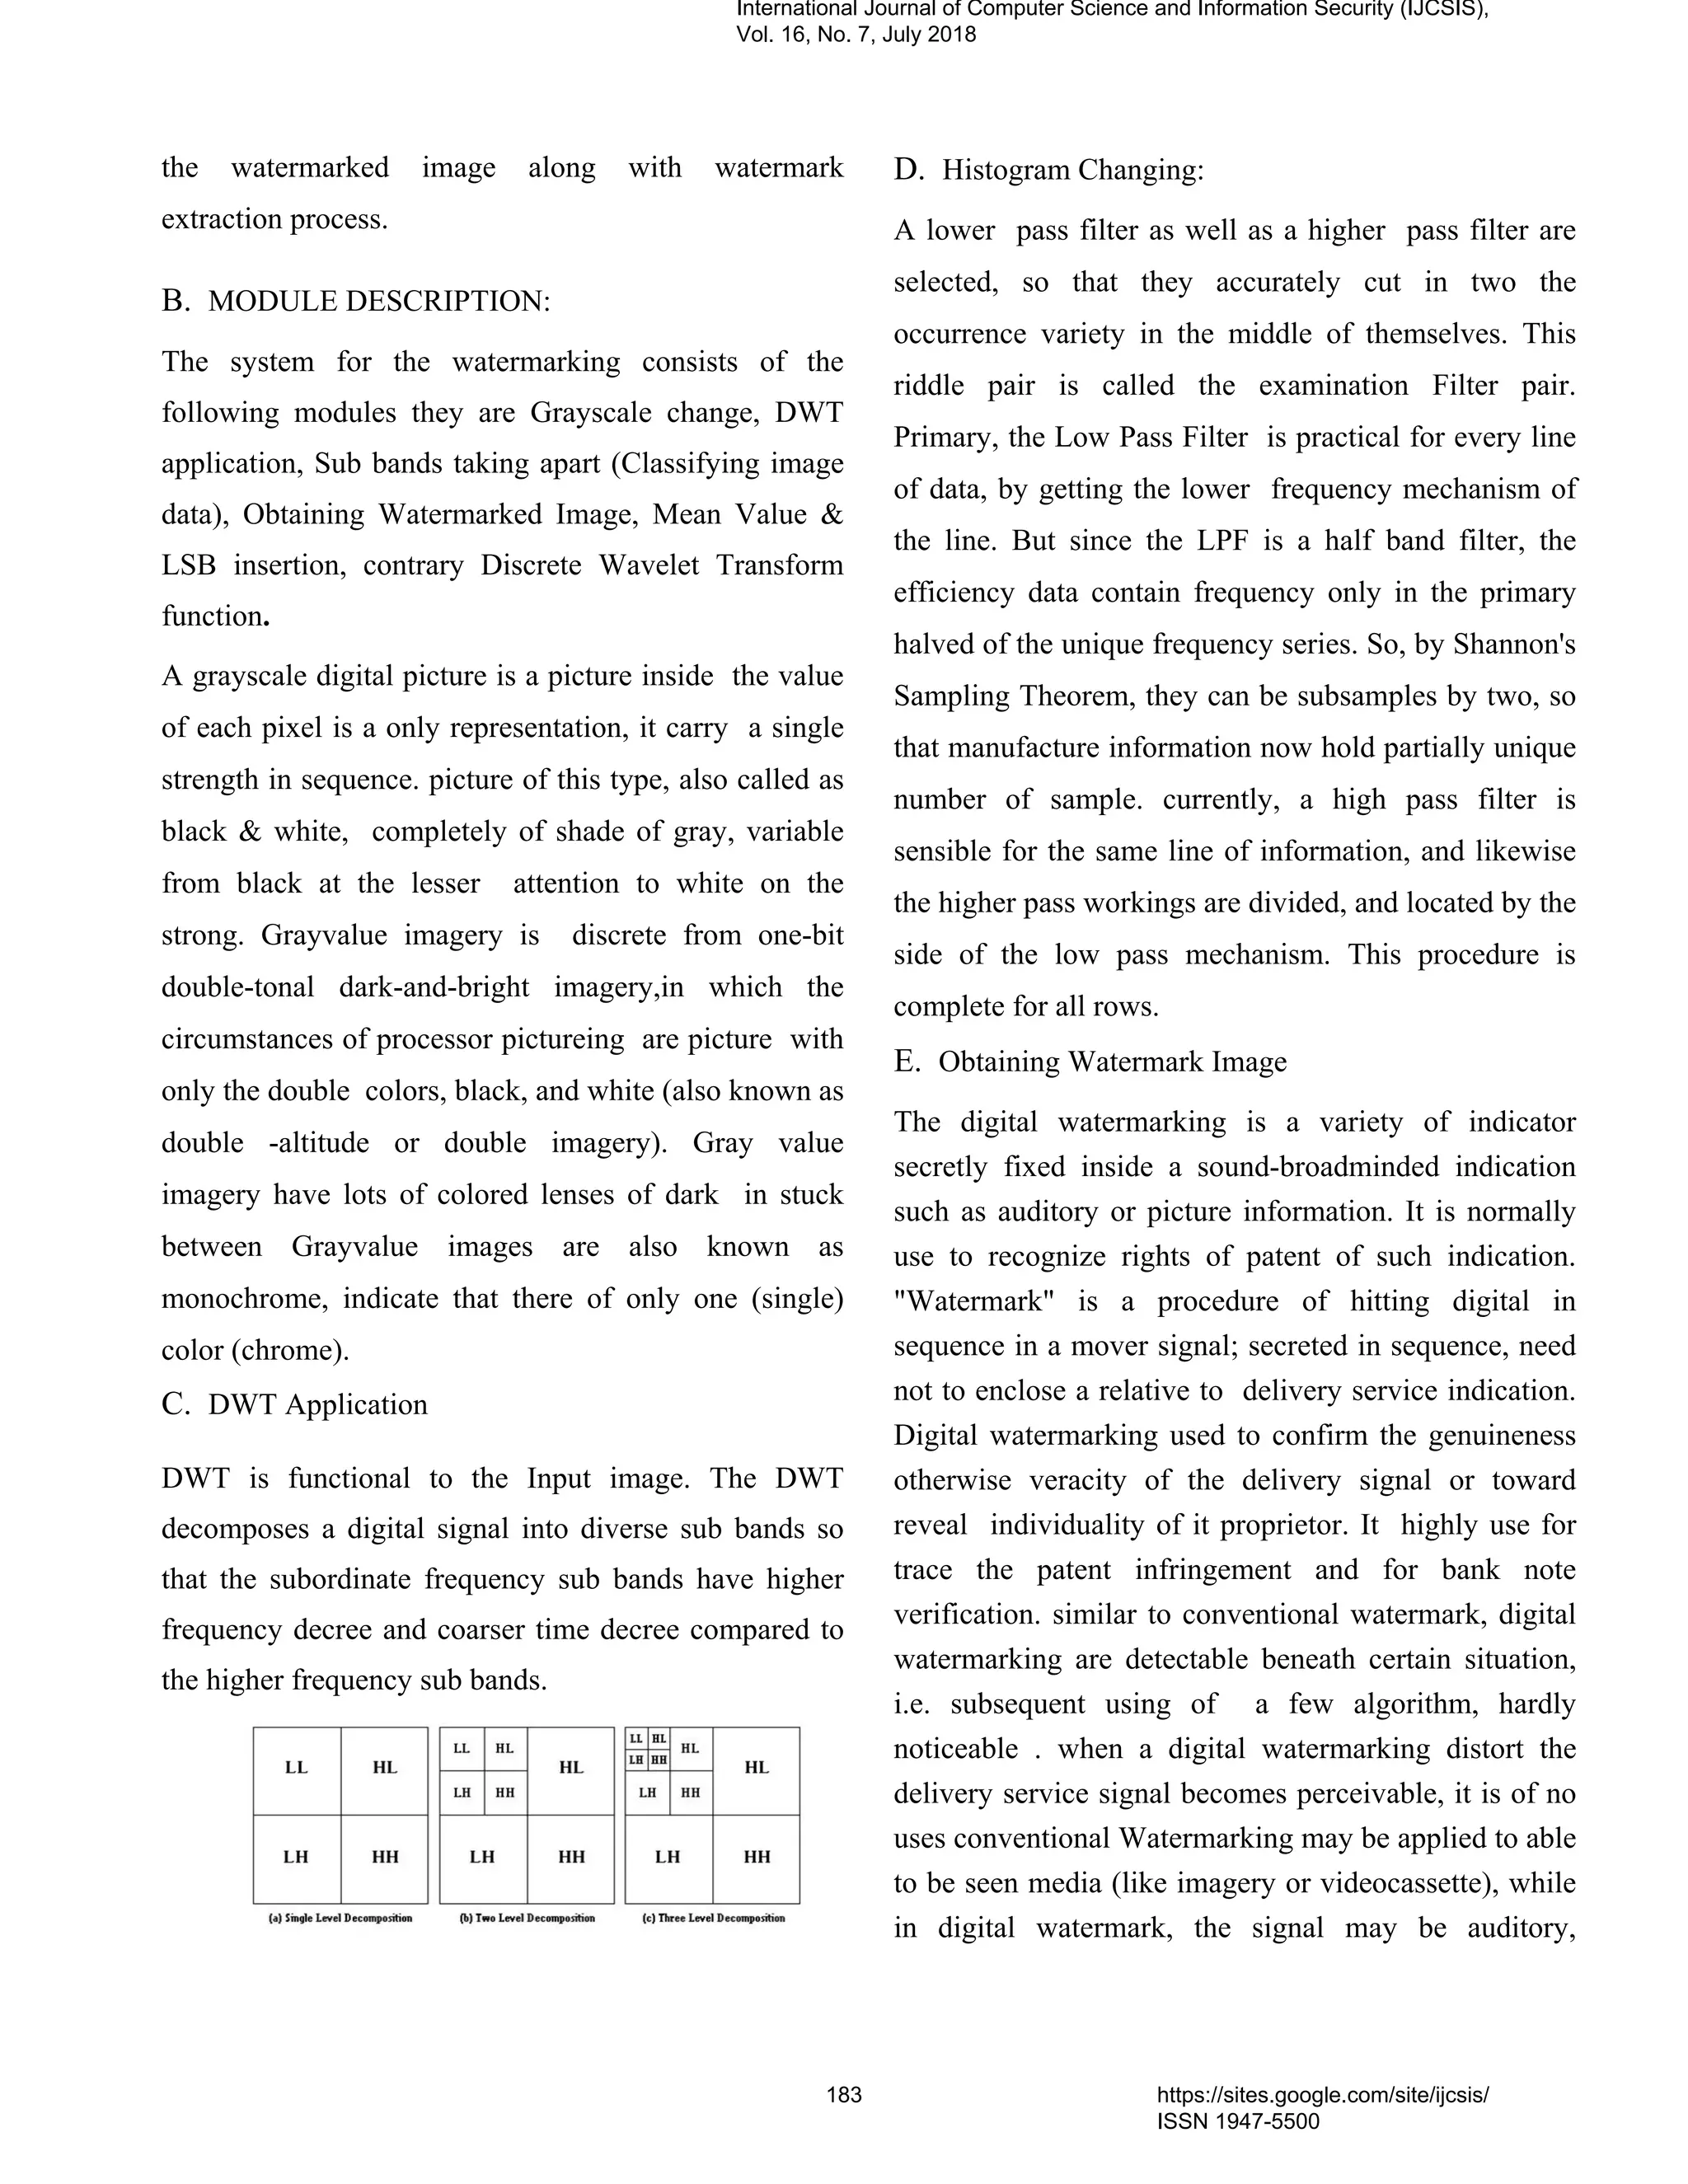
![movies, videotape, text or 3D model. A indication may
take more than a few dissimilar watermarks at identical
time. Unlike interiordata that is additional to the
delivery service signal, a digital watermarking did not
modify the dimension of the delivery service signal.
F. Steps for obtaining watermarked image:
Input: Single 8 bit grayvalue image I, with PxQ pixels
and watermarking iw.
Output: Watermarked image iw, hit the highest peak P,
the minimal point Q, extent of watermark and the
position map a.
Level 1: Scrutinize the picture i and build the histogram
C(c)Є[0, 255]. In these histogram get hold of hit the
highest peak a and less peak b which is equivalent to
(b+c) .
Level 2: Verification the place of pixel value whose
assessments deceit between position a and b.
Level 3: Scrutinize these wrap image i once more.
place counter Y for measurement lengthwise of
watermark. If counter k is lesser than measurement
lengthwise of watermark. If scan pixel value fabrication
surrounded by x and y, increased it by (L-1) .
b. The pixel value fabrication above b, then keep
pixel value as same.
c. The pixel values recline under a-(L-2), then also
keep hold of that pixel values as same.
d. Scrutinize the watermarking, if scan value is 1,
then augment pixel value of a-(L-2)
by (L-1), a-(L-3) by (L-1), a-(L-4) by (L-1)…………a-
(L-L) by (L-1). If scan assessment of watermarking is 0
then did not augment pixel value.
Level 4: Maintain level 3 towards the end of
watermarking. If counter k becomes better than
measurement lengthwise of watermark, does not
modify any charge upto ending of picture scan
completes
VI. EXPERIMENTAL RESULTS:
A wrap image used is a 512×512 gray scale image and
the watermark logo is a 32×32 binary logo. For
extracting the binary watermark logo, each pixel of the
watermark logo needs one block in the host to furnish
its embedded, where any change due to attacks on the
block, only one pixel of the host image is affected, also
one pixel of the watermark logo is affected. Figure 4.1
shows the 512×512 bit gray scale cover image Barbara,
and mandrill, the 32×32 binary image watermark, the
watermarkeded wrap picture and the watermark
construct from HH sub band. A Normalized
Table 1 size of the image
ze of wrap image (gray scale) 2×512
ze of logo image (binary) ×32
aluate cellence SE, PSNR
atermarkeded image
asure milarity C
racted logo
The Watermark Embedded Algorithm in Wavelet
Domain The signal in this channel are process
separately. likewise, in multi resolution disintegration,
the picture is divided into bands of in the region of one
and the similar bandwidth on a log scale. It is
predictable that make use of of the discrete wavelet
convert will permit for self-determining process of the
resultant works with no major perceptible interface
among them, and thus makes the procedure of
imperceptible markes more efficient. DWT
Watermarking implanted procedure is collected of 4
subdivision: inventive picture, computation of multi-
level threshes olds intended for select perceptually
important coefficients, watermarking placing
progression, and inverse wavelet of the coefficients
International Journal of Computer Science and Information Security (IJCSIS),
Vol. 16, No. 7, July 2018
184 https://sites.google.com/site/ijcsis/
ISSN 1947-5500](https://image.slidesharecdn.com/journalofcomputerscienceijcsisjuly2018fullvolume-180915043348/75/Journal-of-computer-science-ijcsis-july-2018-full-volume-198-2048.jpg)
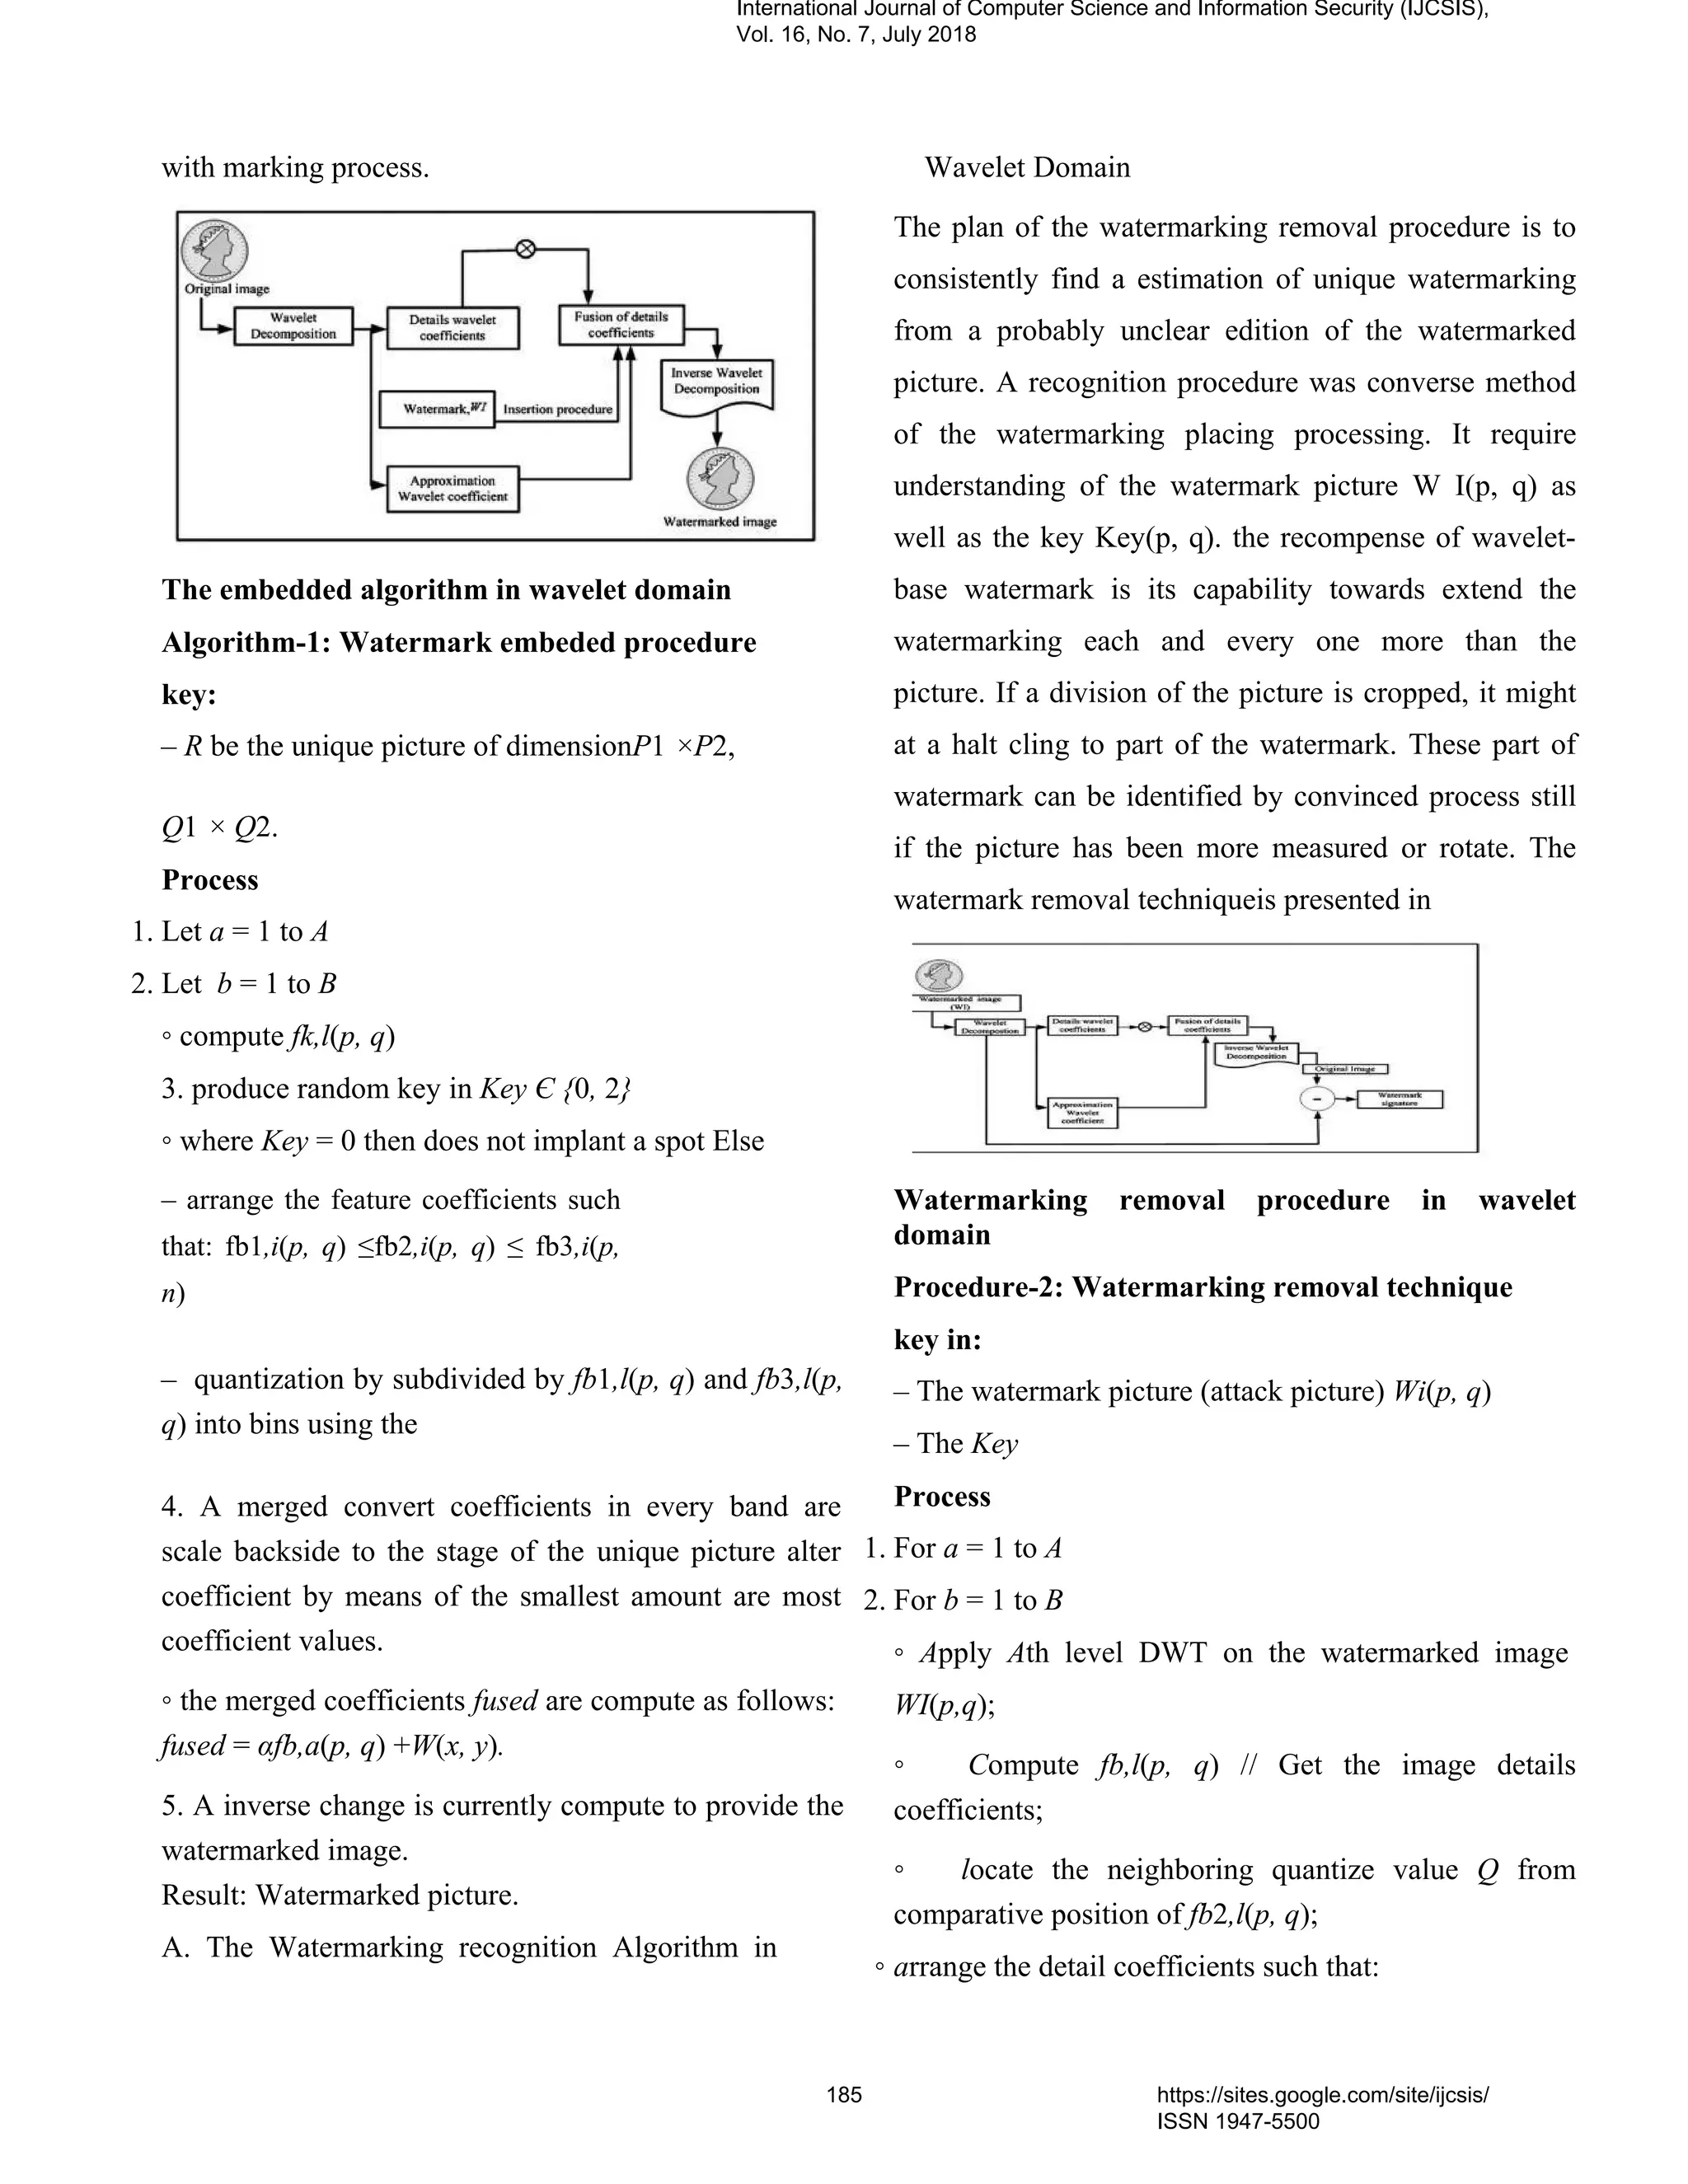
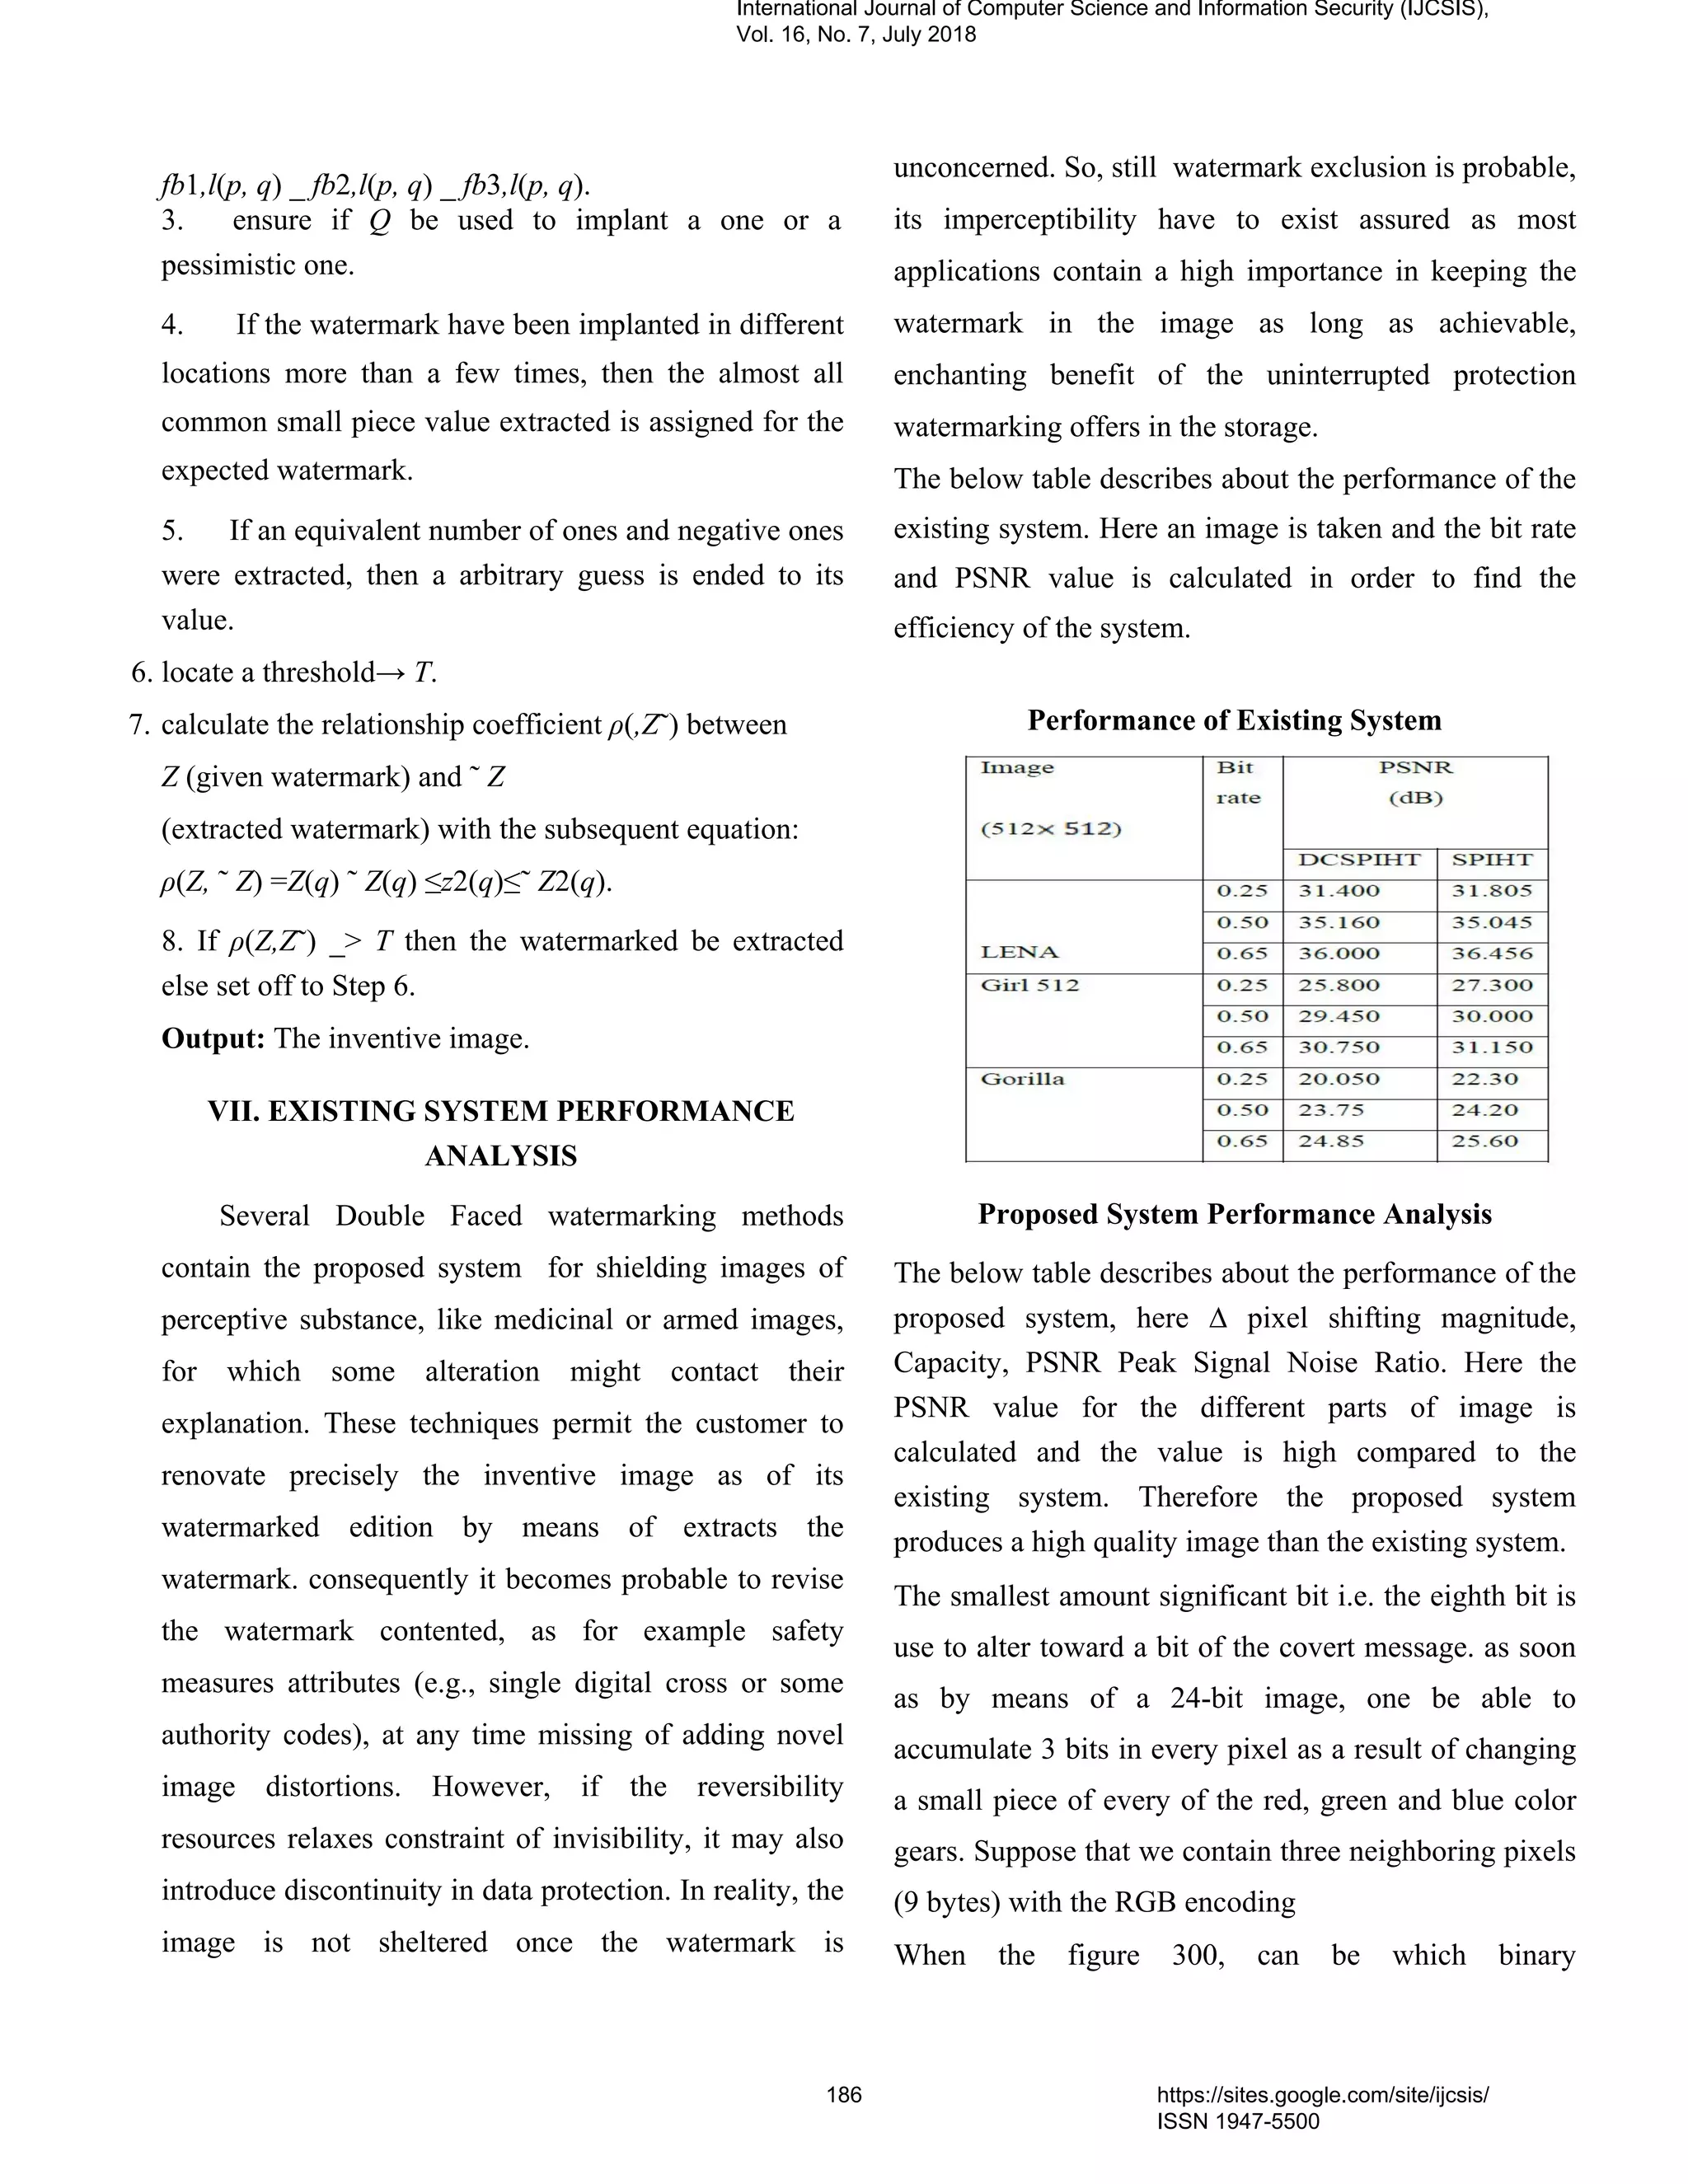
![representation is 100101100 implanted into the least
significant bits of this measurement of the image. If we
overlay these 9 bits over the LSB of the 9 bytes higher
than we get the following (where bits in bold have been
changed)
Table 2 Performance of Proposed System
Use of 2/4 of Use f 2/2 Use
∆=2 the image image whole image
LENA N N N
2 42 4 51 9 29
3 54 8 78 1 58
4 37 7 54 5 72
B
ABOO N N N
N
05 66 1 46 2 11
1 92 1 80 3 97
12 02 2 07 4 16
VIII. CONCLUSION AND FUTURE WORK
improve the inventive image without any alteration
from the distinct image after the unseen data have
been extracted. The SPIHT algorithm does not provide
the required hiding capacity. This also provide the
high PSNR value. But the proposed algorithm produce
thebetter hiding capacity and produce the better pixel
prediction.The proposed algorithm is a extremely
high-quality negotiation in terms of capability and
image quality safeguarding for both medicinal and
natural images. This method can still be improved.
DPEHS can be joint with the expansion embedding
(EE) modulation, as healthy as with a enhanced pixel
prediction. However, this technique is easily broken as
any modifications will impact the watermark. This is
one of the upcoming challenges.
Acknowledged
This study was supported by National centre for
Multiscale Modeling for Biological Systems.
REFERENCE
[1] M.A.Dorairangaswamy, S.Venkatesh,”
Randomized Watermarking Security and Detection
against Sensitivity Analysis Attack”, ICST 2011,
Chennai.
[2] J. Wang, R. Healy, and J. Timoney, 2011,"A
robust audio watermarking scheme based on reduced
singular value decomposition and distortion removal,"
Signal Processing, vol. 91, pp. 1693-1708.
[3] V. Aslantas, 2009,"An optimal robust digital
image watermarking based on SVD Optics
Communications, vol. 282, pp. 769-777.
[4] Ashish Chawla & Pranjal Shukla, “A Modified
Secure Digital Image Steganography based on Dwt
using Matrix Rotation Method”,
[5] International Journal of Computer Science
and communication Engineering, vol 2, pp 20-25, 2013
[6] H S Manjunatha Reddy & K B Raja, ” Wavelet
based Non LSB Steganography”, International Journal
International Journal of Computer Science and Information Security (IJCSIS),
Vol. 16, No. 7, July 2018
187 https://sites.google.com/site/ijcsis/
ISSN 1947-5500](https://image.slidesharecdn.com/journalofcomputerscienceijcsisjuly2018fullvolume-180915043348/75/Journal-of-computer-science-ijcsis-july-2018-full-volume-201-2048.jpg)
![of Advanced Networking and applications, vol
3,issue 3, pp 1203-1209, 2011 .
[7] M. Ravi Shankar Reddy et al., 2013, “A Novel
Method for Steganography in Spatial
Domain”,International Journal of Advanced
Research in computer Science and Software
Engineering, vol 3, issue 10.
[8] Wu S, Huang J, Huang D, Shi YQ: Efficiently self
synchronized audio watermarking for assured audio
data transmission. IEEE Transactions on
Broadcasting2005,51(1):6976,10.1109/TBC.2004.83
8265.
International Journal of Computer Science and Information Security (IJCSIS),
Vol. 16, No. 7, July 2018
188 https://sites.google.com/site/ijcsis/
ISSN 1947-5500](https://image.slidesharecdn.com/journalofcomputerscienceijcsisjuly2018fullvolume-180915043348/75/Journal-of-computer-science-ijcsis-july-2018-full-volume-202-2048.jpg)

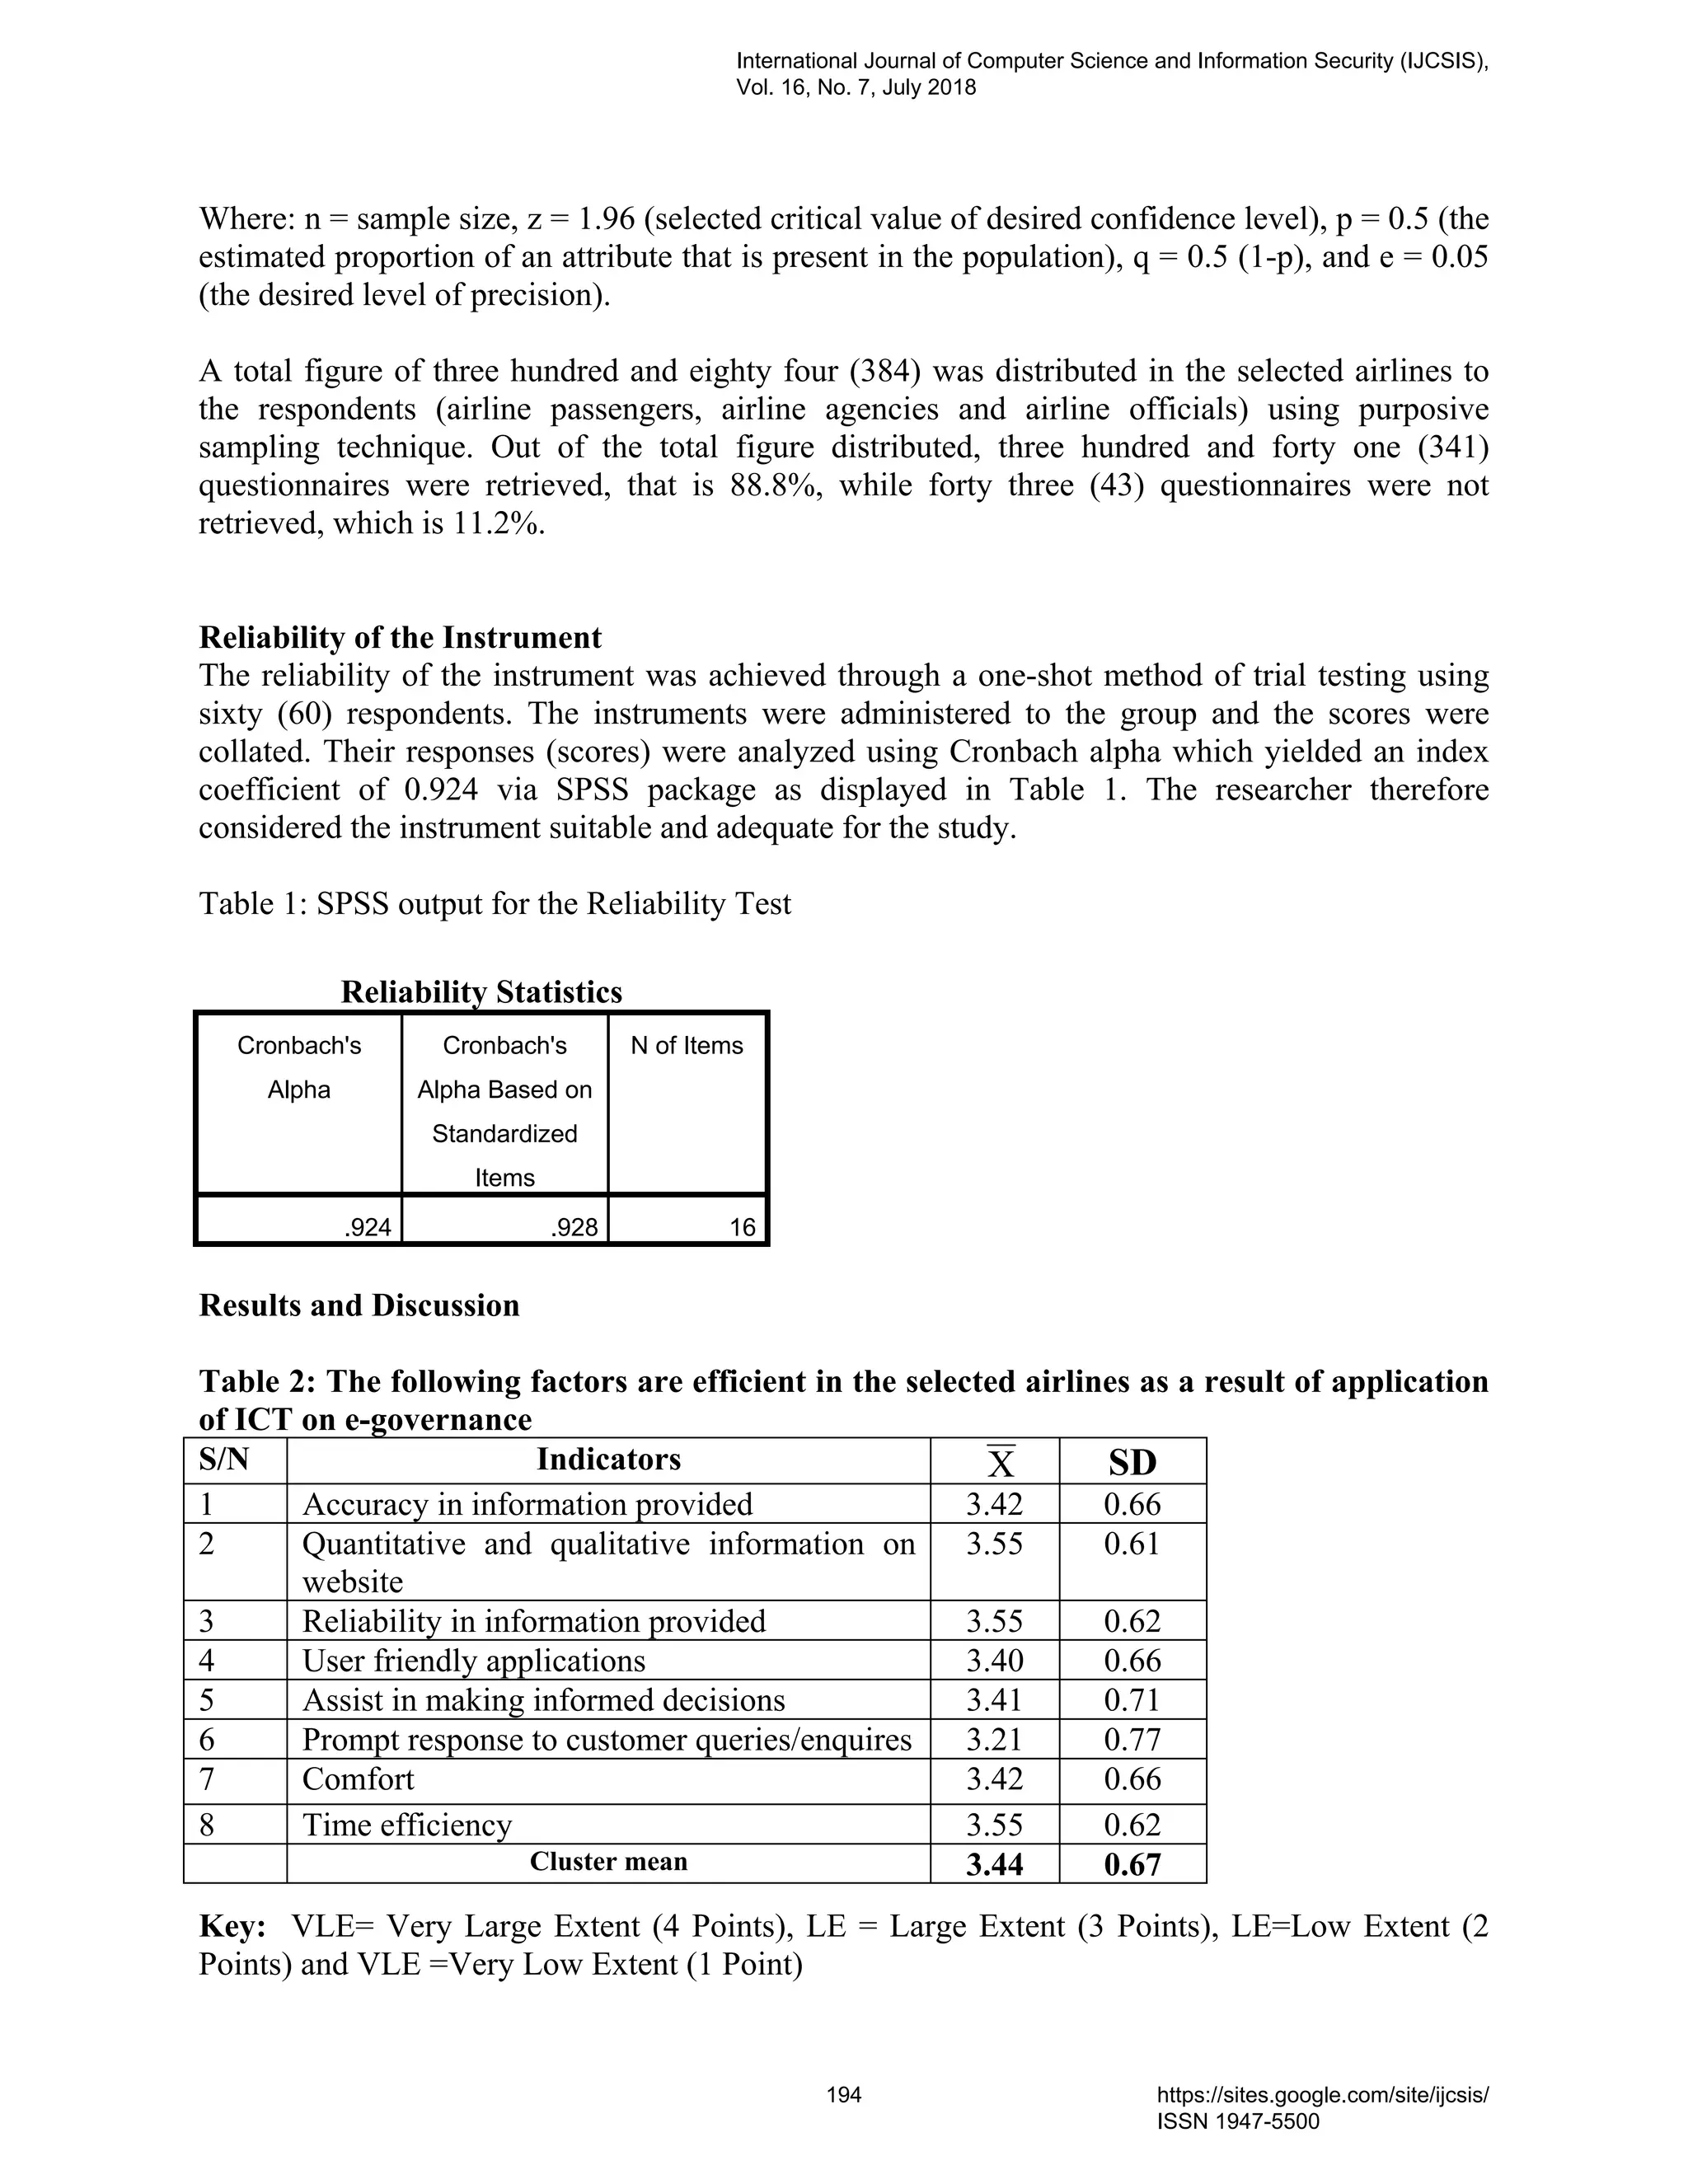

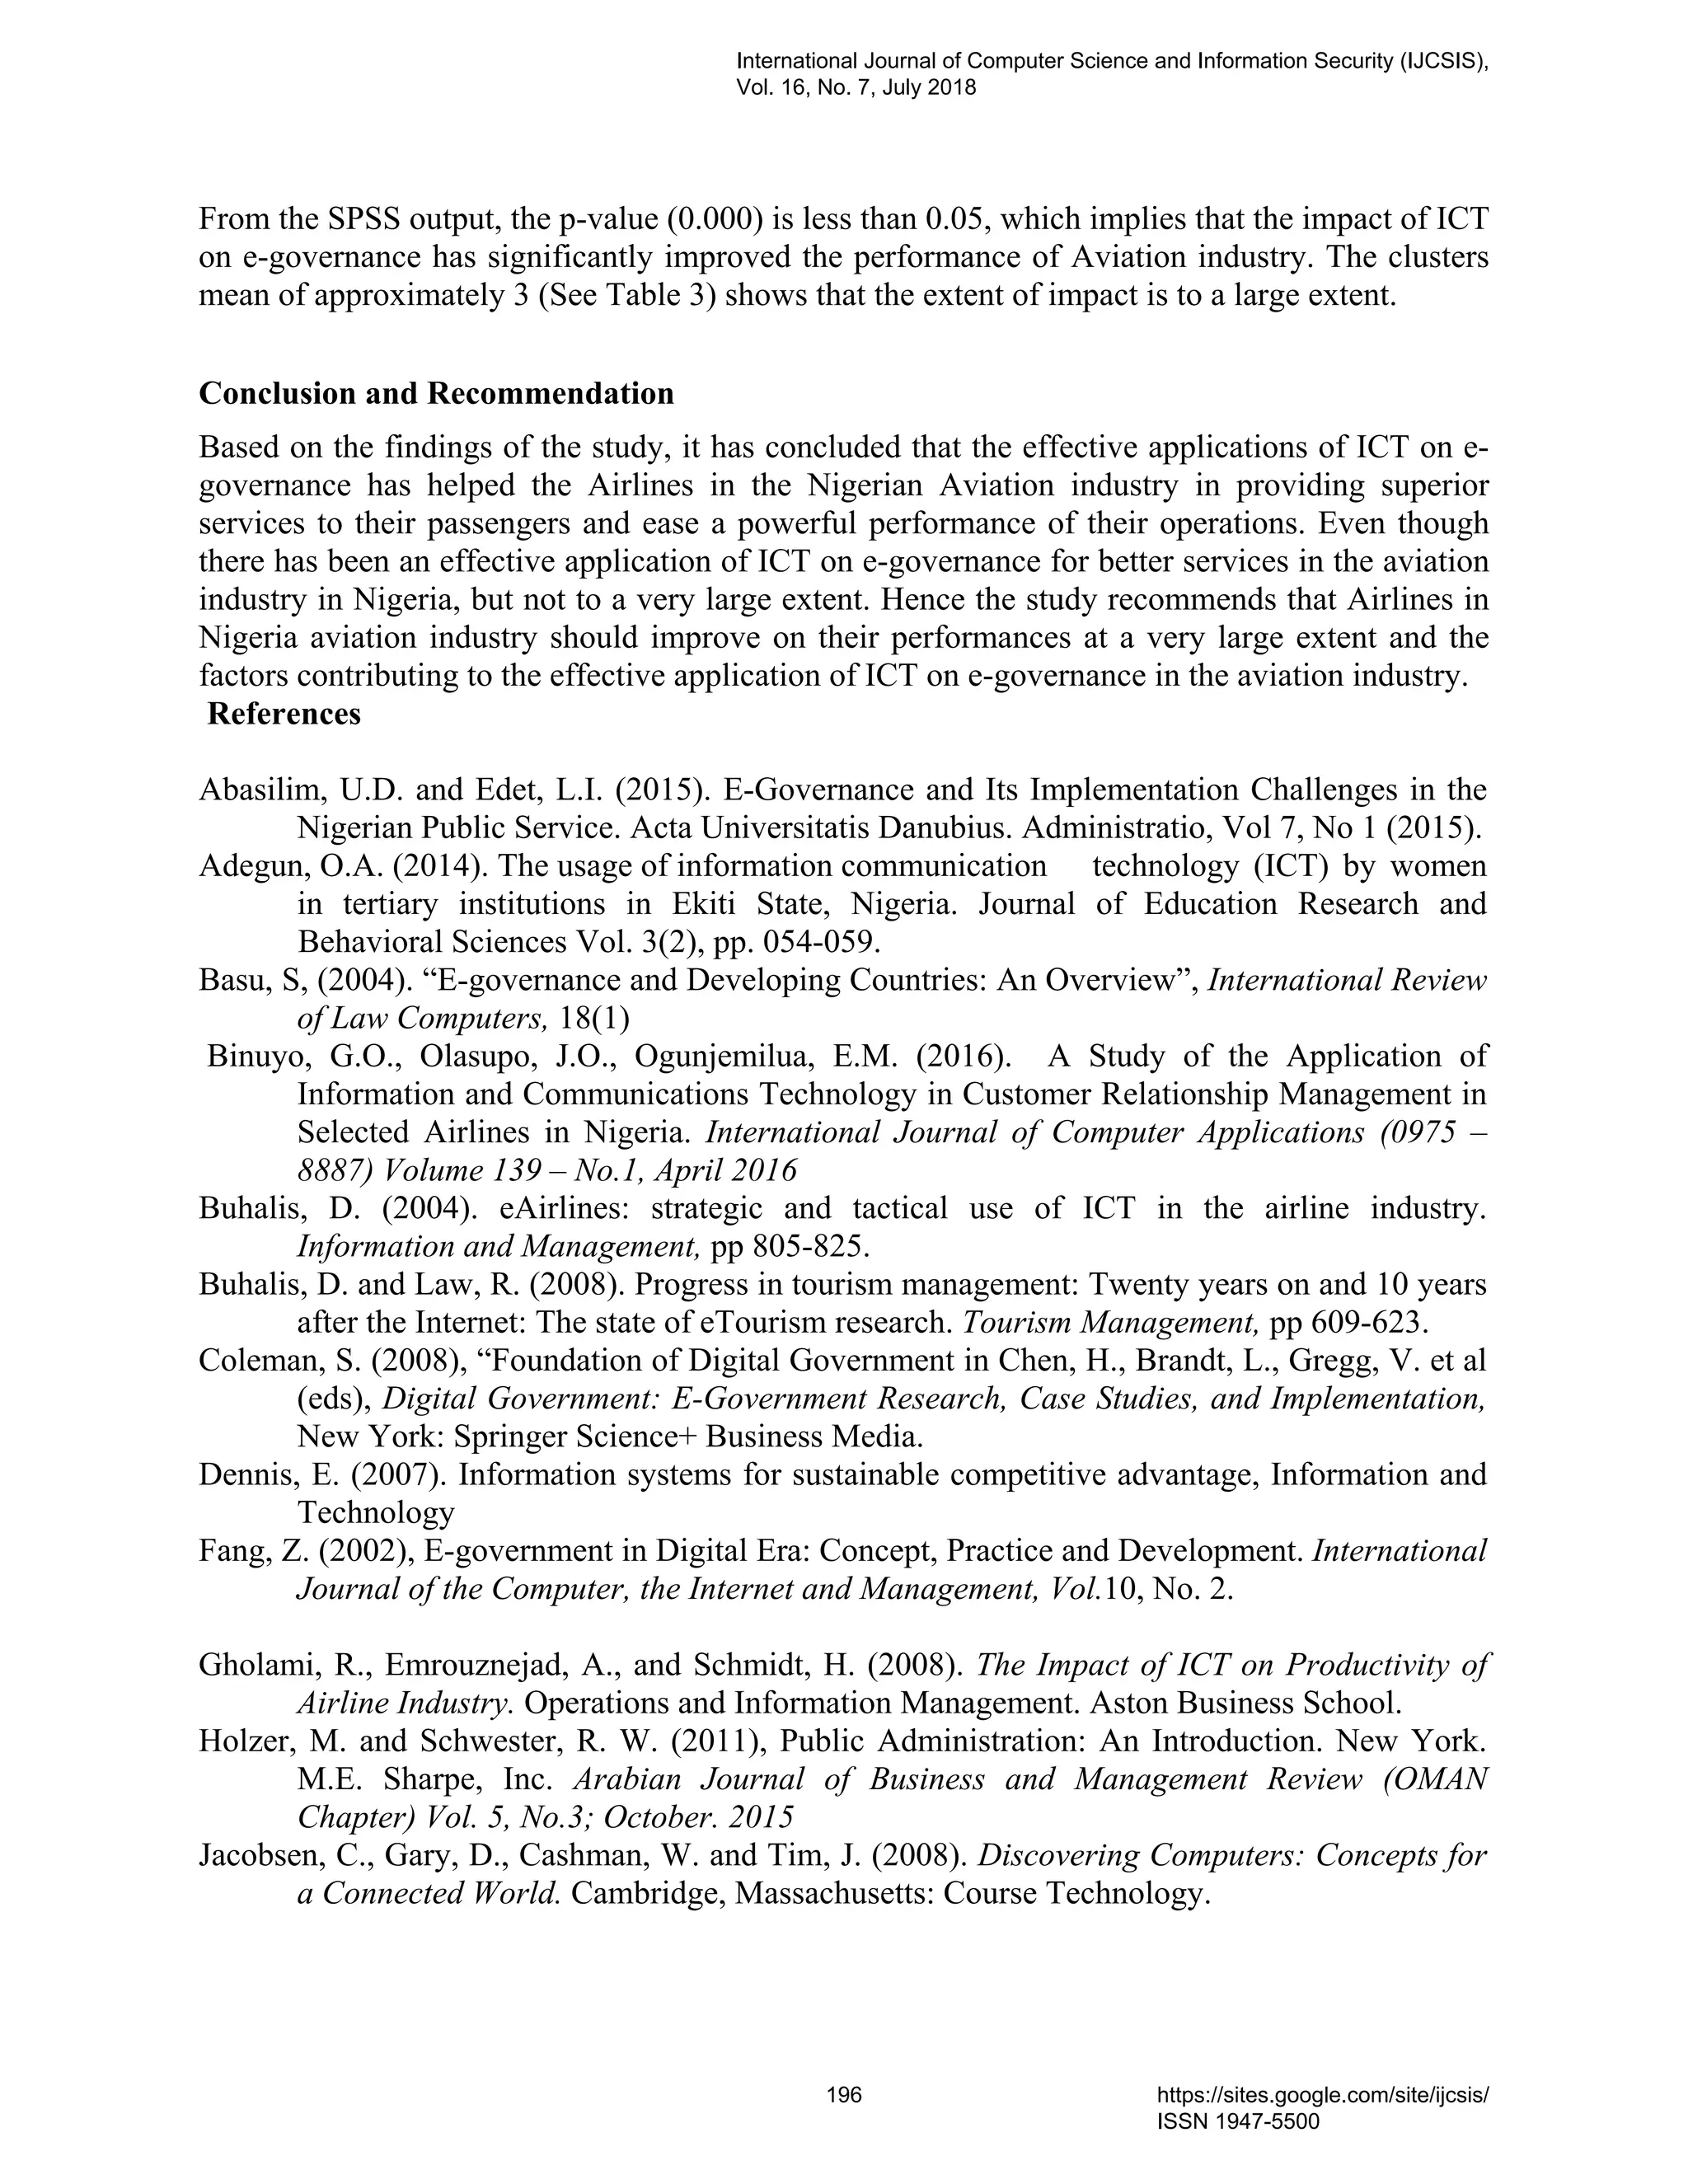
![Integration and Combination of Cryptographic Algorithm for Data
Security in Cloud
a
Kiran Huma,b
Muhammad Sheraz Arshad Malik,
c
Sadaf Safdar, d
Bakhtawar Jabeen,
a, b, c, d
Department of Information technology
Government College University
Faisalabad, Pakistan
Rizwan Arshad
School of Mechanical and Manufacturing Engineering
National University of Sciences and Technology
Islamabad, Pakistan
rizwan.arshad@smme.edu.pk
a
kiran.huma36@gmail.com
Abstract—Cloud computing has no doubt many benefits but it
also has some critical security issues which have become a hurdle
to achieve the trust of clients for migration of data to the cloud.
For security, the number of terminologies and mechanisms are
used, one of them is cryptography. Encryption is a technique of
cryptography which conceals message in such a way that only
destined receiver can use it. But currently, encryption can be
broken by cyber-criminals due to many security loopholes like
unsecured distribution of key. There is a need to find a solution to
these barriers to ensure security. The issues and solutions of DES,
One-time pad, Honey encryption will be discussed in this paper.
These solutions will help to minimize the flaws of these
algorithms and provide the secure novel model. In this model,
data and key encrypt and decrypt by integration and
combination of Data encryption standard, One-time pad, and
Honey encryption. The key is distributed by steganography and
public key cryptography. The comparison of cookies is used for
data integrity. It will be difficult for an intruder to break
multiple encryption without the valid key. The proposed model
will provide more security to cloud storage than previous models.
Keywords-Data Security; One-Time Pad; Data Encryption
Standard; Information; Honey encryption
I. INTRODUCTION
Cloud computing revolutionize the IT industry. In cloud
computing, users register indispensable service from the cloud
provider. They are free from the frivolous task of purchasing
and installing of basic hardware and software structures. This
type of environment allows them to concentrate on the core
parts of the organization which leads to more production and
more profit. There are a lot of benefits of cloud computing. It
reduces the cost of business because vendors have not to
purchase new equipment but they simply request to cloud
provider for resources.
There are a lot of services provided by cloud computing to
business organization e.g. document preparing or searching the
internet. Organizations are migrating their data to the cloud. As
data is stored in the cloud means organizations gives
permission to cloud to manage their data. Now its cloud
responsibility to ensure data security. Security is the most
challenging phase of cloud because of virus attack, worms,
phishing, spoofing, and hacking. Enterprises must think about
these threats before uploading data to the cloud. When you
transferring company’s most important data to cloud provider’s
servers, you must have knowledge either this cloud has the
ability to secure your details from intruders or not. While data
on the cloud, it faces many challenges and these challenges are
increasing with the advancement. The number of users is
increasing so security, privacy and trust issues are also
increasing.
There are a lot of solutions provided by security experts to
secure the client information of which cryptography has stood
out. In cryptography, data must be encrypted before uploading
to the cloud. Data owner permits only particular group member
to access data. Organization’s data is stored on distributed and
connected resources that consist of a cloud. Encryption plays a
vital role to provide a secure environment to distributed and
connected resources. In encryption algorithm, data is
transformed into an unreadable format by using "key”. At
decryption side, data is transformed into a readable format by
using the “key” (the key with which sender has decrypted the
data) at the receiver side. Encryption is used by many IT
experts by using a single algorithm with the large key or public
key algorithm [6] to build a secure system. A single algorithm
is fast as compared to hybrid but what is the value of speed if
data is stolen? A single system [5] is not more secure than the
hybrid. If the key is stolen whole data will be breach by an
intruder. The problem in public key algorithm is private key
theft.
A hybrid cryptographic algorithms are more secure than
single algorithm because of integration of different algorithms.
In this paper, there is a brief explanation of integration and
combination of One-time pad,Data Encryption Standard,
Honey Encryption and secure distribution of key, encryption of
key and source authentication.
II. LITERATURE REVIEW
AES and RSA [1]: In this Paper, the cloud is secured by
authentication, secure sharing.
Enhanced data security using AES, RSA and SHA
algorithm [2]: In this paper, enhanced data security using AES,
RSA and SHA algorithm with the minimal cost and effort is
achieved.
Diffie Hellman algorithm for key generation, digital
signature for authentication, AES to encrypt/ decrypt [3]: A,
International Journal of Computer Science and Information Security (IJCSIS),
Vol. 16, No. 7, July 2018
198 https://sites.google.com/site/ijcsis/
ISSN 1947-5500](https://image.slidesharecdn.com/journalofcomputerscienceijcsisjuly2018fullvolume-180915043348/75/Journal-of-computer-science-ijcsis-july-2018-full-volume-212-2048.jpg)
![model is presented which provide facility to avoid data
modification at the server end.
AES, Elliptic curve cryptography, Elliptic curve Diffie
Hellman, Blowfish Algorithm, Digital Signature [4]: In this
paper, authentication and access control mechanism is
presented.
One-time pad using 512 key size [5]: An algorithm which
reduces the occurrences of brute force attack.
Data security is provided by implementing RSA algorithm
[6]: This paper present mechanism in which only authorized
user can access the data.
DES, S-CEM [9]: A model is presented which provide
confidentiality and privacy of data.
III. PROPOSED MODEL
The model is proposed for the data security and also
provide the secure way for the distribution of key. In this
model, simple algorithms are used which are not commonly
used nowadays because of their weaknesses. This model will
cover these weaknesses. It consists of three layers.
• The first layer assures the security by XORing of data
with a Public key of receiver and integration of Xored
data into DES and DES data into the One-time pad.
• The second layer consists of encryption of data and
key. The final key is encrypted by public key of the
receiver which is accessed by that receiver which has
the private key of the paired public key. There is a
question arises why encryption of key is needed?
While using public key cryptography. The answer is,
there will be a chance of private key theft. In that case,
if the attacker has the private key, the attacker will not
be able to read message due to combination and
integration of keys. The knowledge of the order of
combination and integration of algorithms must only
known to sender and receiver.
• The Third layer consists of Integrity check by cookies
comparison mechanism.
This model is used for critical data which needs to be
secure at any cost. The below Figure1 presents the overview of
the proposed model.
Figure 1. Proposed Model
IV. EXPLANATION
At the sender side and receiver side below algorithms are
implemented.
A. DES (Data Encryption Standard)
DES consist of 16 round and each round consist of
expansion, round function, s-box, permutation. It consists of
the 64-bit key but uses only 56 bit and these 56 bits are further
converted into different 48 bits for encryption and decryption.
Encryption side consist of two permutation one is initial
permutation and second is final permutation and these
permutations are called p-Boxes. At encryption side, plain-text
is transformed into cipher-text by passing 16 rounds of the
algorithm. At the decryption side, the cipher-text is transformed
into plain text by passing through 16 rounds of DES algorithm
but in inverse order by using same keys as used in encryption.
Each round is decrypted or encrypted by different 48-bit keys.
Permutation of 64-bit input X and then it divides into half
32 bits left L0, 32 bits right RO. The right half goes to function
F and go through the process of expansion, 32 bits now become
48 bits. The key generator generates the key. Key is XORed
with R0 48 bits. Then 8 S-boxes receive 6 bits each
(8*6=48).S-boxes convert 6 bits to 4 bits in each box, and now
we have 4*8=32 bits. Permutation has done and now have 32
bits. These 32 bits XOR with left 32 bit and then Lo becomes
R1 and so on. After the 16th round, permutation takes place in
reverse and got output Y.
B. One-Time Pad
A one-time pad is an algorithm in which unique keys are
randomly generated. One key is used only once to encrypt
information and send to the receiver. And at the decryption
side, only that receiver is able to read information which has
the similar one-time pad key generated by the sender. Each
encryption is not related to next so that no one finds out the key
by brute force. Each encryption and key is unique.
C. Honey Encryption:
It is a type of encryption in which when an incorrect key as
guessed by an attacker is used to decrypt the message, it creates
seeming reasonable yet incorrect plain-text. It protects against
brute force attack.
D. Steganography
Hide the message into image, audio or video or any other
media. It is used to avoid the attacker. An attacker will have no
idea that these media contain any type of sensitive information.
E. Trusted Authority
A trusted third party that establishes a shared secret key
distribution between two parties. Each user has its own unique
private key.
F. Public Key Cryptography
Public key cryptography consists of the public and private
key. Public key spread widely and the private key is only
International Journal of Computer Science and Information Security (IJCSIS),
Vol. 16, No. 7, July 2018
199 https://sites.google.com/site/ijcsis/
ISSN 1947-5500](https://image.slidesharecdn.com/journalofcomputerscienceijcsisjuly2018fullvolume-180915043348/75/Journal-of-computer-science-ijcsis-july-2018-full-volume-213-2048.jpg)
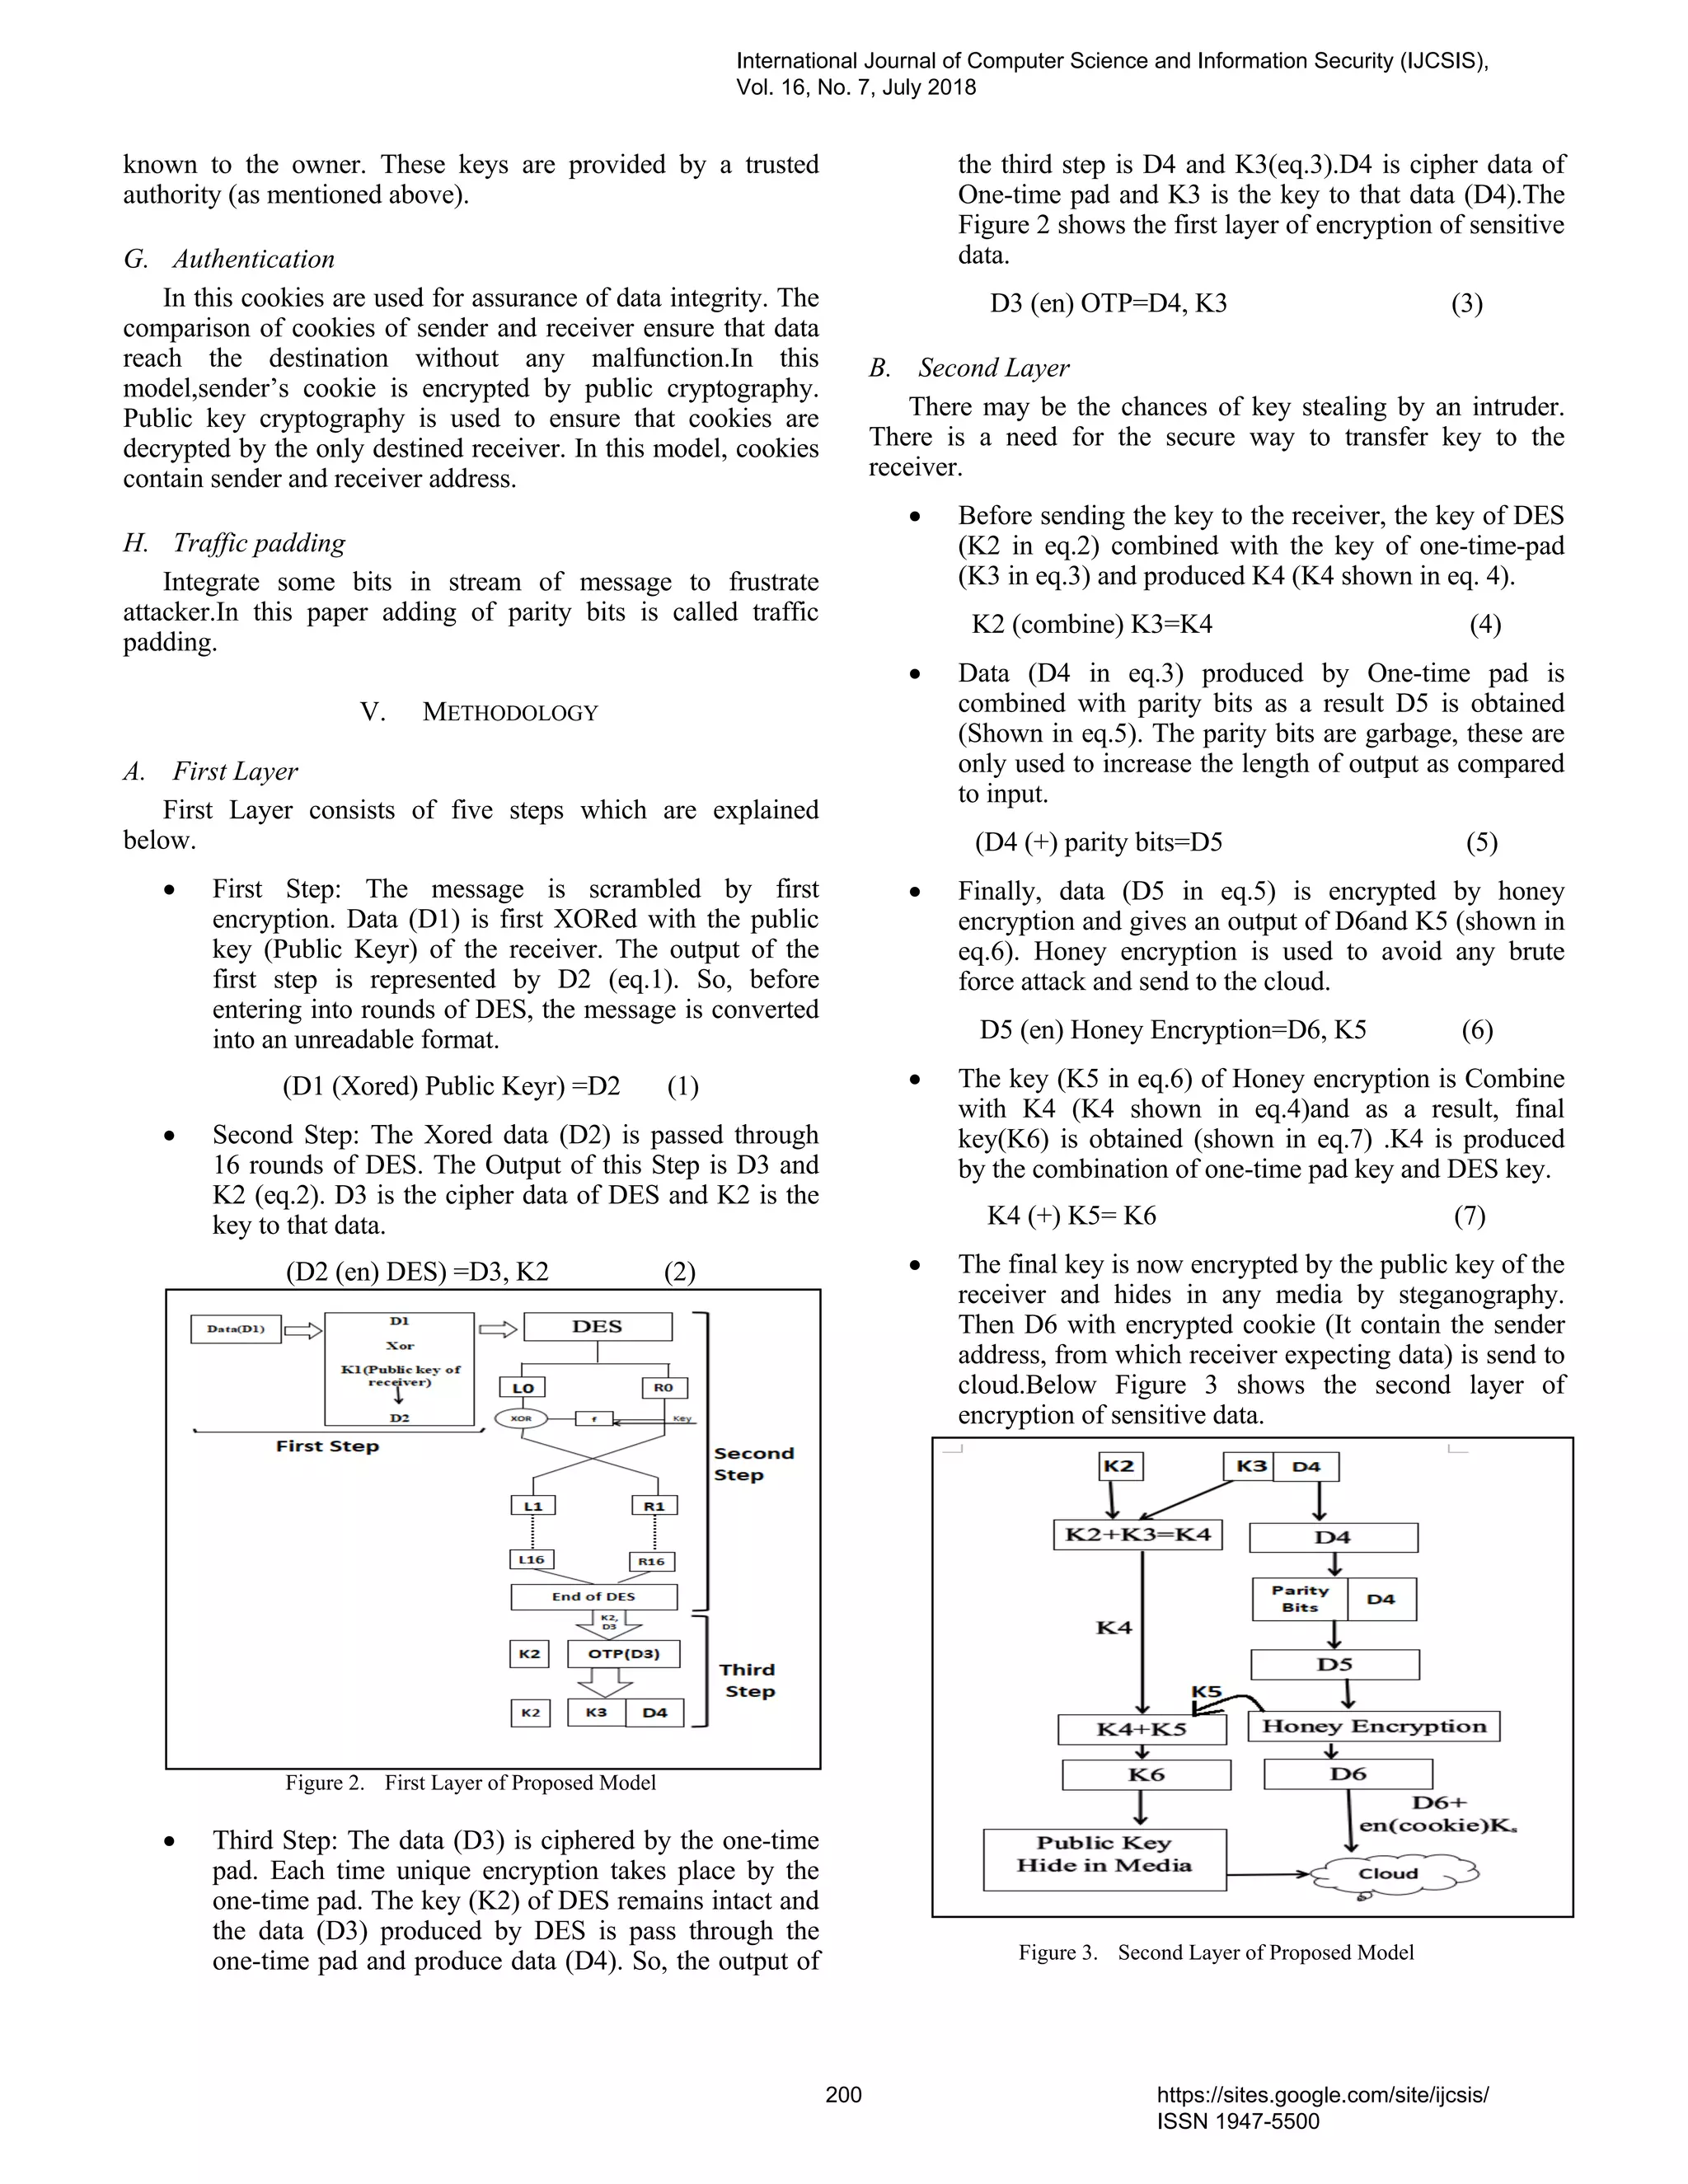
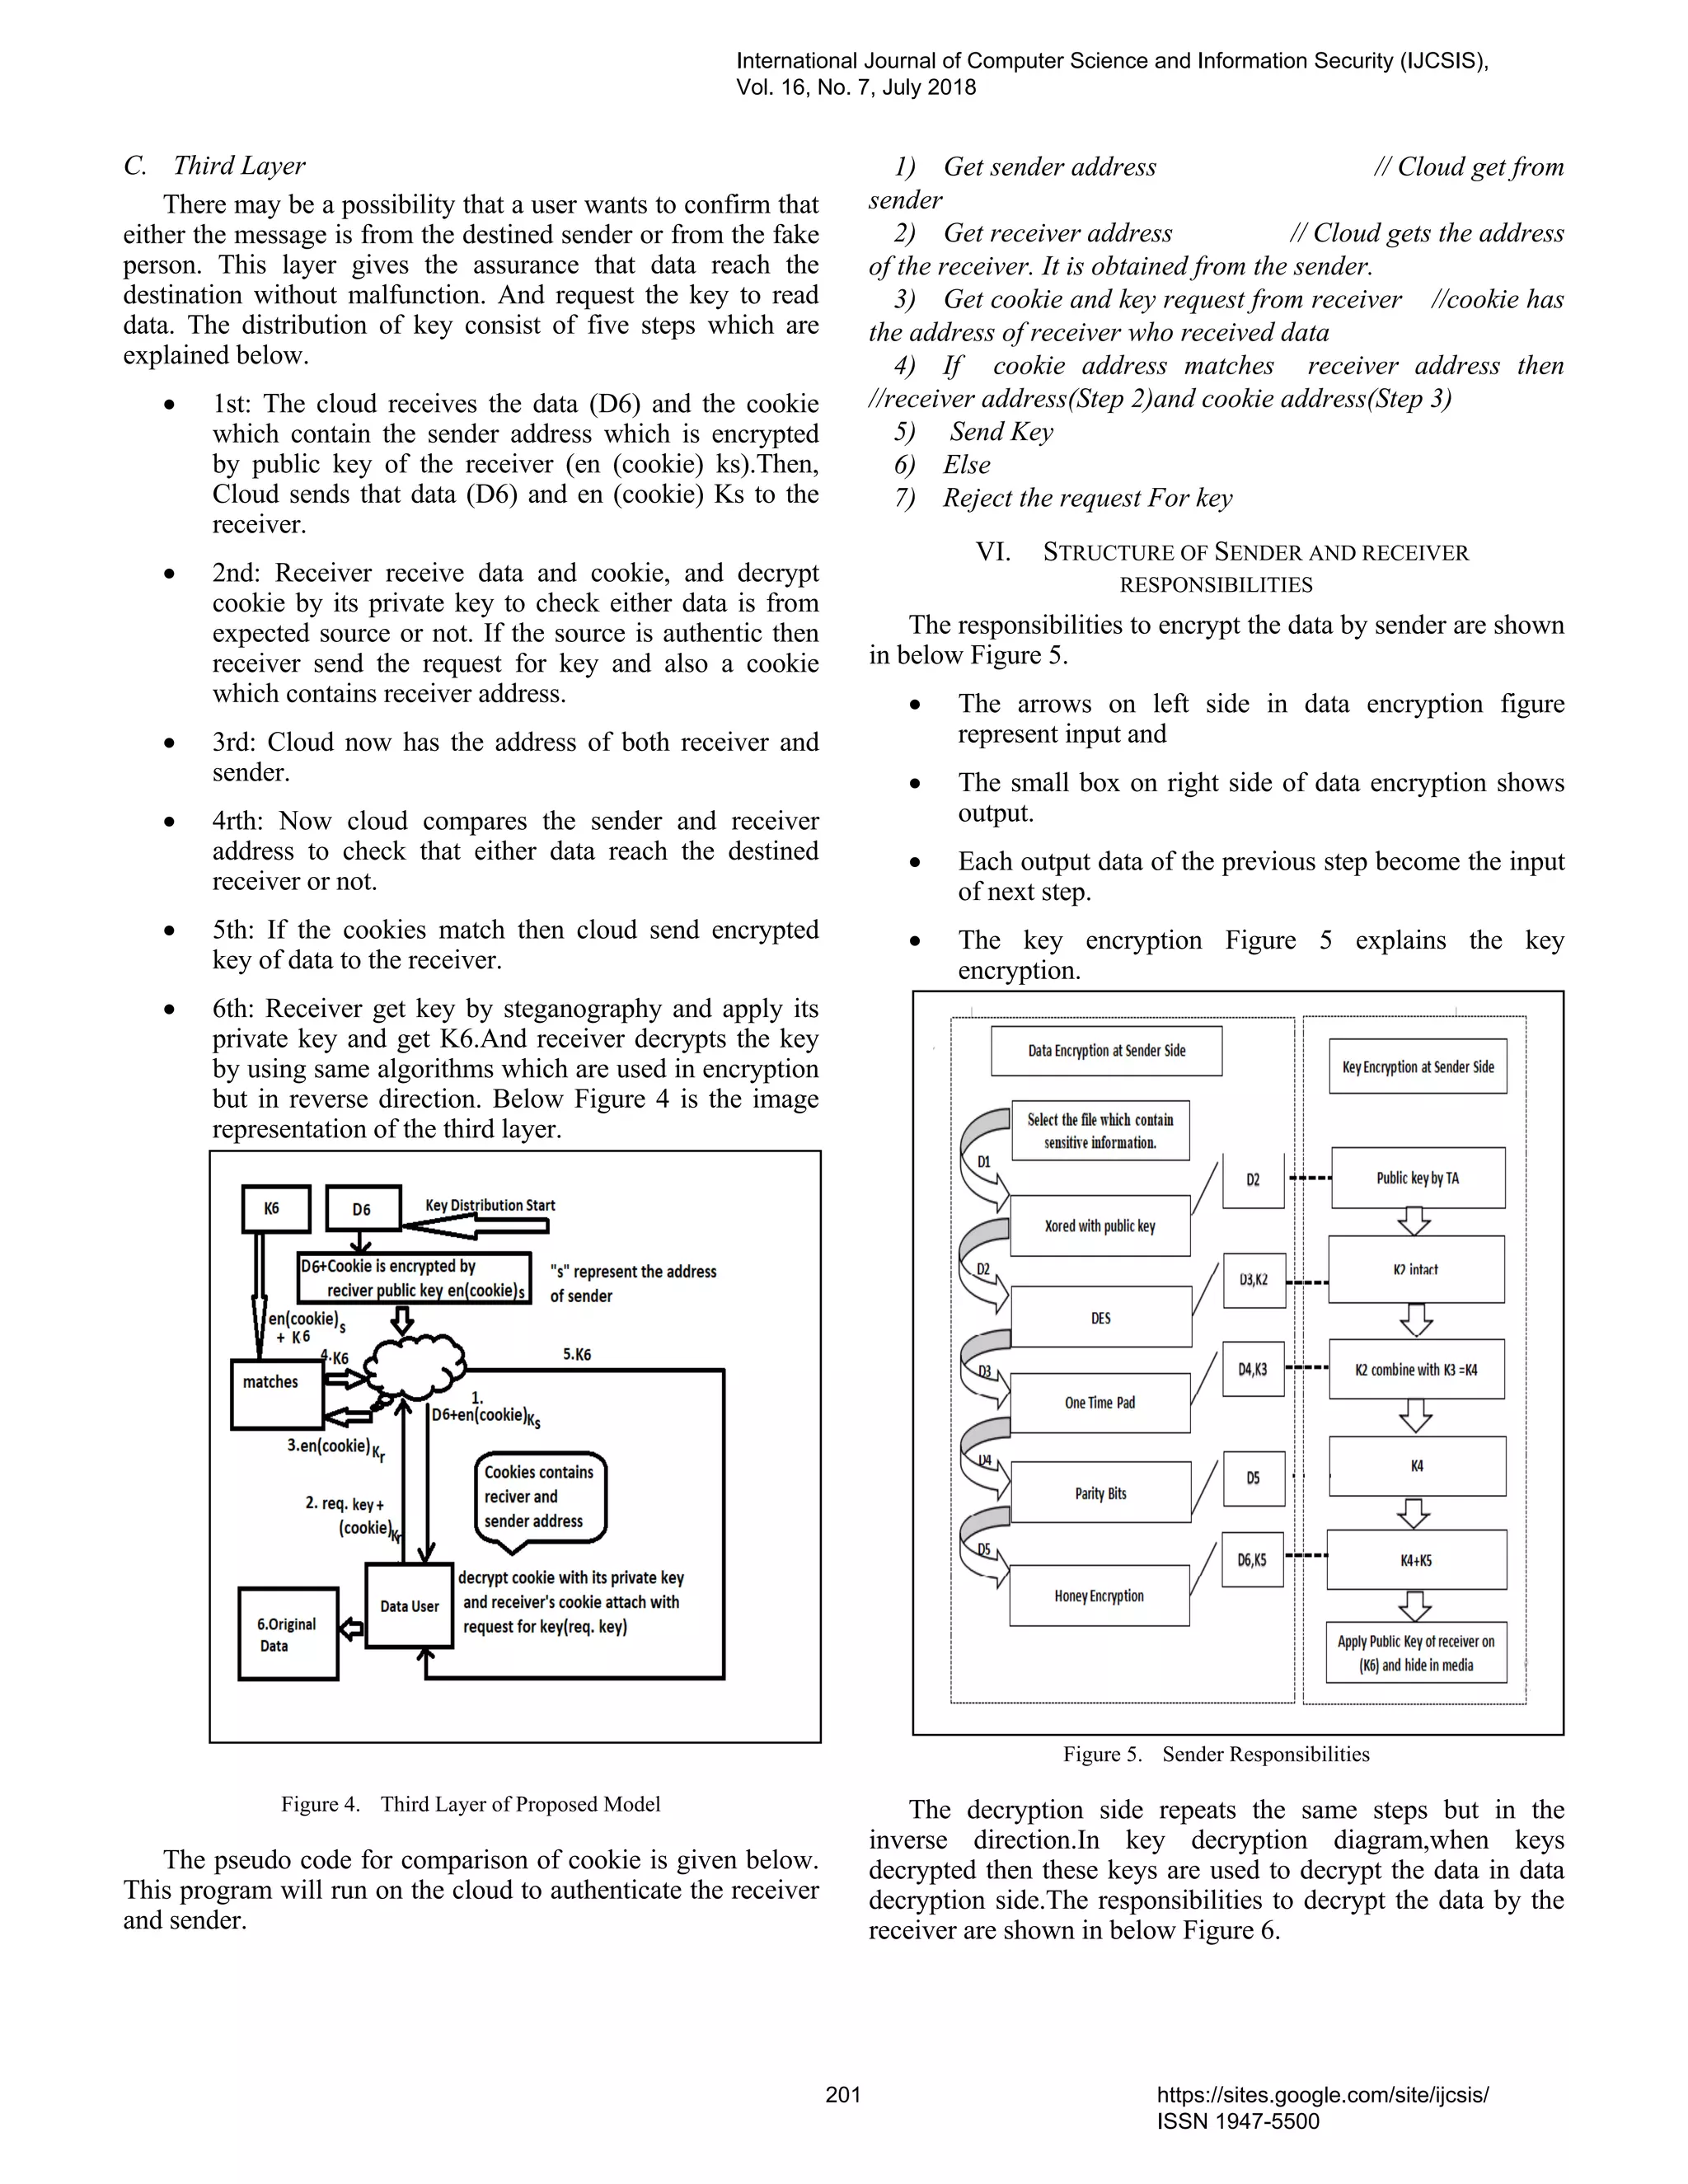
![Figure 6. Receiver Responsibilities
VII. RESULTS AND DISCUSSION
A. Weakness and their Solutions
• Two chosen input to an S-box it can give the same
output in DES
In this model, public key XORed with data solved this
problem. Because before entering into DES, data is scrambled
by XORing. So, if the intruder tries to guess the data by two
chosen input to an S-box it will not produce any readable data.
• The problem with the one-time pad is that it requires a
pad of the same length as the message to be encrypted,
and it must need to transmit securely. Now intruder
knows the length of data which may cause brute force
attack.
In this model, the length of output text is greater than input
text. The parity bits are used to increase the length of the output
of encryption.
• Known-plain text in honey encryption
If the intruder has an idea that plain-text must match in
order to licit, they can guess the data encrypted by honey
encryption. This problem is solved by integration of more than
one algorithm.
• Private key theft
If the private key is stolen.The hacker will not able to use
this key to decrypt data because key is also encrypted.The
way(order of algorithm) to decrypt key is only known to
receiver and sender.
B. Encryption Server Provider And Decryption Server
Provider
Below Table 1 and Table 2 summarize the whole
encryption and decryption processes.
TABLE I. ENCRYPTION
Data Encryption Key Encryption
(D1(Xored)PublicKeyr=D2(eq.1) K1 is the public key of the
receiver.
D2(en)DES=D3,K2 (eq.2) K2 remain intact
D3(en)OTP=D4,K3 (eq.3) K2(combine)K3=K4(eq.4)
(D4(comb)parity bits=D5 (eq.5)
D5(en)Honey Encryption=D6,K5
(eq.6)
K4(comb)K5= K6 (eq.7)
Apply Public Key
Hide by Steganography
TABLE II. DECRYPTION
Key Decryption Data Decryption
Get Key from media
Apply Private key and get K6
Apply K6=K4, K5
Apply K5 on D6=D5
Apply K4=K2,K3 Get D4 by discarding parity bits
K3 Apply K3 on D4=D3
K2 Apply K2 on D3=D2
Public Key of receiver(K1) D2(Xored)Public Key(K1)=D1
VIII. CONCLUSION
In this paper, a novel model is discussed to make data
secure from the intruder. The mechanisms used in model are
used to overcome the risk of security breaching in cloud
computing system. The model is used to send data and key
without alteration and breaching. This model consists of three
layers. The first layer encrypts data, the second include
integration and combination of keys, public key cryptography,
steganography, data combination with parity bits and
encryption, and the third layer provide source authentication.
ACKNOWLEDGMENT
We authors thank our Government College University,
Faisalabad, Pakistan who provided insight and expertise that
greatly assisted the research.
REFERENCES
[1] K. Chachapara and S. Bhadlawala, "Secure sharing with cryptography in
cloud computing," presented at the Nirma University International
Conference on Engineering Ahmedabad, India, 2013.
[2] M. Sudha, M. Monica, "Enhanced Security Framework to Ensure Data
Security in Cloud Computing Using Cryptography," (in English),
Advances in Computer Science and its Applications, vol. 1, no. 1, pp.
32-37, 2012.
[3] P. Rewagad and Y. Pawar, " Use of Digital Signature with Diffie
Hellman Key Exchange and AES Encryption Algorithm to Enhance
Data Security in Cloud Computing," presented at the Communication
Systems and Network Technologies (CSNT), Gwalior, India, 2013.
[4] N. Gajra, S. Khan and P. Rane, "Private cloud security: Secured user
authentication by using enhanced hybrid algorithm," presented at the
International Journal of Computer Science and Information Security (IJCSIS),
Vol. 16, No. 7, July 2018
202 https://sites.google.com/site/ijcsis/
ISSN 1947-5500](https://image.slidesharecdn.com/journalofcomputerscienceijcsisjuly2018fullvolume-180915043348/75/Journal-of-computer-science-ijcsis-july-2018-full-volume-216-2048.jpg)
![International Conference Advances in Communication and Computing
Technologies (ICACACT), Mumbai, India, 2014.
[5] O.Ayokunle A, F.Adekogbe, O.Ernestc and P.Uchendu, "An
Implementation of a One-Time Pad Encryption Algorithm for Data
Security in Cloud Computing Environment," Research Journal of
Mathematics and Computer Science, vol. 1, no. 6, 2017.
[6] P. Kalpana and S. Singaraju, "Data Security in Cloud Computing using
RSA Algorithm," International Journal of Research in Computer and
Communication technology, vol. 1, no. 4, 2012.
[7] R.V. Rao and K. Selvaman, "Data Security Challenges and Its Solutions
in Cloud Computing," presented at the Computer, Communication and
Convergence (ICCC), Bhubaneswar, Odisha, India, 2015.
[8] R. Arora, A. Parashar, "Secure User Data in Cloud Computing Using
Encryption Algorithms," International Journal of Engineering Research
and Applications vol. 3, no. 4, pp. 1922-1926, 2013.
[9] T. Aravindh, S. Shyam Chander, R. Rukmani and G. Kalaichelvi,
"Secured Cloud Storage for Strategic Applications - A case study,"
presented at the Sixth International Conference on Advanced Computing
(ICoAC) Chennai, India, 2014.
[10] Varsha, A. Wadhwa, S. Gupta, "Study of Security Issues in Cloud
Computing," International Journal of Computer Science and Mobile
Computing, vol. 4, no. 6, pp. 230 – 234, 2015.
[11] S. Khan, R.R. Tuteja, "Security in Cloud Computing using
Cryptographic Algorithms," International Journal of Innovative
Research in Computer and Communication Engineering, vol. 3, no. 1.
[12] D. Jamil, H. Zaki, "Security Issue in cloud computing and
Countermeasures," International Journal of Engineering Science and
Technology, vol. 3, no. 4, 2011.
[13] D.Chen, H. Zhao, "Data Security and Privacy Protection Issues in Cloud
Computing," in International Conference on Computer Science and
Electronics Engineering, Washington, DC, USA 2012, vol. 1, pp. 647-
651 IEEE.
.
International Journal of Computer Science and Information Security (IJCSIS),
Vol. 16, No. 7, July 2018
203 https://sites.google.com/site/ijcsis/
ISSN 1947-5500](https://image.slidesharecdn.com/journalofcomputerscienceijcsisjuly2018fullvolume-180915043348/75/Journal-of-computer-science-ijcsis-july-2018-full-volume-217-2048.jpg)
![RFID READER COLLISION AVOIDANCE USING CSMA/CA WITH
FIBONACCI BACKOFF ALGORITHM
1
Olanrewaju, B. S.; 2
Thanni, A. M.; 3
Deji-Akinpelu, O.O.; 4
Olanrewaju, O. T. and 5
Osunade, O.
1
Dept of Computer Science, Wellspring University, Benin City, Nigeria
2,3,5
Dept of Computer Science, University of Ibadan, Nigeria
4
Dept of Computer Science, Federal College of Animal Health and Production Technology, Moor Plantation, Ibadan, Nigeria
1
bs.olanrewaju@gmail.com, 2
thanni073664@gmail.com, 3
omokehindeakinpelu@gmail.com, 4
ayotundetaiwo@gmail.com, 5
seyiosunade@gmail.com
Abstract—The perception of risks in the usage of information and
information systems especially over public and private network
in recent times is becoming higher due to increased activities in
cyber-crimes. There are various security measures that have
been adopted to curb these malicious activities. One of these
measures is the Radio Frequency Identification (RFID) system.
However, the performance of RFID is reduced due to inherent
collisions of information during transmission. This paper seeks to
improve performance of RFID by introducing an algorithm that
reduces RFID reader collision during transmission of
information. The algorithm uses Carrier Sense Multiple Access
with Collision Avoidance together with Fibonacci Backoff. The
performance of this new algorithm is compared with an existing
Binary Exponential Backoff algorithm using collision percent
and throughput as performance metrics. The results shows that
Fibonacci Backoff algorithm has lower collision percent and
higher throughput when compared with Binary Exponential
Backoff algorithm in a simulation carried out using MATLAB.
This paper therefore, presents an algorithm that reduces collision
problems in RFID readers and better throughput during
transmission to enhance RFID performance in cyber security.
Keywords: cyber security, RFID, RFID collisions, CSMA/CA
1 INTRODUCTION
To curtail network security breaches in every aspect of
cyberspace which encompasses not only the online world and
the Internet but also the wired and wireless world of
communication in general is the concern of cyber-security
measures where information and information systems are
protected from unauthorized users and attack [1], [2]
(Williams and Sawyer 2003 and Pande, 2017). One major and
developing technology to achieve the goal of cyber security is
the Radio Frequency Identification (RFID) system [3]
(Konidala and Kim, 2007). Among many uses of RFID for
cyber security is the one presented by [4] Swati (2014) where
RFID used to track stolen devices is used together with “kill
switch system to remotely destroy the stolen devices data
making it useless for the thieves.
RFID is a means by which objects are tracked and identified
by the use of radio frequency transmission. A RFID consists
of readers which use radio frequency to communicate with
tags. RFID technology is used wildly in large industries such
as logistics and transportation and even in government [5]
(Kamdar et al, 2016). RFID improves on the regular barcode
technology in that with RFID, larger sets of unique IDs can be
identified. Also, objects can be identified from long distances
unlike barcode technology. Based on power and modulation
modes, the two types of RFID systems are the active and the
passive system [6] (Finkenzeller, 2010). The difference
between the two systems is the means by which they are
powered which are by battery and magnetic energies
respectively.
A great fall back in the RFID technology is Reader collision
and tag collision which definitely affects the performance of
RFID in ensuring prompt and adequate cyber security [7]
(Waldrop et al, 2003). Reader collision is a situation where
close by readers establish communication with a tag
simultaneously while tag collision is a situation where a reader
cannot identify a tag data when more than a tag occupies the
same communication channel. Signals from one reader might
interfere with signals from other readers. This interference is
called Reader collision. Reader collision is categorized into
two. The first is the reader-reader collision which occurs when
a reader transmits a signal which is interfered by the signal
transmitted by another reader. The second is reader-tag
collision when a tag is in the transmission zone of more than
one reader.
Different algorithms have been used in the past to solve reader
collision problems in RFID systems [7] (Waldrop et al, 2003).
This research focuses on solving reader-to-tag collision
problems in large-scale RFID networks to improve its
performance in cyber security. This research aims to improve
RFID reader collision avoidance through carrier sense
multiple access with collision avoidance (CSMA/CA)
mechanism with FibonacciBack-off Algorithm. The
Objectives include using CSMA/CA with Fibonacci Backoff
Algorithm to perform channel reservation with almost zero-
collision among RFID Readers and to evaluate the
performance of CSMA/CA in collision avoidance in RFID
system in terms of throughput and collision minimizing
behaviour.
International Journal of Computer Science and Information Security (IJCSIS),
Vol. 16, No. 7, July 2018
204 https://sites.google.com/site/ijcsis/
ISSN 1947-5500](https://image.slidesharecdn.com/journalofcomputerscienceijcsisjuly2018fullvolume-180915043348/75/Journal-of-computer-science-ijcsis-july-2018-full-volume-218-2048.jpg)
![2 LITERATURE REVIEW
RFID is defined as technology that uses radio waves to
transfer data from an electronic tag, RFID tag or label that has
been attached to an object through a reader for the purpose of
identifying and tracking the object. RFID automatically
identifies and tracks tags attached to objects through the
transmission from its readers [5] (Kamdar et al, 2016). Active
tags have a local power source and can therefore operate
hundreds of meters from the RFID reader while the passive
tags collect energy from a nearby RFID reader’s interrogating
radio waves. Radio frequency has moved from obscurity into
mainstream applications which help speed the handling of
manufactured goods and materials because of its ability to
identify from a distance. Unlike Barcode technology, RFID
can support a larger set of data such as manufacturer of
devices, product type and even environmental factors such as
temperature. In addition, RFID can differentiate from different
tags located in the same area.
RFID-enabled systems help companies cut costs, improve
customer service and reduce labour. A major advantage of all
kinds of RFID system is that they work contactless and require
no line of site. They are also reliable in tough environments
and allow for bulk detection because of their remarkable speed
even in difficult conditions.
The major components of RFID systems are the tag, antenna
and reader. Tags are devices made up of an electronic circuit
and an integrated antenna which hold data [8] (HKSAR,
2008). It is a microchip combined with an antenna in a
compact package. The antenna is responsible for the
transmission of information between the reader and tag using
radio waves. There are two classes of tags which are the active
tags and passive tags [9] (Sridhar, 2005). Active tags require a
power source and they are either connected to a powered
infrastructure or they use energy stored in an integrated
battery. An example of an active tag is the transponder
attached to an aircraft that identifies its national origin.
Passive RFID attracts more attention because they do not
require batteries or maintenance. Passive tags have no power
source or transmitter. They are powered by the signals that are
sent by the reader to the tags [10] (Roy, 2006). Passive tags
are cheaper and have a shorter range of about 4-15 feet.
Reader is the source of the RF energy used to activate and
power the passive RFID tags. RFID readers are capable of
reading the information stored on tags laced in their vicinity.
The reader energizes the tags in the vicinity with Radio
Frequency (RF) power continuously for the entire read
operation. For the tag response, part of the RF power is
transmitted back to the reader using a process called
backscattering. Most radio frequency identification
applications such as supply markets, localization and object
tracking activity use passive RFID tags. Figure 1 shows the
components of RFID systems.
.
Figure1: RFID components
RFID tags can be attached to equipment/user personal/official
belongings such as organization ID and vehicles. By using
RFID, permission can be granted, revoked or access can be
recorded. RFID is also used for auditing and controlling
security persons. Its application provides checkpoints for
patrolling security guards. In this case, checkpoints are RFID
tags which security guards need to scan during their sequential
patrols. Airline industries also employ RFID in their
packaging and delivery service. Handling large amount of
packages from many places to various destinations on
different routes can be very complex. In this scenario, RFID
application provides best resource management. The
transportation industry also benefits from the RFID
technology by making toll collecting/charging better with
improved traffic flow. This application helps to keep good
traffic flow and to identify traffic patterns.
Tag collisions and reader collisions are the two types of RFID
collisions.The reader collision also known as the reader
interference problem occurs when a tag is within the
interrogation zone of a reader A and within the interference
zone of another reader B. Due to the interference of the
readers, either the tag cannot receive the request command
from reader A correctly or reader A cannot interpret the
response from the tag properly. This is called the reader
collision problem [6] (Finkenzeller, 2010). For tags to be
identified in the interference zone, a reader sends a request to
ask tags to send back their IDs. When multiple tags within a
reader’s interrogation zone responds to this request
simultaneously, collision occurs and the reader cannot identify
any tag properly. This is called tag collision [6] (Finkenzeller,
2010).
Anti-collision in RFID refers to the different ways to keep
radio waves from one device from interfering with radio
waves from another device. Anti-collision algorithms are used
International Journal of Computer Science and Information Security (IJCSIS),
Vol. 16, No. 7, July 2018
205 https://sites.google.com/site/ijcsis/
ISSN 1947-5500](https://image.slidesharecdn.com/journalofcomputerscienceijcsisjuly2018fullvolume-180915043348/75/Journal-of-computer-science-ijcsis-july-2018-full-volume-219-2048.jpg)
![in RFID readers to enable a single reader to read more than
one tag in the interference zone. Anti-collision Algorithms can
be divided into tag anti-collision and reader anti-collision
algorithms [6] (Finkenzeller, 2010).The reader Anti-collision
Algorithm is classified into three which are the TDMA (Time
Division Multiple Access), FDMA (Frequency Division
Multiple Access) and CSMA (Carrier Sense Multiple Access).
In TDMA, the time period is divided into intervals and to
allow a reader to transmit messages only within its allocated
intervals. There are two more anti-collision protocols under
TDMA which are Distributed Colour Selection (DCS) and
Colorwave algorithms [11] (Daniel, 2002). FDMA technique
allows multiple transmission channels to work together at the
same time by using different operating frequencies. In this
technique, a tag not only receives power from the reader
broadcasted signal but also utilized the signal as the carrier of
its modulated backscatter signals [6] (Finkenzeller, 2010).
CSMA entails listening of the transmission channel so if the
channel is sensed free, transmission is enabled and if the
channel is sensed busy, transmission is inhibited. There are
several types of CSMA protocols: 1-Persistent CSMA, Non-
Persistent CSMA, P-Persistent CSMA. Each of these kinds
has different way of dealing with the collisions that can occur
when more than one station attempts to transmit on the shared
medium at the same time
3 METHODOLOGY
3.1 Introduction
Since it is not easy to detect collisions in wireless medium
such as Radio Frequency Identification, CSMA based MAC
protocol has been developed to avoid collisions in dense RFID
networks. This paper proposes the use of CSMA/CA with
Fibonacci Backoff Algorithm. The algorithm is commonly
used to schedule re-transmissions after RFID reader collisions.
The retransmission is delayed by an amount of time derived
from the slot time and the number of attempts to retransmit
called back-off timer. The MAC layer specified by The IEEE
802.11 standard and its contention free service provided by the
Distributed Coordination Function (DCF) to control channel
access is adopted in this paper.
3.2 System model
A large-scale RFID system is considered with multiple readers
and homogeneous local density of RFID tags within the
interrogation area. Readers are assumed to have homogeneous
properties. Therefore, their communication range is assumed
to be the same with the assumption of the existing of an
overlapping area in their interrogation areas.
Before transmitting a data frame, a station must sense the
channel to determine whether any other station is transmitting.
If the medium is sensed to be free for a DCF inter-frame space
(DIFS) time interval, the transmission will proceed otherwise
the transmission is deferred until the end of the current
transmission. A random interval, henceforth referred to as the
Backoff time, is then selected, which is used to initialize the
Backoff timer. The Backoff timer is decreased for as long as
the channel is sensed as idle, stopped when a transmission is
detected on the channel, and reactivated when the channel is
sensed as idle again for more than a DIFS. The station is
enabled to transmit its frame when the Backoff timer reaches
zero. The ACK is transmitted by the receiver immediately
after a period of duration equal to SIFS. The Backoff time is
slotted. Specifically, the Backoff time is an integer number of
slots uniformly chosen in the interval (0, CW-1), where CW is
the contention window defined as the Backoff window. In
addition, whenever a nodedetects an erroneous frame, the
node defers its transmission by a fixed duration indicated by
EIFS, i.e., extended inter-frame space time. This time is equal
to the SIFS + ACKtime + DIFS time.
This paper also employ RTS/CTS access method which is an
additional four-way handshaking technique and very effective
in solving the hidden terminal problem. When the sender
wants to transmit a packet, it sends a short frame called
request to send (RTS) instead of the packet first after the
channel has been sensed idle for a DIFS. When the receiver
detects the RTS, it responses, after a SIFS, with a clear to send
(CTS) frame. A successful RTS/CTS exchange reserves the
channel for the sender-receiver pair. Other stations adjust their
Network Allocation Vectors (NAVs) based on the duration
field of the RTS or of the CTS. The sender starts to transmit
the packet after a SIFS only if it received the CTS frame
correctly.
As a part of an efficient MAC protocol, an efficient Backoff
algorithm is needed for a high throughput while ensuring
collision free transmission when many nodes try to access the
medium. Only one of the nodes is granted access to the
channel, while other contending nodes are suspended into a
Backoff state for some period (BO). Since Contention
Window size determines amount of collisions, it is important
to adopt a good Backoff algorithm to minimize collision. To
achieve this, Fibonacci Backoff (FIB) algorithm was used over
traditional Binary exponential Backoff Algorithm. Increasing
the size of CW in case of failure to transmit tends to rapidly
increase the size of CW to even larger sizes. Reaching such
large window sizes decreases the expected wait time for a
given node to gain access to the shared medium. Moreover, a
large window size tends to contribute to increasing channel
idle times, leading to a major waste in the shared channel
bandwidth. FIB algorithm aims to reduce the difference
between contention windows sizes generated, resulting in a
higher network throughput and decreasing the chances of
collision among the contending stations.
International Journal of Computer Science and Information Security (IJCSIS),
Vol. 16, No. 7, July 2018
206 https://sites.google.com/site/ijcsis/
ISSN 1947-5500](https://image.slidesharecdn.com/journalofcomputerscienceijcsisjuly2018fullvolume-180915043348/75/Journal-of-computer-science-ijcsis-july-2018-full-volume-220-2048.jpg)
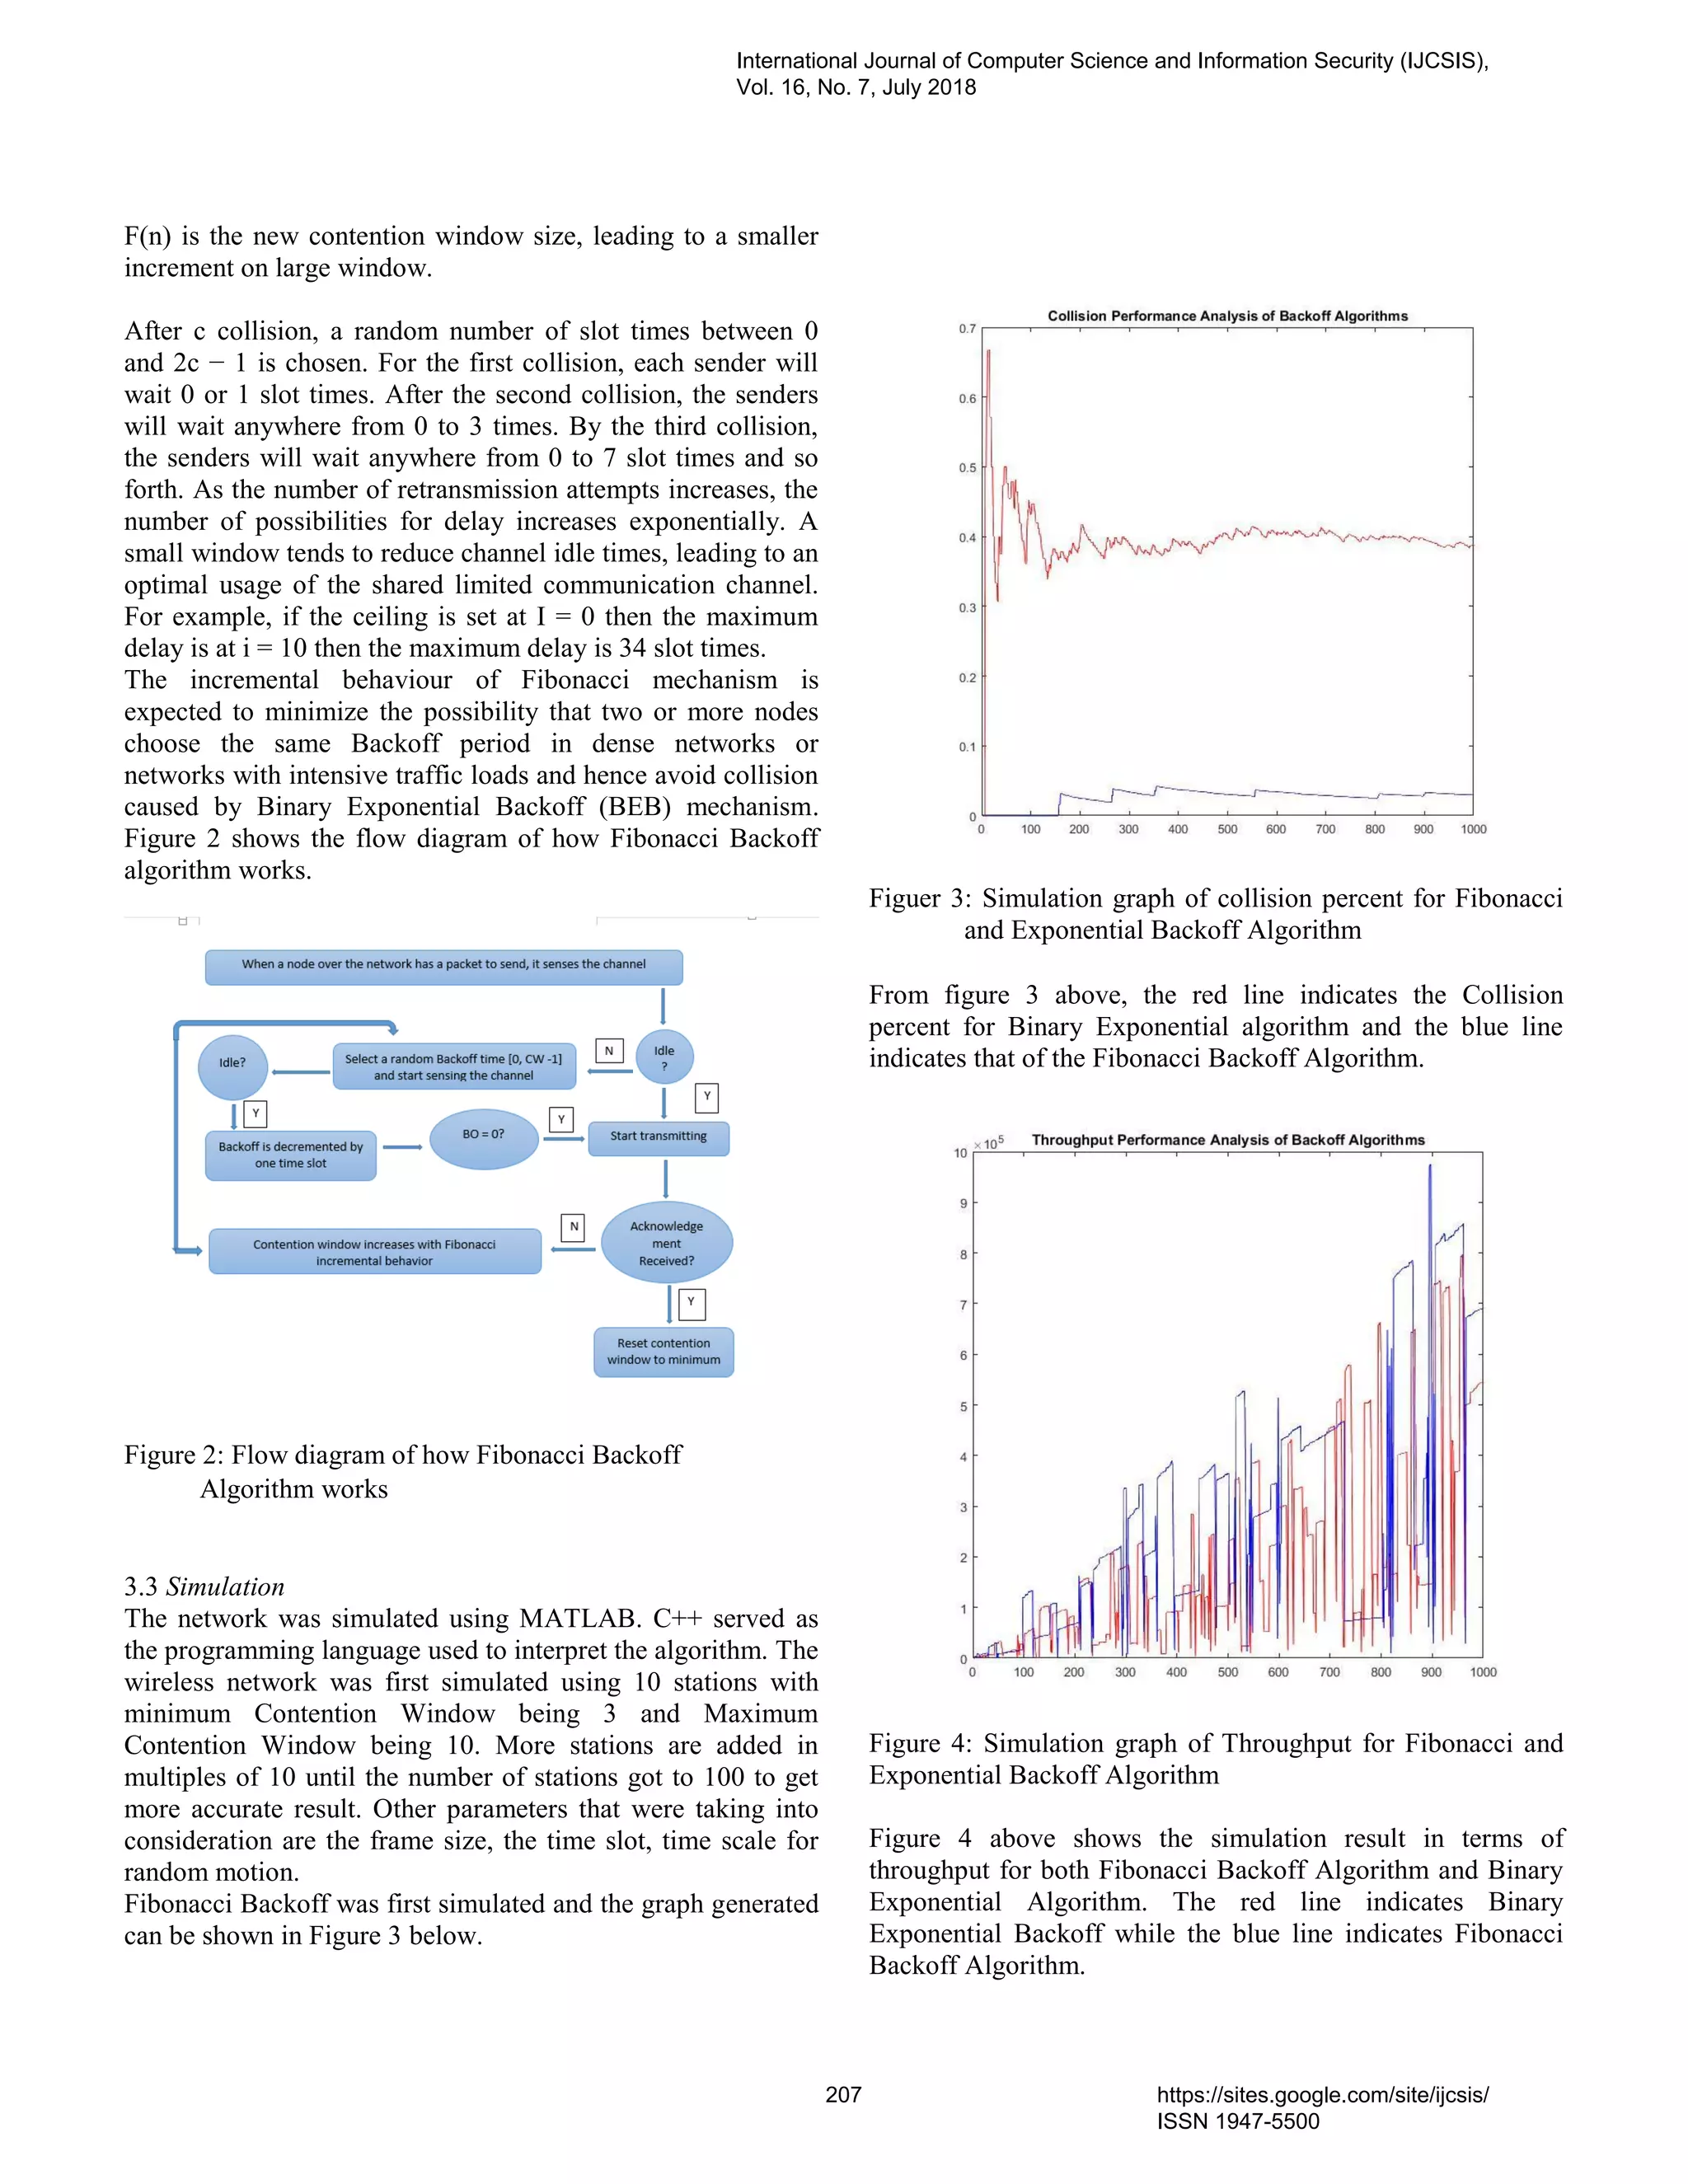

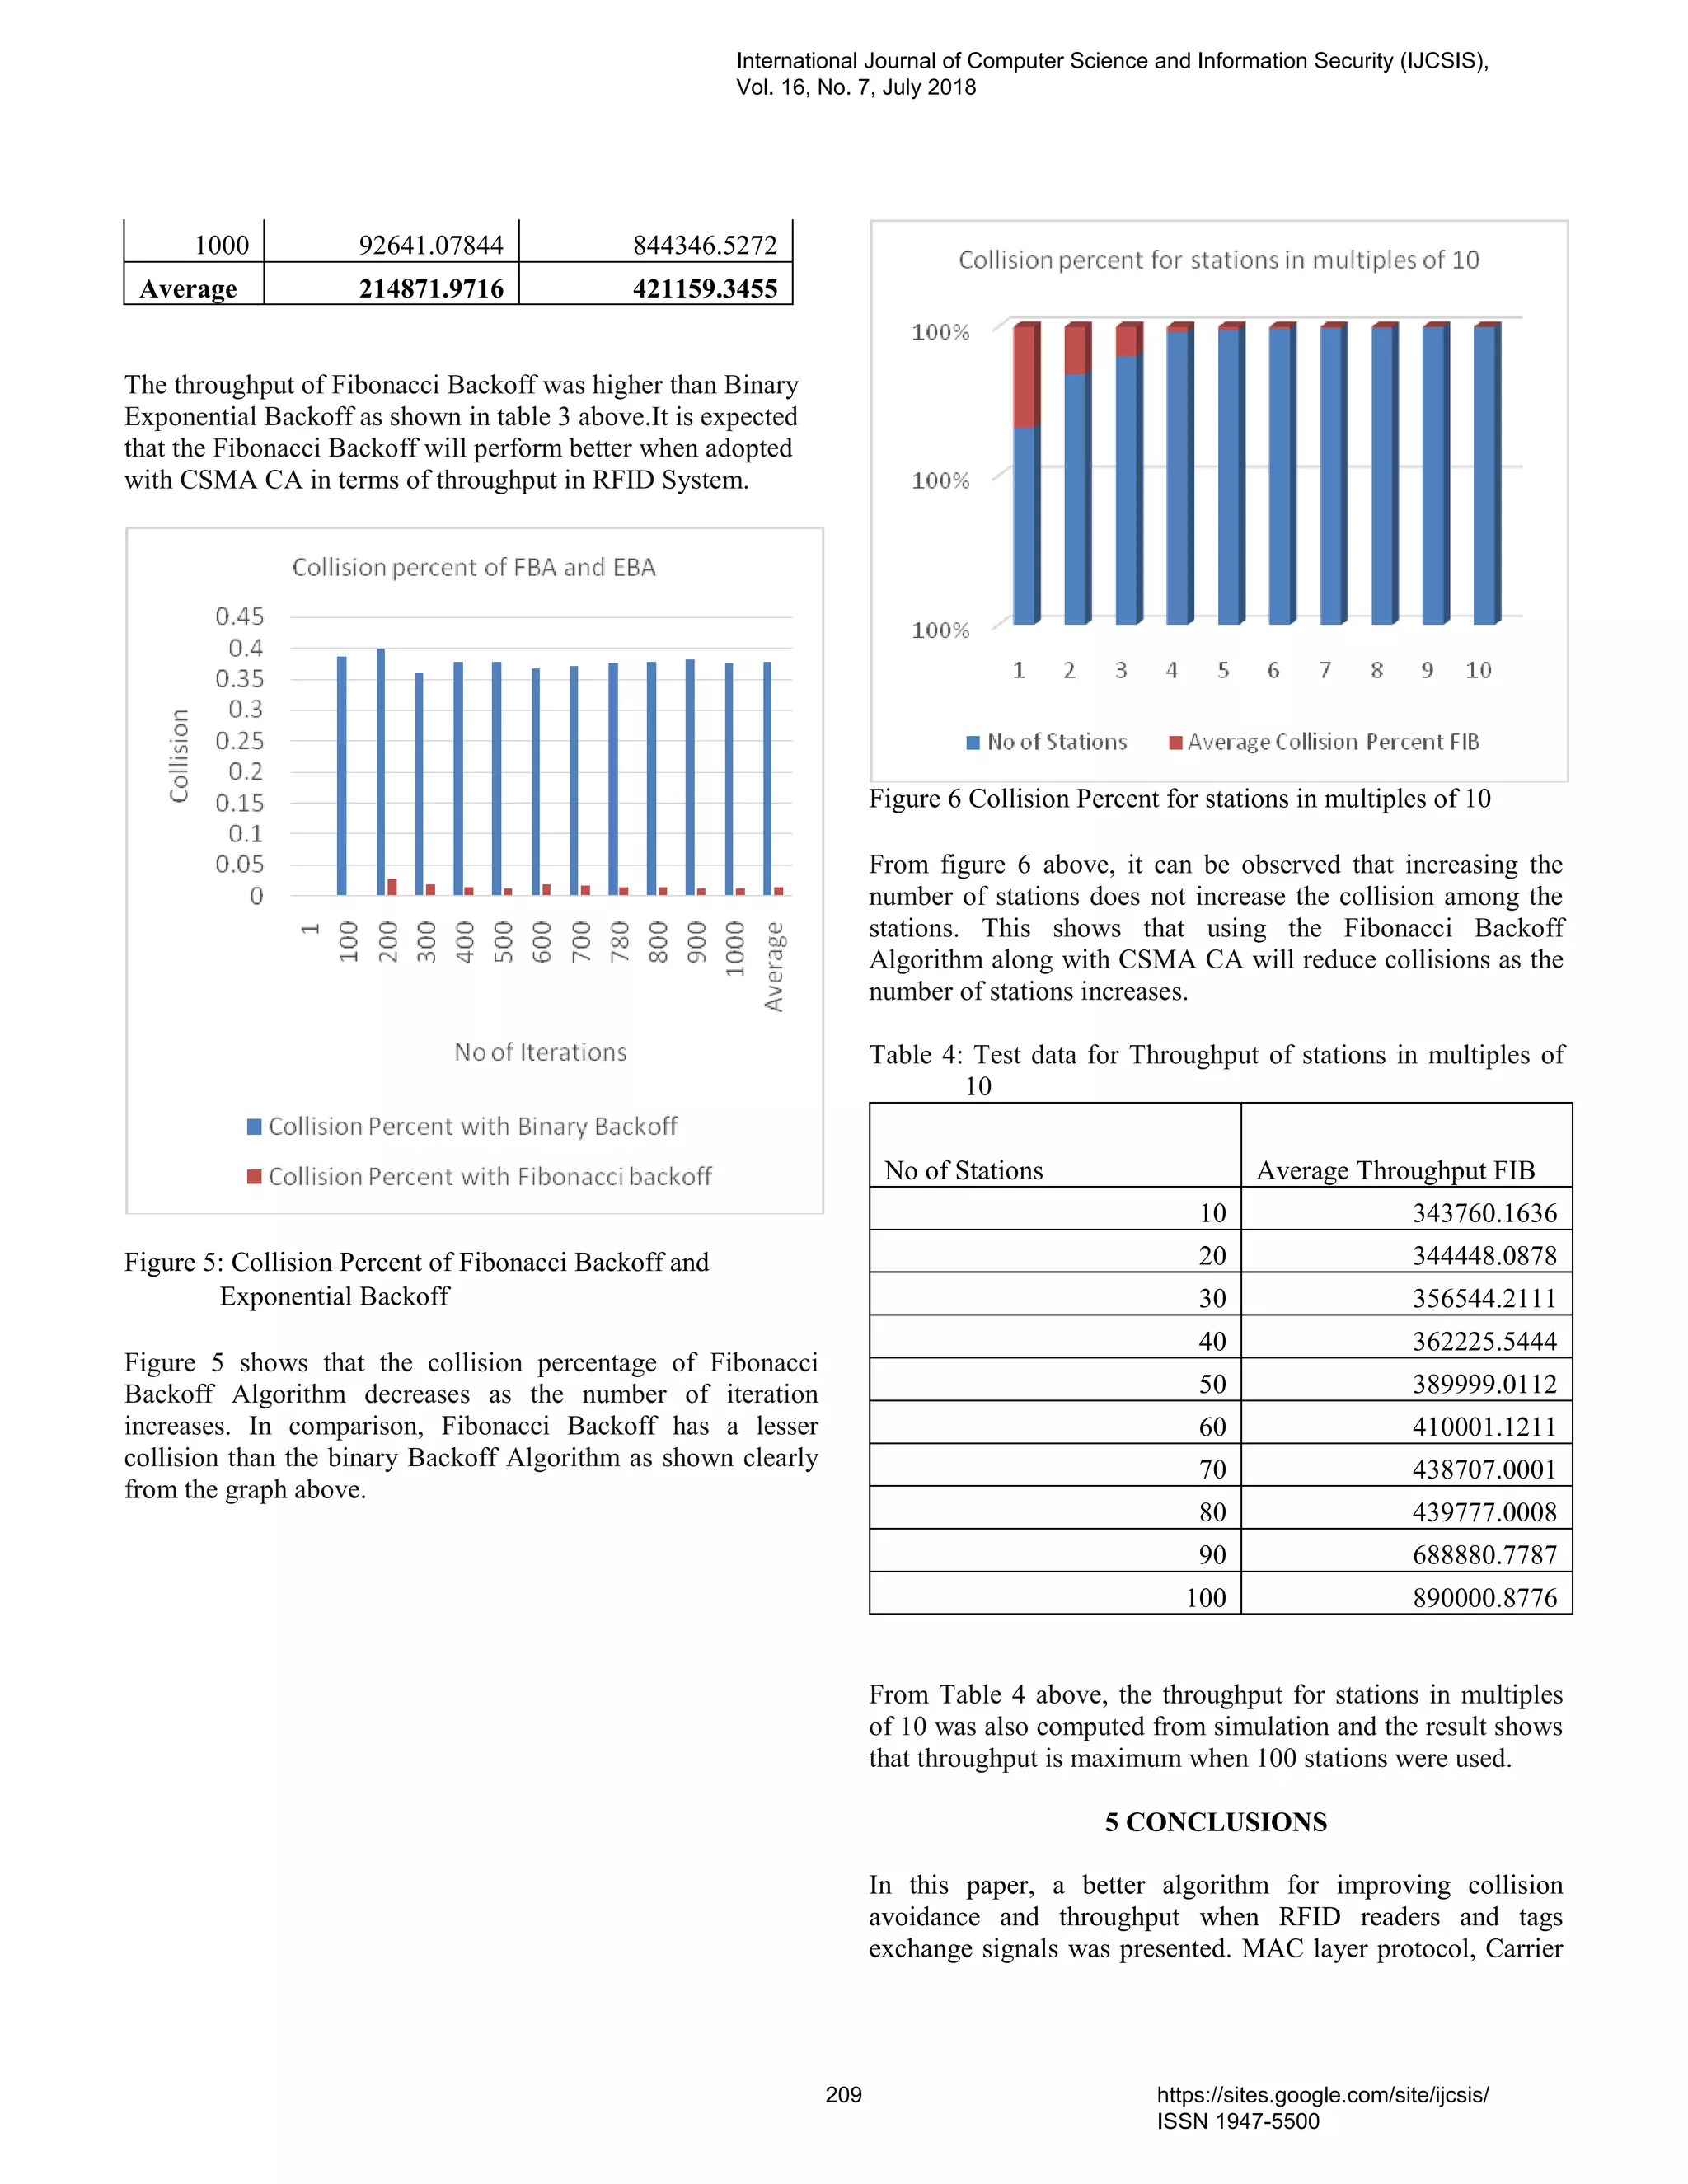
![Sense Multiple Access with Collision Avoidance (CSMA/CA)
was used alongside with a better Backoff algorithm which
helps to reschedule transmission of frames by RFID Readers
after the first collision. Due to its characteristics, Fibonacci
Backoff algorithm was chosen as the algorithm to help lower
the contention window size between two successive backoff
times. Fibonacci Backoff Algorithm was simulated alongside
Binary Exponential Algorithm for evaluation purposes in other
to make comparisons between the two protocols based on two
major metrics which are throughput and collision
minimization behaviour.
This research has presented a way to minimize collision
among RFID readers through proper and efficient channel
reservation to ensure a better throughput during transmission
of data. The two major factors which were considered during
the implementation were collision minimization and
throughput. The results show that a more efficient algorithm
such as the Fibonacci Backoff algorithm can be used together
with CSMA CA to reduce collisions of RFID Readers and
increase their throughput.
REFERENCES
[1] Williams, B.K., & Sawyer, S.C. 2003. Using
Information Technology: A Practical Introduction to
Computers & Communications. New York:
McGraw-Hill/Irwin.
[2] Pande, J. 2017. Introduction to Cyber Security.
Uttarakhand Open University. Retrieved on 2nd
May,
2018
fromhttp://elearning.uou.ac.in/pluginfile.php/1441/m
od_resource/content/2/Introduction%20to%20cyber
%20security.pdf
[3] Konidala, D. M. and Kim, K. 2007. Security for
RFID-based Applications in Smart Home
Environment. The 2007 Symposium on Cryptography
and Information Security (SCIS 2007).Sasebo, Japan,
Jan. 23-26, 2007. The Institute of Electronics,
Information and Communication Engineers.
[4] Swati K. (2014). Intel Developing RFID Tracking
and Remote Controlled ‘Kill Switch' for Laptops. The
Hacker News
https://thehackernews.com/2014/06/intel-developing-
rfid-tracking-and.html
[5] Kamdar, M.N., Vinita S., and Sudhanshu N. 2016. A
Survey paper on RFID Technology, its Applications
and Classification of Security/Privacy Attacks and
Solutions. International Journal of Computer Science
and Information Technology & Security (IJCSITS).
ISSN: 2249-9555 Vol.6, No4, July-August 2016.
Retrieved on 2nd
May, 2018 from
https://ijcsits.org/papers/vol6no42016/13vol6no4.pdf
[6] Finkenzeller K. 2010. RFID Handbook:
Fundamentals And Applications In Contactless Smart
Cards, Radio Frequency Identification And Near-
Field Communication, Third Edition John Wiley &
Sons, Ltd
[7] Waldrop, J., Engels, D. W. and Sarma.S. E. 2003.
Colorwave: An anti-collision algorithm for the reader
collision problem. In IEEE Wireless Communications
and Networking Conference (WCNC), 2003.
[8] HKSAR (The Government of the Hong Kong Special
Administrative Region.), 2008. RFID SECURITY
https://www.infosec.gov.hk/english/technical/files/rfi
d.pdf
[9] Sridhar I. 2005. RFID: Technology and Applications
https://www.it.iitb.ac.in/~sri/talks/rfid-05.pdf
[10]Roy, W. 2006. An Introduction to RFID Technology
https://www.cs.colorado.edu/~rhan/CSCI_7143_001_
Fall_2002/Papers/rfid_intro_01593568.pdf.
Published by the IEEE CS and IEEE ComSoc.
[11]Daniel W. E. 2002. The reader collision problem.
Technical report, epcglobal.org, 2002.
International Journal of Computer Science and Information Security (IJCSIS),
Vol. 16, No. 7, July 2018
210 https://sites.google.com/site/ijcsis/
ISSN 1947-5500](https://image.slidesharecdn.com/journalofcomputerscienceijcsisjuly2018fullvolume-180915043348/75/Journal-of-computer-science-ijcsis-july-2018-full-volume-224-2048.jpg)
![(IJCSIS) International Journal of Computer Science and Information Security,
Vol. 16 No. 7, July 2018
Prof. Syed S. Rizvi, University of Bridgeport, USA
Dr. Shahbaz Pervez Chattha, University of Engineering and Technology Taxila, Pakistan
Dr. Shishir Kumar, Jaypee University of Information Technology, Wakanaghat (HP), India
Dr. Shahid Mumtaz, Portugal Telecommunication, Instituto de Telecomunicações (IT) , Aveiro, Portugal
Dr. Rajesh K Shukla, Corporate Institute of Science & Technology Bhopal M P
Dr. Poonam Garg, Institute of Management Technology, India
Dr. S. Mehta, Inha University, Korea
Dr. Dilip Kumar S.M, Bangalore University, Bangalore
Prof. Malik Sikander Hayat Khiyal, Fatima Jinnah Women University, Rawalpindi, Pakistan
Dr. Virendra Gomase , Department of Bioinformatics, Padmashree Dr. D.Y. Patil University
Dr. Irraivan Elamvazuthi, University Technology PETRONAS, Malaysia
Dr. Saqib Saeed, University of Siegen, Germany
Dr. Pavan Kumar Gorakavi, IPMA-USA [YC]
Dr. Ahmed Nabih Zaki Rashed, Menoufia University, Egypt
Prof. Shishir K. Shandilya, Rukmani Devi Institute of Science & Technology, India
Dr. J. Komala Lakshmi, SNR Sons College, Computer Science, India
Dr. Muhammad Sohail, KUST, Pakistan
Dr. Manjaiah D.H, Mangalore University, India
Dr. S Santhosh Baboo, D.G.Vaishnav College, Chennai, India
Prof. Dr. Mokhtar Beldjehem, Sainte-Anne University, Halifax, NS, Canada
Dr. Deepak Laxmi Narasimha, University of Malaya, Malaysia
Prof. Dr. Arunkumar Thangavelu, Vellore Institute Of Technology, India
Dr. M. Azath, Anna University, India
Dr. Md. Rabiul Islam, Rajshahi University of Engineering & Technology (RUET), Bangladesh
Dr. Aos Alaa Zaidan Ansaef, Multimedia University, Malaysia
Dr Suresh Jain, Devi Ahilya University, Indore (MP) India,
Dr. Mohammed M. Kadhum, Universiti Utara Malaysia
Dr. Hanumanthappa. J. University of Mysore, India
Dr. Syed Ishtiaque Ahmed, Bangladesh University of Engineering and Technology (BUET)
Dr Akinola Solomon Olalekan, University of Ibadan, Ibadan, Nigeria
Dr. Santosh K. Pandey, The Institute of Chartered Accountants of India
Dr. P. Vasant, Power Control Optimization, Malaysia
Dr. Petr Ivankov, Automatika - S, Russian Federation
Dr. Utkarsh Seetha, Data Infosys Limited, India
Mrs. Priti Maheshwary, Maulana Azad National Institute of Technology, Bhopal
Dr. (Mrs) Padmavathi Ganapathi, Avinashilingam University for Women, Coimbatore
Assist. Prof. A. Neela madheswari, Anna university, India
Prof. Ganesan Ramachandra Rao, PSG College of Arts and Science, India
Mr. Kamanashis Biswas, Daffodil International University, Bangladesh
Dr. Atul Gonsai, Saurashtra University, Gujarat, India
Mr. Angkoon Phinyomark, Prince of Songkla University, Thailand
Mrs. G. Nalini Priya, Anna University, Chennai
Dr. P. Subashini, Avinashilingam University for Women, India
Assoc. Prof. Vijay Kumar Chakka, Dhirubhai Ambani IICT, Gandhinagar ,Gujarat
Mr Jitendra Agrawal, : Rajiv Gandhi Proudyogiki Vishwavidyalaya, Bhopal
Mr. Vishal Goyal, Department of Computer Science, Punjabi University, India
Dr. R. Baskaran, Department of Computer Science and Engineering, Anna University, Chennai](https://image.slidesharecdn.com/journalofcomputerscienceijcsisjuly2018fullvolume-180915043348/75/Journal-of-computer-science-ijcsis-july-2018-full-volume-226-2048.jpg)