1. 1
Current Sources of Variation and Key focus on Common Causes include:
1. Methods: Duration taken to update control rooms (at plant, hub and global level)
• Data entry (inputs)
• Final calculations (inputs/outputs)
• Number of staff required (process)
• Total number of hours each month (process)
2. People: Level of discrepancies (defects) within scorecard
• Changes in the format of numbers e.g. percentages (outputs)
• Variations in changes at different levels e.g. discrepancies at plant and hub (outputs)
• Special causes of variance e.g. manipulation of data, incorrect calculations (outputs)
• Europe rollout is near completion and covers plants:
Mallings/Steetley
Crown House Technologies Offsite
Vetter Germany
Bison
• Changes have been replicated in MESA under supervision of D.Ward. The plants
included are:
ANLOR Joinery
ANLOR Rebar
Emirates Precast
Modular
• Future scope for replication to Australasia plants include:
Austrak
Redispan
MESA Hub
scorecard/
dashboards
Global scorecard/
dashboards
EU Hub
scorecard/
dashboards
Global scorecard/
dashboards
1.Data Template 2. Open Scorecard & Update
4.Open Dashboards & Update 4. Scorecards
5. Dashboards
D M A I C
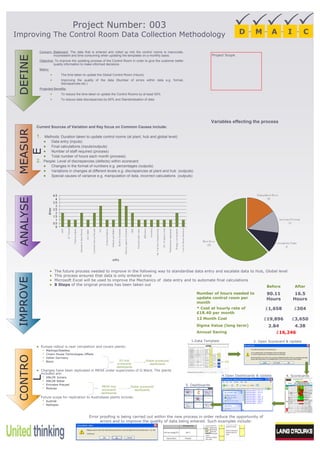
Before After
Number of hours needed to
update control room per
month
90.11
Hours
16.5
Hours
* Cost at hourly rate of
£18.40 per month
£1,658 £304
12 Month Cost £19,896 £3,650
Sigma Value (long term) 2.84 4.38
Annual Saving £16,246
Variables effecting the process
Project Scope
• The future process needed to improve in the following way to standardise data entry and escalate data to Hub, Global level
• This process ensures that data is only entered once
• Microsoft Excel will be used to improve the Mechanics of data entry and to automate final calculations
• 8 Steps of the original process has been taken out
Error proofing is being carried out within the new process in order reduce the opportunity of
errors and to improve the quality of data being entered. Such examples include:
Project Number: 003
Improving The Control Room Data Collection Methodology
Concern Statement: The data that is entered and rolled up into the control rooms is inaccurate,
inconsistent and time consuming when updating the templates on a monthly basis.
Objective: To improve the updating process of the Control Room in order to give the customer better
quality information to make informed decisions
Metric:
• The time taken to update the Global Control Room (Hours)
• Improving the quality of the data (Number of errors within data e.g. format,
discrepancies etc.)
Projected Benefits:
• To reduce the time taken to update the Control Rooms by at least 50%
• To reduce data discrepancies by 80% and Standardisation of data
DEFINEMEASUR
E
ANALYSEIMPROVECONTRO
L
Editor's Notes
Include the Project Champion, the Process Owner and all active team members.
If a fellow Black Belt is assisting with the project AS A BLACK BELT, then they should be identified as such, however, if a fellow BB is assisting as a team member, then identify them as a team member here.
Note: There is a maximum of two BBs on any project – and the financial credit is split for all BBs on the project.