1. TFB Transcriptional Regulation in Halobacterium salinarum
Genes Directly Regulated by TFBg
How does a certain transcription factor affect gene expression in the Halobacterium salinarum organism?
Alex LaDue | Mechanical Engineering ’17 Gi Jung Lee | Mechanical Engineering ’16 Henry Taylor | Biology & Computer Science ’18
Abstract
Transcription factor IIBs, TFBs, are a class of Archaeal general
transcription factors responsible for much of the organism’s
transcriptional regulation and are involved in a wide range of life
processes. Through ChIP-chip data and gene expression data, these
transcription factors were found to interact with a large range of
genes (1220). Furthermore, large transcriptional regulation network
between the transcription factors themselves was found. TFBg was
then chosen to be overexpressed to observe its impact on the
transcription factor regulatory network within the scope of TFBs and
the organism’s molecular processes. TFBg was chosen due to its size
of directly related genes and its importance to the organism.
Methods
TFB Clustering Analysis
TFBg Analysis
Darnell, Cynthia L., and Amy K. Schmid. "Systems biology approaches to defining
transcription regulatory networks in halophilic archaea." Methods 86 (2015):
102-114.
Facciotti, Marc T., et al. "General transcription factor specified global gene
regulation in archaea." Proceedings of the National Academy of Sciences
104.11 (2007): 4630-4635.
Conclusions
From our analysis, the following conclusions can be drawn:
• TFBs directly regulate a total of 1220 genes
• Within TFBs, there is a large TF-TF network with only TFBe
being an outlier
• TFBg regulates and thus binds to the promoter of the TFBb-
encoding gene (represses) as well as its own gene (activates)
• TFBg less strongly, or indirectly, regulates a large number of
genes throughout the genome, however due to size limitations
and project scope (within TFBs), they are not listed
References
Acknowledgements: Thanks to Dr. Magwene, Dr. Schmid and Edgar Medina
The TF-TF network was
created by determining if
any of the directly regulated
genes code for another TFB
transcription factor. It is
interesting to note that TFBe
doesn’t regulate any TFB
genes nor does it regulated
by other TFBs. TFBg is
regulated by most of the
other TFBs, which suggests
that it plays an important
role in the organism.
Through analysis of ChIP-chip data, a graph of the TFB
transcription factors and their regulated genes was produced,
demonstrating the extent of genome regulation of TFBs. A standard
p-value cutoff of 0.05 was used to determine which genes were
directly regulated by the various TFB transcription factors.
Gene clustering using gene expression data from the TFBs shown
above using the complete linkage hierarchical clustering method
with K=8. Through hierarchical clustering of all TFBs, high variance
in gene expression between different clusters is shown, suggesting
the variability of gene expressions for genes regulated by TFBs
(Figure 1). This contrasts with the clustering of TFBg in Figure 4.
TFB Hierarchical Clustering
TFB TFs and their Regulated Genes
TFBg Overexpression Hierarchical Clustering
TF-TF Networks
TFBg Heatmaps
All Genes Directly Regulated Genes
OE_tfbG_0.180
OE_tfbG_1.080
1 Standard
Deviation
Removed
2 Standard
Deviations
Removed
1 Standard
Deviation
Removed
2 Standard
Deviations
Removed
OE_tfbG_0.180
OE_tfbG_0.408
OE_tfbG_1.080
Hierarchical complete linkage gene clustering for all genes
using gene expression data for transcription factor, TFBg.
Compared to the clustering for all TFBs (Figure 3), the TFBg
cluster is incredibly precise and specified.
Heatmaps using gene expression data (normalized to wild-type
expression levels) from TFBg were generated: one using all genes,
one using genes TFBg directly regulated (ChIP-chip data). Genes
were organized by hierarchical clustering. Significantly expressed
genes were then measured through standard deviations from
average gene expression and displayed with non-significantly
expressed genes as white bars. Three conditions for the cell affected
by TFBg overexpression are shown: lag state, exponential stage,
and early stationary phase (going from left to right). As seen on
both sets, depending on growth stage, TFBg regulated an isolated
set of genes. By comparing the directly regulated and all gene heat
maps, TFBg regulates many genes indirectly, through TF-TF
networks. In direct regulation, there are certain clusters strongly
regulated.
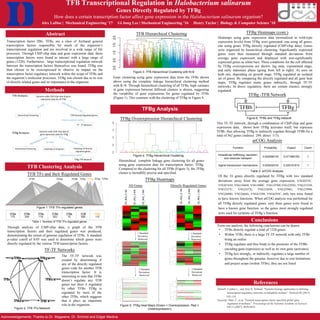
This TF-TF network, through a combination of ChIP-chip and gene
expression data, shows how TFBg activates itself, but represses
TFBb, thus allowing TFBg to indirectly regulate through TFBb for a
total of 362 genes (indirect: 249, direct: 113).
Function Probability Expect Count
Intracellular trafficking; secretion;
and vesicular transport
0.002098134 0.071084783 1
Signal transduction mechanisms 0.020430316 0.225101814 1
Table 2: arCOG Analysis
Of the 16 genes directly regulated by TFBg with two standard
deviations away from the average gene expression, VNG0255C,
VNG0743H, VNG1046H, VNG1088C, VNG1978H,VNG2293G, VNG2335H,
VNG2337C, VNG2437G, VNG2585H, VNG2598G, VNG2599H,
VNG2600G, VNG2666G, VNG6159H, VNG6293C, only two were found
to have known functions. When arCOG analysis was performed for
all TFBg directly regulated genes, only three genes were found to
have a known gene function, so the genes most strongly regulated
were used for certainty of TFBg’s function.
Figure 6: TFBb and TFBg network
Figure 1: TFB TFs regulated genes
Figure 2: TFB TFs Network
OE_tfbG_0.408
Figure 3: TFB Hierarchical Clustering with K=8
Figure 4: TFBg Hierarchical Clustering
Figure 5: TFBg Heat Maps (Green = Overexpression, Red =
Underexpression)
TFBg -TFB Network
arCOG Analysis
TFBf TFBd TFBb TFBc TFBg TFBa TFBe
TFBg Heatmaps (cont.)
TFBa
175
TFBb
249
TFBc
116
TFBd
923
TFBe
10
TFBf
658
TFBg
113
Table 1: Number of TFB TFs regulated genes