This document provides an agenda and summaries for a Splunk user group meeting in Edinburgh. The meeting will include presentations and discussions on creating dashboards, using universal vs. heavy forwarders, and latest Splunk challenges and solutions. It introduces the speakers, including employees from the hosting company ECS and user group leader Harry McLaren. Updates from the recent Splunk .conf event are also summarized, such as new premium app releases and the Splunk ML Toolkit.

![Splunk [Official] User Group
“The overall goal is to create an authentic, ongoing
user group experience for our users, where
they contribute and get involved”
● User Lead Technical Discussions
● Sharing Environment
● Build Trust
● No Sales!
6](https://image.slidesharecdn.com/splunkusergroup-february2017v1-170226182837/85/Splunk-Dashboarding-Universal-Vs-Heavy-Forwarders-6-320.jpg)
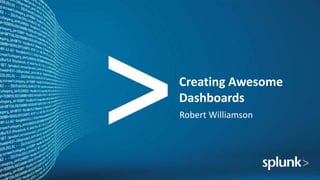


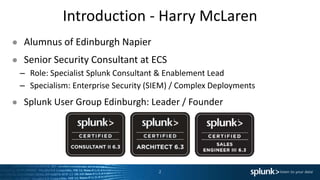
![Heavy Forwarders Are[n’t] Awesome!
The use of Heavy Forwarders were once commonly advised, but times change…
● Previous advice for using Heavy Forwarders
– Filtering of data is best done at source and HF are required as UF cannot parse.
– Use for aggregation layer for central management of data flows.
‣ Can cause data imbalance on the indexing tier that will reduce search performance.
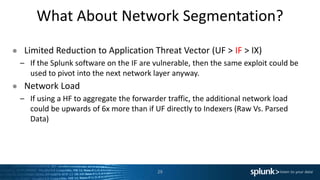
● Reasons for NOT using Heavy Forwarder
– Filter data at the Indexers. Greater use of compute resources / more performant.
– Reduces network usage / IO by a significant degree.
– Reduces the time from event generation to search availability.
– Segmentation doesn’t always reduce threat vector for application exploitation.
24](https://image.slidesharecdn.com/splunkusergroup-february2017v1-170226182837/85/Splunk-Dashboarding-Universal-Vs-Heavy-Forwarders-24-320.jpg)
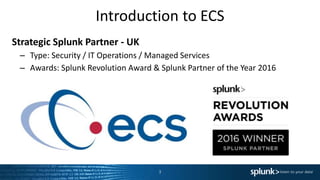
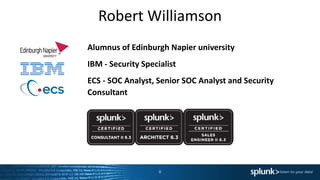
![Updates Announced at .conf 2016
● Introducing Splunk Enterprise 6.5 - Available Now
‣ Splunk ML Toolkit: Guided workbench and SPL extensions to help you create and
operationalize your own custom analytics based on your choice of algorithms.
‣ Tables: New feature that lets you create and analyse tabular data views without
using SPL.
‣ Hadoop Data Roll: Gives you another way to reduce historical data storage costs
while keeping full search capability.
● Premium Apps - New Releases:
– Splunk Enterprise Security [Minor Release]
– Splunk IT Service Intelligence [Major Release]
– Splunk User Behaviour Analytics [Major Release]
33](https://image.slidesharecdn.com/splunkusergroup-february2017v1-170226182837/85/Splunk-Dashboarding-Universal-Vs-Heavy-Forwarders-33-320.jpg)


![Getting Started with Apache Spark: Big Data Made Simple [Free Meetup]](https://cdn.slidesharecdn.com/ss_thumbnails/apachesparkgettingstarted-260203175547-8361bcc3-thumbnail.jpg?width=640&height=640&fit=bounds)


