Powerful Love Spells in Phoenix, AZ (310) 882-6330 Bring Back Lost Lover
Financial results-March31-2014
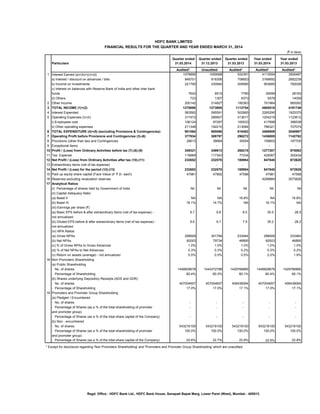
1. (` in lacs)
Quarter ended
31.03.2014
Quarter ended
31.12.2013
Quarter ended
31.03.2013
Year ended
31.03.2014
Year ended
31.03.2013
Audited* Unaudited Audited* Audited* Audited*
1 Interest Earned (a)+(b)+(c)+(d) 1078856 1059068 932391 4113554 3506487
a) Interest / discount on advances / bills 848701 818306 708653 3168692 2682239
b) Income on Investments 221790 230940 209585 903685 782026
c) Interest on balances with Reserve Bank of India and other inter bank
funds 7642 8515 7780 35599 28163
d) Others 723 1307 6373 5578 14059
2 Other Income 200142 214827 180363 791964 685262
3 TOTAL INCOME (1)+(2) 1278998 1273895 1112754 4905518 4191749
4 Interest Expended 583592 595591 502865 2265290 1925375
5 Operating Expenses (i)+(ii) 317472 289507 313617 1204219 1123612
i) Employees cost 106124 97297 100533 417898 396538
ii) Other operating expenses 211348 192210 213084 786321 727074
6 TOTAL EXPENDITURE (4)+(5) (excluding Provisions & Contingencies) 901064 885098 816482 3469509 3048987
7 Operating Profit before Provisions and Contingencies (3)-(6) 377934 388797 296272 1436009 1142762
8 Provisions (other than tax) and Contingencies 28613 38884 30054 158802 167700
9 Exceptional Items - - - - -
10 Profit / (Loss) from Ordinary Activities before tax (7)-(8)-(9) 349321 349913 266218 1277207 975062
11 Tax Expense 116669 117343 77234 429367 302434
12 Net Profit / (Loss) from Ordinary Activities after tax (10)-(11) 232652 232570 188984 847840 672628
13 Extraordinary items (net of tax expense) - - - - -
14 Net Profit / (Loss) for the period (12)-(13) 232652 232570 188984 847840 672628
15 Paid up equity share capital (Face Value of ` 2/- each) 47981 47892 47588 47981 47588
16 Reserves excluding revaluation reserves 4299884 3573826
17 Analytical Ratios
(i) Percentage of shares held by Government of India Nil Nil Nil Nil Nil
(ii) Capital Adequacy Ratio
(a) Basel II NA NA 16.8% NA 16.8%
(b) Basel III 16.1% 14.7% NA 16.1% NA
(iii) Earnings per share (`)
(a) Basic EPS before & after extraordinary items (net of tax expense) - 9.7 9.8 8.0 35.5 28.5
not annualized
(b) Diluted EPS before & after extraordinary items (net of tax expense) - 9.6 9.7 7.9 35.2 28.2
not annualized
(iv) NPA Ratios
(a) Gross NPAs 298928 301784 233464 298928 233464
(b) Net NPAs 82003 79734 46895 82003 46895
(c) % of Gross NPAs to Gross Advances 1.0% 1.0% 1.0% 1.0% 1.0%
(d) % of Net NPAs to Net Advances 0.3% 0.3% 0.2% 0.3% 0.2%
(v) Return on assets (average) - not annualized 0.5% 0.5% 0.5% 2.0% 1.9%
18 Non Promoters Shareholding
(a) Public Shareholding
- No. of shares 1448829678 1444372788 1429766866 1448829678 1429766866
- Percentage of Shareholding 60.4% 60.3% 60.1% 60.4% 60.1%
(b) Shares underlying Depository Receipts (ADS and GDR)
- No. of shares 407004657 407004657 406436064 407004657 406436064
- Percentage of Shareholding 17.0% 17.0% 17.1% 17.0% 17.1%
19 Promoters and Promoter Group Shareholding
(a) Pledged / Encumbered
- No. of shares - - - - -
- Percentage of Shares (as a % of the total shareholding of promoter - - - - -
and promoter group)
- Percentage of Shares (as a % of the total share capital of the Company) - - - - -
(b) Non - encumbered
- No. of shares 543216100 543216100 543216100 543216100 543216100
- Percentage of Shares (as a % of the total shareholding of promoter 100.0% 100.0% 100.0% 100.0% 100.0%
and promoter group)
- Percentage of Shares (as a % of the total share capital of the Company) 22.6% 22.7% 22.8% 22.6% 22.8%
* Except for disclosure regarding 'Non Promoters Shareholding' and 'Promoters and Promoter Group Shareholding' which are unaudited.
HDFC BANK LIMITED
FINANCIAL RESULTS FOR THE QUARTER AND YEAR ENDED MARCH 31, 2014
Particulars
Regd. Office : HDFC Bank Ltd., HDFC Bank House, Senapati Bapat Marg, Lower Parel (West), Mumbai - 400013.
2. (` in lacs)
Quarter ended
31.03.2014
Quarter ended
31.12.2013
Quarter ended
31.03.2013
Year ended
31.03.2014
Year ended
31.03.2013
Audited Unaudited Audited Audited Audited
1 Segment Revenue
a) Treasury 266743 301530 265639 1178670 971102
b) Retail Banking 1088123 1065006 920165 4080486 3491965
c) Wholesale Banking 508128 517842 435538 1964534 1763382
d) Other Banking Operations 145248 132924 116979 503355 390256
e) Unallocated - - 5889 258 11277
Total 2008242 2017302 1744210 7727303 6627982
Less: Inter Segment Revenue 729244 743407 631456 2821785 2436233
Income from Operations 1278998 1273895 1112754 4905518 4191749
2 Segment Results
a) Treasury 12565 8006 2100 41230 22500
b) Retail Banking 157893 151297 117679 568541 442415
c) Wholesale Banking 150037 154934 129078 594011 475196
d) Other Banking Operations 47620 61150 50655 192046 156412
e) Unallocated (18794) (25474) (33294) (118621) (121461)
Total Profit Before Tax 349321 349913 266218 1277207 975062
3 Capital Employed
(Segment Assets - Segment Liabilities)
a) Treasury 12241141 10436562 11480639 12241141 11480639
b) Retail Banking (12909019) (11518070) (9696648) (12909019) (9696648)
c) Wholesale Banking 5305539 5711662 2429843 5305539 2429843
d) Other Banking Operations 1259579 1113961 1031495 1259579 1031495
e) Unallocated (1549375) (1454981) (1623915) (1549375) (1623915)
Total 4347865 4289134 3621414 4347865 3621414
Segment information in accordance with the Accounting Standard on Segment Reporting (AS 17) of the operating segments of the Bank is as under:
Particulars
Business Segments have been identified and reported taking into account the target customer profile, the nature of products and services, the differing risks and returns, the
organisation structure, the internal business reporting system and the guidelines prescribed by RBI.
Regd. Office : HDFC Bank Ltd., HDFC Bank House, Senapati Bapat Marg, Lower Parel (West), Mumbai - 400013.
3. 1
(` in lacs)
Particulars
As at
31.03.2014
As at
31.03.2013
CAPITAL AND LIABILITIES Audited Audited
Capital 47981 47588
Reserves and Surplus 4299884 3573826
Deposits 36733748 29624698
Borrowings 3943900 3300660
Other Liabilities and Provisions 4134439 3486418
Total 49159952 40033190
ASSETS
Cash and Balances with Reserve Bank of India 2534563 1462740
Balances with Banks and Money at Call and Short notice 1423801 1265277
Investments 12095107 11161360
Advances 30300028 23972064
Fixed Assets 293992 270308
Other Assets 2512461 1901441
Total 49159952 40033190
2
3
4
5
6
7
8
9
10
11 ` 10 lac = ` 1 million
` 10 million = ` 1 crore
Aditya Puri
Managing Director
As at March 31, 2014, the total number of branches (including extension counters) and ATM network stood at 3403 branches and 11256 ATMs respectively.
Notes :
Statement of Assets and Liabilities as on March 31, 2014 is given below.
The above results have been approved by the Board of Directors at its meeting held on April 22, 2014. There are no qualifications in the auditor's report for the year ended
March 31, 2014. The information presented above is extracted from the audited financial statements as stated.
The figures of last quarter are the balancing figures between audited figures in respect of the full financial year and the published year to date figures upto the end of third
quarter of the respective financial year.
The Board of Directors at their meeting proposed a dividend of ` 6.85 per share, subject to the approval of the members at the ensuing Annual General Meeting.
In accordance with the RBI circular DBOD.No.BP.BC.88/21.06.201/2012-13 dated March 28, 2013, banks are required to disclose capital adequacy ratio computed under
Basel III capital regulations from the quarter ended June 30, 2013. Accordingly, details for previous periods are not applicable.
During the quarter and year ended March 31, 2014, the Bank allotted 4456890 and 19631405 shares pursuant to the exercise of stock options by certain employees.
Other income relates to income from non-fund based banking activities including commission, fees, earnings from foreign exchange and derivative transactions, profit and
loss (including revaluation) from investments and recoveries from accounts written off.
Date : April 22, 2014
Regd. Office : HDFC Bank Ltd., HDFC Bank House, Senapati Bapat Marg, Lower Parel (West), Mumbai - 400013.
Information on investor complaints pursuant to Clause 41 of the listing agreement for the quarter ended March 31, 2014:
Opening : Nil; Additions : 694; Disposals : 694; Closing position : Nil.
Figures of the previous periods have been regrouped / reclassified wherever necessary to conform to current period's classification.
Place : Mumbai
4. (` in lacs)
Year ended
31-03-2014
Year ended
31-03-2013
Audited Audited
1 Interest Earned (a)+(b)+(c)+(d) 4255502 3586102
a) Interest/discount on advances / bills 3307752 2759121
b) Income on Investments 903920 782428
c) Interest on balances with Reserve Bank of India and other inter bank funds 37860 30191
d) Others 5970 14362
2 Other Income 829750 713297
3 TOTAL INCOME (1)+(2) 5085252 4299399
4 Interest Expended 2344545 1969545
5 Operating Expenses (i)+(ii) 1246965 1155190
i) Employees cost 449447 420179
ii) Other operating expenses 797518 735011
6 TOTAL EXPENDITURE (4)+(5) (excluding Provisions & Contingencies) 3591510 3124735
7 Operating Profit before Provisions and Contingencies (3)-(6) 1493742 1174664
8 Provisions (Other than tax) and Contingencies 172675 174263
9 Exceptional Items - -
10 Profit / (Loss) from ordinary activities before tax (7-8-9) 1321067 1000401
11 Tax Expense 444616 310373
12 Net Profit / (Loss) from Ordinary Activities after tax (10-11) 876451 690028
13 Extraordinary items (net of tax expense) - -
14 Net Profit / (Loss) for the year (12-13) 876451 690028
15 Minority Interest 2465 3352
16 Share in profits of associates 363 288
17 Consolidated profit for the year attributable to the Group 874349 686964
18 Paid up equity share capital (Face Value of `2/- each) 47981 47588
19 Reserves excluding revaluation reserves 4368682 3616684
20 Analytical Ratios
(i) Percentage of shares held by Government of India Nil Nil
(ii) Earnings per share (`)
(a) Basic EPS before & after extraordinary items (net of tax expense) - not annualized 36.6 29.1
(b) Diluted EPS before & after extraordinary items (net of tax expense) - not annualized 36.3 28.8
Regd. Office : HDFC Bank Ltd., HDFC Bank House, Senapati Bapat Marg, Lower Parel (West), Mumbai - 400013.
HDFC BANK LIMITED GROUP
CONSOLIDATED FINANCIAL RESULTS FOR THE YEAR ENDED MARCH 31, 2014
Particulars
5. (` in lacs)
Year ended
31-03-2014
Year ended
31-03-2013
Audited Audited
1 Segment Revenue
a) Treasury 1178670 971102
b) Retail Banking 4080486 3491965
c) Wholesale Banking 1964534 1763382
d) Other banking operations 683088 497906
e) Unallocated 259 11277
Total 7907037 6735632
Less: Inter Segment Revenue 2821785 2436233
Income from Operations 5085252 4299399
2 Segment Results
a) Treasury 41230 22500
b) Retail Banking 568541 442415
c) Wholesale Banking 594011 475196
d) Other banking operations 235905 181751
e) Unallocated (118620) (121461)
Total Profit Before Tax, Minority Interest & Earnings from Associates 1321067 1000401
3 Capital Employed
(Segment Assets - Segment Liabilities)
a) Treasury 12241141 11480639
b) Retail Banking (12909019) (9696648)
c) Wholesale Banking 5305539 2429843
d) Other banking operations 1340452 1093222
e) Unallocated (1546276) (1620650)
Total 4431837 3686406
Regd. Office : HDFC Bank Ltd., HDFC Bank House, Senapati Bapat Marg, Lower Parel (West), Mumbai - 400013.
Particulars
Business Segments have been identified and reported taking into account the target customer profile, the nature of products and services, the differing risks
and returns, the organisation structure, the internal business reporting system and the guidelines prescribed by RBI.
Consolidated Segment information in accordance with the Accounting Standard on Segment Reporting (AS 17) of the operating segments of the Group is as
under:
6. 1
(` in lacs)
Particulars
As at
31.03.2014
As at
31.03.2013
CAPITAL AND LIABILITIES Audited Audited
Capital 47981 47588
Reserves and Surplus 4368682 3616684
Minority Interest 15174 22134
Deposits 36708033 29609177
Borrowings 4959672 3949661
Other Liabilities and Provisions 4262454 3527054
Total 50361996 40772298
ASSETS
Cash and balances with Reserve Bank of India 2535722 1463088
Balances with Banks and Money at Call and Short notice 1455621 1290028
Investments 11957106 11096041
Advances 31541886 24724512
Fixed Assets 302628 277332
Other Assets 2569033 1921297
Total 50361996 40772298
2
3
4
5
6
Aditya Puri
Managing Director
Regd. Office : HDFC Bank Ltd., HDFC Bank House, Senapati Bapat Marg, Lower Parel (West), Mumbai - 400013.
Place : Mumbai
Date : April 22, 2014
The above results are prepared in accordance with the principles set out in Accounting Standard 21- Consolidated Financial Statements and Accounting
Standard 23 - Accounting for Investments in Associates in Consolidated Financial Statements as prescribed by the Institute of Chartered Accountants of
India.
In accordance with RBI circular DBOD.No.BP.BC.2/21.06.201/2013-14 dated July 1, 2013, banks are required to make Pillar 3 disclosures under Basel
III capital regulations for the Group. These disclosures are available at http://www.hdfcbank.com/aboutus/basel_disclosures/default.htm. The disclosures
have not been subjected to audit or limited review.
Figures of the previous year have been regrouped/reclassified wherever necessary to conform to current year's classification.
` 10 lac = ` 1 million
` 10 million = ` 1 crore
Notes :
Consolidated Statement of Assets and Liabilities as on March 31, 2014 is given below.
The above results represent the consolidated financial results for HDFC Bank Limited, its subsidiaries and associates. These results have been
approved by the Board of Directors at its meeting held on April 22, 2014. There are no qualifications in the auditor’s report for the year ended March 31,
2014. The information presented above is extracted from the audited consolidated financial statements as stated.