
Recommended
Recommended
More Related Content
Similar to Gamma_Ray_Spectroscopy_Using_a_NaI_TI_De.pdf
Similar to Gamma_Ray_Spectroscopy_Using_a_NaI_TI_De.pdf (20)
Recently uploaded
Recently uploaded (20)
Gamma_Ray_Spectroscopy_Using_a_NaI_TI_De.pdf
- 1. P a g e 1 | 11 Gamma-Ray Spectroscopy Using a NaI (TI) Detector and Multi-Channel Analyzer Lab Report Prepared by Nnaemeka Ani NUC E 450, Radiation Detection and Measurement Section 003 Team Members: Francois Ross Luke Merski Kirk Brown Date performed: 03/15/2016 Report due: 03/29/2016 Report turned in: 03/29/2016
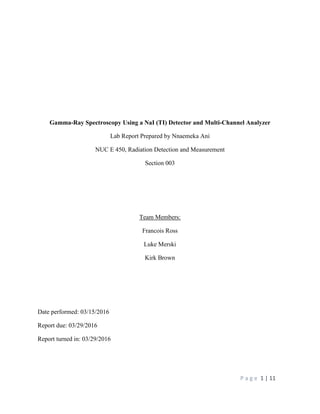
- 2. Nnaemeka Ani March 28th, 2016 Gamma Ray Spectroscopy using NAI (TI) detector and MCA P a g e 2 | 11 Abstract The lab uses a Multi-channel analyzer and computer software Genie 2000 to identify an unknown element. We are to calibrate the software using cobalt-60, cesium-137 and barium-133. Gamma-ray spectroscopy using this setup was very effective. Introduction In Experiment 5, we utilized a Single Channel Analyzer to develop a gamma ray spectrum for Cs137 and Co60. Taking each count at different voltage windows is a long and tedious task, and is impractical for recording the spectrum using many points. In this experiment, we utilize a Multi-Channel Analyzer (MCA) which allows us to take counts for several hundred channels at once, creating a more reliable, more accurate spectrum plot. The software we used for this experiment was Genie 2000, a spectroscopy software that allows for measurement of photo peaks, and calculates data for specific user-specified regions. The MCA in conjunction with Genie allows us to accurately identify unknown radio nuclides through measuring reference samples and matching the photo peaks of the unknown nuclide with known sources. Theory The Multi-Channel Analyzer is a computer based spectroscopy tool that can be used to identify photo peaks for a nuclide, and thus be able to identify what an element is. Whereas the Single- Channel Analyzer can only measure the counts for a single window at a time, the Multi-Channel Analyzer has the ability to measure several hundred channels at once while retaining a very low dead time. Equipment The system illustrated in Figure 1 was used to conduct this experiment. It consists of a Nal (Tl) detector connected to both the Amplifier and the High Voltage Power Supply. The Multi- Channel Analyzer (MCA) and the Oscilloscope were both connected to the Amplifier, and the MCA connected straight to the computer. Model and serial numbers for each piece of equipment are labeled in Table 1. Oscilloscope Personal Computer Multiport II ADC/MCA Amplifier Shelf Box NaI (Tl) Detector with Preamp High Voltage Power Supply O O O I I I Preamp Power
- 3. Nnaemeka Ani March 28th, 2016 Gamma Ray Spectroscopy using NAI (TI) detector and MCA P a g e 3 | 11 Figure 1- Block Diagram of Instrumentation Layout used to perform NaI (TI) Multichannel Analysis Table 1- System components and their respective serial and model numbers Component Serial Number Model Number Oscilloscope CO 830834 TDS 1002 Multiport II ADC/MCA 11065394 MP2_MCA1 Amplifier 10062079 Canberra 2022 NaI(Tl) Detector 10062743 802-2x2 Preamplifier 11064348 2007P NIM Bin and Power Supply 2080 Ortec 4002D Detector High Voltage Supply 00226056 4001C Procedure The procedure used for this experiment followed Experiment 6 in the Spring 2016 NucE 450 Experiment 6 Laboratory Manual. Dr. Brenizer and Dr. Flaska did not make any changes during the course of the experiment Data: Cesium-137 Data Peak was found to be at channel 898 with 1056 counts Table 2- X-ray and full energy photopeaks X-Ray Photopeak Full Energy(662KeV) Photopeak Peak Centroid (channel) 52 894 FWHM (channel) 14.557 62.507 FWTM (channel) 28.758 116.728 Area (counts) 12881 66266 Uncertainty: ±1.04 % ±0.56 %
- 4. Nnaemeka Ani March 28th, 2016 Gamma Ray Spectroscopy using NAI (TI) detector and MCA P a g e 4 | 11 High Voltage= 00V Gain = 1.273 ±100 Deadtime = 7.69% Table 3- Energy Calibration of radioactive sources given. Peak Centroid(ch) FWHM(ch) FWTM(ch) Area Cesium-137, Barium- 133 Combined 19 4.635 10.736 65599±0.42% Barium-133 Gamma rays 1 48 5.319 9.583 17366±1.23% Barium-133 Gamma rays 2 192 15.416 26.296 13355±2.02% Cesium-137 Gamma rays 345 24.231 46.438 30178±1.07% Cobalt-60 Gamma rays 1 601 28.481 51.504 30456±0.87% Cobalt-60 Gamma rays 2 682 31.121 55.204 29451±0.75% Figure 2- Peak Analysis Report for calibration spectrum
- 5. Nnaemeka Ani March 28th, 2016 Gamma Ray Spectroscopy using NAI (TI) detector and MCA P a g e 5 | 11 Figure 3- Gamma Spectrum Analysis Report of unknown Radionuclide
- 6. Nnaemeka Ani March 28th, 2016 Gamma Ray Spectroscopy using NAI (TI) detector and MCA P a g e 6 | 11 Figure 4- Graph of cesium-137 taken by NaI detector using both Cesium-137 and Barium-133 Figure 5- Graph of Unknown radioisotope 0 1000 2000 3000 4000 5000 6000 7000 8000 9000 0 200 400 600 800 1000 Measured Counts(cpm) Detected Energy(KeV) Cesium-137 Spectrum with Barium-133 0 500 1000 1500 2000 2500 0 200 400 600 800 1000 Measured Counts Calibrated Energy Level (KeV) Unknown Radioisotope Measured Count
- 7. Nnaemeka Ani March 28th, 2016 Gamma Ray Spectroscopy using NAI (TI) detector and MCA P a g e 7 | 11 Analysis of Data or Results 1. Describe the effects on the cesium-137 spectrum caused by varying the various MCA controls, gain, and the high voltage settings. Effects on Varying MCA controls: When the MCA controls are varied, some changes can be noticed. When there was an increment on the vertical scale past its maximum value, it “wrapped around” and started again at the smallest value (which is the LOG scale). Effects on gain setting: When the gain setting was varied, some changes are noticed. When the gain is increased, there is a decrease in the number of counts and an increase in the dead time. Calibration was also altered to some extent. Effects on high voltage setting: When high voltage setting is varied, some changes are visible noticed. Photopeaks moved up and down the channels. 2. Using the cesium-137 spectrum data produced in Section D of the Laboratory Manual and printed out in Section E of the Laboratory Manual, evaluate the NaI(Tl) detector used in your experiment. Include in this evaluation the detector resolution, peak symmetry, and peak-to-Compton ratio. How do your results agree with those obtained in Experiment 5 and with the theoretical values? Experiment 6 results ���� �������� = ���� ���� = 79.285 39.25 = 2.02 ���� �� ������� ����� = ����ℎ� �� ������ − 137 �ℎ������� ��� ℎ���ℎ� �� ������� �ℎ������ = 1262 180 = 7.01 �������� ������ ���������� = ���� ���� �������� ∗ 100 = 925 − 855.75 834 ∗ 100 = 8.3% Experiment 5 results ���� �������� = ���� ���� = 3.95 − 3.35 3.85 − 3.55 = 2 ���� �� ������� ����� = ����ℎ� �� ������ − 137 �ℎ�������� ��� ℎ���ℎ� �� ������� �ℎ����� = 1184 179 = 6.61 �������� ������ ���������� = ���� ���� �������� ∗ 100 = 3.85 − 3.55 3.75 ∗ 100 = 8%
- 8. Nnaemeka Ani March 28th, 2016 Gamma Ray Spectroscopy using NAI (TI) detector and MCA P a g e 8 | 11 Comparing with Experiment 5 results: In comparison with the results in experiment 5, it can be noticed that the data is slightly different in all aspects. The true Compton shoulder was hidden by barium - 133. This was due to the fact that the operators had to be changed to function in a different way. Everything in the data set for this experiment was within the minimum standards. It was noticed that experiment 5 had better data. For instance the peak to Compton ratio was 6.61 but for this experiment it is 7.01. Detector resolution for experiment 5 was 8% but on this experiment it is 8.3% Comparing with Theoretical values: In comparison with theoretical values, it can be noticed that the values from this experiment looked a bit off range. Theoretically, the detector resolution should be within 7-8% but for this experiment it was 8.3%. Theoretically, peak symmetry should be equal or less than 2 but in this experiment it was 2.02 3. Using either the cesium-137 peak data obtained in Section D of the Laboratory Manual or one of the cobalt-60 peaks obtained in Section F of the Laboratory Manual, use the procedures given in class to calculate peak centroid location, gross and net peak areas and their standard errors, FWHM, FWTM, and peak symmetry. How well do your values compare with those obtained by the Genie 2000 program for these values? Explain any differences. ���� �������� = ∑ �� �� ∑ �� = 45919300 65599 = 700 ����� ���� ���� = ∑ �� ���� �����ℎ �=���� ����� � = 30178.107 ��� ���� ���� = ∑ �� ���� �����ℎ �=���� ����� � − ���� ���� = 30178.107 − 17366.123 = 12811.984 ���� �������� = ���� ���� = 110.45 54.79 = 2.02
- 9. Nnaemeka Ani March 28th, 2016 Gamma Ray Spectroscopy using NAI (TI) detector and MCA P a g e 9 | 11 �������� ����� = � √� = 1010.2 √600 = ±41.241 ���� = 925 − 885.75 = 39.25 ���� = 946.78 − 867.50 = 79.29 Comparing with results from Genie 2000: Using Genie 2000, all the results matched up well from question 2. There are some changes in the cesium-137 and barium-133 data. These slight changes maybe as a result of the auto-peak select on the Genie 2000 4. Using the peak channel centroid data determined in Section F of the Laboratory Manual and actual peak energies, evaluate the accuracy of the energy calibration curve obtained in Section F. This requires you to fit a curve or line to your data Figure 6- Line of best fit for the Cesium-137 graph of peak centroid and energy 5. Identify, by using a table, all the spectral features in cesium-137 from Section D of the Laboratory Manual and the calibration spectrum in Section F. Include such items, if seen, as full energy peaks, escape peaks, backscatter peaks, Compton continuums, annihilation peaks, sum peaks, etc. Do their shapes and approximate energy or channel locations agree with the theory given in class?
- 10. Nnaemeka Ani March 28th, 2016 Gamma Ray Spectroscopy using NAI (TI) detector and MCA P a g e 10 | 11 Identification of Spectral features Table 4 – Spectral features and their equivalent energies for the Cesium-137 spectrum Spectral Feature Energy(KeV) X-ray Peak 31.2 Full Energy Peak 650.12 Backscatter Peak 195.52 Compton Peak 440.28 Table 5 - Spectral features and their equivalent energies for the calibration spectrum Spectral Feature Energy(KeV) Cobalt-60 Photo peak 1 1333.28 Cobalt-60 Photo peak 2 1150.25 Cesium-137 photo peak 660.45 Barium-133 photo peak 250.45 Compton Edge 321.28 Backscatter Peak 228.48 Detector Material X-ray 81.52 Cesium-137, Barium- 133 combined X-ray 26.45
- 11. Nnaemeka Ani March 28th, 2016 Gamma Ray Spectroscopy using NAI (TI) detector and MCA P a g e 11 | 11 6. What was the unknown radionuclide? How were the identifications established? How well did the calibration energies agree with the actual peak energies? Explain any discrepancies in these values. The Unknown radionuclide was found to be Sodium-22. This was identified from its 1,115.6 KeV Gamma ray. There was actually another peak energy found which was 511 KeV but this peak is only there as a result of the annihilation process. This was the only peak shown in the data. The closeness to the known value was reported for because of the continual randomness of gamma-ray emission. This therefore caused some slightly changed values. Conclusions The NaI detector used was extremely important. It produced accurate results. Gamma rays remain the same over long ranges through the use of gamma-ray spectroscopy. One very important use of this method is the ability to identify any radioisotopes using this method. Even when the half-life measurements and the radioisotopes are found, we can easily still find the initial amount of element that that decayed. Suggestions for Future Work There were some areas that were not clear to me. I believe that if we are all given a run-down of the experiment just before we conduct it, it will be much appreciated. Sometimes we do not know what to expect and what not. References Brenizer, J.S., and Jovanovic, I. et al, Radiation Detection and Measurement Laboratory Manual, 2013. Knoll, Glenn F., Radiation Detection and Measurement, 4 ed., John Wiley and Sons, 2010. Shultis, J. Kenneth, and Faw, Richard E., Fundamentals of Nuclear Science and Engineering, 2 ed., CRC Press, 2008. Appendices http://demoweb.physics.ucla.edu/content/experiment-6-radioactivity