1. Policing populations in the Columbia Basin
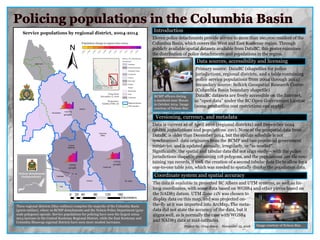
Three regional districts (blue outlines) comprise the majority of the Columbia Basin
(green outline), where 10 RCMP detachments and the Nelson Police Department (grey-
scale polygons) operate. Service populations for policing have seen the largest 2004-
2014 increase in the Central Kootenay Regional District, while the East Kootenay and
Columbia Shuswap regional districts have seen more modest increases.
Introduction
Versioning, currency, and metadata
Data sources, accessibility and licensing
RCMP officers during
a manhunt near Slocan
in October 2014. Image
courtesy of Nelson Star.
Eleven police detachments provide service to more than 160,000 resident of the
Columbia Basin, which covers the West and East Kootenay region. Through
publicly available spatial datasets available from DataBC, this poster examines
the distribution of police detachments and populations in the region.
Primary source: DataBC (shapefiles for police
jurisdictions, regional districts, and a table containing
police service populations from 2004 through 2014)
Secondary source: Selkirk Geospatial Research Centre
(Columbia Basin boundary shapefile)
DataBC datasets are freely accessible on the Internet,
as “open data” under the BC Open Government License
(some production cost restrictions can apply).
Data is current as of April 2016 (regional districts) and December 2014
(police jurisdictions and populations .csv). None of the geospatial data from
DataBC is older than December 2014, but the update schedule is not
synchronized: data originates from the RCMP and two provincial government
ministries, and is updated annually, irregularly, or “as needed”.
Significantly, the spatial and tabular data did not align easily – with the police
jurisdictions shapefile containing 118 polygons, and the populations .csv file con-
taining 192 records, it took the creation of a second tabular data file to allow for a
one-to-one table join, which was needed to spatially display the population data.
Coordinate system and spatial accuracy
The data is available in projected BC Albers and UTM systems, as well as lat-
long coordinates, with some data based on WGS84 and other pieces based on
the NAD83 datum. UTM Zone 11N was chosen to
display data on this map, and was projected on-
the-fly as it was imported into ArcMap. The meta-
data did not state the accuracy of the data, but it
aligns well, as is normally the case with WGS84
and NAD83 data at mid-latitudes.
Project by: Greg Amos November 13, 2016 Image courtesy of Nelson Star.