Deadenylase Expression in Small Cell Lung Cancer Related To Clinical Characte...
Nicholson et al 2016 - FACS kinase inhibition
1. A novel flow cytometric-based method
to measure kinase inhibition in sputum
from COPD subjects
G C Nicholson,1
R A Holloway,2
B R Leaker,1
I Kilty,3
M Salganik,3
L Tan,3
P J Barnes,2
L E Donnelly2
To cite: Nicholson GC,
Holloway RA, Leaker BR,
et al. A novel flow cytometric-
based method to measure
kinase inhibition in sputum
from COPD subjects. BMJ
Open Resp Res 2016;3:
e000140. doi:10.1136/
bmjresp-2016-000140
▸ Additional material is
available. To view please visit
the journal (http://dx.doi.org/
10.1136/bmjresp-2016-
000140).
GCN and RAH contributed
equally.
Received 4 April 2016
Accepted 3 June 2016
1
Respiratory Clinical Trials
Ltd, London, UK
2
Airways Disease Section,
National Heart & Lung
Institute, Imperial College,
London, UK
3
Pfizer, Cambridge,
Massachusetts, USA
Correspondence to
Dr Brian Leaker;
brian.leaker@qasmc.com
ABSTRACT
Introduction: Janus kinases ( JAKs) regulate
inflammatory gene expression through phosphorylation
of signal transducer and activator of transcription (STAT)
proteins. Expression of STAT proteins is increased in
chronic obstructive pulmonary disease (COPD), and
may be involved in driving chronic inflammation. Oral
JAK inhibitors are effective as anti-inflammatory therapy
but exhibit dose-limiting adverse effects. Development
of inhaled compounds would be enhanced by robust
biomarkers that directly reflect the anti-inflammatory and
pharmacological activity in the lung.
Methods: A novel flow cytometry assay was developed
to measure STAT1 phosphorylation in sputum
inflammatory cells. The standard sputum processing
method was refined to improve sputum cell viability. The
flow cytometric assay was used to assess the
reproducibility of the measurement of STAT1
phosphorylation and the in vitro activity of a pan JAK-
inhibitor on three separate visits in patients with COPD.
Results: Upregulation of STAT1 phosphorylation was
measured following in vitro IFNγ stimulation of sputum
macrophages (stimulated/unstimulated ratio 1.57;
p<0.00001). Upregulation was inhibited following in
vitro preincubation with a pan JAK-inhibitor (inhibited
+stimulated/unstimulated ratio 0.97). STAT1
phosphorylation activity could only be measured in
macrophages.
Conclusions: Sputum from patients with COPD can be
used to reproducibly measure phospho-STAT expression
in sputum macrophages. The flow cytometry-based
method can be used to evaluate kinase inhibitors in vitro
and subsequently in ex vivo studies. The assay is
particularly useful for the assessment of inhaled
compounds where whole blood assays may not be
relevant.
INTRODUCTION
The regulation of protein function in mam-
malian cells is controlled via reversible
protein phosphorylation mediated by protein
kinases. Kinases, of which there are over 500
types, are the enzymes responsible for critical
signalling pathways in all cell types. There
has been recent interest in the use of kinase
inhibitors for the treatment of chronic
obstructive pulmonary disease (COPD) and
asthma-COPD overlap syndromes via target-
ing neutrophilic inflammation and reversing
steroid resistance.1 2
Kinase inhibitors are
not specific for a single kinase, but usually
inhibit several kinases which may result in
off-target adverse effects.3
Janus kinases ( JAKs) are non-receptor tyro-
sine kinases activated by various cytokine
receptors, and regulate the expression of
multiple inflammatory genes through phos-
phorylation of STAT proteins.4
JAK1/3 het-
erodimers regulate T-cell survival, whereas
JAK2 mediates granulocyte-macrophage
colony-stimulating factor-mediated neutro-
phil survival in addition to interferon-γ
(IFNγ) and interleukin (IL)-12/IL-23 signal-
ling. STAT4 is activated by IL-12 and IL-23,
STAT5 by IL-2, whereas STAT6 is activated by
IL-4 and IL-13. JAK-STAT signalling is acti-
vated in several inflammatory and immune
diseases, leading to the development of inhi-
bitors of this pathway, such as selective JAK
inhibitors. Inflammation is increased in the
respiratory tract in patients with COPD and,
by analogy, with rheumatoid arthritis and
inflammatory bowel disease it would be
KEY MESSAGES
▸ A novel flow cytometric based method has been
developed to measure kinase inhibition in
induced sputum by measuring intracellular
phosphorylation of components of the JAK/STAT
pathway.
▸ This work highlights that macrophages play an
important part in the JAK/STAT pathway of
inflammation.
▸ This novel biomarker method details a unique
application for the evaluation of inhaled kinase
inhibitors as therapeutic agents in the treatment
of lung disease and could prove a valuable tool
in drug development.
Nicholson GC, Holloway RA, Leaker BR, et al. BMJ Open Resp Res 2016;3:e000140. doi:10.1136/bmjresp-2016-000140 1
Respiratory research
group.bmj.comon June 28, 2016 - Published byhttp://bmjopenrespres.bmj.com/Downloaded from
2. expected that JAK-STAT signalling is also involved in the
chronic inflammation of patients with COPD. STAT4 is
activated in lung parenchyma of patients with COPD.5
STAT phosphorylation can be detected easily by
western blotting, but this cannot identify activation in
specific cell types in a mixed population. Flow cytometry
has been used to detect intracellular STAT1 phosphoryl-
ation in whole blood assays and peripheral blood mono-
nuclear cells (PBMC),6 7
but not in sputum.
The selective JAK inhibitor, tofacitinib, inhibits JAK1,
JAK3 and, to a lesser extent, JAK2 and tyrosine kinase 2
(TYK2), resulting in inhibition of STAT phosphorylation.
This orally administered drug has been approved for
clinical use for the treatment of rheumatoid arthritis,
and has also shown clinical benefit in a wide range of
other inflammatory diseases. Tofacitinib, in common
with other oral JAK inhibitors, is associated with signifi-
cant adverse effects, especially when used in higher
doses.8
These complications limit the dose of drug that
can be delivered systemically. In early studies with tofaci-
tinib, whole blood assays were used to establish the
mechanism of action of these drugs to inhibit the STAT
phosphorylation pathway in leucocytes, whole blood or
PBMC.
Other more recent compounds in development
include pan-JAK inhibitors which have been shown to
suppress STAT1 phosphorylation and inhibit the release
of proinflammatory cytokines.9
These have a rapid sys-
temic clearance and so, when given by the inhaled
route, may maximise local anti-inflammatory activity
while minimising systemic adverse events.10
Inhaled
drugs may be the preferred route of administration for
the treatment of inflammatory lung diseases, such as
COPD. However, blood assays cannot be used to
measure the effect of inhaled JAK inhibitors, as drug
concentrations in the systemic circulation are designed
to be low. This means that it is necessary to measure
JAK-STAT inhibition in cells from the respiratory tract.
We have developed an assay system to measure STAT
phosphorylation in sputum samples using flow cytome-
try. The measurement of STAT phosphorylation enables
direct assessment of the efficacy and sensitivity of kinase
inhibitor compounds, particularly those delivered via
the inhaled route of administration to the lungs. The
intracellular flow cytometry method identifies the spe-
cific cell populations that express phosphorylated STAT
in sputum. The flow cytometry-based method is comple-
mented by the additional measurements of cell types
and cytokine levels. This biomarker method can be used
to evaluate the efficacy and/or sensitivity, as well as the
choice of a suitable dose range and/or dosage regimen
for an inhaled kinase inhibitor.
METHODS
Study design
The study was carried out according to The Code of
Ethics of the World Medical Association (Declaration of
Helsinki), and was approved by the National Research
Ethics Service Committee London, Hampstead,
Northwick Park Hospital REC Centre (REC reference
12/LO/0579). All individuals provided written informed
consent.
A pilot study11
was undertaken to determine assay con-
ditions which were subsequently used in the main study.
Induced sputum samples were obtained from patients
with COPD (n=6) and healthy smokers (n=3).
In the main study, sputum samples were obtained
from 15 patients with established COPD (see below).
Repeat samples were obtained on at least two occasions
1 week apart during three separate visits. The aim of the
study was to establish an ex vivo method for the meas-
urement of JAK activity by measuring STAT phosphoryl-
ation using flow cytometry in cells obtained from
induced sputum. Separate cell fractions were measured
unstimulated, after cytokine stimulation and after prein-
cubation with a pan-JAK inhibitor plus cytokine stimula-
tion. In addition, each sputum sample was analysed for
differential cell count, and after sputum processing
using a modification of standard methods, a multiplex
analysis system was used to measure chemokines and
cytokines.
Patients
The study included 15 evaluable patients with COPD who
were current or ex-smokers. The demographic character-
istics of the patients are presented in table 1. Patients
with COPD were to have had a diagnosis, for at least
6 months, of moderate to severe COPD and met the cri-
teria for GOLD category II–III disease12
(table 1).
Patients had not taken oral corticosteroids within
3 months of visit 1, inhaled corticosteroids within 4 weeks
of visit 1, or leucotriene modulators within 2 weeks of
visit 1.
Primary and secondary evaluations
The primary end point for the study was STAT1 phos-
phorylation in sputum macrophages (non-stimulated
and/or stimulated cells±JAK inhibitor). The secondary
end points for the study were the sputum cell count
data (total cell count; total neutrophil count and differ-
ential cell count (%); total macrophage count and dif-
ferential cell count (%)), and selected biomarker end
points: CXCL8, CXCL9, CXCL10, CXCL11, CCL2,
CCL4, CCL5, IL-1β, IL-6, eosinophil cationic protein
(ECP), neutrophil elastase (NE) and α2 macroglobulin.
Sputum induction
The study comprised three visits with each visit sepa-
rated by at least 7 days. At visit 1, provided all other
inclusion/exclusion criteria were satisfied (except
laboratory test values which were reviewed as soon as
they were available), the patient underwent sputum
induction as previously described using nebulised 3–5%
saline.13 14
If all entry criteria were met, the patient pro-
gressed to visits 2 and 3. At visits 2 and 3, an induced
2 Nicholson GC, Holloway RA, Leaker BR, et al. BMJ Open Resp Res 2016;3:e000140. doi:10.1136/bmjresp-2016-000140
Open Access
group.bmj.comon June 28, 2016 - Published byhttp://bmjopenrespres.bmj.com/Downloaded from
3. sputum sample was obtained. If a patient was unable to
produce an evaluable sample at any visit, they could
undergo a single additional visit (at least 4 days follow-
ing the previous induction). An evaluable patient was
defined as a patient who met all the inclusion and exclu-
sion criteria, and produced at least two sufficient
sputum samples which were evaluable for flow cytome-
try, cell count and cytokine analyses.
An evaluable sample was defined as >80% viability,
<20% squamous cells, a minimum of 0.1 g in sputum
weight and >2×10⁶
total cells.
Sputum samples were processed using a technique
adapted for intracellular STAT phosphorylation analysis.
Established techniques using dithiothreitol (DTT,
Sigma-Aldrich, UK),15
were adapted to decrease DTT
concentration while retaining sufficient mucus liquefac-
tion. Sputum plugs were selected for processing, the
volume of the selected sputum sample measured and an
equal volume of Dulbecco’s phosphate buffered saline
(DPBS, Sigma-Aldrich, UK) added. A reducing agent was
added in order to liquefy the sample. DTT at a final con-
centration of 0.05% (w/v) was used to break the disul-
phide bonds in the mucus; this is a significantly lower
concentration than is standard for sputum samples.
The tube was placed on a plate shaker at 300 rpm for
45 min; a longer incubation time than standard sputum
processing techniques. The sample was centrifuged at
258 g for 10 min. The sputum supernatant was separated
and retained for cytokine/chemokine analysis, while the
cellular components of the sample were used to assess
total cell counts, cell differential counts and STAT
phosphorylation.
JAK inhibitor
PF-956980 is a pan-JAK inhibitor which inhibits STAT
phosphorylation. Previous in vitro and ex vivo work on
this compound has shown it to have a significant inhibi-
tory effect with IC50 values of 4–121 nM.16 17
Cell preparation for STAT phosphorylation analysis
Isolated sputum cells were allowed to rest at 37°C for
1 hour. Cells were added to tubes containing PF-956980
(or DPBS) at a final concentration of 10−5
M before the
addition of IFNγ (R&D Systems, Abingdon, UK)
(or DPBS) at a final concentration of 10 ng/mL and
incubated at 37°C for 20 min. Samples were then centri-
fuged at 258 g for 5 min at room temperature and the
cells resuspended in 4% (w/v) paraformaldehyde
(Sigma-Aldrich, Poole, UK) in DPBS at 37°C for 15 min
in order to fix the cells. A further centrifugation at
258 g for 5 min at room temperature was followed by
resuspension in 100% ice-cold methanol (Sigma-Aldrich,
UK), and incubation on ice for 20 min in order to per-
meabilise the cells. The samples were centrifuged at
258 g for 5 min at room temperature, and Alexa Fluor
647-conjugated anti-pSTAT1 antibody (or isotype
control) (BD Biosciences, Oxford, UK) was added for
30 min at room temperature in the dark. The samples
were centrifuged at 258 g for 5 min at room temperature
and suspended in DPBS containing 2% (v/v) human
serum (Sigma-Aldrich, UK) and analysed using a
FACSCanto II Flow Cytometer (BD Biosciences, UK).
Analysis of selected biomarker end points
Selected biomarkers in induced sputum supernatant were
analysed using Luminex technology or ELISA. The follow-
ing analytes were measured using Luminex technology
kits (R&D Systems, Abingdon, UK) as per manufacturer’s
instructions, the lower limit of detection for each analyte
shown in brackets: CXCL8 (0.11 pg/mL), CXCL10
(0.04 pg/mL), CXCL11 (0.14 pg/mL), CCL2
(0.08 pg/mL), CCL4 (0.23 pg/mL), CCL5 (0.59 pg/mL),
IL-1β (0.11 pg/mL) and IL-6 (0.10 pg/mL). The
Table 1 Demographic characteristics of patients with
COPD included in the study
Patients with COPD (N=15)
Gender
Male/female 11/4
Age (years)
Mean (SD) 62.9 (8.9)
Range 48.0–76.0
Smoking classification
Smoker/ex-smoker 8/7
Race
White/Asian/other 13/1/1
Weight (kg)
Mean (SD) 76.5 (12.1)
Range 55.0–97.1
Body mass index (kg/m2
)
Mean (SD) 27.0 (4.0)
Range 21.2–34.0
FEV1(L) % predicted
Prebronchodilator
Mean (SD) 1.56 (0.38) 55.6 (12.0)
Range 1.07–2.48 35.2–78.6
Postbronchodilator
Mean (SD) 1.78 (0.42) 63.0 (11.8)
Range 1.16–2.63 39.6–79.6
FEV1/FVC (%)
Prebronchodilator
Mean (SD) 0.50 (0.09)
Range 0.36–0.72
Postbronchodilator
Mean (SD) 0.51 (0.09)
Range 0.33–0.68
FVC(L)
Prebronchodilator
Mean (SD) 3.13 (0.68)
Range 2.16–4.25
Postbronchodilator
Mean (SD) 3.45 (0.65)
Range 2.36–4.47
COPD, chronic obstructive pulmonary disease; FEV1, forced
expiratory volume in 1 s; FVC, forced vital capacity; N, number.
Nicholson GC, Holloway RA, Leaker BR, et al. BMJ Open Resp Res 2016;3:e000140. doi:10.1136/bmjresp-2016-000140 3
Open Access
group.bmj.comon June 28, 2016 - Published byhttp://bmjopenrespres.bmj.com/Downloaded from
4. remaining analytes were measured using ELISA as per
manufacturer’s instructions: CXCL9 (1.37 pg/mL, R&D
Systems, UK), ECP (0.05 ng/mL, Aviscera Bioscience,
Santa Clara, USA), NE (1.98 pg/mL, eBioscience,
Hatfield, UK) and α2 macroglobulin (2 ng/mL, Abcam,
Cambridge, UK).
Statistical methods
The analyses were performed on the evaluable popula-
tion. The analysis explored the distributions of the
Mean Fluorescence Intensity (MFI) ratios (stimulated/
unstimulated and stimulated/inhibited+stimulated cell
populations) at each visit. The increase in the MFI ratios
was observed for each patient and each visit, and it was
noted that the signal to noise ratio was so large that the
probability of observing this effect by chance was negli-
gible. The formal evaluation of the statistical significance
for the observed deviation of the visit and outcome-
dependent mean of MFI ratio from 1 was evaluated by
the two-sided t-test.
For all the other analyses, we used a descriptive statis-
tics that characterised demographic characteristics of the
study population, variability of the outcome at each of
the visits and variability of the pair-wise differences in
the outcomes across the visits (ie, within/between
patients’ variability). In the analysis of variability the log-
transformed (base 10) values were used for MFI, sputum
counts and cytokine concentrations while the untrans-
formed outcomes were used for the differential counts
(percentages) of neutrophils and macrophages.
A strength of association between repeated measures
was characterised by the estimates of the correlation.
The visit-depended between patients’ variability was
characterised by the estimated SD of the values of (log-
transformed in case of MFI, sputum counts and cytokine
concentrations) outcomes collected at this visit. The
within-patient variability for a pair of visits (eg, visit 1
and visit 2) was characterised by the estimate of the SD
of the difference between the values observed at these
visits. The numbers of observations at different visits and
numbers of matched observations in a pair of visits were
slightly different across visits and pairs of visits because
of the missing values. Each of the descriptions (ie, cor-
relation, SD (within), SD (between)) produced three
values of descriptive statistics. These numbers were sum-
marised by reporting minimum, median and maximum
value for each of the outcomes. The values of MFI were
summarised similarly.
The tabulations of within and between-patients’ vari-
ability are expected to be used in the design of future
clinical trials where the effect of treatment will be evalu-
ated by the comparisons of the observations of the out-
comes of interest within or across patients.
RESULTS
Pilot study
Flow cytometry was used to measure phosphorylation
of STAT1, 3 and 4 proteins in sputum cells following
exposure to IFNγ or inhibition of these cell samples
with PF-956980. Viable cell populations for flow cyto-
metry could only be obtained using a modified
sputum processing technique where a lower concentra-
tion of DTT was used as described in the methods
section. A comparison of the standard processing tech-
nique using 0.1% DTT and the modified approach
using 0.05% DTT can be found in the online
supplementary figure S1. These early results showed
the absence of an assay window between stimulated
and non-stimulated neutrophils, whereas phosphoryl-
ation of STAT proteins could be measured in the
macrophage cell population. The pilot study data
Table 2 Repeatability and variability of sputum parameters
Outcome Visit 1 (N=15) Visit 2 (N=15) Visit 3 (N=12) Correlation SD (within) SD (between)
Sputum cell count per
gram (×106
/G)
5.1 (1.5–21.8) 5.5 (1.9–16.4) 3.6 (1.9–15.7) 0.47 (0.45–0.66) 0.27 (0.27–0.36) 0.31 (0.22–0.36)
Sputum neutrophil
count (×106
/G)
4.0 (0.9–21.4) 5.0 (1.4–15.4) 2.9 (1.5–13.9) 0.51 (0.48–0.71) 0.29 (0.28–0.39) 0.33 (0.25–0.40)
Sputum macrophage
count (×106
/G)
0.6 (0.1–1.4) 0.5 (0.2–1.5) 0.6 (0.2–1.8) 0.37 (0.16–0.58) 0.34 (0.3–0.38) 0.29 (0.25–0.33)
Sputum cell count
(×106
)
8.5 (2.4–75.3) 4.7 (2.3–29.9) 5.7 (2.6–26.9) 0.45 (−0.2–0.78) 0.45 (0.37–0.53) 0.34 (0.32–0.35)
Sputum neutrophil
differential count (%)
88.8 (63.8–98.2) 88.0 (64.8–95.5) 84.5 (66–92.5) 0.56 (0.51–0.62) 8.9 (8.6–10.3) 10.1 (7.8–10.7)
Sputum macrophage
differential count (%)
6.2 (1.5–36.2) 10.8 (4.0–34.5) 15.1 (6.0–34.0) 0.60 (0.58–0.68) 9.0 (8.7–9.9) 10.3 (8.3–11.1)
Each grid of the table contains median (range) for corresponding outcome. The summaries in the columns 2–4 use untransformed values of
the outcomes. The summaries in columns 5–7 use log-transformed (base 10) counts and untransformed percentiles. The correlation value
characterises a strength of association between repeated measures. The SD (within) is the estimated (within-patient) SD of the difference in
outcomes observed for a patient at the different visits. The SD (between) is the estimated (between patients) SD of the outcomes observed at
a particular visit. The summaries in columns 5–7 are calculated over three pair-wise summaries (ie, (visit 1, visit 2), (visit 1, visit 3), (visit 2,
visit 3)). The header of columns 2–4 shows number of observations for each of the visits.
4 Nicholson GC, Holloway RA, Leaker BR, et al. BMJ Open Resp Res 2016;3:e000140. doi:10.1136/bmjresp-2016-000140
Open Access
group.bmj.comon June 28, 2016 - Published byhttp://bmjopenrespres.bmj.com/Downloaded from
5. failed to demonstrate reliable measurement of phos-
phorylated STAT 3 or 4 following stimulation, and
therefore, only phosphorylated STAT1 was measured
in the main study. Finally, the pilot data showed that
there was increased variability (data not shown)
between replicate samples where the sample contained
a low percentge of macrophage cell counts (below
5%). Therefore, sputum selection criteria were intro-
duced for the main study which stipulated that patient
samples were excluded from the analysis from those
visits where the mean macrophage (%) was <5% of
the total leucocyte population.
Main study
Fifteen patients with COPD were enrolled, and each was
asked to complete three visits where they would provide
an induced sputum sample. Up to one repeat visit was
allowed if the patient was unable to provide an evaluable
sample at any of the visits, meaning patients may have a
maximum of four attempts to produce an evaluable
sample. A patient was included in the study provided
that at least two samples met the criteria including
adequate flow cytometry measurements. The mean per
cent cell viability for evaluable samples used in this study
was 88.49%, of squamous cells it was 5.00%, and the
mean sputum weight was 1.88 g.
Mean cell counts and SDs for sputum cell counts were
largely consistent over the three visits (table 2).
Observed variability was lower than previously published
literature values.
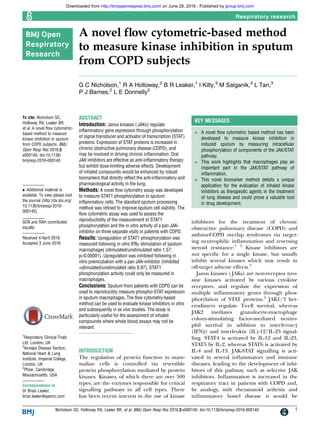
Flow cytometric gating of the macrophage population
was achieved via sequential gating to first eliminate
debris from the collective leucocyte populations based
on size and granularity characteristics (FSC vs SSC)
(figure 1). Macrophages were identifiable from the
adjacent neutrophil population via their physical
characteristics, confirmation of the population orienta-
tions being confirmed during prestudy work (data not
shown). Debris was gated out (shown as the black popu-
lation streak at the left-hand side of the profile), and
the three distinct populations within P1 gated on with
specific interest in the population to the right which
contained macrophages. The population to the immedi-
ate left of the macrophages represents neutrophils, and
the small population at the bottom of the profile is
unidentified.
STAT1 phosphorylation as measured by flow cyto-
metric analysis revealed a significant increase following
stimulation with IFNγ (p<0.00001) and preincubation
with JAK-inhibitor PF-956980 inhibited STAT1 phosphor-
ylation completely with levels detected remaining com-
parable with non-stimulated samples (MFI ratio
stimulated/unstimulated, 1.55; MFI ratio stimulated/
inhibited+stimulated, 1.64; MFI ratio inhibited+stimu-
lated/unstimulated, 0.97) (table 3, figures 2 and 3).
Levels of STAT1 phosphorylation after stimulation with
IFNγ and following preincubation with JAK-inhibitor
PF-956980 showed good reproducibility over consecutive
visits (table 3), there was little variation across visits in
any of the three stimulation conditions, and the stimu-
lated population was different from the non-stimulated
and stimulated+inhibitor populations.
Figure 1 Gating strategy to identify sputum macrophage
population. Gate P1 identifies the leucocyte populations in
red, macrophages within this gate highlighted in green.
Table 3 Repeatability and variability of mean fluorescence intensity (MFI)
Outcome Visit 1 (N=15)* Visit 2 (N=15)* Visit 3 (N=10) Correlation SD (within) SD (between)
MFI (inhibited
+stimulated)
111 (80–150) 122 (92–186) 116 (107–152) 0.08 (0.04–0.7) 0.11 (0.07–0.11) 0.09 (0.06–0.09)
MFI
(unstimulated)
116 (84–176) 129 (89–183) 117 (108–149) 0.09 (–0.14–0.49) 0.09 (0.09–0.12) 0.08 (0.05–0.09)
MFI (stimulated) 171 (116–268) 202 (163–273) 199 (172–220) 0.24 (0.12–0.37) 0.08 (0.08–0.09) 0.07 (0.03–0.09)
Each grid of the table contains median (range) for corresponding outcome. The summaries in columns 2–4 use untransformed values of the
outcomes. The summaries in columns 5–7 use log-transformed (base 10) MFI values. The correlation value characterises a strength of
association between repeated measures. The SD (within) is the estimated (within-patient) SD of the difference in outcomes observed for a
patient at the different visits. The SD (between) is the estimated (between-patients) SD of the outcomes observed at a particular visits. The
summaries in columns 5–7 are calculated over three pairwise summaries (ie, (visit 1, visit 2), (visit 1, visit 3), (visit 2, visit 3)). The header
shows number of observations for each of the visits which are very slightly different for different outcomes.
*One inhibited+stimulated value missing at visit 1 and visit 2, therefore N=14 for MFI (inhibited+stimulated) at these two visits.
Nicholson GC, Holloway RA, Leaker BR, et al. BMJ Open Resp Res 2016;3:e000140. doi:10.1136/bmjresp-2016-000140 5
Open Access
group.bmj.comon June 28, 2016 - Published byhttp://bmjopenrespres.bmj.com/Downloaded from
6. Figure 3 and table 3 demonstrate the sensitivity of the
changes in the MFI value to the stimulation and inhib-
ition. The median values and ranges of the ratios of MFI
were 1.57 (1.14–2.44) for stimulated/unstimulated ratio,
1.64 (1.17–2.37) for stimulated/inhibited+stimulated
ratio and 0.97 (0.80–1.07) for inhibited+stimulated/
unstimulated ratio. The visit and outcome dependent
tests confirmed the statistical significance of increase in
MFI ratios with the p values all below 0.00001.
Inflammatory biomarkers were measured and the
medians and SDs across the three visits, as well as the
within-patient variability estimates exhibited good reprodu-
cibility, the within-patient variability was usually somewhat
smaller than the between-patients’ variability (table 4).
The characteristics of within and between-patients’
variability for all measurements are summarised in
figure 4.
DISCUSSION
COPD is an inflammatory disease of the airways charac-
terised by increased levels of proinflammatory markers
in lung tissue, and associated bronchial alveolar lavage
(BAL) fluid and sputum. Increased sputum neutrophil
levels have been correlated with disease progression and
established as a primary biomarker of disease activity.
Other biomarkers identified in sputum, such as CXCL8
(IL-8), club cell secretory protein (CC-16) and others,
have been associated with disease activity, and in some
studies correlate with disease progression.18 19
Previous studies have shown that both neutrophil and
macrophage cell populations are increased in sputum
and BAL samples taken from patients with COPD com-
pared with those from disease-free patients,20
and that
this increase is correlated with disease severity.21 22
Macrophages, in particular alveolar macrophages, are
the most abundant type of immune cell found in the
small airways, and they seem to accumulate in areas of
tissue damage in the lungs.23 24
This increase in the
number of macrophages may be due to active recruit-
ment of circulating monocytes as a result of the chemo-
attractant actions of CCL2 and CXCL1, both of which
are found to be raised in sputum and BAL samples from
patients with COPD.25
Sputum neutrophil counts have commonly been
described as the major biomarker in COPD,26
and
neutrophils were previously believed to be an import-
ant cell type in kinase pathways. However, the data pre-
sented here suggests that macrophages may emerge as
the more relevant and important effector cell in lung
inflammation in COPD. Macrophages may actually be
the key cell of interest in the STAT1 phosphorylation
pathway. Indeed where sputum samples comprised of
100% neutrophils were studied no signal change was
detected, and it has been previously noted that the
correlation of sputum neutrophil counts and lung
disease is often weak.26
Measurement of STAT phos-
phorylation in macrophages using this novel
Figure 2 STAT1 phosphorylation in sputum macrophages
expressed as flow cytometric histogram data. Mean
fluorescence intensity of macrophage population unstimulated
(A), stimulated (B) and stimulated after preincubation with
JAK-inhibitor PF-956980 (C).
6 Nicholson GC, Holloway RA, Leaker BR, et al. BMJ Open Resp Res 2016;3:e000140. doi:10.1136/bmjresp-2016-000140
Open Access
group.bmj.comon June 28, 2016 - Published byhttp://bmjopenrespres.bmj.com/Downloaded from
7. methodology could lead to a greater understanding of
the mechanisms driving the chronic inflammation
seen in COPD.
As a methodology for the analysis of STAT phosphoryl-
ation in COPD, flow cytometric analysis of induced
sputum cells has a number of advantages. The use of
induced sputum samples rather than whole blood or
PBMCs allows the researcher to analyse changes occur-
ring at the site of inflammation, in this case the lung,
and therefore, assess the effects of inhaled drugs.
Previous work has concentrated on whole blood techni-
ques which provide valuable information relating to sys-
temic effects but lack the specificity of more localised
measurements.6 7 27
Table 3 and figure 3 show that the
flow cytometric method produces reproducible STAT1
phosphorylation data over numerous visits enabling
assessment of drug effects over time.
Flow cytometric analysis of induced sputum cells
samples presents a number of challenges. Some of these
are practical, for instance, high levels of epithelial cells
and/or debris can affect sample analysis.28
Cell numbers
are often limited due to size and quality of sample,
meaning a minimum weight and viability count must be
established in advance to ensure a sufficient cell count
for flow cytometric analysis.24
The use of DTT can alter
the detection of cellular surface markers.29
Sputum
macrophages tend to express reduced levels of cell
surface markers, possibly as a result of higher levels of
proteases in the lung environment.30–32
Also, sputum
macrophages tend to exhibit increased auto-
fluorescence due to endocytosed particles in cigarette
smoke leading to possible increases in background
signal.33
These issues would seem to suggest that
induced sputum is not an ideal sample type to study.
However, induced sputum tends to have reasonably high
viability compared with spontaneously produced sputum
samples,34–36
and the induction procedure is well toler-
ated by patients with FEV1 >30%, meaning it can be
used to study all but the most severe patients with
COPD.37
Added to this is the fact that induced sputum
appears to give reproducible cell and mediator data
making it a good candidate for long term or repeatabil-
ity studies.38
JAKs are a family of enzymes which catalyse the phos-
phorylation of STAT proteins, which regulate inflamma-
tory gene expression. Gene association studies have
found an association between STAT1 and COPD. On
phosphorylation, STAT1 increases transcription and
expression of several inflammatory biomarkers, includ-
ing IFNγ, IL-2 and TNFα.20 39
The JAK/STAT pathway
can be activated by IFNγ, which is increased in COPD,37
with an increase in STAT1 phosphorylation and upregu-
lation of proinflammatory cytokines, such as CXCL9,
CXCL10 and CXCL11 from airway epithelial cells.20
Inhaled JAK inhibitors are being developed with a view
to inhibiting this pathway, and thereby reducing inflam-
mation in COPD.
Kinase inhibitors administered via the inhaled route
are designed to be delivered direct to the lung in order
to avoid systemic effects and adverse effects. For this
reason, established whole-blood assays for measuring
STAT phosphorylation would not be relevant in these
circumstances. Rather, the whole-blood technique is rele-
vant in the evaluation of oral drugs, which have a
Figure 3 Distributions of ratios of MFI by visit for the stimulated/unstimulated, stimulated/inhibited+stimulated and inhibited
+stimulated/unstimulated samples. A median is shown by the black horizontal bar, 25–75% range is contained within a
grey-shaded zone. The ends of whiskers show the lowest and highest datum still within 1.5 IQR from the lower and upper
quartiles. The unshaded symbols show the values with higher deviations from the quartiles. The dotted lines show the medians
of ratios calculated for the data pooled over three visits: (1.57, 1.64, 0.97).
Nicholson GC, Holloway RA, Leaker BR, et al. BMJ Open Resp Res 2016;3:e000140. doi:10.1136/bmjresp-2016-000140 7
Open Access
group.bmj.comon June 28, 2016 - Published byhttp://bmjopenrespres.bmj.com/Downloaded from
8. systemic drug distribution that results in measurable
blood levels. An inhaled drug, for lung diseases in par-
ticular, has advantages including local delivery to the site
of action, and often a reduction in side effects commen-
surate with reduced systemic exposure.
A methodology such as the one described here would
be of great benefit during the development of inhaled
compounds. The study design included measuring the
levels of one or more cytokines or chemokines in the same
sputum sample obtained from the individual. The simul-
taneous measurement of intracellular STAT phosphoryl-
ation and cytokines from the same sample would give a
complete pharmacodynamics picture of the compound
under analysis, both its effect on STAT activation and the
resulting protein translation. Furthermore, the intracellu-
lar flow cytometry method allows for identification of spe-
cific cell populations expressing phosphorylated STAT.
This has not been possible using western blot-based
methods.
The clinical development of kinase inhibitors, and
particularly kinase inhibitors delivered via the inhaled
route, would be enhanced by the development of novel
biomarkers that reflect active pharmacologic activity in
the lung. These biomarkers can be used to provide the
scientific rationale for understanding optimal selection
of similar compounds for clinical development, optimal
selection of dose, dose range and prediction of likely
pharmacodynamic activity. Early selection of the correct
dose and dose range in clinical studies allows proof of
pharmacology and/or proof of mechanism studies to
further define the therapeutic ratio and support the
correct dose selection prior to entering into larger
patient studies.
The estimates of variability presented in tables 2–4
may be used for power calculations for exploratory
studies focused on the effect of the new treatments on
the biomarkers of the patients with COPD. These esti-
mates suggest that a small (∼10 patients with COPD with
complete responses) proof of pharmacology study using
a crossover design will be sufficient for detecting (with
the two-sided significance level=0.05 and power=90%), a
30% increase in the MFI caused by STAT1
phosphorylation.
CONCLUSION
STAT1 phosphorylation and accompanying inflamma-
tory cytokine levels can be reproducibly measured in
sputum samples via the novel processing and analysis
methods described. The inhibition of STAT1 phosphor-
ylation after IFNγ stimulation by a JAK inhibitor was also
demonstrated.
The results of this study indicate that macrophages
play an important part in the JAK/STAT pathway of
inflammation. Much previous work has focused on neu-
trophilic inflammation, but these data indicate that, not
only are macrophages important, but they play a key
role in the regulation of chronic airway inflammation. It
Table4Repeatabilityandvariabilityofcytokinemeasurementininducedsputumsupernatant
OutcomeVisit1(N=15)Visit2(N=15)Visit3(N=12)CorrelationSD(within)SD(between)
α2-Macroglobulin(μg/mL)2.5(0.3–23.9)3.2(0.3–22.7)1.2(0.3–72.1)0.93(0.88–0.95)0.20(0.07–0.37)0.61(0.56–0.75)
CCL5(pg/mL)17.8(2.2–72.5)8.4(2.2–82.9)7.3(2.2–213.8)0.75(0.75–0.95)0.43(0.25–0.47)0.61(0.60–0.69)
CXCL10(pg/mL)764(44–2352)1002(26–16429)838(45–16632)0.69(0.54–0.75)0.50(0.49–0.70)0.68(0.57–0.81)
CXCL11(pg/mL)20.3(0.1–319.1)16.5(0.1–153.5)20(0.1–62.6)0.49(0.29–0.65)1.07(0.81–1.66)0.93(0.87–1.04)
CXCL9(pg/mL)913(56–7824)1006(51–7591)657(64–9964)0.83(0.74–0.9)0.42(0.38–0.54)0.68(0.62–0.80)
ECP(ng/mL)87.3(13.1–151.5)54.3(17.7–181.2)65.9(19.4–215.3)0.87(0.75–0.89)0.17(0.11–0.26)0.34(0.32–0.36)
IL-1β(pg/mL)428(68–4238)475(62–3057)445(71–1605)0.46(0.27–0.77)0.57(0.54–0.60)0.47(0.41–0.55)
IL-6(pg/mL)445(82–1826)470(62–4532)241(71–4991)0.87(0.68–0.92)0.27(0.23–0.40)0.52(0.38–0.55)
IL-8(ng/mL)20(5.8–83.7)19.3(5.5–172.2)31.1(6.6–117.2)0.59(0.55–0.85)0.35(0.25–0.35)0.40(0.35–0.41)
MCP-1(pg/mL)573(144–1666)619(210–4777)660(225–4269)0.71(0.69–0.72)0.29(0.27–0.29)0.38(0.28–0.40)
MIP-1β(pg/mL)278(24–1693)249(27–1984)254(43–2151)0.74(0.62–0.86)0.43(0.37–0.50)0.53(0.5–0.57)
NE(ng/mL)223(62–668)274(56–647)205(44–3442)0.73(0.6–0.76)0.24(0.16–0.40)0.34(0.32–0.50)
Eachgridofthetablecontainsmedian(range)forcorrespondingoutcome.Thesummariesinthecolumns2–4useuntransformedvaluesoftheoutcomes.Thesummariesincolumns5–7use
log-transformed(base10)concentrations.Thecorrelationvaluecharacterisesastrengthofassociationbetweenrepeatedmeasures.TheSD(within)istheestimated(within-patient)SDofthe
differenceinoutcomesobservedforapatientatthedifferentvisits.TheSD(between)istheestimated(between-patients)SDoftheoutcomesobservedatparticularvisits.Thesummariesin
columns5–7arecalculatedoverthreepairwisesummaries(ie,(visit1,visit2),(visit1,visit3),(visit2,visit3)).
CCL,C-Cmotifchemokineligand;COPD,chronicobstructivepulmonarydisease;CXCL,C-X-Cmotifchemokineligand;IL,interleukin;LLOQ,lowerlimitofquantification;NE,neutrophil
elastase.
8 Nicholson GC, Holloway RA, Leaker BR, et al. BMJ Open Resp Res 2016;3:e000140. doi:10.1136/bmjresp-2016-000140
Open Access
group.bmj.comon June 28, 2016 - Published byhttp://bmjopenrespres.bmj.com/Downloaded from
9. is of interest that clinical trials using antineutrophil ther-
apies such as CXCR2 antagonists have shown dramatic
reduction in circulating and pulmonary neutrophil
counts,40
however, these effects have not translated into
meaningful clinical benefits in patients with COPD.41
These techniques can be used to develop a greater
understanding of the role of macrophages in chronic
airway disease. This information may indicate possible
future therapeutic targets while enabling assessment of
the efficacy and sensitivity of new and novel therapeutic
compounds.
Contributors GCN, RAH, PJB, IK, LT, BRL, LED were involved in the
conception and design of the work. GCN, MS and BRL were involved in the
analysis and interpretation of data. GCN, PJB, IK, BRL, and LED were involved
in drafting or revising the manuscript. Final approval of the manuscript was
by GCN, RAH, PJB, IK, LED, BRL.
Funding Pfizer funded this work.
Competing interests GCN and BRL had support from Pfizer Inc for the
submitted work.
Patient consent Obtained.
Ethics approval National Research Ethics Service Committee London,
Hampstead, Northwick Park Hospital REC Centre (REC reference 12/LO/0579).
Provenance and peer review Not commissioned; externally peer reviewed.
Data sharing statement No additional data are available.
Open Access This is an Open Access article distributed in accordance with
the Creative Commons Attribution Non Commercial (CC BY-NC 4.0) license,
which permits others to distribute, remix, adapt, build upon this work non-
commercially, and license their derivative works on different terms, provided
the original work is properly cited and the use is non-commercial. See: http://
creativecommons.org/licenses/by-nc/4.0/
REFERENCES
1. Barnes PJ. Therapeutic approaches to asthma-chronic obstructive
pulmonary disease overlap syndromes. J Allergy Clin Immunol
2015;136:531–45.
2. Barnes PJ. Identifying molecular targets for new drug
development for chronic obstructive pulmonary disease: what
does the future hold? Semin Respir Crit Care Med
2015;36:508–22.
3. Rask-Andersen M, Zhang J, Fabbrò D, et al. Advances in kinase
targeting: current clinical use and clinical trials. Trends Pharmacol
Sci 2014;35:604–20.
4. Villarino AV, Kanno Y, Ferdinand JR, et al. Mechanisms of Jak/
STAT signaling in immunity and disease. In J Immunol
2015;194:21–7.
5. Di Stefano A, Caramori G, Capelli A, et al. STAT4 activation in
smokers and patients with chronic obstructive pulmonary disease.
Eur Respir J 2004;24:78–85.
6. Vakkila J, Nieminen U, Siitonen S, et al. A novel modification of a
flow cytometric assay of phosphorylated STAT1 in whole blood
monocytes for immunomonitoring of patients on IFN alpha regimen.
Scand J Immunol 2008;67:95–102.
7. Maródi L, Goda K, Palicz A, et al. Cytokine receptor signalling in
neonatal macrophages: defective STAT-1 phosphorylation in
response to stimulation with IFN-gamma. Clin Exp Immunol
2001;126:456–60.
8. Lundquist LM, Cole SW, Sikes ML. Efficacy and safety of tofacitinib
for treatment of rheumatoid arthritis. World J Orthop
2014;5:504–11.
9. Fenwick PS, Macedo P, Kilty IC, et al. Effect of JAK inhibitors on
release of CXCL9, CXCL10 and CXCL11 from human airway
epithelial cells. PLoS ONE 2015;10:e0128757.
10. Gadina M. Advances in kinase inhibition: treating rheumatic
diseases and beyond. Curr Opin Rheumatol 2014;26:237–43.
11. Holloway R, Nicholson G, Leaker B, et al. Detection of STAT1
phosphorylation in COPD sputum by flow cytometry. Eur Resp J
2013.
12. Quanjer PH, Tammeling GJ, Cotes JE, et al. Lung volumes and
forced ventilatory flows. Report Working Party Standardization of
Lung Function Tests, European Community for Steel and Coal.
Official Statement of the European Respiratory Society. Eur Respir J
Suppl 1993;16:5–40.
13. Efthimiadis A, Pizzichini MM, Pizzichini E, et al. Induced sputum cell
and fluid-phase indices of inflammation: comparison of treatment
Figure 4 Characteristics of within and between-patients’ variability. Shaded symbols show the median of the three
measurements, and the horizontal and vertical lines show the range of the outcome values observed at three visits. A 1:1 line is
added to facilitate the comparison of within and between-patients’ variability.
Nicholson GC, Holloway RA, Leaker BR, et al. BMJ Open Resp Res 2016;3:e000140. doi:10.1136/bmjresp-2016-000140 9
Open Access
group.bmj.comon June 28, 2016 - Published byhttp://bmjopenrespres.bmj.com/Downloaded from
10. with dithiothreitol vs phosphate-buffered saline. Eur Respir J
1997;10:1336–40.
14. Pizzichini E, Pizzichini MM, Efthimiadis A, et al. Indices of airway
inflammation in induced sputum: reproducibility and validity of cell
and fluid-phase measurements. Am J Respir Crit Care Med
1996;154:308–17.
15. Pizzichini E, Pizzichini MM, Efthimiadis A, et al. Measurement of
inflammatory indices in induced sputum: effects of selection of
sputum to minimize salivary contamination. Eur Respir J
1996;9:1174–80.
16. Changelian PS, Flanagan ME, Ball DJ, et al. Prevention of organ
allograft rejection by a specific Janus kinase 3 inhibitor. Science
2003;302:875–8.
17. Changelian PS, Moshinsky D, Kuhn CF, et al. The specificity of
JAK3 kinase inhibitors. Blood 2008;111:2155–7.
18. Dickens JA, Miller BE, Edwards LD, et al. COPD association and
repeatability of blood biomarkers in the ECLIPSE cohort. Respir Res
2011;12:146.
19. Kim DK, Cho MH, Hersh CP, et al. Genome-wide association
analysis of blood biomarkers in chronic obstructive pulmonary
disease. Am J Respir Crit Care Med 2012;186:1238–47.
20. Barnes PJ. The cytokine network in asthma and chronic obstructive
pulmonary disease. J Clin Invest 2008;118:3546–56.
21. Keatings VM, Collins PD, Scott DM, et al. Differences in
interleukin-8 and tumor necrosis factor-alpha in induced sputum
from patients with chronic obstructive pulmonary disease or asthma.
Am J Respir Crit Care Med 1996;153:530–4.
22. Di Stefano A, Capelli A, Lusuardi M, et al. Severity of airflow
limitation is associated with severity of airway
inflammation in smokers. Am J Respir Crit Care Med
1998;158:1277–85.
23. Barnes PJ. Immunology of asthma and chronic obstructive
pulmonary disease. Nat Rev Immunol 2008;8:183–92.
24. St-Laurent J, Turmel V, Boulet LP, et al. Alveolar macrophage
subpopulations in bronchoalveolar lavage and induced sputum of
asthmatic and control subjects. J Asthma 2009;46:1–8.
25. Traves SL, Culpitt SV, Russell RE, et al. Increased levels of the
chemokines GROalpha and MCP-1 in sputum samples from patients
with COPD. Thorax 2002;57:590–5.
26. Singh D, Edwards L, Tal-Singer R, et al. Sputum neutrophils as a
biomarker in COPD: findings from the ECLIPSE study. Respir Res
2010;11:77.
27. Vafadari R, Weimar W, Baan CC. Phosphospecific flow
cytometry for pharmacodynamic drug monitoring: analysis of
the JAK-STAT signaling pathway. Clin Chim Acta
2012;413:1398–405.
28. Brooks CR, van Dalen CJ, Hermans IF, et al. Identifying leukocyte
populations in fresh and cryopreserved sputum using flow cytometry.
Cytometry B Clin Cytom 2013;84:104–13.
29. Loppow D, Böttcher M, Gercken G, et al. Flow cytometric analysis of
the effect of dithiothreitol on leukocyte surface markers. Eur Respir J
2000;16:324–9.
30. Chana KK, Fenwick PS, Nicholson AG, et al. Identification of a
distinct glucocorticosteroid-insensitive pulmonary macrophage
phenotype in patients with chronic obstructive pulmonary disease.
J Allergy Clin Immunol 2014;133:207–216.e1–11.
31. Shapiro SD. Proteinases in chronic obstructive pulmonary disease.
Biochem Soc Trans 2002;30:98–102.
32. Culpitt SV, Rogers DF, Traves SL, et al. Sputum matrix
metalloproteases: comparison between chronic obstructive
pulmonary disease and asthma. Respir Med 2005;99:703–10.
33. Sköld CM, Hed J, Eklund A. Smoking cessation rapidly reduces cell
recovery in bronchoalveolar lavage fluid, while alveolar macrophage
fluorescence remains high. Chest 1992;101:989–95.
34. Pizzichini MM, Popov TA, Efthimiadis A, et al. Spontaneous and
induced sputum to measure indices of airway inflammation in
asthma. Am J Respir Crit Care Med 1996;154:866–9.
35. Tsoumakidou M, Tzanakis N, Siafakas NM. Induced sputum in the
investigation of airway inflammation of COPD. Respir Med
2003;97:863–71.
36. Bhowmik A, Seemungal TA, Sapsford RJ, et al. Comparison of
spontaneous and induced sputum for investigation of airway
inflammation in chronic obstructive pulmonary disease. Thorax
1998;53:953–6.
37. Barnes PJ, Chowdhury B, Kharitonov SA, et al. Pulmonary
biomarkers in chronic obstructive pulmonary disease. Am J Respir
Crit Care Med 2006;174:6–14.
38. Beeh KM, Beier J, Kornmann O, et al. Long-term repeatability of
induced sputum cells and inflammatory markers in stable,
moderately severe COPD. Chest 2003;123:778–83.
39. Barnes PJ. Mediators of chronic obstructive pulmonary disease.
Pharmacol Rev 2004;56:515–48.
40. Holz O, Khalilieh S, Ludwig-Sengpiel A, et al. SCH527123, a novel
CXCR2 antagonist, inhibits ozone-induced neutrophilia in healthy
subjects. Eur Respir J 2010;35:564–70.
41. Rennard SI, Dale DC, Donohue JF, et al. CXCR2 antagonist
MK-7123. A phase 2 proof-of-concept trial for chronic obstructive
pulmonary disease. Am J Respir Crit Care Med 2015;191:1001–11.
10 Nicholson GC, Holloway RA, Leaker BR, et al. BMJ Open Resp Res 2016;3:e000140. doi:10.1136/bmjresp-2016-000140
Open Access
group.bmj.comon June 28, 2016 - Published byhttp://bmjopenrespres.bmj.com/Downloaded from
11. COPD subjects
measure kinase inhibition in sputum from
A novel flow cytometric-based method to
Barnes and L E Donnelly
G C Nicholson, R A Holloway, B R Leaker, I Kilty, M Salganik, L Tan, P J
doi: 10.1136/bmjresp-2016-000140
2016 3:BMJ Open Resp Res
http://bmjopenrespres.bmj.com/content/3/1/e000140
Updated information and services can be found at:
These include:
References
#BIBLhttp://bmjopenrespres.bmj.com/content/3/1/e000140
This article cites 40 articles, 11 of which you can access for free at:
Open Access
http://creativecommons.org/licenses/by-nc/4.0/non-commercial. See:
provided the original work is properly cited and the use is
non-commercially, and license their derivative works on different terms,
permits others to distribute, remix, adapt, build upon this work
Commons Attribution Non Commercial (CC BY-NC 4.0) license, which
This is an Open Access article distributed in accordance with the Creative
service
Email alerting
box at the top right corner of the online article.
Receive free email alerts when new articles cite this article. Sign up in the
Notes
http://group.bmj.com/group/rights-licensing/permissions
To request permissions go to:
http://journals.bmj.com/cgi/reprintform
To order reprints go to:
http://group.bmj.com/subscribe/
To subscribe to BMJ go to:
group.bmj.comon June 28, 2016 - Published byhttp://bmjopenrespres.bmj.com/Downloaded from