2. could be better compared each other using tools able to dynami-
cally and asynchronously visualize multi-parametric geospatial
datasets. This suggests that the temporal dimension should have
the same importance as the other ones.
The explicit representation and analysis of spatiotemporal data
were first theorized by Langran and Chrisman (1988). Since the
beginning of the 1990s, several efforts have been made to build
geographic databases and platforms (Abraham and Roddick, 1999;
Langran, 1993; Peuquet and Duan, 1995; Rasinmaki, 2003; Galton,
2004; Pelekis et al., 2004; Zhou et al., 2004; Le, 2005; Peuquet,
2005; Zhu et al., 2008; Fan et al., 2010) specifically devoted to
space-time data management and analysis. Different approaches
were proposed and various data models and platforms were
developed, also supported by technological advancements
(Maceachren et al., 1999; Tryfona and Jensen, 1999; Shi and Zhang,
2000; Wang et al., 2005; Lee et al., 2006; Shaw et al., 2008; Shaw
and Yu, 2009; Vivar and Ferreira, 2009; Pultar et al., 2010;
Sadahiro, 2002; Sugam et al., 2013; Gebbert and Pebesma, 2014).
At present spatiotemporal correlation analysis and time-varying
signal visualization are typically performed using geospatial data
management systems like Geographic Information System (GIS)
and their derivatives that allow users to overlay spatial data and to
manage time as an attribute of the spatial reference (Pelekis et al.,
2004). This kind of architecture, however, does not incorporate the
temporal indexing into the GIS itself (Peuquet and Duan, 1995;
Peuquet, 2001; Galton, 2004) and the representation of asynchro-
nous datasets over time does not take into account the full di-
mensions of a dataset and its continuous or discrete variations.
Consequently, customized systems have to be designed and
developed in each different application to properly manage data in
the space-time domain (Le, 2012). Present geospatial data man-
agement systems permit users to visualize spatial, time-dependent
signals thanks to specific functions, but the time variations of such
signals are visualized overlapping one another, with the conse-
quence that it is impossible to move a specific signal over time and
visualize its time variations while keeping the others fixed. The 4
Dimensions Environmental ObServation platform (4DEOS), a
Client-Broker-Server (CBS)1
platform, here presented is able to
visualize together several asynchronous spatiotemporal data/
products provided by servers and queryable by authorized users.
The innovative aspect of 4DEOS is quite evident, giving the platform
the possibility of visualizing spatial, time-dependent signals in a
simultaneous or asynchronous mode so that the study of their
temporal evolution may be more easily carried out. Users can move
one or more signals while holding others fixed in the time domain.
In the following paragraphs we describe the detailed 4DEOS
architecture and its utilization to study a particular application: the
detection of earthquake precursor signals, developed in the
framework of the EU-FP7 Project PRE-EARTHQUAKES (Processing
Russian and European EARTH Observations for earthQUAKE pre-
cursors Studies, http://www.pre-earthquakes.org).
2. The 4DEOS architecture
The 4DEOS platform was designed and developed with the aim
of offering clients a single entry-point to visualize heterogeneous
data (e.g., maps, vertical profiles, punctual time series related to
different observation times and/or geographic areas) shared by
different data providers. 4DEOS does not use a standard client/
server architecture, where a client, needing a service from a
particular server, sends a request to an appropriate server and the
server performs the requested service, returning results to the
client. This client/server architecture works fine only for small
systems (i.e., when clients interact with a small set of servers -
Adler, 1995), while, in growing and evolving systems like 4DEOS,
individual clients need to be constantly updated to take into ac-
count the addition of new servers and services (Adebayo et al.,
1997).
4DEOS is based on a service-oriented CBS architecture intro-
ducing a middle component between clients and servers, called
broker, which receives requests from clients, identifies appropriate
remote servers, forwards requests to servers and transmits results
to clients. It maintains centralized information (e.g., data available
in each remote server, authorized clients as well as data that can be
requested by each of them) so that clients need to know nothing
about the existing servers, just how to interact with the broker
(Fig. 1). Each 4DEOS server node has the task of producing and (if
necessary) converting with specific converter tools data/products
from a particular data provider format to a standard one (e.g., shape
file format). This task is typically performed by the broker
component, whereas in the 4DEOS architecture this role is assigned
to the servers, because the data sharing process is made in a context
where data owners (server nodes) are generally reluctant to an
actual transfer of files, especially when their data have an added
value or are very expensive to acquire and maintain. In the 4DEOS
architecture owners expose their data/products via web services,
following Open Geospatial Consortium (OGC) standards (http://
www.opengeospatial.org; Open Geospatial Consortium, 2005,
2006, 2008), which can be queried only by the broker compo-
nent. In particular, each server node is configured with a set of open
source software:
Converter tool, different and specific for each single node. It is
written in Java and performs the conversion of data/products
from the provider characteristic format to a standardized vector
format (i.e., shape file);
Ingestor tool, based on GeoBatch Java software (http://geobatch.
geo-solutions.it). It stores shape files in a PostgreSQL database
with POSTGIS extension (http://postgis.refractions.net/) and
publishes data/products as OGC WMS (Web Map Service) ser-
vices in GeoServer (http://geoserver.org/).
Besides passing the requests from clients to servers, the broker
component manages the security policy that, in order to support
and encourage data sharing, was deliberately based on the concept
that “the more data you share, the more data you obtain”. This
principle, here abbreviated MOMO (More Offer More Obtain), was
introduced to provide data access according to each provider's
contribution; for example, if a data provider shares data relating to
a specific geographic area, he will be able to view only the data
shared by other providers that refer to the same geographic area.
This concept is implemented in the broker by using 52 North Web
Security Service (WSS, http://52north.org/) to define multiple
levels of data access authorizations. Thanks to XML configuration
files, the broker retains information about i) the data/products
shared by each server node; ii) the clients enabled to access the
4DEOS platform and iii) the data/product use restrictions con-
cerning each client (for instance geographic areas).
It is possible to add a new server node to the 4DEOS system at
any time provided that the system administrator deems the data/
products useful for a specific application. In this case, the broker
administrator adds to the list of available data the WMS services
provided by the new server node and, each 4DEOS Client can
visualize the new data/products at the next access (if enabled). In
1
The Client-Broker-Server pattern architecture allows clients to access remote
servers through the broker, a “middle” component, whose responsibility is the
transmission of requests from clients to servers, as well as the transmission of
responses back to the client.
R. Paciello et al. / Environmental Modelling Software 77 (2016) 50e62 51
3. fact, each time a 4DEOS Client logs on to the system it requests the
updated list of data available to the broker.
The 4DEOS Client is the innovative component of this archi-
tecture. A detailed description of how it works is given in the
following paragraphs.
3. The 4DEOS client
The 4DEOS Client is a new tool for both the timely access and the
easy visualization and integration of geospatial products having
different space-time dimensions, such as:
punctual data such as data acquired in a geographical location
(x,y) representing the variability of a considered signal at a
specific depth/altitude (z) and its evolution over time (t), like the
measures from meteorological weather stations;
linear profiles such as data acquired along a linear pattern (e.g.,
sounding sensors/satellite tracks, geophysical surveys), repre-
senting the evolution over time (t) of a considered signal along a
line, like the electrical resistivity profiles or tomographies;
areal data such as data acquired/retrieved by satellite sensors
and/or spatial data obtained after processing ground data (x,y)
or vertical sections along a transect on the ground (x,z) or (y,z),
like the land cover maps.
This paper focuses on the 4DEOS Client as a tool to allow users
investigations of asynchronous observations over time. The other
product capabilities are here intentionally omitted. The software
has an innovative feature enabling users to move over time and to
visualize signals in simultaneous or asynchronous way, with the
possibility, in this latter case, of freezing time for some signals to
focus on others to study their temporal evolution better. Such
4DEOS Client functionality is achieved through a combined use of
graphic objects (i.e., sliding time bars) available for any data/
product to be investigated, which allow the user to disable the
“time management” so to freeze in the time domain some signals
that continue to be displayed on the map. This feature is not sup-
ported in any other existing GIS software in which disabling the
time management feature for certain data/products implies that
they are no longer displayed on the map.
The investigation of data/products carried out by disabling the
time management feature is an operation simplified by the possi-
bility of displaying all signals in a double mode (i.e., in a single or in
a dedicated window). This characteristic offered by the 4DEOS
Client is not available in any other GIS software and will be
described in detail in Sections 3.1 and 3.2.
3.1. Implementation details
The 4DEOS Client is a Java desktop Rich Client Application built
on Eclipse “Rich Client Platform” (RCP, http://www.eclipse.org) as a
customized extension of the uDig (http://udig.refractions.net) GIS
software core. Both Eclipse RCP and uDig are open source and
widely popular tools which enable customization. They are also
comprehensive, mature, and maintained. They already include
many features necessary for the purpose of this work and, conse-
quently, represented our final choice for the 4DEOS Client
development.
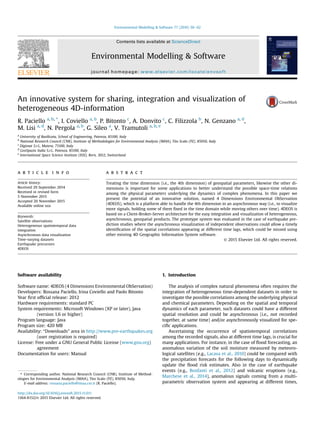
Fig. 1. 4DEOS is based on a three-tier distributed architecture: Client-Broker-Server. The server side consists of nodes which are provided with a Converter tool, different and
specific for each node, performing the conversion of data/products from the provider characteristic format to a standardized vector format (i.e., shape file), and with an Ingestor tool
storing files in a database and exposing them as Web Map Service (WMS). The broker side consists of one node that receives requests from clients, identifies appropriate remote
servers, forwards requests to servers and transmits results to clients; furthermore it manages security and data access privileges. The client side refers to a tool that performs
visualization of geospatial products shared by different data providers.
R. Paciello et al. / Environmental Modelling Software 77 (2016) 50e6252
4. Like the uDig software, the 4DEOS Client is built around the
concept of the plug-ins2
at the base of Eclipse RCP. A set of new
dedicated plug-ins were developed to achieve all planned specifi-
cations. Three plug-ins have been developed in particular: one for
the time management, another for the graphical object construc-
tion serving the same purpose, and the last one for searching
available data/products. Moreover, time management was also
added to the plug-in that supports WMS requests (already included
in the uDig core software).
The 4DEOS Client was fully developed with open software and is
widely based on libraries of proven reliability that support stan-
dards able to ensure interoperability between components. It uses:
i) Java Topology Suite (JTS, http://www.vividsolutions.com/jts/
JTSHome.htm), which provides an implementation of the
Simple Feature for Structured Query Language (SQL);
ii) GeoAPI (http://www.geoapi.org/), a common Java interface
for geospatial concepts based on OGC standards;
iii) GeoTools (http://www.geotools.org/), a Lesser General Public
License (LGPL) library provided by the Open Source Geo-
spatial Foundation (OSGF, http://www.osgeo.org/) for com-
mon GIS functionality.
The 4DEOS Client exploits three important extensions of the
default Java Runtime Environment (JRE): Java Advanced Imaging
(JAI, http://www.oracle.com/technetwork/java/javase/tech/jai-
142803.html), about the image processing tasks; Java ImageIO
that provides raw raster format and ImageIO-EXT (https://java.net/
projects/imageio-ext), to manage additional geospatial raster
formats.
3.2. Functionality details
A wizard (i.e., a graphic user interface consisting of a sequence of
dialog boxes) guides the user through a series of well-defined steps
from the selection of a specific place and time interval to the
visualization of the list of available data/products returned by the
broker. Selected products can be then displayed on the map
choosing between two distinct data visualization modes:
all data/products are visualized overlapped in a single window
(Fig. 2);
data/products are displayed in a dedicated window (i.e., one
window for each product, Fig. 3).
The second visualization mode should be preferred when the
number of areal data (maps) to be superimposed is greater than
three that is when the large number of data does not allow the user
to appropriately appreciate data content.
Each graphic object (the sliding time bar indicated by the red
circles with number 1 in Figs. 2e3) allows the user to follow the
temporal evolution of selected signals. In this way, each map
related to each single signal presents a static image that can be
individually moved through time (in forward or reverse) by clicking
on its time bar as this release does not support the animation of
maps.
The second way to perform signal visualization in the temporal
domain is another innovative feature of the 4DEOS Client, which
has not been implemented in any traditional GIS software so far.
Thanks to this innovative solution, the user can perform a visual
analysis in a completely new manner (i.e., fixing the view of
products containing interesting signals while moving other signals
over time). This way it is possible to make a visual comparison
among variables taken at different time points within established
space-time constraints.
In addition to that, a “global time bar” (see green circle with
number 2 in Figs. 2e3) allows users to visualize the temporal
evolution of all signals simultaneously. Date and time related to the
products shown in the maps are always visualized over the (local
and global) bars by the current time label.
Figs. 2 and 3 give an example of data visualization with the
4DEOS Client over a long period of time (about from August 2007 to
August 2014). The pictures show the integration of four
parameters:
1. Plasma frequency (GRACE/CHAMP);
2. GPS TEC variability index punctual time series;
3. Electrons density (Formosat-3/COSMIC);
4. TIR map (MSG/SEVIRI satellite).
Parameters 1 and 4 are “fixed” at two different time instants
where it is possible to note some interesting signals, while pa-
rameters 2 and 3 are not fixed and, consequently, move when the
global time bar moves. Note that to fix a signal, the graphic object
placed in its local time bar (the violet circles in Figs. 2e3) has to be
unchecked and that if a map is “fixed” it will not change although
one moves along the global time bar.
Differently from other traditional software (i.e., ArcGIS 10, QGIS
2.0.1), when the user moves along the time axis it is not required to
select a fixed time stamp because the bar will move automatically
to the next available date and all (not fixed) signals will be auto-
matically updated at their last available date within a time interval
that can be configured for each signal. It means that for each
selected signal there will always be at least one recurrence dis-
played on the map.
Choosing the right fixed time stamp is important to work easily
with a software that offers time management capabilities using this
approach; it is another peculiar aspect of the 4DEOS Client. With a
traditional GIS software, if the user chooses a “confined” fixed time
stamp (such as few minutes or seconds), he will have to click
several times along the timeline before having the data/products
available at a wide temporal interval (i.e., at a distance of weeks or
months) displayed. Conversely, if the user chooses a “wide” fixed
time stamp, a traditional GIS software will cluster a lot of data/
products referring to a close temporal distance into a single view,
with the consequence that too many data/products are displayed
on the map. The 4DEOS Client solves this problem since it does not
require a fixed time stamp for the sliding time bar, and it allows the
user to automatically visualize the temporal evolution moving to
the next available date.
The 4DEOS Client graphic interface was designed to be user-
friendly so to facilitate visual cross-correlations among signals
with different temporal dynamics. In our approach, the time model
implemented by the 4DEOS Client follows the discrete model
(Frank, 1998), including time instants that are unevenly spaced and
time intervals that can overlap or contain time instants.
The whole time management was implemented involving all
three components of the 4DEOS platform. On the server side, data/
products (which are available at different nodes) are appropriately
configured to support the time dimension (by enabling the “TIME
DIMENSION00 on the GeoServer and choosing the field date for each
layer). On the broker side, a specific web service that, at each 4DEOS
Client access, requests to all server nodes a date list of their shared
data/products was developed. On the client side, new plug-ins (as
required by Eclipse RCP) were developed in order to:2
A plug-in is a software component that adds a specific feature to an existing
software application.
R. Paciello et al. / Environmental Modelling Software 77 (2016) 50e62 53
5. Fig. 2. 4DEOS Client view mode: visualization of several signals overlapped in a single view. Close to the map there are as many local time bars as the number of signals (1). In (2) there is a global time bar allowing the user to follow the
temporal evolution of all signals. The violet circles indicate the graphic object that fix a signal (if it is unchecked the map is “fixed” and it will not be change although one moves along the global time bar). (For interpretation of the
references to colour in this figure legend, the reader is referred to the web version of this article.)
R.Pacielloetal./EnvironmentalModellingSoftware77(2016)50e6254
6. Fig. 3. 4DEOS Client view mode: visualization of each signal in a dedicated window. Below each map a local time bar allows the user to follow the temporal evolution of the signal (1). In (2) a global time bar allows the user to follow the
temporal evolution of all signals together. The violet circles indicate the graphic object that fix a signal (if it is unchecked the map is “fixed” and it will not be change although one moves along the global time bar). (For interpretation of
the references to colour in this figure legend, the reader is referred to the web version of this article.)
R.Pacielloetal./EnvironmentalModellingSoftware77(2016)50e6255
7. include the TIME attribute into WMS requests to display on the
map data/products referring to a specific time interval;
create the sliding time bars: starting from the date list (related
to all available data/products) returned by the broker (by means
of the web service), the software checks those falling within the
period of time chosen by the user in the search phase and in-
cludes them into the global time bar; only the dates of data/
products will be used to build each single local time bar.
4. 4DEOS platform application: a test case for the study of
earthquake precursors
The 4DEOS system's potential was evaluated in the case of
earthquake prediction studies where the possibility of integrating
observations of different parameters is expected to strongly
improve the reliability of short-term earthquake forecasts at pre-
sent mostly based on the analysis of foreshocks sequences.
Pre-seismic anomalies of different parameters (such as seis-
micity, electric and magnetic fields, gas emissions, surface de-
formations, temperature changes, etc.) were reported to occur at
different time lags before an earthquake occurrence. One of the first
studies on this topic, Scholz et al. (1973) made a distinction be-
tween the short-term precursors which precede an earthquake
from a few hours to days and the long-term precursors, which
precede an earthquake from months to years. In a more recent
paper supported by increased scientific literature, Cicerone et al.
(2009, and references therein) summarized the results obtained
in more than thirty years of research and reported examples of
earthquake precursors occurring well in advance of the time of an
earthquake. This is the case, for instance, of the variations of
ionospheric ULF3
and VLF4
emissions (measured by 19 Intercosmos
satellites) detected from 8 h before up to 3 h after an earthquake
occurrence, or the surface deformations measured from months to
days before an earthquake.
An asynchronous mode of comparison is consequently needed
to fully appreciate the advantage of integrating independent pa-
rameters. Having such a specific capability the 4DEOS platform was
used as a common integration and visualization platform in the
framework of the PRE-EARTHQUAKES project, the first European
project devoted to investigating the potential of a multi-parametric
approach to short-term earthquake forecast. Most of the PRE-
EARTHQUAKES research activities was devoted to the real-time
comparison and integration of parameters having not only
different space/time resolution and temporal dynamics (i.e., het-
erogeneous time-dependent datasets) but also showing different
time relations to the time of earthquake occurrence.
The 4DEOS potential was exploited both in the learning phase of
the project - focused on the study of the seismic events occurred in
the past in three selected testing areas (Italy, Turkey and Sakhalin)
e and in the experimental phase of the project, named PRIME (Pre-
earthquakes Real-time Integration and Monitoring Experiment),
carried out over selected areas (Italy, Greece, and Turkey for
Europe; Kamchatka, Sakhalin, and Japan for Asia) to perform an
actual short-term earthquake prediction by means of a real-time
integration and analysis of independent observations. About 5000
files related to 18 different data/parameters (11 are areal data, 2
linear profiles, 5 punctual data) acquired from March 1, 2007 to
December 31, 2012 were shared, compared, and integrated.
Considering the specific case of the Abruzzo earthquake (April 6,
2009, Mw 6.3), the 4DEOS platform was used to compare different
chemicalephysical parameters (measured by ground and satellite
systems) in order to identify possible spatial/temporal relations
among their (even asynchronously occurring) anomalies and the
earthquake occurrence. The parameters shared by providers with
the 4DEOS contain information about the measures, in particular if
they are anomalous or not and a legend containing all details for
each visualized parameter is displayed over the map (i.e., Fig. 4).
Table 1 shows an overview of all measured (ground and satellite
based) parameters for the case of the Abruzzo earthquake. For each
of them, product features (e.g., space-time resolution) and time lag
(here reported in terms of number of days) of the observed
anomalous value (red table cells in accord with above) with respect
to the earthquake occurrence (last column in the table) are
reported.
Fig. 4 shows a screenshot of the 4DEOS Client single view mode
where the independent data/products provided by the project
partners for the Italian testing area are reported. Such data were
visualized in the 4DEOS Client and analyzed in the temporal
domain through the temporal (global and local) bars. To facilitate
interpretation, data/products containing anomalous occurrences of
the represented parameter (identified on the basis of specific data
analysis methodologies) are represented by a red symbol (for
punctual and linear features) or contoured by a red line (for areal
data). Looking at Fig. 4, it is possible to note that the thermal
anomaly maps obtained by MSG/SEVIRI satellite data (Genzano
et al., 2009) on March 30, 2009 (i.e., 7 days before the earth-
quake) could be visualized together with the other anomalous
signals (like, for example, the vertical Total Electron Content
measured by GPS17
receivers; see PRE-EQ D.10_2, 2013) which
occurred up to few hours before the Abruzzo earthquake.
Figs. 5 and 6 show two examples of an earthquake forecast done
using 4DEOS during the real-time project phase (PRIME). The first
case (Fig. 5) is related to the Kahramanmaras earthquake (M~5) on
July 22, 2012 and represents the classical example of superimpo-
sition (achievable also by using other GIS systems) of a temporally
variable layer (TIR anomaly maps) over a static one reporting
geographic references and significant (temporally stable) geotec-
tonic settings (mostly faults). In this case, the thermal anomalies
observed since July 18 up to July 20, 2012 in the Eastern Turkey
increase their significance because they appear just close to the
tectonic lineaments (dashed green line superimposed on TIR
anomalies) of the epicenter area a few days before the event.
In the second case (Fig. 6), the importance of the 4DEOS capa-
bility to asynchronously visualize multi-parametric geospatial ob-
servations is more clearly highlighted. The evident correlation
between TIR anomalies (appearing in the Aegean Sea just a few
days before the earthquake of magnitude 5.7 occurred on August
29, 2014) and the increase in seismicity (observed exactly in the
same area but starting in a different day) was fully appreciated only
thanks to the 4DEOS visualization system that allows an asyn-
chronous comparison between independent geospatial data.
In the framework of the PRE-EARTHQUAKES project the 4DEOS
platform thus proved to be a quite important tool to study earth-
quake preparation phases. Thanks to this platform, it was possible:
to visually analyze asynchronous signals, simultaneously or
individually. Moving in the space-time domain it was possible to
better understand the relationship between different parame-
ters and their link with the earthquake occurrence, both in an a-
posteriori analysis (e.g., seismic events occurred in the past) and
in a real-time monitoring phase (PRIME);
3
ULF is for Ultra Low Frequency.
4
VLF is for Very Low Frequency. 17
Global Positioning System.
R. Paciello et al. / Environmental Modelling Software 77 (2016) 50e6256
8. Fig. 4. A screenshot of the 4DEOS Client, where some products used to study the preparatory phases of the Abruzzo seismic event (April 6, 2009, Mw 6.3) are shown. Different products, based both on satellite technologies and ground
stations, are superimposed. Note that all the punctual and linear geographical features are linked to the graphical representation of the (space or time) variations of a considered variable, which can be displayed by clicking on them
(down left graphic). Note that parameters having a punctual or linear representation are indicated with a red symbol (like plasma frequency in the picture) in case of the presence of anomalies (in blue if in normal conditions, like for
GPS-TEC). In the same way, TIR maps containing TIR anomalies are contoured in red to indicate this circumstance (see text). (For interpretation of the references to colour in this figure legend, the reader is referred to the web version of
this article.)
R.Pacielloetal./EnvironmentalModellingSoftware77(2016)50e6257
9. Table 1
Products shared within the 4DEOS platform for the Abruzzo (April 6, 2009, Mw 6.3) test case during PRE-EARTHQUAKES among the project partners.
10. Fig. 5. Use of the 4DEOS Client in a classic mode: the temporal local sliding bar related to thermal anomaly (TIR) maps is used to compare TIR map evolution over a static layer
reporting faults and tectonic lineaments (solid black and dotted green lines) of the eastern part of Turkey. TIR anomalies detected just close to main faults (between 18 and 20 July,
2012) were used to correctly predict (PRE-EQ D.10_2, 2013) the Kahramanmaras earthquake of magnitude 5 which occurred a few days later (on July 22, 2012). Note that an
additional dynamic layer, which refers to earthquake epicenters and magnitudes, is visualized at the time of the Kahramanmaras earthquake (represented by a green star in all
screenshots). (For interpretation of the references to colour in this figure legend, the reader is referred to the web version of this article.)
11. Fig. 6. Use of the 4DEOS Client in an actual asynchronous mode: the temporal local slide bars related to TIR maps and to earthquake occurrences are asynchronously adjusted in order to enhance the correspondence between spatial
distribution of foreshocks (22, 23, and 24 August 2014) and TIR anomalies (25 August 2014) preceding the main shock (green circle) which occurred a few days later (August 29, 2014) just in the middle of the area of “convergence” in
the Aegean Sea. It is one example of a successful earthquake prediction allowed by the use of the 4DEOS functionalities, among several cases tested during the PRIME experiment. (For interpretation of the references to colour in this
figure legend, the reader is referred to the web version of this article.)
R.Pacielloetal./EnvironmentalModellingSoftware77(2016)50e6260
12. to carry out multi-parametric visual analyses using several
datasets, which were composed of products having heteroge-
neous (spatial and temporal) features and processed using
different methodologies. Results were achieved without the
need to transfer data among the PRE-EARTHQUAKES partners as
well as adopting several levels of authorization (restrictions on
geographic areas) and security policies following the MOMO
concept.
5. Summary and conclusions
The purpose of this paper was to describe an innovative solution
(4DEOS e 4 Dimensions Environmental ObServation) for the easy
management and visualization of heterogeneous and asynchro-
nous geospatial datasets.
Thanks to the possibility of setting one or more geospatial time-
dependent parameters at a given time, while moving others
through time, the 4DEOS platform is able to manage the temporal
dimension in an asynchronous way, differently from any other GIS
software. In particular, the proposed solution allows users to
manage the temporal dimension (t) of geospatial (x,y,z) parameters
in order to better understand possible space-time relations among
independent geospatial datasets.
The 4DEOS platform consists of components that are fully based
on open source software and it is based on a service-oriented
Client-Broker-Server architecture, where data shared by providers
(through WMS services, according to OGC standards) are queryable
by clients without any need to transfer files, thus preserving data
provider ownership.
We presented an example of the use of the developed system for
the case of earthquake forecast studies. The 4DEOS potentiality was
verified during the EC-FP7 PRE-EARTHQUAKES project activities,
where different physical and chemical observations provided by
ground and satellite techniques were asynchronously compared to
improve the reliability of a multi-parametric short-term earth-
quake forecast system.
The 4DEOS system was used in this context as a common inte-
gration and visualization platform and it proved its crucial ability to
manage the temporal dimension in an asynchronous way allowing
a successful short term forecast of several earthquakes both in the
off-line (simulating multi-parametric integration considering
events occurred in the past) and real-time (operational) mode. The
importance of the adoption of the MOMO principle within 4DEOS
was also demonstrated as the system encouraged wide data
sharing and strict collaboration among different partners, including
institutions not usually willing to share expensive data or added
value products for free.
The 4DEOS is currently being used for the real-time monitoring
of Italy, Greece, Turkey, and Sakhalin. Thanks to its capability of
displaying and managing heterogeneous and asynchronous data,
also at a large scale, the 4DEOS was included among the demon-
strators supporting one of the Priority Actions (EQuOS, EarthQuake
Observing System) of GEO (Group on Earth Observations, http://
www.earthobservations.org) 2012e2015 Work Plan (GEO, 2014).
Acknowledgments
Author contributions: Paciello R., Coviello I. and Bitonto P.
designed and developed the 4DEOS platform; Donvito A. and Tra-
mutoli V. dealt with the requirements analysis, the functionality
analysis and the solutions choice; Filizzola C. managed the system
implementation for geostationary satellite data; Genzano N. and
Lisi M. handled the ground data integration; Pergola N. dealt with
the system implementation for polar satellite data and Sileo G.
contributed to write this manuscript.
The research leading to these results received funding from the
European Union Seventh Framework Programme (FP7/2007e2013)
under grant agreement n 263502 e PRE-EARTHQUAKES project:
Processing Russian and European EARTH observations for earth-
QUAKE precursors Studies. The document reflects only the author's
views and the European Union is not liable for any use that may be
made of the information contained herein.
The research leading to these results was partly funded also by
Basilicata Region through the ERDF/NIBS (European Regional
Developing Fund/Networking and Internationalization of Basilicata
Space technologies) project and International Space Science Insti-
tute (BerneSwitzerland).
References
Abraham, T., Roddick, J.F., 1999. Survey of spatio-temporal databases. Geo-
Informatica 3 (1), 61e99.
Adebayo, O., Neilson, J., Petriu, D., 1997. A performance study of client-broker-server
systems. In: Proceeding CASCON '97 Proceedings of the 1997 Conference of the
Centre for Advanced Studies on Collaborative Research, pp. 1e15.
Adler, R., 1995. Distributed coordination models for client/server computing. IEEE
Comput. 14e22.
Bonfanti, P., Genzano, N., Heinicke, J., Italiano, F., Martinelli, G., Pergola, N.,
Telesca, L., Tramutoli, V., 2012. Evidence of CO2-gas emission variations in the
central Apennines (Italy) during the L'Aquila seismic sequence (March-April
2009). Boll. Geofis. Teor. Appl. 53 (1), 147e168. http://dx.doi.org/10.4430/
bgta0043.
Cicerone, R.D., Ebel, J.E., Britton, J., 2009. A systematic compilation of earthquake
precursors. Tectonophysics 476, 371e396. http://dx.doi.org/10.1016/
j.tecto.2009.06.008.
Fan, Y.T., Yang, J.Y., Zhu, D.H., Wei, K.L., 2010. A time-based integration method of
spatio-temporal data at spatial database level. Math. Comput. Model. 51 (2010),
1286e1292.
Frank, A.U., 1998. Different types of “Time” in GIS. In: Egenhofer, M.J., Golledge, R.G.
(Eds.), Spatial and Temporal Reasoning in Geographic Information Systems.
Oxford University Press, New York/Oxford, pp. 40e62.
Galton, A., 2004. Fields and objects in space, time, and space-time. Spat. Cognit.
Comput. 4 (1), 39e68. http://dx.doi.org/10.1207/s15427633scc0401_4.
Gebbert, S., Pebesma, E., 2014. TGRASS: a temporal GIS for field based environ-
mental modeling. Environ. Model. Softw. 53, 1e12. http://dx.doi.org/10.1016/
j.envsoft.2013.11.001.
Genzano, N., Aliano, C., Corrado, R., Filizzola, C., Lisi, M., Mazzeo, G., Paciello, R.,
Pergola, N., Tramutoli, V., 2009. RST analysis of MSG-SEVIRI TIR radiances at the
time of the Abruzzo 6 April 2009 earthquake. Nat. Hazards Earth Syst. Sci. 9,
2073e2084.
GEO, 2014. GEO 2012-2015 Work Plan, pp. 1e86. Available. http://www.
earthobservations.org/documents/work%20plan/geo_wp1215_rev4_141127.pdf.
Lacava, T., Brocca, L., Calice, G., Melone, F., Moramarco, T., Pergola, N., Tramutoli, V.,
2010. Soil moisture variations monitoring by AMSU-based soil wetness indices:
a long-term inter-comparison with ground measurements. Remote Sens. En-
viron. 114, 2317e2325. http://dx.doi.org/10.1016/j.rse.2010.05.008.
Langran, G., 1993. Issues of implementing a spatiotemporal system. Int. J. Geogr. Inf.
Syst. 7 (4), 305e314.
Langran, G., Chrisman, N.R., 1988. A framework for temporal geographic informa-
tion. Cartographica 25 (3), 1e14.
Le, Y., 2005. A prototype temporal gis for multiple spatio-temporal representations.
Cartogr. Geogr. Inf. Sci. 32 (4), 315e329. http://dx.doi.org/10.1559/
152304005775194737.
Le, Y., 2012. Challenges in data integration for spatiotemporal analysis. J. Map Geogr.
Libr. Adv. Geospat. Inf. Collect. Arch. 8 (1), 58e67. http://dx.doi.org/10.1080/
15420353.2011.622457.
Lee, E., Moon, M., Gunst, R.F., 2006. A spatiotemporal model for pollutant concen-
trations. Commun. Stat. Theory Methods 35 (3), 489e497. http://dx.doi.org/
10.1080/03610920500476465.
Maceachren, A.M., Wachowicz, M., Edsall, R., Haug, D., Masters, R., 1999. Con-
structing knowledge from multivariate spatiotemporal data: integrating
geographical visualization with knowledge discovery in database methods. Int.
J. Geogr. Inf. Sci. 13 (4), 311e334. http://dx.doi.org/10.1080/136588199241229.
Marchese, F., Falconieri, A., Pergola, N., Tramutoli, V., 2014. A retrospective analysis
of the Shinmoedake (Japan) eruption of 26e27 January 2011 by means of
Japanese geostationary satellite data. J. Volcanol. Geotherm. Res. 269, 1e13.
http://dx.doi.org/10.1016/j.jvolgeores.2013.10.011.
Open Geospatial Consortium, 2006. OpenGIS Web Map Server Implementation
Specification, p. 85. OGC, 06-042.
Open Geospatial Consortium, 2008. Web Coverage Service (WCS) Implementation
Specification, p. 119. OGC, 07-067r5.
Open Geospatial Consortium, 2005. Web Feature Service Implementation Specifi-
cation, p. 112. OGC, 04-094.
Pelekis, N., Theodoulidis, B., Kopanakis, I., Theodoridis, Y., 2004. Literature review of
R. Paciello et al. / Environmental Modelling Software 77 (2016) 50e62 61
13. spatio-temporal database models. Knowl. Eng. Rev. 19 (3), 235e274. http://
dx.doi.org/10.1017/S026988890400013X.
Peuquet, D.J., 2001. Making space for time: issues in space-time data representation.
GeoInformatica 5 (1), 11e32.
Peuquet, D.J., 2005. Theme section on advances in spatio-temporal analysis and
representation. ISPRS J. Photogramm. Remote Sens. 60, 1e2.
Peuquet, D.J., Duan, N., 1995. An event-based spatiotemporal data model (ESTDM)
for temporal analysis of geographical data. Int. J. Geogr. Inf. Syst. 9 (1), 7e24.
PRE-EQ D10_2, 2013. PRE-earthquakes Final Project Report. Available on line in
“Downloads” area of. http://www.pre-earthquakes.org/.
Pultar, E., Cova, T.J., Yuan, M., Goodchild, M.F., 2010. EDGIS: a dynamic GIS based on
space time points. Int. J. Geogr. Inf. Sci. 24 (3), 329e346.
Rasinmaki, J., 2003. Modelling spatio-temporal environmental data. Environ.
Model. Softw. 18, 877e886.
Sadahiro, Y., 2002. A graphical method for exploring spatiotemporal point distri-
butions. Cartogr. Geogr. Inf. Sci. 29 (2), 67e84. http://dx.doi.org/10.1559/
152304002782053332.
Scholz, C.H., Sykes, L.R., Aggarwal, Y.P., 1973. Earthquake prediction: a physical basis.
Science 181, 803e810. http://dx.doi.org/10.1126/science.181.4102.803.
Shaw, S., Yu, H., 2009. A GIS-based time-geographic approach of studying individual
activities and interactions in a hybrid physical-virtual space. J. Transp. Geogr. 17,
141e149. http://dx.doi.org/10.1016/j.jtrangeo.2008.11.012.
Shaw, S., Yu, H., Bombom, L.S., 2008. A space-time GIS approach to exploring large
individual-based spatiotemporal datasets. Trans. GIS 12 (4), 425e441.
Shi, W., Zhang, M., 2000. Development of a GIS data model with spatial, temporal
and attribute components based on object-oriented approach. Geo-spat. Inf. Sci.
3 (l), 17e23.
Sugam, S., Shashi, G., Udoyara Sunday, T., 2013. Parametric database approach
integration for handling temporal data in GIS. Geo-spat. Inf. Sci. 16 (2), 91e99.
http://dx.doi.org/10.1080/10095020.2013.772807.
Tryfona, N., Jensen, C.S., 1999. Conceptual data modeling for spatiotemporal ap-
plications. GeoInformatica 3 (3), 245e268.
Vivar, J.C., Ferreira, M.A.R., 2009. spatiotemporal models for gaussian areal data.
J. Comput. Graph. Stat. 18 (3), 658e674. http://dx.doi.org/10.1198/
jcgs.2009.07076.
Wang, S., Nakayama, K., Kobayashi, Y., Maekawa, M., 2005. An event-based
spatiotemporal approach. ECTI Trans. Comput. Inf. Theory 1 (1), 15e23.
Zhou, X., Chen, J., Jiang, J., Zhu, J., Li, Z., 2004. Event-based incremental updating of
spatio-temporal database. J. Cent. South Univ. Technol. 11 (No. 2), 192e198.
Zhu, H., Huang, Q., Guo, J., Zhong, S., 2008. An enhanced approach to representing
complex spatio-temporal data in GIS. In: 2008 International Workshop on
Education Technology and Training 2008 International Workshop on Geo-
science and Remote Sensing, pp. 167e170. http://dx.doi.org/10.1109/
ETTandGRS.2008.164.
URL References
http://54north.org/.
http://geobatch.geo-solutions.it.
http://geoserver.org.
http://postgis.refractions.net/.
http://udig.refractions.net.
http://www.eclipse.org/.
http://www.geoapi.org/.
http://www.geotools.org/.
http://www.opengeospatial.org.
http://www.oracle.com/technetwork/java/javase/tech/jai-142803.html.
http://www.osgeo.org/.
http://www.pre-earthquakes.org/.
http://www.vividsolutions.com/jts/JTSHome.htm.
https://java.net/projects/imageio-ext.
http://www.earthobservations.org.
R. Paciello et al. / Environmental Modelling Software 77 (2016) 50e6262