SlideShare a Scribd company logo
1 of 20
Download to read offline
Advances in Oceanography and Limnology, 2016; 7(1): 16-35 ARTICLE
DOI: 10.4081/aiol.2016.5682
INTRODUCTION
The Tyrrhenian Sea (TYS hereafter) is an area of con-
siderable oceanographic interest in the Mediterranean re-
gion, being the deepest and the most isolated basin of the
western Mediterranean Sea (Fig. 1). Three main openings
connect this basin to the western (Sardinia and Corsica
Channels) and eastern (Sicily Strait) Mediterranean Sea. In
spite of its marginal position, several studies ofTYS hydrol-
ogy and dynamics assessed its direct influence on the entire
Mediterranean Sea thermohaline circulation (Krivosheya
1983; Hopkins 1988; Astraldi and Gasparini 1994) which
plays a fundamental role by supplying the global ocean with
dense water whose properties have shown intense variability
in the recent decades (Millot et al., 2006; Fusco et al., 2008).
Several water masses occupy this basin from surface
to deep layers. An important vein of modified surface wa-
ters of Atlantic origin (AW) typically lies in the upper
100-200 m of the water column (Millot, 1987; Astraldi et
al., 1996; Millot, 1999; Fusco et al., 2003; Budillon et al.,
2009). These waters, identified by a subsurface salinity
minimum (S<37.4), enter the basin mainly along the
southern boundary, leaving theAlgerian basin and flowing
along the northern coast of Sicily (Astraldi et al., 2002;
Poulain and Zambianchi, 2007). At subsurface levels the
salty (S>38.5) Levantine Intermediate Waters (LIW) com-
ing from the eastern Mediterranean Sea reach the TYS
through the Sicily Strait and successively get transformed
and mixed (Millot, 1987; Hopkins, 1988; Astraldi et al.,
1996). The deepest layer is filled by the Western Mediter-
ranean Deep Water (WMDW), characterized by lower po-
Results of the first Wave Glider experiment in the southern Tyrrhenian Sea
Giuseppe Aulicino,1,2*
Yuri Cotroneo,1
Teodosio Lacava,3,4
Giancanio Sileo,4
Giannetta Fusco,1,5
Ryan Carlon,6
Valeria Satriano,4
Nicola Pergola,3,4
Valerio Tramutoli,3,4
Giorgio Budillon1,5
1
Department of Sciences and Technologies, Parthenope University of Naples, Centro Direzionale isola C4, 80143 Naples, Italy;
2
Department of Life and Environmental Sciences, Marche Polytechnic University, Via Brecce Bianche snc, 60131 Ancona, Italy;
3
National Research Council, Institute of Methodologies for Environmental Analysis, C.da S. Loja, 85050 Tito Scalo (PZ), Italy;
4
School of Engineering, University of Basilicata, Via dell’Ateneo Lucano 10, 85100 Potenza, Italy; 5
National Inter-University
Consortium for the Physics of Atmospheres and Hydrospheres, Piazza Mauruzi 17, 62029 Tolentino (MC), Italy; 6
Liquid Robotics Inc.,
1329 Moffett Park Drive, Sunnyvale, CA 94063, USA
*Corresponding author: g.aulicino@staff.univpm.it
ABSTRACT
A wave-propelled autonomous vehicle (Wave Glider) instrumented with a variety of oceanographic and meteorological sensors was
launched from Gulf of Naples on the 12th
of September 2012 for a two-week mission in the Southern Tyrrhenian Sea. The main objective
of the mission was a preliminary evaluation of the potential of commercial autonomous platforms to provide reliable measurements of sea
surface parameters which can complement existing satellite based products moving from the local to the synoptic scale. To this aim Wave
Glider measurements were compared to equivalent, or near-equivalent, satellite products achieved from MODIS (Moderate Resolution
Imaging Spectroradiometer) sensors onboard the EOS (Earth Observing System) satellite platforms and fromAVISO (Archiving Validation
and Interpretation of Satellite Oceanographic Data). Level-3 near real time and Level-4 reprocessed sea surface foundation temperature
products provided by the CMEMS (Copernicus Marine Environment Monitoring Service) were also included in this study as well as high
resolution model output supplied by NEMO (Nucleus for European Modelling of the Ocean). The Wave Glider was equipped with sensors
to measure temperature, salinity, currents, as well as Colored Dissolved Organic Matter (CDOM), turbidity and refined fuels fluorescence.
The achieved results confirmed the emerging value of Wave Gliders in the framework of multiplatform monitoring systems of the ocean
surface parameters. In particular, they showed that Wave Glider measurements captured the southern Tyrrhenian Sea major surface oceano-
graphic features, including the coast to open sea haline gradient and the presence of a cyclone-anticyclone system in the southeastern sub-
region. The Wave Glider also had the capability to monitor upper ocean currents at finer spatial and temporal scales than satellite altimetric
observations and model outputs. Nonetheless, results stressed the existence of several limits in the combined use of satellite and Wave
Glider observations and the necessity of further analyses concerning the monitoring of the ocean optical properties. In fact, Wave Glider
and satellite-based products agree in terms of sea surface temperature and currents patterns, while bio-optical properties turned out to be
less well correlated. No significant traces of refined fuels have been detected along the Wave Glider track.
Key words: Wave Glider; southern Tyrrhenian Sea; multiplatform monitoring; remote sensing; sea surface temperature; surface layer
circulation; altimetry.
Received: December 2015. Accepted: March 2016.
N
on-com
m
ercialuse
only
17G. Aulicino et al.
tential temperature (θ<13.0°C) and salinity (S<38.5), en-
tering the TYS through the deep part of the Sardinia-Sicily
section (Millot 1999). The relatively weak dynamics
within the deep layer and the presence of gyre structures
(Astraldi and Gasparini, 1994) result in mixing processes
between LIW and WMDW, with the consequent forma-
tion of a peculiar water mass (named Tyrrhenian Deep
Water) positioned below 1000 m depth (Hopkins, 1988;
Millot, 1999; Budillon et al., 2009).
The general TYS circulation is cyclonic along the
boundaries, according to the general Mediterranean circu-
lation, but several closed structures can be detected both
in the northern and in the southern regions of the basin
(Fig. 1). In the surface layer, these structures are mainly
driven by wind and its spatial variability, especially in the
northern and central TYS. Some quasi-permanent features
characterize the western part of the basin: a wide cyclonic
area frequently observed southeast of Sardinia and a cy-
clonic-anticyclonic system just east of the Bonifacio Strait
(Astraldi and Gasparini, 1994; Millot, 1999; Vignudelli et
al., 2003; Budillon et al., 2009). The southern part of the
basin is more influenced by the recirculation processes oc-
curring at its meridional openings, as confirmed by the
analyses of drifter trajectories presented by Rinaldi et al.
(2010). These processes are mainly driven by steric level
gradients existing between TYS and neighboring basins.
Classical studies (Astraldi and Gasparini, 1994; Marullo
et al., 1994; Fusco et al., 2003) suggest that the summer
circulation is completely different from that of winter, with
transition periods occurring in May-June and September-
October. In particular, during winter a basin-scale cyclonic
cell drives surface waters (AW) from the south up to the
Ligurian Sea (Fig. 1a). During summer, indeed, the TYS
basin is isolated from the rest of the Mediterranean Sea by
intense thermohaline fronts (Fig. 1b). The resulting circu-
lation has a more fragmentary pattern: the cyclonic centers
intensify, the AW flow weakens and the presence of addi-
tional eddies in the eastern TYS is favored.
Over the years, the presence of gyre structures in both
seasons has been extensively described using in situ data
(Krivosheya and Ovchinnikov, 1973) as well as satellite
sea surface temperature (SST) images (Marullo et al.,
1994) and altimetry data (Vignudelli et al., 2003).All these
studies reported the presence of quasi-permanent and in-
termittent cold and warm structures even if only few de-
tailed works exist about their formation and evolution
Fig. 1. Southern TYS general features for winter (a) and summer (b) periods. TYS main openings are the Corsica Channel, the Sardinia
Channel and the Sicily Strait. Shading indicates bathymetry and arrows indicate the main patterns of surface (AW, red) and intermediate
(LIW, grey) waters. Dashed ovals schematize the quasi-permanent features of the TYS circulation: the cyclonic-anticyclonic system in
front of the Bonifacio Strait and the cyclonic circulation between Sardinia and Sicily. The location of the Marsili Seamount (MS) is
also reported on the map.
N
on-com
m
ercialuse
only
18 Wave Glider experiment in the southern Tyrrhenian Sea
(Artale et al., 1994; Pierini and Simioli, 1998). In recent
years, Rio et al. (2007) showed the presence of a basin
wide cyclonic circulation and some large recirculation
cells from altimeter, in situ and model data, while Iacono
et al. (2013) identified nine vortices in the eastern TYS,
that appear to be robust features of the circulation, on the
basis of Sea LevelAnomaly (SLA) andAbsolute Dynamic
Topography (ADT) maps. Also, the drifter data analyzed
by Rinaldi et al. (2010) gave a significant contribution sug-
gesting the presence of a strong and recurrent anticyclonic
circulation offshore of the Gulf of Naples, the prevalence
of an anticyclonic circulation near the northern coast of
Sicily and the persistence of a cyclonic gyre that extends
until 40°N in the southeastern TYS.
In spite of its great importance, the role played by the
mean flow and the high variability of the TYS topography,
including the presence of several seamounts, is still
largely unknown. Previous studies in the central TYS
(Budillon et al., 2009) and pre-existent laboratory and nu-
merical modelling simulations (Verron and Le Prevost,
1985; Chapman and Haidvogel, 1992) indicate this effect
as a possible cause of the presence and persistence of ed-
dies in the region. In this context, the possibility to com-
plement wide-scale satellite observations with in-situ
measurements collected at higher space-time density, can
be of paramount importance in order to better investigate
and model processes developing in the TYS at very dif-
ferent space-time scales.
The main purpose of this work is to present the results
of the first Wave Glider (hereafter WG) experiment in the
southern part of the TYS, a mission carried out between
the 12th
and the 26th
September 2012 in the framework of
the RITMARE (La Ricerca ITaliana per il MARE - The
Italian research at sea) project. This experiment, based on
the use of a SV2 Liquid Robotics WG, allowed us to per-
form a remotely-guided surface monitoring of the TYS
region embedded between the Gulf of Naples and the
Marsili Seamount (Fig. 1). The WG campaign was per-
formed during the central weeks of September in order to
partially fill the lack of in situ information concerning the
transition period between summer and winter conditions.
The advantages of using an unmanned maritime vehi-
cle (UMV) like the WG are many. Although they do not
completely substitute oceanographic ship cruises, au-
tonomous ocean observing systems (e.g., UMVs, AUVs,
floats, etc.) collect, via electronic or optical sensors, a
wide range of in situ data, stored or transmitted directly
to shore, providing high resolution insights of oceano-
graphic properties and dynamics from basin-scale to sub-
mesoscale (Cotroneo et al., 2015) with lower cost
compared with the use of research vessels (Villareal and
Wilson, 2014). In particular, WGs allow fine scale spatial
and temporal continuous measurements, easy and almost
immediate deployment at short notice, as well as near real
time track changes to make observations of unexpected
and interesting phenomena at sea. Also, WG data can help
to evaluate satellite product accuracy, can be used to com-
plement other in situ information or can be used to cali-
brate and validate ocean models. At present, the most
crucial limitation of WGs is the lack of depth profiles and
of synoptic coverage over long distances due to limited
speed (Goebel et al., 2014).
In this study, data collected by the WG were coupled
to a substantial satellite dataset in order to assess the func-
tionality of the WG over the southern TYS and assess the
capability of its in situ observations to complement, at a
refined spatial scale, existing satellite products. Moreover,
ocean current data collected by the WG have been com-
pared with surface circulation output derived from an hy-
drodynamic model for the Mediterranean Sea. The paper
is organized as follows. In section 2, WG settings and data
are described, as well as the large set of satellite and
model products included in this work. In section 3, results
inferred from the WG dataset and the satellite/model de-
rived information are analyzed. The TYS features de-
tected by both platforms are discussed considering their
combination and inter-comparison. Results are summa-
rized in section 4 where some directions of future work
are also indicated.
METHODS
Wave Glider data
The WG (Fig. 2) is an unmanned maritime vehicle
(UMV) unique in its ability to harness ocean wave energy
for platform propulsion. This autonomous sampling sys-
tem uses a series of wings located on a sub-body at 5.8
meters below the surface to propel the vehicle forward
using the vertical motion induced by wave motion, inde-
pendently of wave direction. The wave energy propulsion
system is purely mechanical.As waves pass by on the sur-
face, the submerged glider acts as a tug, pulling the sur-
face float along a predetermined course (Wilcox et al.,
2009). There is substantial power available in ocean
waves so that WG harnesses part of this power to maintain
an average forward speed from 0.4 to 1.5 knots, depend-
ing on sea state (Hine et al., 2009). This energy can be
used for locomotion to reach any point of interest as well
as for station keeping once that position is reached.
The vehicle consists of a low-profile surface float
equipped with solar panels that provide power for the
sampling systems, navigation systems (GPS satellite
transmissions) and satellite telemetry links (Iridium®
Satellite). The subsurface board is connected to the sur-
face payload by a tether (umbilical). Real time communi-
cation with the shore-based operator allows monitoring
of platform location and data gathering.
N
on-com
m
ercialuse
only
19G. Aulicino et al.
The Liquid Robotics Inc. (LRI) WG-SV2 involved in
this study supported four sampling systems: an Airmar
PB200 weather station collecting air temperature, baromet-
ric pressure, wind speed, wind gust speed, and wind direc-
tion at one meter height; a Turner Designs C3 submersible
fluorometer equipped to measure Colored Dissolved Or-
ganic Matter (CDOM), refined fuels concentration and tur-
bidity; a pumped Seabird Electronics Glider Payload
Conductivity, Temperature, Depth (CTD) sensor; an
Acoustic Doppler Current Profiler (ADCP) WorkHorse
Monitor by Teledyne/RD Instruments operating at 300 kHz
(Fig. 2). Tab. 1 gives an overview of the main WG charac-
teristics and capabilities.Additional information is available
from the LRI webpage (http://liquid-robotics.com).
The weather station is based on ultrasonic technology
with wind corrections for pitch and motion based on a
three-axis compass, yaw-rate gyro and GPS information.
The wind sensor anemometer measures 0 - 360° wind ve-
locity between -360° wind velocity between 0 and 40 m
s–1
with a resolution of 0.1° and 0.1 m s–1
and an accuracy
of 2-8° and 0.5-2.5 m s–1
(the worst in occurrence of wet
conditions). The temperature sensor ranges between -
25°C and 55°C (with a resolution of 0.1°C and an accu-
racy of ±1.0°C) while the atmospheric pressure sensor
ranges between 850 and 1150 mbar (with a resolution of
0.1 mbar and an accuracy of ±2 mbar).
CDOM, refined fuels and turbidity measured by the
C3 system are reported in Relative Fluorescence Units
(RFU). A conversion of RFU values into practical units is
possible according to the C3 pre- and post-deployment
standard calibrations of the fluorometer sensor provided
by LRI. In particular, the C3 system has been calibrated
using naphthalene for the refined fuels channel, quinine
sulfate for the CDOM and 3000 Nephelometric Turbidity
Units (NTU) for the turbidity. Nonetheless, it is important
to be aware that the used reagents could be not represen-
tative of what exact fluorescing species are in the water
column where the instrument is actually placed. Moreover
fluorometer sensors, of the type similar to the one used
on WGs, demonstrate drift over time and require frequent
calibration for a proper conversion from RFU to practical
units (Goebel et al., 2014). Unfortunately, during this de-
ployment WG optical observations have not been cali-
brated against measurements of chlorophyll-a
concentration chemically extracted from co-located water
samples in order to overpass these issues. Consequently,
in this work RFU values have been used for the three
channels (i.e., CDOM, refined fuels and turbidity) in place
of part per billion (ppb) of standard units. This avoids any
possible misinterpretation of observed data during RFU
to concentration conversion.
The Seabird CTD acquires with an accuracy of 0.003
mS cm–1
for conductivity, 0.002°C for sea temperature
and 0.1 dbar for pressure. The sampling interval for the
Fig. 2. Wave Glider main instrumentations (red) and components (green).
N
on-com
m
ercialuse
only
20 Wave Glider experiment in the southern Tyrrhenian Sea
weather data was 10 min, while for the CTD and the C3
sensors it was 60 and 120 s respectively.
The ADCP system has a compass resolution of 0.01°
(accuracy of ±2°) and was set for investigating several
depths (at 6, 10, 16, 26, 46 and 66 meters) with a current
velocity resolution of 0.1 cm s–1
(accuracy of 0.5% of meas-
ured velocity ±0.5 cm s–1
). These averaged depths (also
called bins) are the effective centers of cell size of 4 meters
each. For conversion of bins to actual depth values, a
draught of 0.25 m was applied for the distance of theADCP
below the water surface. Please note that the observations
at 6 meters depth have not been included in this study be-
cause of contamination of the data in the upper water layers
by the WG driving mechanism (placed at 5.8 meters depth).
Pulses were averaged into ensembles at a time interval of
120 seconds and corrected for the motion of the vehicle.
The ensemble averaging reduces random errors and bias as
suggested by Fitzpatrick et al. (2014) and previously de-
tailed in Teledyne (2011). The motion correction was done
by estimating the velocity of the vehicle during each en-
semble, using the GPS coordinates recorded at the begin-
ning and end of each ensemble period. The calculated WG
velocity is then subtracted from the ensemble to provide an
estimate of the actual current velocity. According to Beat-
man et al. (2013), additional post-processing operations ex-
cluded data while the WG was turning, that means while
the vehicle has a heading change of more than 30° between
two 120 seconds averaged samples.
All the data collected by WG were stored onboard and
relayed via satellite link to LRI. In this study, subsets of
data from the CTD sensors, the C3 sensors, the ADCP
system and the weather instrumentation are examined.
Data referring to periods when the WG was out of the
water, identified through negative CTD pressure values
(indicative of depth), were eliminated. Before being
processed, all the measurements contained in these sub-
sets were averaged in ten minutes ensembles (Fitzpatrick
et al., 2014). A comparison with the full resolution
datasets was performed to avoid any lack of information.
Satellite data
Satellite sea surface temperature and ocean color data
The WG data were compared with Sea Surface Tem-
perature (SST), chlorophyll concentration and Kd490 (the
diffuse attenuation coefficient for downwelling irradiance
at 490-nm, which is a good proxy for turbidity) products
from MODIS. In detail we used products at different pro-
cessing levels depending on the specific investigation we
carried out. Eight days composite MODIS (Moderate Res-
olution Imaging Spectroradiometer) AQUA Level 3 SST
maps at 4 km of spatial resolution were used to describe
the quasi-synoptic conditions of the enquired area during
the WG mission. Daily Level 2 Ocean Color (OC) and
SST products at 1 km resolution, generated after each
Terra and Aqua MODIS acquisition, were used for an al-
most punctual match-up with the WG data. MODIS OC
and SST products available for the WG mission were
downloaded from the NASA Ocean Color portal
(http://oceancolor.gsfc.nasa.gov). Several OC geophysical
variables were analyzed: chlorophyll concentration
(chlor-a) derived through OCI algorithm (Hu et al., 2012),
chlorophyll concentration (chlor-ocx) derived through
OC3 algorithm (O’Reilly et al., 2000) and diffuse attenu-
ation coefficient of downwelling radiative flux (Kd_490).
Also the information about CDOM is provided by NASA
Ocean Color portal, but in terms of a dimensionless index
representing its excess (or deficit) with respect to its av-
erage value, chlorophyll-a dependent, in a specific area
Tab. 1. Wave Glider main characteristics and capabilities.
Physical carachteristics
Configuration
Submerged glider connected to a surface float by a tether
Dimensions Float: 2.1 m x 0.6 m
Glider: 1.9 m x 0.4 m
Wings: 1.1 m total width
Weight and buoyancy About 75 Kg, 150 kg displacement
Endurance Up to 1 year
Capabilities and functionality
Propulsion Wave energy
Speed >0.5 kt in Sea state 1; >1.5 kt in Sea state 3
Battery 86 W solar panel charging a 665 Wh Li-on battery pack
Payload power About 10 W continuous
Comunication systems Iridium Satellite modem; RF Modem
Navigation systems 12 channel, WAAS enabled GPS; Compass
Emergency devices Light and RF beacon
N
on-com
m
ercialuse
only
21G. Aulicino et al.
(Morel and Gentili 2009). For this reason, the CDOM
index is not directly comparable to the collected WG data
and was not further analyzed in this paper. Nonetheless,
as discussed in section 3.2, WG CDOM measurements
were compared with OC chlor-a and -ocx data in order to
evaluate the contribution of CDOM dynamics to the
MODIS chlorophyll observations.
Daily MODIS images were used for the match-up with
the WG data. Such an operation was made by averaging all
glider data within a ±2 h temporal window in correspon-
dence of usable MODIS data. In Tab. 2 the number of im-
ages available for the test area is reported. The Earth
Observing System satellites constellation provided about
two images per day. Concerning SST, both diurnal and
night-time data have been used in this paper, allowing a
more robust comparison from a statistical point of view.
Moreover, several sea surface foundation temperature
(SSTfnd) products, which includes diurnal variation cor-
rection, were compared with WG SST observations. In par-
ticular, Level-3 near real time and Level-4 reprocessed
products provided by the CMEMS (Copernicus Marine En-
vironment Monitoring Service) were included in this study.
Daily Level-3 adjusted SSTfnd ultra high resolution prod-
ucts are operationally produced and distributed on a 0.01°
X 0.01° grid over the Mediterranean Sea by the Istituto di
Scienze dell Atmosfera e del Clima - Gruppo di
Oceanografia da Satellite (CNR ISAC-GOS). This dataset
is made of single daily super-collated images which are ob-
tained by merging different Level-3 images retrieved from
several sensors. Differences among the sensors (number of
bands, spectral resolution, scanning/viewing geometry, etc.)
and/or discrepancies due to the different algorithms applied
to retrieve brightness temperature are adjusted through the
use of best measure algorithms which keeps into account
the continuity of the data present in the single image for
each pixel (Buongiorno Nardelli et al., 2013). High reso-
lution Level-4 reprocessed daily gap-free maps of SSTfnd
are delivered by CNR ISAC-GOS on a regular 0.0417° X
0.0417° grid over the Mediterranean Sea. This product is
based on the optimal interpolation of AVHRR Pathfinder
(version 5.2) dataset (http://pathfinder.nodc.noaa.gov)
using an adapted algorithm which chooses the proper co-
variance models for each specific area (Buongiorno
Nardelli et al., 2013). Datasets, products specifications and
quality information are available at http://marine.coperni-
cus.eu. Matlab, Ocean Data View, SEADAS and Quantum
GIS were used to analyze and visualize the processed OC,
SST and SSTfnd data.
Satellite sea level data
High-quality altimeter data over the TYS area have
been used to investigate specific aspects of the surface cir-
culation during the WG mission period. Satellite altimetry
data were provided by AVISO (Archiving Validation and
Interpretation of Satellite Oceanographic data,
http://www.aviso.altimetry.fr/en/data.html). In particular,
‘all sat merged’ multi-mission maps of SLA and
Geostrophic VelocityAnomalies, as well as ‘all sat merged’
maps ofADT and absolute geostrophic velocities were used
to describe the basin scale circulation of the study area. The
entire dataset is available on a 1/8° X 1/8° regular Cartesian
grid and results from the merging process of all missions
available at a given time. Consequently, this series is better
in quality but not homogeneous over the time period. Grid-
ded sea surface heights (SSH) and corresponding
geostrophic velocity anomalies are computed with respect
to a twenty-year mean (1993-2012). The twenty year ref-
erence period is also used for gridded SSH above geoid and
corresponding absolute geostrophic velocities. ADT has
been computed as the sum of SLA and mean dynamic to-
pography (SMDT-MED-2014). Anyway, it is important to
remark that the altimeter data do not provide information
on the circulation at the sea surface, which is dominated by
high frequency wind forcing, but the signal is an integrated
one which reflects the motion of the main pycnocline
(Wunsch, 1997), i.e. the region of transition between the
AW and the LIW. This region is quite shallow in the TYS
(100-200 meters maximum depth) so that its motion is ex-
pected to dominate the geostrophic dynamics of the surface
layer. The horizontal resolution of SLAmaps is insufficient
to identify most of eddies with sizes smaller than thirty kilo-
meters, even if Pascual et al. (2007) indicates that merging
data from at least three altimeter missions is sufficient for
a correct monitoring of the mesoscale circulation of the
Mediterranean Sea and that four may resolve circulation
features with sizes significantly smaller than 1/8°. We can
therefore expect that eddies with a size of about 100 km,
or slightly smaller, could be sufficiently resolved over most
of the dataset (Iacono et al., 2013).
Modeled horizontal velocity data
High resolution physical reanalysis over the TYS pro-
vided by INGV (Istituto Nazionale di Geofisica e Vul-
canologia) were used to enrich the study of the surface
Tab. 2. Number of MODIS products available for the investi-
gated area during the WG mission (i.e., 12-26 September 2012).
MODIS SST_LAC_L2 available products
Day Night
Aqua 21 21
Terra 20 26
MODIS OC_LAC_L2 available products
Aqua 21
Terra 19
N
on-com
m
ercialuse
only
22 Wave Glider experiment in the southern Tyrrhenian Sea
circulation during the WG mission period. Daily mean
modeled horizontal velocity (meridional and zonal com-
ponent) data, derived from version 3.2 of the Ocean Gen-
eral Circulation Model code supplied by Nucleus for
European Modelling of the Ocean-Ocean Parallelise
(hereafter NEMO), were included in this study. The hy-
drodynamic model has a horizontal grid resolution of
0.0625° X 0.0625° (about 6-7 km) and 72 unevenly
spaced vertical levels (Oddo et al., 2009). The NEMO
model is initialized at the 1st
January 1985 with two years
of spin-up. It is located in the Mediterranean Basin but
also extend into the Atlantic in order to better resolve the
exchanges with the Atlantic Ocean at the Strait of Gibral-
tar. Ocean model data output from a single consistent ded-
icated ocean dynamic model forced by consistent
reprocessed historical observational data (surface winds,
heat, and freshwater), assimilating consistent reprocessed
historical observational data (in situ temperature and
salinity, satellite altimetry). The model is forced by mo-
mentum, water and heat fluxes interactively computed by
bulk formulae using the 6-h, 0.75° horizontal-resolution
ERA-Interim reanalysis fields from the ECMWF (Euro-
pean Centre for Medium-Range Weather Forecasts). The
water balance is computed as Evaporation minus Precip-
itation and Runoff (considering ERA-Interim precipita-
tions at 6-h, 0.75° horizontal-resolution, evaporation
derived from the latent heat flux and monthly mean runoff
provided by the Climate Prediction Centre Merged Analy-
sis of Precipitation and the Global Runoff Data Centre
datasets. In this study, WG ADCP observations have been
compared to co-located (in space and time) NEMO daily
mean horizontal velocities in the 11 levels between 11.55
and 66.45 m depth.
RESULTS AND DISCUSSION
The WG cruise lasted 14 days covering a great part of
the southern TYS (Fig. 3a). According to the structure of
other in situ datasets and basing on up to date knowledge
of basin dynamics, the collected data should be split into
different subsets to guarantee their synoptic representa-
tion. The entire September 2012 WG dataset has been di-
vided into three main legs: i) the first leg (L1 – red line in
Fig. 3a) from the 12th
to the 15th
includes the southward
cruise from the Gulf of Naples to the 38.8°N; ii) the sec-
ond (L2 – green line in Fig. 3a) from the 15th
to the 22nd
concerns the monitoring of the Marsili Seamount sub-re-
gion; iii) the third (L3 – blue line in Fig. 3a) from the 22nd
to the 26th
corresponds to the northward cruise back to the
Gulf of Naples. This fragmentation of the data also re-
flects the effective cruise sampling plan, with two long
meridional transects across the Southern TYS and one in-
tense sampling area located over the Marsili Seamount.
The analyses of collected data includes in situ obser-
vations that belong to three main groups: i) seawater phys-
ical properties data (T/S); ii) currents intensity and direc-
tion; iii) turbidity, CDOM and refined fuel concentrations.
Sea water physical properties and currents
The potential temperature (θ) versus salinity (S) dia-
gram (Fig. 3b) summarizes the hydrological characteris-
tics of the TYS surface layer observed by the WG during
the overall mission (at a mean depth of about 5.8 m). This
near-surface layer is characterized by the presence of a
relatively warm and salty water showing θ values greater
than 23°C (with a maximum of 25.8°C) and salinities
spanning between 37.9 and 38.4. This surface water mass
is strongly influenced by the summer weather conditions
and is known to occupy the upper mixed layer on top of
the underlying fresher and colder AW core.
The variation in the water masses properties during
the two weeks survey, shows a decrease in temperature
along the WG cruise. In fact, coastal waters near the Gulf
of Naples observed at the beginning of the cruise (A sub-
set in Fig. 3b) show higher potential temperatures than
waters occupying the same position on the 26th
September
(D subset), while their S values remain almost unchanged.
Asimilar temperature gradient (≈2°C) is evident for B and
C data subsets, corresponding to the first (southward) and
last (northward) transects respectively. Again, their S val-
ues are almost unchanged. On the other hand, changes in
salinity are evident moving from subset A to B and from
C to D, reflecting a typical coastal to open-sea haline gra-
dient. The observed decrease in water temperature is in
agreement with the expected variation due to the changing
weather conditions during the 15 days cruise over the
large study area and is consistent with the frontal structure
described later in this section.
However, using information retrieved from satellite
datasets, it is possible to observe that during the entire
mission, the general pattern of SST and SSH remains al-
most unchanged suggesting a possible use of the WG data
as a whole quasi-synoptic dataset. SST maps obtained by
MODIS AQUA level-3 composites on 8 days for the pe-
riods from the 13th
to the 28th
of September 2012, show
the evolution of a zonal SST gradient that lasts for the en-
tire WG cruise (Fig. 4). Even as a general decrease in SST
values is observed during the 16 days, the development
and the persistence of a strong SST zonal gradient at about
40°N latitude are evident. This evolution could be par-
tially explained by the verified presence of a large scale
low atmospheric pressure centre over the study area dur-
ing the 14th
and the 15th
of September. These conditions
were reported also in the weather data collected by the
WG, as a lowering in air pressure and temperature starting
from the 12th
of September (Fig. 5). This atmospheric
front hauled very cold air from Northern Europe over the
southern TYS, influencing the sea surface layer tempera-
N
on-com
m
ercialuse
only
23G. Aulicino et al.
ture (hereafter SLT) during the following days. Another
evidence of the stability of the spatial patterns during the
entire cruise can be confirmed by maps of SLA and ADT
data with associated geostrophic currents, all provided by
AVISO. Observing both variables is necessary because
sometimes structures appearing in the SLA maps cannot
be unequivocally associated with specific circulation fea-
tures (Iacono et al., 2013). Information on the height
change associated with the satellite observed mean circu-
lation, called Mean Dynamic Topography (MDT), is
needed to remove possible ambiguities. Adding the MDT
to the SLA yields the ADT maps. Nonetheless, the MDT
reconstruction has its own limitations and uncertainties
which may locally obscure the information contained in
the SLA especially in areas, such as the Mediterranean
Sea, in which the circulation displays a strong seasonal
cycle. Comparing the SLA and the ADT maps is indeed
the solution to avoid any wrong interpretation.
Daily ADT and SLA maps, plotted every 3 days from
the 11th
to the 26th
of September (Fig. 6 a and b, respec-
tively), show the stable presence of a dipolar structure
over the study area. Both parameters report a low sea level
core that is identified in the eastern part of the basin,
durably associated to two high sea level structures. The
larger one is located near the northern coasts of Sicily
while the second one lies at about 40°N/14°E, just west
of the low SLA previously described.
In terms of circulation, two strong anticyclonic struc-
tures are located north of Sicily and off the Campania
coast, sometimes combined into a unique wider gyre dur-
ing the studied period. Along the Calabria coast a weaker
cyclonic cell is noted, usually embedded between the two
western anticyclones. The spatial pattern described by
SSH, SST and in situ WG data is consistent with typical
September-October features of southeastern TYS circu-
lation described through model simulations and seasonal
Fig. 3. Map (a) and θ/S diagram (b) for the entire WG mission from the 12th
to the 26th
of September 2012. WG track (blue line) and
main heading (white arrows) are indicated. Correspondence between sub-regions and water masses properties is shown through capital
letters. WG track color indicates L1 (red), L2 (green) and L3 (blue).
N
on-com
m
ercialuse
only
24 Wave Glider experiment in the southern Tyrrhenian Sea
Fig. 4. MODIS AQUA level 3 SST maps (°C) obtained by composites on 8 days for the periods 13th
to 20th
(a) and 21st
to 28th
(b) Sep-
tember 2012. WG track is superposed (black line).
Fig. 5. Air pressure (y-axis) and air temperature (color-scale) data collected by the WG weather station during the entire mission (12th
to 26th
September 2012 on x-axis).
Fig. 6. Daily maps of AVISO Sea Level Anomaly (a) and Absolute Dynamic Topography (b), with superposed associated geostrophic
velocities, in the southern TYS plotted every 3 days between the 11th
and the 26th
of September 2012. Campania, Calabria and Sicily re-
gions are identified by squared numbers in Fig. 7.
N
on-com
m
ercialuse
only
25G. Aulicino et al.
SLA and ADT maps (Iacono et al., 2013) as well as in
previous studies based on cruise (Kryvosheya and
Ovchinnikov, 1973) and drifter (Rinaldi et al., 2010) data.
The persistence of these structures and associated
currents leads to the generation of a frontal area separat-
ing the different cores. In particular, the low sea level
area near the Italian coast is separated from the northern
high sea level structure by a strong gradient in ADT that
reflects the SST gradient shown by MODIS satellite
(Fig. 4) and WG data. Their persistence over the studied
period might suggest that the observed eddies are not de-
pendent on local forcing (i.e., weather conditions) and
had a remote origin.
A qualitative comparison between AVISO ADT infor-
mation and WG ADCP currents averaged over the sam-
pled depths (10 m, 16 m, 26 m, 46 m and 66 m) showed
the presence of a fine correspondence between the two
datasets. In Fig. 7 WG mean currents collected along the
three transects have been superposed over the mean alti-
metric ADT map for the studied period. WG data have
been subsampled to 1/5 for a better graphical representa-
tion. ADCP data describe well the main anticyclonic
structure identified from altimetry along the L1 (between
40°N and 39.5°N at 14°E) and confirm the presence (be-
tween 14°E and 14.7°E at 38.8°N) of a consistent west to
east current, flowing in the southwest corner of the L2,
which hauls waters from the northern coast of Sicily. The
edge of the eastern cyclonic vortex visible in the ADT
maps is also identified by the counterclockwise velocities
observed by WG in the northeastern edge of the L2 area
(at 39.4°N/14.7°E). The observation of colder and fresher
waters in this area (see also Fig. 10) is probably linked to
the presence of the persistent cyclonic gyre already de-
scribed off the Italian coast, and possibly to the associated
upwelling processes. As stated before, these observations
are totally consistent with previous eastern TYS circula-
tion analyses confirming the presence of a persistent cy-
clonic vortex located at around 39.5°N 14.6°E (Rinaldi et
al., 2010; Iacono et al., 2013).
Furthermore, high resolution WG mean currents have
been compared to co-located 1/8° resolution altimeter
geostrophic velocities in order to assess the general cur-
rent pattern of the study area. Fig. 8 compares: (a) WG
ADCP mean currents in the layer between 10 m and 66
m depths and AVISO geostrophic velocities; and report
their (b) zonal and (c) meridional components. Both
dataset have been smoothed with a window-144 (corre-
sponding to the number of WG current daily samples)
running mean for a better graphical representation. When
discussing these results, it is important to remark that the
WG ADCP gives information concerning the mean cur-
rent of the top 66 meters, while the altimeter provides an
integrated current of the whole layer above the main py-
cnocline. This implies that WG data are partially influ-
enced by ageostrophic dynamics due to wind. Near
inertial currents, Ekman currents and internal tides all par-
tially contribute to the observed in situ velocity too. Also,
AVISO daily currents are post-processed products opti-
mally interpolated with a time-decorrelation scale of two
weeks whileADCP provides instantaneous data. Nonethe-
less, Fig. 8 shows that WG and altimetry observe a similar
current pattern with a general fine correspondence, except
than in part of the last transect of the WG campaign (L3).
The analysis of the u and v components point out the ex-
pected higher resolution (smalls scales) captured by WG
observations and a good correlation between the two
dataset in terms of zonal and meridional components.
Maximum differences between WG and satellite current
components are 0.18 m s–1
and 0.12 m s–1
for u and v re-
spectively. Nevertheless, a better correlation is remarkable
in u component. The differences noticed in L3 seems to
be linked to a different behavior of the meridional com-
ponents. As stated above, it is important to remark that all
data represented in Fig. 8 have been smoothed with a win-
dow-144 filter. Since WG recorded an average platform
velocity of about 0.9 knots, this implies a spatial smooth-
ing at about 40 km. Nevertheless, WG ADCP is able to
resolve finer spatial scales as clearly visible in Fig. 7 and
Fig. 7. Mean map of AVISO Absolute Dynamic Topography
(color scale) for the 12th
to 26th
September period, with superposed
corresponding WG in situ mean currents collected by ADCP be-
tween -10 m and -66 m depths (black arrows). Squared numbers
identify Campania (1), Calabria (2) and Sicily (3) regions.
N
on-com
m
ercialuse
only
26 Wave Glider experiment in the southern Tyrrhenian Sea
in the unfiltered u and v series (not shown). All these re-
sults confirm the importance of AVISO information in de-
scribing large scale patterns as well as the usefulness of
WG in resolving small scale and local features of the
ocean surface circulation.
A preliminary comparison between WG observations
and Mediterranean Sea model output has been performed
in order to confirm these results. ADCP measurements
have been compared to co-located (in space and time)
NEMO model daily mean horizontal velocities derived in
the water column layer included between 11.55 and 66.45
m depth (Fig. 9a). Zonal (u) and meridional (v) compo-
nents are compared in Fig. 9 b and 9c, respectively.
Datasets (both smoothed with a window-144 running
mean) show an excellent correlation except in L1 where
v components seems to be opposite in phase. Neverthe-
less, v components show a general better agreement and
a lower maximum discrepancy (0.14 m s–1
versus 0.19 m
s–1
) than u components. These results demonstrate the
benefits of WGs in evaluating and/or complementing
model outputs and suggest their combined use as a possi-
ble solution for achieving a large scale synoptic monitor-
ing of the small mesoscale surface circulation that usually
cannot be completely resolved by satellite altimetry.
In this overall scenario, even when merging in situ
data from different places and time along the mission
track, WG dataset seems to offer a reliable picture of the
general physical pattern of the area (Fig. 10). WG SLT
Fig. 8. Comparison between local WG mean currents (red) and altimeter geostrophic velocities at 1/8° resolution (blue). WG ADCP
mean currents in the layer between 10 m and 66 m depths and AVISO geostrophic velocities (a), and their zonal (b) and meridional (c)
components are reported.
N
on-com
m
ercialuse
only
27G. Aulicino et al.
observations collected from the 12th
to the 26th
of Septem-
ber describe the presence of a cold water vein in the east-
ern part of the study area with a low SLT core at 23.7°C
(Fig. 10a). This relatively cold water is separated from a
warmer water mass by a frontal structure located between
40.2°N at 14.2°E and 39.3°N at 15.0°E. Furthermore, two
warm SLT cores at 25.6°C and 25.3°C are observed at
40.0°N/14.0°E and 39.1°N/14.0°E respectively.
According to the θ-S diagram, Figure 10b points out
the presence of a coast to open-sea haline gradient be-
tween the coastal area located north of 40.3°N/14.0°E
(salinity core at 38.1) and the open-sea region south of
40.0°N (salinity values higher than 38.2). As expected,
lower values are observed inside the Gulf of Naples where
rivers and inland supplies reduce the surface layer salinity
down to 38.0. On the contrary, saltier waters are identified
at the end of L1 where S values higher than 38.3 have
been observed by the WG. This water mass possibly be-
longs to the external edge of the anticyclonic gyre persist-
ently observed along the northern Sicilian coast (Fig. 6).
Focusing on the Marsili Seamount sub-region (L2), we
can distinguish interesting saltier/warmer and fresher/
colder water masses in the proximity of the southwestern
and northeastern edges respectively (Fig. 10). Along the
L3, fresher waters are observed in the area around
40.0°N/14.4°E.
Fig. 9. Comparison between local WG mean currents (red) and modeled currents at 1/16° resolution (black). WG ADCP mean currents
in the layer between 10m and 66m depths and NEMO model currents in the same layer (a), and their zonal (b) and meridional (c) com-
ponents are reported.
N
on-com
m
ercialuse
only
28 Wave Glider experiment in the southern Tyrrhenian Sea
Sea water optical properties
The Turner C3 fluorometer observations are more
challenging to interpret. Collected data are summarized
in Fig. 11 where surface layer CDOM (a), refined fuels
concentration (b) and turbidity (c) maps are shown in
terms of RFU. As expected, a qualitative analysis of these
data shows that a negative gradient is present for all the
enquired parameters when the WG moves from inside the
Gulf of Naples to open-sea. This is observed during both
L1 and L3. No other significant patterns are evident along
the WG track for CDOM and refined fuels concentrations,
except for the relatively higher values observed in the
northeastern corner of the Marsili Seamount sub-region,
in correspondence of the cyclone-anticyclone system
edge. As for the turbidity, the presence of a regional pat-
tern similar to what observed in terms of surface circula-
tion (see Figs. 7 and 10) is identified. Lower turbidity
values are found where lower SLT and the cyclone struc-
ture have been observed, higher ones where the anticy-
clonic systems persist.
Nonetheless, in these data it is possible to identify the
well-known diel cycle linked to chlorophyll fluorescence
(Brand, 1982; Jacquet et al., 2002). Time series of CDOM
and refined fuels show a sinusoidal behavior that is in
phase with night-day turnover (not shown). Diel signal is
more evident in CDOM dataset for almost the entire sam-
pling period and, as expected, the diurnal maximum was
in the form of increased positive scatter. Anyway, the de-
sign of the WG used for this mission supported a C3 sen-
sor that is not protected from direct sunlight (i.e., in a
pipe) and hence that can be influenced by shadow vari-
ability from the surface board. This causes a very high
noise in the CDOM and refined fuels series. Our initial
concept for C3 dataset was to use spiking in the turbidity
data as a proxy for large particulate aggregates (Briggs et
al., 2011; Villareal and Wilson, 2014). The turbidity data
contains a certain amount of spiking suggestive of possi-
ble large particles, especially along the first leg of the WG
mission. Highest values were registered in the proximity
of the Gulf of Naples both at the beginning and the end
of the mission (not shown). However, the C3 sensor re-
sponds to bubbles as well. This is a possible additional
source of noise because many microbubbles are usually
generated along the bottom of the float. For this reason,
these spikes have been removed during the quality check
procedures. There are several layers of complexity asso-
ciated with comparing WG fluorescence and OC data, e.g.
the pronounced diel rhythm identified in the collected data
and the difference between surface and optical depth
Fig. 10. Temperature (a) and salinity (b) overall mission WG observations collected between the 12th
and the 26th
of September 2012
along WG track (marked line).
N
on-com
m
ercialuse
only
29G. Aulicino et al.
measurements (Villareal and Wilson, 2014). In general,
the patterns observed in the satellite and WG datasets
were in agreement (not shown) but calibration problems
suggest caution in use of the fluorescence data. In partic-
ular, WG CDOM observations show a linear correlation
of R=0.85 and R=0.80 with co-located (in space and time)
OC chlor-a and chlor-ocx products respectively. Actually,
CDOM and chlorophyll are different parameters but they
both absorb light in the same spectral range so that it is
difficult to differentiate between the two. The former ab-
sorbs light and decreases reflectance in the visible portion
of the spectrum, especially in the blue region, while the
latter strongly absorbs red and blue light and reflects
green. This is the reason why water color usually changes
from green at coastal region with higher chlorophyll and
CDOM concentration to blue in deep waters where
chlorophyll is the mainly water constituent. The correla-
tion results achieved in this study confirm the importance
of understanding the relative contribution of chlorophyll
and CDOM dynamics to correctly detect trends in phyto-
plankton production.
Even though turbidity and refined fuel do not have a
direct satellite equivalent, an attempt was done to compare
WG data with MODIS derived information. WG turbidity
data were compared with the Kd490 MODIS product
which provides information about how strongly the light
intensity is attenuated within the water column. It is di-
rectly related to the presence of scattering particles, either
organic or inorganic, in the water column and thus it could
give an indication of water clarity or of the water column
turbidity.After selecting OC MODIS products suitable for
the comparison, only 9 (among the 40 available) images
passed the quality check (mostly because of the presence
of clouds) and a very poor correlation was found (R=0.07)
among MODIS based Kd490 product and WG turbidity
measurements. This seems to indicate, for such a specific
parameter, that the in situ and remote sensors are looking
at dissimilar objects. A different depth of investigation
and/or a small scale variability, that MODIS is not able to
capture, could explain these results. It should be also un-
derlined that, by its design, the WG is propelled at the sur-
face like a surfboard and bubbles of all sizes will roll
along the bottom of the float. As stated before, microbub-
bles are of particular concern since they will not rapidly
ascend and are likely to represent a source of noise for the
turbidity WG parameter (Villareal and Wilson 2014).
As for the comparison between WG refined fuels data
and MODIS satellite products, the RST-OIL approach
(Casciello et al., 2007, 2011, Grimaldi et al., 2009a,
2009b, 2011a, 2011b) was applied. Results showed that
no intense oil spills were observed in either the WG data
or the satellite observations.
Sea surface temperature
Among the parameters acquired by WG which could
have been compared with satellite data, the SST is the
only one that offered a major opportunity to be analyzed
in details because both the technologies are able to pro-
vide comparable information.
First of all, it should be stressed that the measurements
acquired by WG refer more to a bulk SST than a skin one.
As already said, the CTD probe is located below the float,
providing an information that is referred as an average at
Fig. 11. CDOM (a) Refined fuels (b) and turbidity (c) overall mission observations collected by C3 sensor between the 12th
and the 26th
of September 2012 along the WG track (marked line). Values are expressed in terms of Relative Fluorescence Units (RFU).
N
on-com
m
ercialuse
only
30 Wave Glider experiment in the southern Tyrrhenian Sea
5.8 m depth. On the other hand, the information provided
by MODIS refer to a layer less than 1 mm thick at the
ocean surface (Kilpatrick et al., 2015), namely to the skin
temperature. Taking into account such a difference and
the very short time duration of cruise (with a few MODIS
passes all masked by clouds mainly during the first leg),
the comparison has been mainly addressed to understand
the potential of the WG in providing useful information
about SST variability at a refined spatial scale.
In Fig. 12a the WG SST variation along its path is
reported. Looking at this image, it is possible to note that
SST variations at short-time scale are almost negligible,
apart from two small portions acquired during the first
leg of and at the end of the mission. Furthermore, it is
also possible to see the daily SST variability, better high-
lighted in Fig. 12b where WG SST data distribution is
reported. In this figure, a clear separation between the
night-time (colder) data and the warmer day-time meas-
urements is observable, with a larger range of variability
(almost 2°C) for diurnal data respect to the night-time
ones (about 1.3°C).
MODIS SST has been computed everywhere regard-
less the presence of clouds and marked with a quality flag
(QF) indicating the accuracy of the SST information. To
avoid cloud and cloud-edge pixel contamination in the
following analysis, only MODIS SST data characterized
by a small possibility of cloud presence (i.e.,QF≤1) have
been considered. MODIS products which passed this filter
have been co-located on the WG path (red segments in
Fig. 12c). During such an operation, taking into account
the above mentioned small variability of the WG SST at
short-time scale, SST MODIS and WG SST temporal av-
erage computed in a time window of ±2 hours respect to
the MODIS time acquisition have been compared. For this
reason, MODIS data are represented by several red seg-
ments. In addition, the different lengths of the segments
highlight the variable numbers of measurements acquired
at changing speeds by the WG during the mission. Unfor-
Fig. 12. SST variation as measured by WG during the mission (a) and its frequency distribution (b). In (c) the subsets where it was pos-
sible to perform the comparison between MODIS SST product and WG data are indicated with red segments along the WG path.
N
on-com
m
ercialuse
only
31G. Aulicino et al.
tunately, as already said, no useful MODIS SST products
were available during most of L1.
In Fig. 13 the SST Probability Density Function distri-
butions of MODIS (purple line) and corresponding WG data
(red line) have been compared. A good agreement between
the two series is observed as well as a discrimination be-
tween day-time and night-time data and a similar variability.
This result was further confirmed by carrying out a correla-
tion analysis between WG and satellite products (Fig. 14).
A coefficient of correlation (R) of 0.76 was achieved
(RMSE=0.41°C), with a maximum discrepancy of 0.7°C.
Nonetheless, it is important to remark that SST is a
challenging parameter to define precisely as the upper
ocean (i.e., the first 10 m) has a complex and variable ver-
tical temperature structure that is related to ocean turbu-
lence and air-sea fluxes of heat, moisture and momentum.
This is important to be considered when comparing (or
merging) observations made by different satellites and in
situ instruments that measures temperatures at depth of
10-20 µm (skin SST) and few meters (or centimeters) re-
spectively. On the other hand, temperatures at all depths
collapse to the same value before local sunrise. This value,
free of diurnal temperature variability, is namely the
SSTfnd, i.e. the temperature at the first time of the day
when the heat gain from the solar radiation absorption ex-
ceeds the heat loss at the sea surface (Le Traon, 2011).
Thus, WG SST measurements (red line) were compared
with co-located (in space and time) CMEMS Level-3 near
real time (blue line) and Level-4 reprocessed (black line)
SSTfnd information (Fig. 15). All the datasets were
smoothed with a window-144 (the number of analyzed
WG daily samples) running mean. Results show a very
good agreement with both products. Statistical analysis
pointed out that WG measurements were more linearly
correlated to Level-3 ultra-high resolution SST-fnd
(R=0.89, RMSE=0.29, maximum discrepancy of 0.90°C)
than to Level-4 reprocessed data (R=0.86, RMSE=0.39,
maximum discrepancy of 1.29°C). On the other hand,
Level-3 values suffer the existence of data gaps due to bad
weather conditions (mainly persistent cloud cover) that
the optimal interpolation analysis applied to Level-4 prod-
ucts resolves without corrupting much the reliability of
SSTfnd information. These results confirm the potential
of the WG in giving back, at a refined spatial resolution,
SST patterns which are consistent with the ones observed
by satellite at a wider scale and coarser resolution.
CONCLUSIONS
The results derived by the WG mission performed be-
tween the 12th
and the 26th
of September 2012 in the South-
ern Tyrrhenian Sea, the first WG experiment in the
Southern Mediterranean region, showed the value of WG
measurements in the framework of a multiplatform, in situ
and satellite based, monitoring system of sea surface pa-
rameters. Nonetheless, they draw attention to the existence
of several limits in the combined use of satellite and WG
observations, stressing the necessity of further analyses
concerning the monitoring of the ocean optical properties.
Temperature, salinity, currents, CDOM, turbidity and
refined fuels were observed and monitored in the area
comprised between the Gulf of Naples and the Marsili
Seamount.
The variability observed along the WG cruise in terms
of water mass properties showed a decrease in tempera-
ture in agreement with expected variation due to the
changing weather conditions observed during the 15 days
survey. WG observations pointed out the presence of a
Fig. 13. Frequency distribution of MODIS SST data (purple line) overlapped on that of the corresponding WG data (red line).
N
on-com
m
ercialuse
only
32 Wave Glider experiment in the southern Tyrrhenian Sea
Fig. 14. Correlation between ±2 hours averaged WG SST data and MODIS SST products considering both day- and night-time data
(top); residuals diagram (bottom).
Fig. 15. Comparison between WG SST data (red line) and CMEMS Level-3 ultra-high resolution (blue line) and Level-4 reprocessed
SSTfnd products during the WG mission.
N
on-com
m
ercialuse
only
33G. Aulicino et al.
colder coastal water mass in the eastern part of the study
area and a typical coastal to open-sea haline gradient.
Most of the WG data were coupled with equivalent, or
near-equivalent, satellite measurements. Surface layer
currents and sea surface temperature compared well to
AVISO and MODIS information respectively, detecting a
general pattern of SSH and SST that remains quite stable
during the WG survey. The qualitative comparison be-
tween AVISO geostrophic velocities and ADCP currents
in the first 66 meters of the water column assessed the
presence of a fine correspondence between the two
datasets, confirming the usefulness of WG in observing
local surface ocean circulation. A correlation analysis be-
tween WG and MODIS co-located data confirmed that
WG information, even if acquired at 5.8 meters depth, can
be used in a first instance to provide information about
surface temperature variability. The results showed a cor-
relation coefficient of 0.76 (with a maximum discrepancy
of 0.7°C) and a good agreement was found overlapping
SST Probability Density Function distribution of MODIS
and WG data. Nevertheless, this study suffered from the
lack of continuous temperature measurements along the
very first meters of the water column. During subsequent
missions it would be useful to equipe the WG with a spe-
cific system (i.e., a chain of high resolution thermistors)
in order to complete and inter-validate surface tempera-
ture information provided by satellite (skin and sub-skin)
and CTD (subsurface) observations. Optical properties,
instead, were more challenging to interpret and the in situ
and remote sensed measurements were more poorly cor-
related. As for the turbidity, the absence of correlation
with MODIS products possibly indicate that the two sen-
sors were looking at different depths of investigation, or
at different scale of variability, for such a specific param-
eter. Finally, no significant traces of refined fuels have
been detected along the WG track. This implies the ne-
cessity to properly select testing areas (in order to include
a higher range of variation of fuel content in the testing
areas) to better asses WG C3 sensors sensitivity as well
as the satellite techniques used for wide scale monitoring
purposes. Moreover, the opportunity to relocate the C3
sensors in a proper position in order to avoid the direct ef-
fect of sunlight should be considered. Actually, LRI al-
ready dealt with some of these problems in the last few
years. Since this mission, WG technology moved to SV3
version mounting a pumped C3 fluorometer system which
limits most of the diurnal and bubbling issues seen in this
study. WG-SV3 has a lot more battery and propulsion ca-
pability too and give the users the opportunity to choice
an optional configuration with a thermistors chain that can
be attached to the subsurface board umbilical for measur-
ing the full depth of temperature in the surface ocean. It
is important to remark that C3 observations should always
be calibrated against measurements of chlorophyll-a from
water samples co-located with the fluorometer. Consider-
ing that such measurements are not practical during long
autonomous missions, WG users should find solution for
optimizing pre- and post-deployment calibrations (i.e.,
using formal computational algorithms for determining
drift in the sensor signal). Nonetheless, these results con-
firm the usefulness and the cost efficient strategy of a
combined monitoring that involves both satellites, classi-
cal oceanographic observations and autonomous vehicles.
In particular, a valuable strategy should involve large
scale satellite observations for monitoring the study re-
gion and identifying the precise target areas, where WGs
could realize high resolution observations with unique
critical time and length scales, more than providing vali-
dation dataset. On the other hand classical in situ meas-
urements, especially for optical properties, and modelling
products are still advisable for validation purposes. The
sensitivity to diel rhythms in WG fluorescence products
suggests that physiological information is possible to ob-
tain with the appropriate sensors and calibrations. As for
SST, statistical analysis pointed out also that WG meas-
urements were more linearly correlated to Level-3 ultra-
high resolution SST-fnd than to Level-4 reprocessed data.
The fine results concerning the monitoring of the surface
ocean currents achieved from the comparison between
WG ADCP and NEMO products demonstrate the useful-
ness of WGs and suggest their combined use as a possible
solution for achieving a large scale synoptic monitoring
of the small mesoscale surface circulation that usually
cannot be completely resolved by satellite altimetry. Ad-
ditional compared analyses between WG ADCP / CTD
data collected during this experiment and a dedicated
ultra-high-resolution model will also be performed in a
forthcoming study in order to better describe the southern
Tyrrhenian Sea circulation and hydrology. In that study,
WG ADCP data at single depths and full spatial resolution
will be coupled with co-located model data at the same
specific depths to obtain additional detailed information
about the advantages and the limits of the use of WGs in
evaluating and/or complementing model outputs.
ACKNOWLEDGMENTS
This study was performed in the framework of the
RITMARE (la Ricerca ITaliana per il MARE) Flagship
Project funded by the Italian Ministry of University and
Research. It has been also partly supported by the PO
FESR BASILICATA 2007-2013 in the framework of the
project IOnian Sea water quality MOnitoring by Satellite
data (IOSMOS). The altimeter products were produced
by Ssalto/Duacs and distributed by Aviso, with support
from Cnes (http://www.aviso.altimetry.fr/duacs/). MODIS
data were obtained from NASA/GSFC OCEANCOLOR
web site (http://oceancolor.gsfc.nasa.gov). We acknowl-
N
on-com
m
ercialuse
only
34 Wave Glider experiment in the southern Tyrrhenian Sea
edge the support provided by Liquid Robotics Inc. and
Communication Technology Srl for Wave Glider opera-
tions and piloting and the important contribution in the
analyses of MODIS products provided by Emanuele
Ciancia at National Research Council Institute of Method-
ologies for Environmental Analysis.
REFERENCES
Artale V, Astraldi M, Buffoni G, Gasparini GP, 1994. Seasonal
variability of gyre-scale circulation in the northern Tyrrhen-
ian sea. J. Geophys. Res. 99:14127-14137.
Astraldi M, Gasparini GP, 1994. The seasonal characteristics of
the circulation in the Tyrrhenian Sea. In: Seasonal and In-
terannual Variability of the Western Mediterranean Sea,
Coastal and Estuarine Studies, Geophys. Monogr., Amer.
Geophys. Union, 46:115-134.
Astraldi M, Gasparini GP, Sparnocchia S, Moretti M, Sansone
E, 1996. The characteristics of the water masses and the
water transport in the Sicily Channel at long time scales.
Bull. Instit. Oceanogr. 17:95-116
Astraldi M, Gasparini GP, Vetrano A, Vignudelli S, 2002. Hy-
drographic characteristics and interannual variability of
water masses in the central Mediterranean: a sensitivity test
for long-term changes in the Mediterranean Sea. Deep-Sea
Res. Pt. I 49:661-680.
Beatman L, Anderson T, Fong D, Jha R, 2013. Wave Glider®
In-
tegrated Sensor Validation Report: Teledyne RD Instruments
Workhorse Monitor ADCP. Technical Report, Copyright©
Liquid Robotics, Inc., Sunnyvale, CA, USA.
Brand LE, 1982. Persistent diel rhythms in the chlorophyll flu-
orescence of marine phytoplankton species. Mar. Biol.
69:253-262.
Briggs N, Perry MJ, Cetinic I, Lee C, D’Asaro E, Gray AM,
Rehm E, 2011. High-resolution observations of aggregate
flux during a sub-polar North Atlantic spring bloom. Deep-
Sea Res. Pt. I 58:1031-1039.
Budillon G, Gasparini GP, Schroeder K, 2009. Persistence of an
eddy signature in the central Tyrrhenian basin. Deep-Sea
Res. Pt. II 56:713-724.
Buongiorno Nardelli B, Tronconi C, Pisano A, Santoleri R,
2013. High and ultra-high resolution processing of satellite
sea surface temperature data over southern European Seas
in the framework of MyOcean project. Rem. Sens. Env.
129:1-16.
Casciello D, Lacava T, Pergola N, Tramutoli V, 2007. Robust
Satellite Techniques (RST) for oil spill detection and moni-
toring. Proc. IVInt. Workshop on the Analysis of Multitem-
poral Remote Sensing Images, Leuven, Belgium. IEEE, doi:
10.1109/multitemp.2007.4293040.
Casciello D, Lacava T, Pergola N, Tramutoli V, 2011. Robust
Satellite Techniques (RST) for oil spill detection and moni-
toring using AVHRR Thermal Infrared bands. Int. J. Remote
Sens. 32:4107-4129.
Chapman CC, Haidvogel DB, 1992. Formation of Taylor caps
over a tall isolated seamount in a stratified ocean. Geophys.
Astrophys. Fluid. Dyn. 64:31-65.
Cotroneo Y, Aulicino G, Ruiz S, Pascual A, Budillon G, Fusco
G, Tintoré J, (2015). Glider and satellite high resolution
monitoring of a mesoscale eddy in the Algerian basin: Eef-
fects on the mixed layer depth and biochemistry. J. Mar.
Syst. (In press). doi: 10.1016/j.jmarsys.2015.12.004
Fitzpatrick P, Lau Y, Moorhead R, Skarke A, Merritt D, Kreider
K, Brown C, Carlon R, Hine G, Lampoudi T, Leonardi AP,
2014. A review of the 2014 Gulf of Mexico Wave Glider
field program. Mar. Technol. Soc. J. 49:64-71.
Fusco G, Artale V, Cotroneo Y, Sannino G, 2008. Thermohaline
variability of Mediterranean Water in the Gulf of Cadiz,
1948-1999. Deep-Sea Res. Pt. I 55:1624-1638.
Fusco G, Manzella GMR, Cruzado A, Gacic M, Gasparini GP,
Kovacevic V, Millot C, Tziavos C, Velasquez ZR, Walne A,
Zervakis V, Zodiatis G, 2003. Variability of mesoscale fea-
tures in the Mediterranean Sea from XBT data analysis.Ann.
Geophys. 21:21-32.
Goebel NL, Frolov S, Edwards CA, 2014. Complementary use
of Wave Glider and satellite measurements: Description of
spatial decorrelation scales in Chl-a fluorescence across the
Pacific basin. Methods Oceanogr. 10:90-103.
Grimaldi CSL, Casciello D, Coviello I, Lacava T, Pergola N, Tra-
mutoli V, 2011a. An improved RST approach for timely alert
and Near Real Time monitoring of oil spill disasters by using
AVHRR data. Nat. Hazards Earth Syst. Sci. 11:1281-1291.
Grimaldi CSL, Coviello I, Lacava T, Pergola N, Tramutoli V,
2009a. Near real time oil spill detection and monitoring
using satellite optical data. Proc. Geoscience and Remote
Sensing Society Symp. IEEE International 2009 - IGARSS
2009, Cape Town, 4:709-712.
Grimaldi CSL, Coviello I, Lacava T, Pergola N, Tramutoli V,
2009b. RST-based oil spill detection and monitoring by
using optical data. pp. 323-330 in Proc. V Int. Workshop on
the Analysis of Multi-temporal Remote Sensing Images,
University of Connecticut, Storss.
Grimaldi CSL, Coviello I, Lacava T, Pergola N, Tramutoli V,
2011b.Anew RST-based approach for continuous oil spill de-
tection in TIR range: the case of the Deepwater Horizon plat-
form in the Gulf of Mexico. In: Y. Liu, A. Macfadyen, Z.-G.
Ji and R.H. Weisberg (eds), Monitoring and modeling the
Deepwater Horizon oil spill: a record-breaking enterprise.
American Geophysical Union, Washington, 195:19-31.
Hine R, Willcox S, Hine G, Richardson T, 2009. The Wave
Glider: A wave-powered autonomous marine vehicle. Proc.
of MTS/IEEE OCEANS 2009, Biloxi, MS.
Hopkins TS, 1988. Recent observations on the intermediate and
deep water circulation in the southern Tyrrhenian Sea.
Oceanologica Acta Special Issue (0399-1784):41-50.
Hu C, Lee Z, Franz, BA, 2012. Chlorophyll-a algorithms for
oligotrophic oceans: A novel approach based on three-band
reflectance difference. J. Geophys. Res. 117:C01011.
Iacono R, Napolitano E, Marullo S, Artale V, Vetrano A, 2013.
Seasonal variability of the Tyrrhenian Sea surface geostrophic
circulation as assessed by altimeter data. J. Phys. Oceanogr.
43:1710-1732.
Jacquet S, Prieur L, Avois-Jacquet C, Lennon JF, Vaulot D,
2002. Short-timescale variability of picophytoplankton
abundance and cellular parameters in surface waters of the
Alboran Sea (western Mediterranean). J. Plankton Res.
24:635-651.
Kilpatrick KA, Podestá G, Walsh S, Williams E, Halliwell V,
Szczodrak M, Brown OB, Minnett PJ, Evans R, 2015. A
N
on-com
m
ercialuse
only
35G. Aulicino et al.
decade of sea surface temperature from MODIS. Remote
Sens. Environ. 165:27-41.
Krivosheya VG, 1983. Water circulation and structure in the
Tyrrhenian Sea. Oceanology 23:166-171.
Krivosheya VG, Ovchinnikov IM, 1973. Peculiarities in the
geostrophic circulation of the water of the Tyrrhenian Sea.
Oceanology 13:822-827.
Le Traon PY, 2011. Satellites and operational oeanography. In:
A. Schiller and G.B. Brassington (eds.), Operational
oceanography in the 21st century. Springer-Verlag Berlin.
Marullo S, Santoleri R, Bignami F, 1994. The surface characteris-
tics of the Tyrrhenian Sea: Historical satellite data analysis. In:
Seasonal and Interannual Variability of the Western Mediter-
ranean Sea, Coastal and Estuarine Studies. Geophys. Monogr.
American Geophysical Union, Washington 46:135-154.
Millot C, 1987. Circulation in the Western Mediterranean Sea.
Oceanologica Acta 10:143-149.
Millot C, 1999. Circulation in the Western Mediterranean Sea.
J. Mar. Syst., 20:423-442.
Millot C, Candela J, Fuda JL, Tber Y, 2006. Large warming and
salinification of the Mediterranean outflow due to changes
in its composition. Deep-Sea Res. Pt. I 53:655-666.
MorelA, Gentili B, 2009.Asimple band ratio technique to quan-
tify the colored dissolved and detrital organic material from
ocean color remotely sensed data. Remote Sens. Environ.
113:998-1011.
Oddo P, Adani M, Pinardi N, Fratianni C, Tonani M, Pettenuzzo
D, 2009. A Nested Atlantic-Mediterranean Sea General Cir-
culation Model for Operational Forecasting. Ocean Sci. Dis-
cuss. 6:1093-1127.
O’Reilly JE O’Brien MC, Siegel DA, Toole D, Menzies D,
Smith RC, Mueller JL, Mitchell BG, Kahru M, Chavez FP,
Strutton P, Cota GE, Hooker SB, McClain CR, Carder KL,
Harding L, Magnuson A, Phinney D, Moore GE, Aiken J,
Arrigo KR, Letelier R, Culver M, 2000. SeaWiFS post-
launch calibration and validation analyses, Part 3. NASA
Technical Memorandum 2000-206892, vol. 11., NASA
Goddard Space Flight Center: 49 pp.
Pascual A, Pujol MI, Larnicol J, LeTraon PY, Rio MH, 2007.
Mesoscale mapping capabilities of multisatellite altimeter
missions: first results with real data in the Mediterranean
Sea. J. Mar. Syst. 65:190-211.
Pierini S, Simioli A, 1998. A wind-driven circulation model for
the Tyrrhenian sea area. J. Mar. Syst. 18:161-178.
Poulain PM, Zambianchi E, 2007. Near surface circulation in
the central Mediterranean Sea as deduced from Lagrangian
drifters in the1990s. Cont. Shelf Res. 27:981-1001.
Rinaldi E, Buongiorno Nardelli B, Zambianchi E, Santoleri R,
Poulain PM, 2010. Lagrangian and Eulerian observations of
the surface circulation in the Tyrrhenian Sea. J. Geophys.
Res. 115:C04024.
Rio MH, Poulain PM, Pascual A, Mauri E, Larnicol G, Santoleri
R, 2007.AMean Dynamic Topography of the Mediterranean
Sea computed from altimetric data, in-situ measurements and
a general circulation model. J. Mar. Syst. 65:484-508.
Teledyne, 2011. Acoustic Doppler Current Profiler principle of
operation – A practical primer. Teledyne, Poway: 56 pp.
Tramutoli V, 2007. Robust Satellite Techniques (RST) for Nat-
ural and environmental hazards monitoring and mitigation:
theory and applications. Proc. IV Int. Workshop on the
Analysis of Multitemporal Remote Sensing Images, Leuven,
Belgium. IEEE, doi: 10.1109/multitemp.2007.4293057
Verron J, Le Provost C, 1985. A numerical study of a quasi-
geostrophic flow over isolated topography. J. Fluid Mech.
154:231-252.
Vignudelli S, Cipollini P, Reseghetti F, Fusco G, Gasparini GP,
Manzella GMR, 2003. Comparison between XBT data and
TOPEX/Poseidon satellite altimetry in the Ligurian-
Tyrrhenian area. Ann. Geophys. 21:123-135.
Villareal TA, Wilson C, 2014.AComparison of the Pac-X Trans-
Pacific Wave Glider Data and Satellite Data (MODIS,
Aquarius, TRMM and VIIRS). PLoSONE 9:e96968.
Willcox S, Meinig C, Sabine C, Lawrence-Slavas N, Richardson
T, Hine R, Manley J, 2009. An autonomous mobile platform
for underway surface carbon measurements in open-ocean
and coastal waters, p. 1-8. Proc. Conf. MTS/IEEE Oceans
2009, Biloxi.
Wunsch C, 1997. The vertical partition of oceanic horizontal ki-
netic energy. J. Phys. Oceanogr. 27:1770-1794.
N
on-com
m
ercialuse
only

More Related Content

What's hot

History slideshowonline
History slideshowonlineHistory slideshowonline
History slideshowonline
LynnCorliss
 
Marmara Earthquakes - 2000 yrs
Marmara Earthquakes - 2000 yrsMarmara Earthquakes - 2000 yrs
Marmara Earthquakes - 2000 yrs
Ali Osman Öncel
 
Field Geology Report_R
Field Geology Report_RField Geology Report_R
Field Geology Report_R
R. J. Cannata
 
Coastal zones – seismic vulnerability an analysis from east coast of india
Coastal zones – seismic vulnerability an analysis from east coast of indiaCoastal zones – seismic vulnerability an analysis from east coast of india
Coastal zones – seismic vulnerability an analysis from east coast of india
eSAT Publishing House
 
Introduction submarine topography & geomorphology
Introduction submarine topography & geomorphologyIntroduction submarine topography & geomorphology
Introduction submarine topography & geomorphology
naruto0932
 
ba_senechal_ics2013
ba_senechal_ics2013ba_senechal_ics2013
ba_senechal_ics2013
Antoine BA
 
A new look to the yemeni geology based on new solutions to the most chaotic y...
A new look to the yemeni geology based on new solutions to the most chaotic y...A new look to the yemeni geology based on new solutions to the most chaotic y...
A new look to the yemeni geology based on new solutions to the most chaotic y...
Dr. Eng. Mohammed Darsi Abdulrahman Nedham
 

What's hot (18)

Simulation of tsunami generation, propagation and coastal inundation in the E...
Simulation of tsunami generation, propagation and coastal inundation in the E...Simulation of tsunami generation, propagation and coastal inundation in the E...
Simulation of tsunami generation, propagation and coastal inundation in the E...
 
Geological interpretation of a low-backscatter anomaly found on the New Jerse...
Geological interpretation of a low-backscatter anomaly found on the New Jerse...Geological interpretation of a low-backscatter anomaly found on the New Jerse...
Geological interpretation of a low-backscatter anomaly found on the New Jerse...
 
Engineering geology
Engineering geologyEngineering geology
Engineering geology
 
History slideshowonline
History slideshowonlineHistory slideshowonline
History slideshowonline
 
ÖNCEL AKADEMİ: İSTANBUL DEPREMİ
ÖNCEL AKADEMİ: İSTANBUL DEPREMİÖNCEL AKADEMİ: İSTANBUL DEPREMİ
ÖNCEL AKADEMİ: İSTANBUL DEPREMİ
 
OBS Seismicity Monitoring in Marmara
OBS Seismicity Monitoring in  MarmaraOBS Seismicity Monitoring in  Marmara
OBS Seismicity Monitoring in Marmara
 
Geological fieldwork report
Geological fieldwork reportGeological fieldwork report
Geological fieldwork report
 
Marmara Earthquakes - 2000 yrs
Marmara Earthquakes - 2000 yrsMarmara Earthquakes - 2000 yrs
Marmara Earthquakes - 2000 yrs
 
GPS Slip Rates
GPS Slip RatesGPS Slip Rates
GPS Slip Rates
 
Sedimentology and Paleoenvironment of Deposition of the Deba-Fulani Member of...
Sedimentology and Paleoenvironment of Deposition of the Deba-Fulani Member of...Sedimentology and Paleoenvironment of Deposition of the Deba-Fulani Member of...
Sedimentology and Paleoenvironment of Deposition of the Deba-Fulani Member of...
 
The Ocean Bottom Seismometer
The Ocean Bottom SeismometerThe Ocean Bottom Seismometer
The Ocean Bottom Seismometer
 
Application of Ocean Bottom Seismometer in Studying Marine Seismicity
Application of Ocean Bottom Seismometer in Studying Marine SeismicityApplication of Ocean Bottom Seismometer in Studying Marine Seismicity
Application of Ocean Bottom Seismometer in Studying Marine Seismicity
 
Field Geology Report_R
Field Geology Report_RField Geology Report_R
Field Geology Report_R
 
Sea Level Changes as recorded in nature itself
Sea Level Changes as recorded in nature itselfSea Level Changes as recorded in nature itself
Sea Level Changes as recorded in nature itself
 
Coastal zones – seismic vulnerability an analysis from east coast of india
Coastal zones – seismic vulnerability an analysis from east coast of indiaCoastal zones – seismic vulnerability an analysis from east coast of india
Coastal zones – seismic vulnerability an analysis from east coast of india
 
Introduction submarine topography & geomorphology
Introduction submarine topography & geomorphologyIntroduction submarine topography & geomorphology
Introduction submarine topography & geomorphology
 
ba_senechal_ics2013
ba_senechal_ics2013ba_senechal_ics2013
ba_senechal_ics2013
 
A new look to the yemeni geology based on new solutions to the most chaotic y...
A new look to the yemeni geology based on new solutions to the most chaotic y...A new look to the yemeni geology based on new solutions to the most chaotic y...
A new look to the yemeni geology based on new solutions to the most chaotic y...
 

Viewers also liked

Conflictes i desigualtats
Conflictes i desigualtatsConflictes i desigualtats
Conflictes i desigualtats
Eduard Costa
 
Towards a sociology of energy and globalization
Towards a sociology of energy and globalizationTowards a sociology of energy and globalization
Towards a sociology of energy and globalization
Alina Gilmanova
 
MasterDiplomaCivilEngineerAdrianSaftoiu
MasterDiplomaCivilEngineerAdrianSaftoiuMasterDiplomaCivilEngineerAdrianSaftoiu
MasterDiplomaCivilEngineerAdrianSaftoiu
Adrian Saftoiu
 

Viewers also liked (14)

facebook
facebookfacebook
facebook
 
YOUSEAME - Service Providers Pack
YOUSEAME - Service Providers PackYOUSEAME - Service Providers Pack
YOUSEAME - Service Providers Pack
 
Conflictes i desigualtats
Conflictes i desigualtatsConflictes i desigualtats
Conflictes i desigualtats
 
Caracteristicas de un líder
Caracteristicas de un líderCaracteristicas de un líder
Caracteristicas de un líder
 
Sustainable future through innovation
Sustainable future through innovationSustainable future through innovation
Sustainable future through innovation
 
Industry commitment to collaborate in policy formalisation, implementation an...
Industry commitment to collaborate in policy formalisation, implementation an...Industry commitment to collaborate in policy formalisation, implementation an...
Industry commitment to collaborate in policy formalisation, implementation an...
 
IATA global cargo update
IATA global cargo updateIATA global cargo update
IATA global cargo update
 
Towards a sociology of energy and globalization
Towards a sociology of energy and globalizationTowards a sociology of energy and globalization
Towards a sociology of energy and globalization
 
MasterDiplomaCivilEngineerAdrianSaftoiu
MasterDiplomaCivilEngineerAdrianSaftoiuMasterDiplomaCivilEngineerAdrianSaftoiu
MasterDiplomaCivilEngineerAdrianSaftoiu
 
ΠΟΛΕΜΙΚΑ ΠΛΟΙΑ
ΠΟΛΕΜΙΚΑ ΠΛΟΙΑΠΟΛΕΜΙΚΑ ΠΛΟΙΑ
ΠΟΛΕΜΙΚΑ ΠΛΟΙΑ
 
Population dynamics of the periwinkle Littorina littorea (Linnaeus, 1758) in ...
Population dynamics of the periwinkle Littorina littorea (Linnaeus, 1758) in ...Population dynamics of the periwinkle Littorina littorea (Linnaeus, 1758) in ...
Population dynamics of the periwinkle Littorina littorea (Linnaeus, 1758) in ...
 
ΤΑ ΤΕΙΧΗ
ΤΑ ΤΕΙΧΗΤΑ ΤΕΙΧΗ
ΤΑ ΤΕΙΧΗ
 
Prosperitat, crisi i depressió
Prosperitat, crisi i depressióProsperitat, crisi i depressió
Prosperitat, crisi i depressió
 
Αρχές Φιλοσοφίας 7.1
Αρχές Φιλοσοφίας 7.1Αρχές Φιλοσοφίας 7.1
Αρχές Φιλοσοφίας 7.1
 

Similar to 5682-21911-4-PB

ES 1010, Earth Science 1 Course Learning Outcomes for.docx
 ES 1010, Earth Science 1 Course Learning Outcomes for.docx ES 1010, Earth Science 1 Course Learning Outcomes for.docx
ES 1010, Earth Science 1 Course Learning Outcomes for.docx
aryan532920
 
Remote Sensing Techniques for Oceanography Satelitte and In Situ Observations
Remote Sensing Techniques for Oceanography Satelitte and In Situ ObservationsRemote Sensing Techniques for Oceanography Satelitte and In Situ Observations
Remote Sensing Techniques for Oceanography Satelitte and In Situ Observations
A.Tuğsan İşiaçık Çolak
 
PRIMERA EVIDENCIA DE DEPÓSITOS DE PALEO-TSUNAMIS DE UN GRANDE ACONTECIMIENTO ...
PRIMERA EVIDENCIA DE DEPÓSITOS DE PALEO-TSUNAMIS DE UN GRANDE ACONTECIMIENTO ...PRIMERA EVIDENCIA DE DEPÓSITOS DE PALEO-TSUNAMIS DE UN GRANDE ACONTECIMIENTO ...
PRIMERA EVIDENCIA DE DEPÓSITOS DE PALEO-TSUNAMIS DE UN GRANDE ACONTECIMIENTO ...
Facultad de Ciencias Naturales, Universidad de Guayaquil
 
Moin CR Italy_Gath LR
Moin CR Italy_Gath LRMoin CR Italy_Gath LR
Moin CR Italy_Gath LR
Eldon Gath
 
XHAB1_Kudela__Roberts_2003
XHAB1_Kudela__Roberts_2003XHAB1_Kudela__Roberts_2003
XHAB1_Kudela__Roberts_2003
phyto
 

Similar to 5682-21911-4-PB (20)

ES 1010, Earth Science 1 Course Learning Outcomes for.docx
 ES 1010, Earth Science 1 Course Learning Outcomes for.docx ES 1010, Earth Science 1 Course Learning Outcomes for.docx
ES 1010, Earth Science 1 Course Learning Outcomes for.docx
 
Marmara Sea: Deep Seismic Survey
Marmara Sea: Deep Seismic SurveyMarmara Sea: Deep Seismic Survey
Marmara Sea: Deep Seismic Survey
 
Antarctic climate history and global climate changes
Antarctic climate history and global climate changesAntarctic climate history and global climate changes
Antarctic climate history and global climate changes
 
WOIMSA_conference
WOIMSA_conferenceWOIMSA_conference
WOIMSA_conference
 
Physical Oceanography
Physical  OceanographyPhysical  Oceanography
Physical Oceanography
 
Remote Sensing Techniques for Oceanography Satelitte and In Situ Observations
Remote Sensing Techniques for Oceanography Satelitte and In Situ ObservationsRemote Sensing Techniques for Oceanography Satelitte and In Situ Observations
Remote Sensing Techniques for Oceanography Satelitte and In Situ Observations
 
Speleothems Ppt
Speleothems PptSpeleothems Ppt
Speleothems Ppt
 
2.10 Tectonostratigraphy framework and paleo
2.10 Tectonostratigraphy framework and paleo2.10 Tectonostratigraphy framework and paleo
2.10 Tectonostratigraphy framework and paleo
 
PRIMERA EVIDENCIA DE DEPÓSITOS DE PALEO-TSUNAMIS DE UN GRANDE ACONTECIMIENTO ...
PRIMERA EVIDENCIA DE DEPÓSITOS DE PALEO-TSUNAMIS DE UN GRANDE ACONTECIMIENTO ...PRIMERA EVIDENCIA DE DEPÓSITOS DE PALEO-TSUNAMIS DE UN GRANDE ACONTECIMIENTO ...
PRIMERA EVIDENCIA DE DEPÓSITOS DE PALEO-TSUNAMIS DE UN GRANDE ACONTECIMIENTO ...
 
Marmara Sea: Çınarcık Basin
Marmara Sea: Çınarcık BasinMarmara Sea: Çınarcık Basin
Marmara Sea: Çınarcık Basin
 
Marmara Geodetical Hazard
Marmara Geodetical HazardMarmara Geodetical Hazard
Marmara Geodetical Hazard
 
Internship Report
Internship Report  Internship Report
Internship Report
 
Moin CR Italy_Gath LR
Moin CR Italy_Gath LRMoin CR Italy_Gath LR
Moin CR Italy_Gath LR
 
XHAB1_Kudela__Roberts_2003
XHAB1_Kudela__Roberts_2003XHAB1_Kudela__Roberts_2003
XHAB1_Kudela__Roberts_2003
 
Physical oceanography
Physical oceanographyPhysical oceanography
Physical oceanography
 
Applications of satellite in marine process
Applications of satellite in  marine processApplications of satellite in  marine process
Applications of satellite in marine process
 
A Case Study In Coastal Flooding Analysis
A Case Study In Coastal Flooding AnalysisA Case Study In Coastal Flooding Analysis
A Case Study In Coastal Flooding Analysis
 
Lilas_poster
Lilas_posterLilas_poster
Lilas_poster
 
Kim Cobb's Borneo stalagmite talk - AGU 2015
Kim Cobb's Borneo stalagmite talk - AGU 2015Kim Cobb's Borneo stalagmite talk - AGU 2015
Kim Cobb's Borneo stalagmite talk - AGU 2015
 
Discussion of Barnett et al. 2006
Discussion of Barnett et al. 2006Discussion of Barnett et al. 2006
Discussion of Barnett et al. 2006
 

5682-21911-4-PB

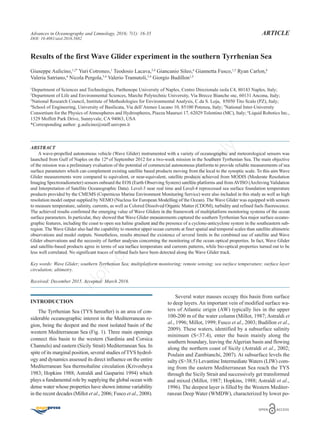
  • 1. Advances in Oceanography and Limnology, 2016; 7(1): 16-35 ARTICLE DOI: 10.4081/aiol.2016.5682 INTRODUCTION The Tyrrhenian Sea (TYS hereafter) is an area of con- siderable oceanographic interest in the Mediterranean re- gion, being the deepest and the most isolated basin of the western Mediterranean Sea (Fig. 1). Three main openings connect this basin to the western (Sardinia and Corsica Channels) and eastern (Sicily Strait) Mediterranean Sea. In spite of its marginal position, several studies ofTYS hydrol- ogy and dynamics assessed its direct influence on the entire Mediterranean Sea thermohaline circulation (Krivosheya 1983; Hopkins 1988; Astraldi and Gasparini 1994) which plays a fundamental role by supplying the global ocean with dense water whose properties have shown intense variability in the recent decades (Millot et al., 2006; Fusco et al., 2008). Several water masses occupy this basin from surface to deep layers. An important vein of modified surface wa- ters of Atlantic origin (AW) typically lies in the upper 100-200 m of the water column (Millot, 1987; Astraldi et al., 1996; Millot, 1999; Fusco et al., 2003; Budillon et al., 2009). These waters, identified by a subsurface salinity minimum (S<37.4), enter the basin mainly along the southern boundary, leaving theAlgerian basin and flowing along the northern coast of Sicily (Astraldi et al., 2002; Poulain and Zambianchi, 2007). At subsurface levels the salty (S>38.5) Levantine Intermediate Waters (LIW) com- ing from the eastern Mediterranean Sea reach the TYS through the Sicily Strait and successively get transformed and mixed (Millot, 1987; Hopkins, 1988; Astraldi et al., 1996). The deepest layer is filled by the Western Mediter- ranean Deep Water (WMDW), characterized by lower po- Results of the first Wave Glider experiment in the southern Tyrrhenian Sea Giuseppe Aulicino,1,2* Yuri Cotroneo,1 Teodosio Lacava,3,4 Giancanio Sileo,4 Giannetta Fusco,1,5 Ryan Carlon,6 Valeria Satriano,4 Nicola Pergola,3,4 Valerio Tramutoli,3,4 Giorgio Budillon1,5 1 Department of Sciences and Technologies, Parthenope University of Naples, Centro Direzionale isola C4, 80143 Naples, Italy; 2 Department of Life and Environmental Sciences, Marche Polytechnic University, Via Brecce Bianche snc, 60131 Ancona, Italy; 3 National Research Council, Institute of Methodologies for Environmental Analysis, C.da S. Loja, 85050 Tito Scalo (PZ), Italy; 4 School of Engineering, University of Basilicata, Via dell’Ateneo Lucano 10, 85100 Potenza, Italy; 5 National Inter-University Consortium for the Physics of Atmospheres and Hydrospheres, Piazza Mauruzi 17, 62029 Tolentino (MC), Italy; 6 Liquid Robotics Inc., 1329 Moffett Park Drive, Sunnyvale, CA 94063, USA *Corresponding author: g.aulicino@staff.univpm.it ABSTRACT A wave-propelled autonomous vehicle (Wave Glider) instrumented with a variety of oceanographic and meteorological sensors was launched from Gulf of Naples on the 12th of September 2012 for a two-week mission in the Southern Tyrrhenian Sea. The main objective of the mission was a preliminary evaluation of the potential of commercial autonomous platforms to provide reliable measurements of sea surface parameters which can complement existing satellite based products moving from the local to the synoptic scale. To this aim Wave Glider measurements were compared to equivalent, or near-equivalent, satellite products achieved from MODIS (Moderate Resolution Imaging Spectroradiometer) sensors onboard the EOS (Earth Observing System) satellite platforms and fromAVISO (Archiving Validation and Interpretation of Satellite Oceanographic Data). Level-3 near real time and Level-4 reprocessed sea surface foundation temperature products provided by the CMEMS (Copernicus Marine Environment Monitoring Service) were also included in this study as well as high resolution model output supplied by NEMO (Nucleus for European Modelling of the Ocean). The Wave Glider was equipped with sensors to measure temperature, salinity, currents, as well as Colored Dissolved Organic Matter (CDOM), turbidity and refined fuels fluorescence. The achieved results confirmed the emerging value of Wave Gliders in the framework of multiplatform monitoring systems of the ocean surface parameters. In particular, they showed that Wave Glider measurements captured the southern Tyrrhenian Sea major surface oceano- graphic features, including the coast to open sea haline gradient and the presence of a cyclone-anticyclone system in the southeastern sub- region. The Wave Glider also had the capability to monitor upper ocean currents at finer spatial and temporal scales than satellite altimetric observations and model outputs. Nonetheless, results stressed the existence of several limits in the combined use of satellite and Wave Glider observations and the necessity of further analyses concerning the monitoring of the ocean optical properties. In fact, Wave Glider and satellite-based products agree in terms of sea surface temperature and currents patterns, while bio-optical properties turned out to be less well correlated. No significant traces of refined fuels have been detected along the Wave Glider track. Key words: Wave Glider; southern Tyrrhenian Sea; multiplatform monitoring; remote sensing; sea surface temperature; surface layer circulation; altimetry. Received: December 2015. Accepted: March 2016. N on-com m ercialuse only
  • 2. 17G. Aulicino et al. tential temperature (θ<13.0°C) and salinity (S<38.5), en- tering the TYS through the deep part of the Sardinia-Sicily section (Millot 1999). The relatively weak dynamics within the deep layer and the presence of gyre structures (Astraldi and Gasparini, 1994) result in mixing processes between LIW and WMDW, with the consequent forma- tion of a peculiar water mass (named Tyrrhenian Deep Water) positioned below 1000 m depth (Hopkins, 1988; Millot, 1999; Budillon et al., 2009). The general TYS circulation is cyclonic along the boundaries, according to the general Mediterranean circu- lation, but several closed structures can be detected both in the northern and in the southern regions of the basin (Fig. 1). In the surface layer, these structures are mainly driven by wind and its spatial variability, especially in the northern and central TYS. Some quasi-permanent features characterize the western part of the basin: a wide cyclonic area frequently observed southeast of Sardinia and a cy- clonic-anticyclonic system just east of the Bonifacio Strait (Astraldi and Gasparini, 1994; Millot, 1999; Vignudelli et al., 2003; Budillon et al., 2009). The southern part of the basin is more influenced by the recirculation processes oc- curring at its meridional openings, as confirmed by the analyses of drifter trajectories presented by Rinaldi et al. (2010). These processes are mainly driven by steric level gradients existing between TYS and neighboring basins. Classical studies (Astraldi and Gasparini, 1994; Marullo et al., 1994; Fusco et al., 2003) suggest that the summer circulation is completely different from that of winter, with transition periods occurring in May-June and September- October. In particular, during winter a basin-scale cyclonic cell drives surface waters (AW) from the south up to the Ligurian Sea (Fig. 1a). During summer, indeed, the TYS basin is isolated from the rest of the Mediterranean Sea by intense thermohaline fronts (Fig. 1b). The resulting circu- lation has a more fragmentary pattern: the cyclonic centers intensify, the AW flow weakens and the presence of addi- tional eddies in the eastern TYS is favored. Over the years, the presence of gyre structures in both seasons has been extensively described using in situ data (Krivosheya and Ovchinnikov, 1973) as well as satellite sea surface temperature (SST) images (Marullo et al., 1994) and altimetry data (Vignudelli et al., 2003).All these studies reported the presence of quasi-permanent and in- termittent cold and warm structures even if only few de- tailed works exist about their formation and evolution Fig. 1. Southern TYS general features for winter (a) and summer (b) periods. TYS main openings are the Corsica Channel, the Sardinia Channel and the Sicily Strait. Shading indicates bathymetry and arrows indicate the main patterns of surface (AW, red) and intermediate (LIW, grey) waters. Dashed ovals schematize the quasi-permanent features of the TYS circulation: the cyclonic-anticyclonic system in front of the Bonifacio Strait and the cyclonic circulation between Sardinia and Sicily. The location of the Marsili Seamount (MS) is also reported on the map. N on-com m ercialuse only
  • 3. 18 Wave Glider experiment in the southern Tyrrhenian Sea (Artale et al., 1994; Pierini and Simioli, 1998). In recent years, Rio et al. (2007) showed the presence of a basin wide cyclonic circulation and some large recirculation cells from altimeter, in situ and model data, while Iacono et al. (2013) identified nine vortices in the eastern TYS, that appear to be robust features of the circulation, on the basis of Sea LevelAnomaly (SLA) andAbsolute Dynamic Topography (ADT) maps. Also, the drifter data analyzed by Rinaldi et al. (2010) gave a significant contribution sug- gesting the presence of a strong and recurrent anticyclonic circulation offshore of the Gulf of Naples, the prevalence of an anticyclonic circulation near the northern coast of Sicily and the persistence of a cyclonic gyre that extends until 40°N in the southeastern TYS. In spite of its great importance, the role played by the mean flow and the high variability of the TYS topography, including the presence of several seamounts, is still largely unknown. Previous studies in the central TYS (Budillon et al., 2009) and pre-existent laboratory and nu- merical modelling simulations (Verron and Le Prevost, 1985; Chapman and Haidvogel, 1992) indicate this effect as a possible cause of the presence and persistence of ed- dies in the region. In this context, the possibility to com- plement wide-scale satellite observations with in-situ measurements collected at higher space-time density, can be of paramount importance in order to better investigate and model processes developing in the TYS at very dif- ferent space-time scales. The main purpose of this work is to present the results of the first Wave Glider (hereafter WG) experiment in the southern part of the TYS, a mission carried out between the 12th and the 26th September 2012 in the framework of the RITMARE (La Ricerca ITaliana per il MARE - The Italian research at sea) project. This experiment, based on the use of a SV2 Liquid Robotics WG, allowed us to per- form a remotely-guided surface monitoring of the TYS region embedded between the Gulf of Naples and the Marsili Seamount (Fig. 1). The WG campaign was per- formed during the central weeks of September in order to partially fill the lack of in situ information concerning the transition period between summer and winter conditions. The advantages of using an unmanned maritime vehi- cle (UMV) like the WG are many. Although they do not completely substitute oceanographic ship cruises, au- tonomous ocean observing systems (e.g., UMVs, AUVs, floats, etc.) collect, via electronic or optical sensors, a wide range of in situ data, stored or transmitted directly to shore, providing high resolution insights of oceano- graphic properties and dynamics from basin-scale to sub- mesoscale (Cotroneo et al., 2015) with lower cost compared with the use of research vessels (Villareal and Wilson, 2014). In particular, WGs allow fine scale spatial and temporal continuous measurements, easy and almost immediate deployment at short notice, as well as near real time track changes to make observations of unexpected and interesting phenomena at sea. Also, WG data can help to evaluate satellite product accuracy, can be used to com- plement other in situ information or can be used to cali- brate and validate ocean models. At present, the most crucial limitation of WGs is the lack of depth profiles and of synoptic coverage over long distances due to limited speed (Goebel et al., 2014). In this study, data collected by the WG were coupled to a substantial satellite dataset in order to assess the func- tionality of the WG over the southern TYS and assess the capability of its in situ observations to complement, at a refined spatial scale, existing satellite products. Moreover, ocean current data collected by the WG have been com- pared with surface circulation output derived from an hy- drodynamic model for the Mediterranean Sea. The paper is organized as follows. In section 2, WG settings and data are described, as well as the large set of satellite and model products included in this work. In section 3, results inferred from the WG dataset and the satellite/model de- rived information are analyzed. The TYS features de- tected by both platforms are discussed considering their combination and inter-comparison. Results are summa- rized in section 4 where some directions of future work are also indicated. METHODS Wave Glider data The WG (Fig. 2) is an unmanned maritime vehicle (UMV) unique in its ability to harness ocean wave energy for platform propulsion. This autonomous sampling sys- tem uses a series of wings located on a sub-body at 5.8 meters below the surface to propel the vehicle forward using the vertical motion induced by wave motion, inde- pendently of wave direction. The wave energy propulsion system is purely mechanical.As waves pass by on the sur- face, the submerged glider acts as a tug, pulling the sur- face float along a predetermined course (Wilcox et al., 2009). There is substantial power available in ocean waves so that WG harnesses part of this power to maintain an average forward speed from 0.4 to 1.5 knots, depend- ing on sea state (Hine et al., 2009). This energy can be used for locomotion to reach any point of interest as well as for station keeping once that position is reached. The vehicle consists of a low-profile surface float equipped with solar panels that provide power for the sampling systems, navigation systems (GPS satellite transmissions) and satellite telemetry links (Iridium® Satellite). The subsurface board is connected to the sur- face payload by a tether (umbilical). Real time communi- cation with the shore-based operator allows monitoring of platform location and data gathering. N on-com m ercialuse only
  • 4. 19G. Aulicino et al. The Liquid Robotics Inc. (LRI) WG-SV2 involved in this study supported four sampling systems: an Airmar PB200 weather station collecting air temperature, baromet- ric pressure, wind speed, wind gust speed, and wind direc- tion at one meter height; a Turner Designs C3 submersible fluorometer equipped to measure Colored Dissolved Or- ganic Matter (CDOM), refined fuels concentration and tur- bidity; a pumped Seabird Electronics Glider Payload Conductivity, Temperature, Depth (CTD) sensor; an Acoustic Doppler Current Profiler (ADCP) WorkHorse Monitor by Teledyne/RD Instruments operating at 300 kHz (Fig. 2). Tab. 1 gives an overview of the main WG charac- teristics and capabilities.Additional information is available from the LRI webpage (http://liquid-robotics.com). The weather station is based on ultrasonic technology with wind corrections for pitch and motion based on a three-axis compass, yaw-rate gyro and GPS information. The wind sensor anemometer measures 0 - 360° wind ve- locity between -360° wind velocity between 0 and 40 m s–1 with a resolution of 0.1° and 0.1 m s–1 and an accuracy of 2-8° and 0.5-2.5 m s–1 (the worst in occurrence of wet conditions). The temperature sensor ranges between - 25°C and 55°C (with a resolution of 0.1°C and an accu- racy of ±1.0°C) while the atmospheric pressure sensor ranges between 850 and 1150 mbar (with a resolution of 0.1 mbar and an accuracy of ±2 mbar). CDOM, refined fuels and turbidity measured by the C3 system are reported in Relative Fluorescence Units (RFU). A conversion of RFU values into practical units is possible according to the C3 pre- and post-deployment standard calibrations of the fluorometer sensor provided by LRI. In particular, the C3 system has been calibrated using naphthalene for the refined fuels channel, quinine sulfate for the CDOM and 3000 Nephelometric Turbidity Units (NTU) for the turbidity. Nonetheless, it is important to be aware that the used reagents could be not represen- tative of what exact fluorescing species are in the water column where the instrument is actually placed. Moreover fluorometer sensors, of the type similar to the one used on WGs, demonstrate drift over time and require frequent calibration for a proper conversion from RFU to practical units (Goebel et al., 2014). Unfortunately, during this de- ployment WG optical observations have not been cali- brated against measurements of chlorophyll-a concentration chemically extracted from co-located water samples in order to overpass these issues. Consequently, in this work RFU values have been used for the three channels (i.e., CDOM, refined fuels and turbidity) in place of part per billion (ppb) of standard units. This avoids any possible misinterpretation of observed data during RFU to concentration conversion. The Seabird CTD acquires with an accuracy of 0.003 mS cm–1 for conductivity, 0.002°C for sea temperature and 0.1 dbar for pressure. The sampling interval for the Fig. 2. Wave Glider main instrumentations (red) and components (green). N on-com m ercialuse only
  • 5. 20 Wave Glider experiment in the southern Tyrrhenian Sea weather data was 10 min, while for the CTD and the C3 sensors it was 60 and 120 s respectively. The ADCP system has a compass resolution of 0.01° (accuracy of ±2°) and was set for investigating several depths (at 6, 10, 16, 26, 46 and 66 meters) with a current velocity resolution of 0.1 cm s–1 (accuracy of 0.5% of meas- ured velocity ±0.5 cm s–1 ). These averaged depths (also called bins) are the effective centers of cell size of 4 meters each. For conversion of bins to actual depth values, a draught of 0.25 m was applied for the distance of theADCP below the water surface. Please note that the observations at 6 meters depth have not been included in this study be- cause of contamination of the data in the upper water layers by the WG driving mechanism (placed at 5.8 meters depth). Pulses were averaged into ensembles at a time interval of 120 seconds and corrected for the motion of the vehicle. The ensemble averaging reduces random errors and bias as suggested by Fitzpatrick et al. (2014) and previously de- tailed in Teledyne (2011). The motion correction was done by estimating the velocity of the vehicle during each en- semble, using the GPS coordinates recorded at the begin- ning and end of each ensemble period. The calculated WG velocity is then subtracted from the ensemble to provide an estimate of the actual current velocity. According to Beat- man et al. (2013), additional post-processing operations ex- cluded data while the WG was turning, that means while the vehicle has a heading change of more than 30° between two 120 seconds averaged samples. All the data collected by WG were stored onboard and relayed via satellite link to LRI. In this study, subsets of data from the CTD sensors, the C3 sensors, the ADCP system and the weather instrumentation are examined. Data referring to periods when the WG was out of the water, identified through negative CTD pressure values (indicative of depth), were eliminated. Before being processed, all the measurements contained in these sub- sets were averaged in ten minutes ensembles (Fitzpatrick et al., 2014). A comparison with the full resolution datasets was performed to avoid any lack of information. Satellite data Satellite sea surface temperature and ocean color data The WG data were compared with Sea Surface Tem- perature (SST), chlorophyll concentration and Kd490 (the diffuse attenuation coefficient for downwelling irradiance at 490-nm, which is a good proxy for turbidity) products from MODIS. In detail we used products at different pro- cessing levels depending on the specific investigation we carried out. Eight days composite MODIS (Moderate Res- olution Imaging Spectroradiometer) AQUA Level 3 SST maps at 4 km of spatial resolution were used to describe the quasi-synoptic conditions of the enquired area during the WG mission. Daily Level 2 Ocean Color (OC) and SST products at 1 km resolution, generated after each Terra and Aqua MODIS acquisition, were used for an al- most punctual match-up with the WG data. MODIS OC and SST products available for the WG mission were downloaded from the NASA Ocean Color portal (http://oceancolor.gsfc.nasa.gov). Several OC geophysical variables were analyzed: chlorophyll concentration (chlor-a) derived through OCI algorithm (Hu et al., 2012), chlorophyll concentration (chlor-ocx) derived through OC3 algorithm (O’Reilly et al., 2000) and diffuse attenu- ation coefficient of downwelling radiative flux (Kd_490). Also the information about CDOM is provided by NASA Ocean Color portal, but in terms of a dimensionless index representing its excess (or deficit) with respect to its av- erage value, chlorophyll-a dependent, in a specific area Tab. 1. Wave Glider main characteristics and capabilities. Physical carachteristics Configuration Submerged glider connected to a surface float by a tether Dimensions Float: 2.1 m x 0.6 m Glider: 1.9 m x 0.4 m Wings: 1.1 m total width Weight and buoyancy About 75 Kg, 150 kg displacement Endurance Up to 1 year Capabilities and functionality Propulsion Wave energy Speed >0.5 kt in Sea state 1; >1.5 kt in Sea state 3 Battery 86 W solar panel charging a 665 Wh Li-on battery pack Payload power About 10 W continuous Comunication systems Iridium Satellite modem; RF Modem Navigation systems 12 channel, WAAS enabled GPS; Compass Emergency devices Light and RF beacon N on-com m ercialuse only
  • 6. 21G. Aulicino et al. (Morel and Gentili 2009). For this reason, the CDOM index is not directly comparable to the collected WG data and was not further analyzed in this paper. Nonetheless, as discussed in section 3.2, WG CDOM measurements were compared with OC chlor-a and -ocx data in order to evaluate the contribution of CDOM dynamics to the MODIS chlorophyll observations. Daily MODIS images were used for the match-up with the WG data. Such an operation was made by averaging all glider data within a ±2 h temporal window in correspon- dence of usable MODIS data. In Tab. 2 the number of im- ages available for the test area is reported. The Earth Observing System satellites constellation provided about two images per day. Concerning SST, both diurnal and night-time data have been used in this paper, allowing a more robust comparison from a statistical point of view. Moreover, several sea surface foundation temperature (SSTfnd) products, which includes diurnal variation cor- rection, were compared with WG SST observations. In par- ticular, Level-3 near real time and Level-4 reprocessed products provided by the CMEMS (Copernicus Marine En- vironment Monitoring Service) were included in this study. Daily Level-3 adjusted SSTfnd ultra high resolution prod- ucts are operationally produced and distributed on a 0.01° X 0.01° grid over the Mediterranean Sea by the Istituto di Scienze dell Atmosfera e del Clima - Gruppo di Oceanografia da Satellite (CNR ISAC-GOS). This dataset is made of single daily super-collated images which are ob- tained by merging different Level-3 images retrieved from several sensors. Differences among the sensors (number of bands, spectral resolution, scanning/viewing geometry, etc.) and/or discrepancies due to the different algorithms applied to retrieve brightness temperature are adjusted through the use of best measure algorithms which keeps into account the continuity of the data present in the single image for each pixel (Buongiorno Nardelli et al., 2013). High reso- lution Level-4 reprocessed daily gap-free maps of SSTfnd are delivered by CNR ISAC-GOS on a regular 0.0417° X 0.0417° grid over the Mediterranean Sea. This product is based on the optimal interpolation of AVHRR Pathfinder (version 5.2) dataset (http://pathfinder.nodc.noaa.gov) using an adapted algorithm which chooses the proper co- variance models for each specific area (Buongiorno Nardelli et al., 2013). Datasets, products specifications and quality information are available at http://marine.coperni- cus.eu. Matlab, Ocean Data View, SEADAS and Quantum GIS were used to analyze and visualize the processed OC, SST and SSTfnd data. Satellite sea level data High-quality altimeter data over the TYS area have been used to investigate specific aspects of the surface cir- culation during the WG mission period. Satellite altimetry data were provided by AVISO (Archiving Validation and Interpretation of Satellite Oceanographic data, http://www.aviso.altimetry.fr/en/data.html). In particular, ‘all sat merged’ multi-mission maps of SLA and Geostrophic VelocityAnomalies, as well as ‘all sat merged’ maps ofADT and absolute geostrophic velocities were used to describe the basin scale circulation of the study area. The entire dataset is available on a 1/8° X 1/8° regular Cartesian grid and results from the merging process of all missions available at a given time. Consequently, this series is better in quality but not homogeneous over the time period. Grid- ded sea surface heights (SSH) and corresponding geostrophic velocity anomalies are computed with respect to a twenty-year mean (1993-2012). The twenty year ref- erence period is also used for gridded SSH above geoid and corresponding absolute geostrophic velocities. ADT has been computed as the sum of SLA and mean dynamic to- pography (SMDT-MED-2014). Anyway, it is important to remark that the altimeter data do not provide information on the circulation at the sea surface, which is dominated by high frequency wind forcing, but the signal is an integrated one which reflects the motion of the main pycnocline (Wunsch, 1997), i.e. the region of transition between the AW and the LIW. This region is quite shallow in the TYS (100-200 meters maximum depth) so that its motion is ex- pected to dominate the geostrophic dynamics of the surface layer. The horizontal resolution of SLAmaps is insufficient to identify most of eddies with sizes smaller than thirty kilo- meters, even if Pascual et al. (2007) indicates that merging data from at least three altimeter missions is sufficient for a correct monitoring of the mesoscale circulation of the Mediterranean Sea and that four may resolve circulation features with sizes significantly smaller than 1/8°. We can therefore expect that eddies with a size of about 100 km, or slightly smaller, could be sufficiently resolved over most of the dataset (Iacono et al., 2013). Modeled horizontal velocity data High resolution physical reanalysis over the TYS pro- vided by INGV (Istituto Nazionale di Geofisica e Vul- canologia) were used to enrich the study of the surface Tab. 2. Number of MODIS products available for the investi- gated area during the WG mission (i.e., 12-26 September 2012). MODIS SST_LAC_L2 available products Day Night Aqua 21 21 Terra 20 26 MODIS OC_LAC_L2 available products Aqua 21 Terra 19 N on-com m ercialuse only
  • 7. 22 Wave Glider experiment in the southern Tyrrhenian Sea circulation during the WG mission period. Daily mean modeled horizontal velocity (meridional and zonal com- ponent) data, derived from version 3.2 of the Ocean Gen- eral Circulation Model code supplied by Nucleus for European Modelling of the Ocean-Ocean Parallelise (hereafter NEMO), were included in this study. The hy- drodynamic model has a horizontal grid resolution of 0.0625° X 0.0625° (about 6-7 km) and 72 unevenly spaced vertical levels (Oddo et al., 2009). The NEMO model is initialized at the 1st January 1985 with two years of spin-up. It is located in the Mediterranean Basin but also extend into the Atlantic in order to better resolve the exchanges with the Atlantic Ocean at the Strait of Gibral- tar. Ocean model data output from a single consistent ded- icated ocean dynamic model forced by consistent reprocessed historical observational data (surface winds, heat, and freshwater), assimilating consistent reprocessed historical observational data (in situ temperature and salinity, satellite altimetry). The model is forced by mo- mentum, water and heat fluxes interactively computed by bulk formulae using the 6-h, 0.75° horizontal-resolution ERA-Interim reanalysis fields from the ECMWF (Euro- pean Centre for Medium-Range Weather Forecasts). The water balance is computed as Evaporation minus Precip- itation and Runoff (considering ERA-Interim precipita- tions at 6-h, 0.75° horizontal-resolution, evaporation derived from the latent heat flux and monthly mean runoff provided by the Climate Prediction Centre Merged Analy- sis of Precipitation and the Global Runoff Data Centre datasets. In this study, WG ADCP observations have been compared to co-located (in space and time) NEMO daily mean horizontal velocities in the 11 levels between 11.55 and 66.45 m depth. RESULTS AND DISCUSSION The WG cruise lasted 14 days covering a great part of the southern TYS (Fig. 3a). According to the structure of other in situ datasets and basing on up to date knowledge of basin dynamics, the collected data should be split into different subsets to guarantee their synoptic representa- tion. The entire September 2012 WG dataset has been di- vided into three main legs: i) the first leg (L1 – red line in Fig. 3a) from the 12th to the 15th includes the southward cruise from the Gulf of Naples to the 38.8°N; ii) the sec- ond (L2 – green line in Fig. 3a) from the 15th to the 22nd concerns the monitoring of the Marsili Seamount sub-re- gion; iii) the third (L3 – blue line in Fig. 3a) from the 22nd to the 26th corresponds to the northward cruise back to the Gulf of Naples. This fragmentation of the data also re- flects the effective cruise sampling plan, with two long meridional transects across the Southern TYS and one in- tense sampling area located over the Marsili Seamount. The analyses of collected data includes in situ obser- vations that belong to three main groups: i) seawater phys- ical properties data (T/S); ii) currents intensity and direc- tion; iii) turbidity, CDOM and refined fuel concentrations. Sea water physical properties and currents The potential temperature (θ) versus salinity (S) dia- gram (Fig. 3b) summarizes the hydrological characteris- tics of the TYS surface layer observed by the WG during the overall mission (at a mean depth of about 5.8 m). This near-surface layer is characterized by the presence of a relatively warm and salty water showing θ values greater than 23°C (with a maximum of 25.8°C) and salinities spanning between 37.9 and 38.4. This surface water mass is strongly influenced by the summer weather conditions and is known to occupy the upper mixed layer on top of the underlying fresher and colder AW core. The variation in the water masses properties during the two weeks survey, shows a decrease in temperature along the WG cruise. In fact, coastal waters near the Gulf of Naples observed at the beginning of the cruise (A sub- set in Fig. 3b) show higher potential temperatures than waters occupying the same position on the 26th September (D subset), while their S values remain almost unchanged. Asimilar temperature gradient (≈2°C) is evident for B and C data subsets, corresponding to the first (southward) and last (northward) transects respectively. Again, their S val- ues are almost unchanged. On the other hand, changes in salinity are evident moving from subset A to B and from C to D, reflecting a typical coastal to open-sea haline gra- dient. The observed decrease in water temperature is in agreement with the expected variation due to the changing weather conditions during the 15 days cruise over the large study area and is consistent with the frontal structure described later in this section. However, using information retrieved from satellite datasets, it is possible to observe that during the entire mission, the general pattern of SST and SSH remains al- most unchanged suggesting a possible use of the WG data as a whole quasi-synoptic dataset. SST maps obtained by MODIS AQUA level-3 composites on 8 days for the pe- riods from the 13th to the 28th of September 2012, show the evolution of a zonal SST gradient that lasts for the en- tire WG cruise (Fig. 4). Even as a general decrease in SST values is observed during the 16 days, the development and the persistence of a strong SST zonal gradient at about 40°N latitude are evident. This evolution could be par- tially explained by the verified presence of a large scale low atmospheric pressure centre over the study area dur- ing the 14th and the 15th of September. These conditions were reported also in the weather data collected by the WG, as a lowering in air pressure and temperature starting from the 12th of September (Fig. 5). This atmospheric front hauled very cold air from Northern Europe over the southern TYS, influencing the sea surface layer tempera- N on-com m ercialuse only
  • 8. 23G. Aulicino et al. ture (hereafter SLT) during the following days. Another evidence of the stability of the spatial patterns during the entire cruise can be confirmed by maps of SLA and ADT data with associated geostrophic currents, all provided by AVISO. Observing both variables is necessary because sometimes structures appearing in the SLA maps cannot be unequivocally associated with specific circulation fea- tures (Iacono et al., 2013). Information on the height change associated with the satellite observed mean circu- lation, called Mean Dynamic Topography (MDT), is needed to remove possible ambiguities. Adding the MDT to the SLA yields the ADT maps. Nonetheless, the MDT reconstruction has its own limitations and uncertainties which may locally obscure the information contained in the SLA especially in areas, such as the Mediterranean Sea, in which the circulation displays a strong seasonal cycle. Comparing the SLA and the ADT maps is indeed the solution to avoid any wrong interpretation. Daily ADT and SLA maps, plotted every 3 days from the 11th to the 26th of September (Fig. 6 a and b, respec- tively), show the stable presence of a dipolar structure over the study area. Both parameters report a low sea level core that is identified in the eastern part of the basin, durably associated to two high sea level structures. The larger one is located near the northern coasts of Sicily while the second one lies at about 40°N/14°E, just west of the low SLA previously described. In terms of circulation, two strong anticyclonic struc- tures are located north of Sicily and off the Campania coast, sometimes combined into a unique wider gyre dur- ing the studied period. Along the Calabria coast a weaker cyclonic cell is noted, usually embedded between the two western anticyclones. The spatial pattern described by SSH, SST and in situ WG data is consistent with typical September-October features of southeastern TYS circu- lation described through model simulations and seasonal Fig. 3. Map (a) and θ/S diagram (b) for the entire WG mission from the 12th to the 26th of September 2012. WG track (blue line) and main heading (white arrows) are indicated. Correspondence between sub-regions and water masses properties is shown through capital letters. WG track color indicates L1 (red), L2 (green) and L3 (blue). N on-com m ercialuse only
  • 9. 24 Wave Glider experiment in the southern Tyrrhenian Sea Fig. 4. MODIS AQUA level 3 SST maps (°C) obtained by composites on 8 days for the periods 13th to 20th (a) and 21st to 28th (b) Sep- tember 2012. WG track is superposed (black line). Fig. 5. Air pressure (y-axis) and air temperature (color-scale) data collected by the WG weather station during the entire mission (12th to 26th September 2012 on x-axis). Fig. 6. Daily maps of AVISO Sea Level Anomaly (a) and Absolute Dynamic Topography (b), with superposed associated geostrophic velocities, in the southern TYS plotted every 3 days between the 11th and the 26th of September 2012. Campania, Calabria and Sicily re- gions are identified by squared numbers in Fig. 7. N on-com m ercialuse only
  • 10. 25G. Aulicino et al. SLA and ADT maps (Iacono et al., 2013) as well as in previous studies based on cruise (Kryvosheya and Ovchinnikov, 1973) and drifter (Rinaldi et al., 2010) data. The persistence of these structures and associated currents leads to the generation of a frontal area separat- ing the different cores. In particular, the low sea level area near the Italian coast is separated from the northern high sea level structure by a strong gradient in ADT that reflects the SST gradient shown by MODIS satellite (Fig. 4) and WG data. Their persistence over the studied period might suggest that the observed eddies are not de- pendent on local forcing (i.e., weather conditions) and had a remote origin. A qualitative comparison between AVISO ADT infor- mation and WG ADCP currents averaged over the sam- pled depths (10 m, 16 m, 26 m, 46 m and 66 m) showed the presence of a fine correspondence between the two datasets. In Fig. 7 WG mean currents collected along the three transects have been superposed over the mean alti- metric ADT map for the studied period. WG data have been subsampled to 1/5 for a better graphical representa- tion. ADCP data describe well the main anticyclonic structure identified from altimetry along the L1 (between 40°N and 39.5°N at 14°E) and confirm the presence (be- tween 14°E and 14.7°E at 38.8°N) of a consistent west to east current, flowing in the southwest corner of the L2, which hauls waters from the northern coast of Sicily. The edge of the eastern cyclonic vortex visible in the ADT maps is also identified by the counterclockwise velocities observed by WG in the northeastern edge of the L2 area (at 39.4°N/14.7°E). The observation of colder and fresher waters in this area (see also Fig. 10) is probably linked to the presence of the persistent cyclonic gyre already de- scribed off the Italian coast, and possibly to the associated upwelling processes. As stated before, these observations are totally consistent with previous eastern TYS circula- tion analyses confirming the presence of a persistent cy- clonic vortex located at around 39.5°N 14.6°E (Rinaldi et al., 2010; Iacono et al., 2013). Furthermore, high resolution WG mean currents have been compared to co-located 1/8° resolution altimeter geostrophic velocities in order to assess the general cur- rent pattern of the study area. Fig. 8 compares: (a) WG ADCP mean currents in the layer between 10 m and 66 m depths and AVISO geostrophic velocities; and report their (b) zonal and (c) meridional components. Both dataset have been smoothed with a window-144 (corre- sponding to the number of WG current daily samples) running mean for a better graphical representation. When discussing these results, it is important to remark that the WG ADCP gives information concerning the mean cur- rent of the top 66 meters, while the altimeter provides an integrated current of the whole layer above the main py- cnocline. This implies that WG data are partially influ- enced by ageostrophic dynamics due to wind. Near inertial currents, Ekman currents and internal tides all par- tially contribute to the observed in situ velocity too. Also, AVISO daily currents are post-processed products opti- mally interpolated with a time-decorrelation scale of two weeks whileADCP provides instantaneous data. Nonethe- less, Fig. 8 shows that WG and altimetry observe a similar current pattern with a general fine correspondence, except than in part of the last transect of the WG campaign (L3). The analysis of the u and v components point out the ex- pected higher resolution (smalls scales) captured by WG observations and a good correlation between the two dataset in terms of zonal and meridional components. Maximum differences between WG and satellite current components are 0.18 m s–1 and 0.12 m s–1 for u and v re- spectively. Nevertheless, a better correlation is remarkable in u component. The differences noticed in L3 seems to be linked to a different behavior of the meridional com- ponents. As stated above, it is important to remark that all data represented in Fig. 8 have been smoothed with a win- dow-144 filter. Since WG recorded an average platform velocity of about 0.9 knots, this implies a spatial smooth- ing at about 40 km. Nevertheless, WG ADCP is able to resolve finer spatial scales as clearly visible in Fig. 7 and Fig. 7. Mean map of AVISO Absolute Dynamic Topography (color scale) for the 12th to 26th September period, with superposed corresponding WG in situ mean currents collected by ADCP be- tween -10 m and -66 m depths (black arrows). Squared numbers identify Campania (1), Calabria (2) and Sicily (3) regions. N on-com m ercialuse only
  • 11. 26 Wave Glider experiment in the southern Tyrrhenian Sea in the unfiltered u and v series (not shown). All these re- sults confirm the importance of AVISO information in de- scribing large scale patterns as well as the usefulness of WG in resolving small scale and local features of the ocean surface circulation. A preliminary comparison between WG observations and Mediterranean Sea model output has been performed in order to confirm these results. ADCP measurements have been compared to co-located (in space and time) NEMO model daily mean horizontal velocities derived in the water column layer included between 11.55 and 66.45 m depth (Fig. 9a). Zonal (u) and meridional (v) compo- nents are compared in Fig. 9 b and 9c, respectively. Datasets (both smoothed with a window-144 running mean) show an excellent correlation except in L1 where v components seems to be opposite in phase. Neverthe- less, v components show a general better agreement and a lower maximum discrepancy (0.14 m s–1 versus 0.19 m s–1 ) than u components. These results demonstrate the benefits of WGs in evaluating and/or complementing model outputs and suggest their combined use as a possi- ble solution for achieving a large scale synoptic monitor- ing of the small mesoscale surface circulation that usually cannot be completely resolved by satellite altimetry. In this overall scenario, even when merging in situ data from different places and time along the mission track, WG dataset seems to offer a reliable picture of the general physical pattern of the area (Fig. 10). WG SLT Fig. 8. Comparison between local WG mean currents (red) and altimeter geostrophic velocities at 1/8° resolution (blue). WG ADCP mean currents in the layer between 10 m and 66 m depths and AVISO geostrophic velocities (a), and their zonal (b) and meridional (c) components are reported. N on-com m ercialuse only
  • 12. 27G. Aulicino et al. observations collected from the 12th to the 26th of Septem- ber describe the presence of a cold water vein in the east- ern part of the study area with a low SLT core at 23.7°C (Fig. 10a). This relatively cold water is separated from a warmer water mass by a frontal structure located between 40.2°N at 14.2°E and 39.3°N at 15.0°E. Furthermore, two warm SLT cores at 25.6°C and 25.3°C are observed at 40.0°N/14.0°E and 39.1°N/14.0°E respectively. According to the θ-S diagram, Figure 10b points out the presence of a coast to open-sea haline gradient be- tween the coastal area located north of 40.3°N/14.0°E (salinity core at 38.1) and the open-sea region south of 40.0°N (salinity values higher than 38.2). As expected, lower values are observed inside the Gulf of Naples where rivers and inland supplies reduce the surface layer salinity down to 38.0. On the contrary, saltier waters are identified at the end of L1 where S values higher than 38.3 have been observed by the WG. This water mass possibly be- longs to the external edge of the anticyclonic gyre persist- ently observed along the northern Sicilian coast (Fig. 6). Focusing on the Marsili Seamount sub-region (L2), we can distinguish interesting saltier/warmer and fresher/ colder water masses in the proximity of the southwestern and northeastern edges respectively (Fig. 10). Along the L3, fresher waters are observed in the area around 40.0°N/14.4°E. Fig. 9. Comparison between local WG mean currents (red) and modeled currents at 1/16° resolution (black). WG ADCP mean currents in the layer between 10m and 66m depths and NEMO model currents in the same layer (a), and their zonal (b) and meridional (c) com- ponents are reported. N on-com m ercialuse only
  • 13. 28 Wave Glider experiment in the southern Tyrrhenian Sea Sea water optical properties The Turner C3 fluorometer observations are more challenging to interpret. Collected data are summarized in Fig. 11 where surface layer CDOM (a), refined fuels concentration (b) and turbidity (c) maps are shown in terms of RFU. As expected, a qualitative analysis of these data shows that a negative gradient is present for all the enquired parameters when the WG moves from inside the Gulf of Naples to open-sea. This is observed during both L1 and L3. No other significant patterns are evident along the WG track for CDOM and refined fuels concentrations, except for the relatively higher values observed in the northeastern corner of the Marsili Seamount sub-region, in correspondence of the cyclone-anticyclone system edge. As for the turbidity, the presence of a regional pat- tern similar to what observed in terms of surface circula- tion (see Figs. 7 and 10) is identified. Lower turbidity values are found where lower SLT and the cyclone struc- ture have been observed, higher ones where the anticy- clonic systems persist. Nonetheless, in these data it is possible to identify the well-known diel cycle linked to chlorophyll fluorescence (Brand, 1982; Jacquet et al., 2002). Time series of CDOM and refined fuels show a sinusoidal behavior that is in phase with night-day turnover (not shown). Diel signal is more evident in CDOM dataset for almost the entire sam- pling period and, as expected, the diurnal maximum was in the form of increased positive scatter. Anyway, the de- sign of the WG used for this mission supported a C3 sen- sor that is not protected from direct sunlight (i.e., in a pipe) and hence that can be influenced by shadow vari- ability from the surface board. This causes a very high noise in the CDOM and refined fuels series. Our initial concept for C3 dataset was to use spiking in the turbidity data as a proxy for large particulate aggregates (Briggs et al., 2011; Villareal and Wilson, 2014). The turbidity data contains a certain amount of spiking suggestive of possi- ble large particles, especially along the first leg of the WG mission. Highest values were registered in the proximity of the Gulf of Naples both at the beginning and the end of the mission (not shown). However, the C3 sensor re- sponds to bubbles as well. This is a possible additional source of noise because many microbubbles are usually generated along the bottom of the float. For this reason, these spikes have been removed during the quality check procedures. There are several layers of complexity asso- ciated with comparing WG fluorescence and OC data, e.g. the pronounced diel rhythm identified in the collected data and the difference between surface and optical depth Fig. 10. Temperature (a) and salinity (b) overall mission WG observations collected between the 12th and the 26th of September 2012 along WG track (marked line). N on-com m ercialuse only
  • 14. 29G. Aulicino et al. measurements (Villareal and Wilson, 2014). In general, the patterns observed in the satellite and WG datasets were in agreement (not shown) but calibration problems suggest caution in use of the fluorescence data. In partic- ular, WG CDOM observations show a linear correlation of R=0.85 and R=0.80 with co-located (in space and time) OC chlor-a and chlor-ocx products respectively. Actually, CDOM and chlorophyll are different parameters but they both absorb light in the same spectral range so that it is difficult to differentiate between the two. The former ab- sorbs light and decreases reflectance in the visible portion of the spectrum, especially in the blue region, while the latter strongly absorbs red and blue light and reflects green. This is the reason why water color usually changes from green at coastal region with higher chlorophyll and CDOM concentration to blue in deep waters where chlorophyll is the mainly water constituent. The correla- tion results achieved in this study confirm the importance of understanding the relative contribution of chlorophyll and CDOM dynamics to correctly detect trends in phyto- plankton production. Even though turbidity and refined fuel do not have a direct satellite equivalent, an attempt was done to compare WG data with MODIS derived information. WG turbidity data were compared with the Kd490 MODIS product which provides information about how strongly the light intensity is attenuated within the water column. It is di- rectly related to the presence of scattering particles, either organic or inorganic, in the water column and thus it could give an indication of water clarity or of the water column turbidity.After selecting OC MODIS products suitable for the comparison, only 9 (among the 40 available) images passed the quality check (mostly because of the presence of clouds) and a very poor correlation was found (R=0.07) among MODIS based Kd490 product and WG turbidity measurements. This seems to indicate, for such a specific parameter, that the in situ and remote sensors are looking at dissimilar objects. A different depth of investigation and/or a small scale variability, that MODIS is not able to capture, could explain these results. It should be also un- derlined that, by its design, the WG is propelled at the sur- face like a surfboard and bubbles of all sizes will roll along the bottom of the float. As stated before, microbub- bles are of particular concern since they will not rapidly ascend and are likely to represent a source of noise for the turbidity WG parameter (Villareal and Wilson 2014). As for the comparison between WG refined fuels data and MODIS satellite products, the RST-OIL approach (Casciello et al., 2007, 2011, Grimaldi et al., 2009a, 2009b, 2011a, 2011b) was applied. Results showed that no intense oil spills were observed in either the WG data or the satellite observations. Sea surface temperature Among the parameters acquired by WG which could have been compared with satellite data, the SST is the only one that offered a major opportunity to be analyzed in details because both the technologies are able to pro- vide comparable information. First of all, it should be stressed that the measurements acquired by WG refer more to a bulk SST than a skin one. As already said, the CTD probe is located below the float, providing an information that is referred as an average at Fig. 11. CDOM (a) Refined fuels (b) and turbidity (c) overall mission observations collected by C3 sensor between the 12th and the 26th of September 2012 along the WG track (marked line). Values are expressed in terms of Relative Fluorescence Units (RFU). N on-com m ercialuse only
  • 15. 30 Wave Glider experiment in the southern Tyrrhenian Sea 5.8 m depth. On the other hand, the information provided by MODIS refer to a layer less than 1 mm thick at the ocean surface (Kilpatrick et al., 2015), namely to the skin temperature. Taking into account such a difference and the very short time duration of cruise (with a few MODIS passes all masked by clouds mainly during the first leg), the comparison has been mainly addressed to understand the potential of the WG in providing useful information about SST variability at a refined spatial scale. In Fig. 12a the WG SST variation along its path is reported. Looking at this image, it is possible to note that SST variations at short-time scale are almost negligible, apart from two small portions acquired during the first leg of and at the end of the mission. Furthermore, it is also possible to see the daily SST variability, better high- lighted in Fig. 12b where WG SST data distribution is reported. In this figure, a clear separation between the night-time (colder) data and the warmer day-time meas- urements is observable, with a larger range of variability (almost 2°C) for diurnal data respect to the night-time ones (about 1.3°C). MODIS SST has been computed everywhere regard- less the presence of clouds and marked with a quality flag (QF) indicating the accuracy of the SST information. To avoid cloud and cloud-edge pixel contamination in the following analysis, only MODIS SST data characterized by a small possibility of cloud presence (i.e.,QF≤1) have been considered. MODIS products which passed this filter have been co-located on the WG path (red segments in Fig. 12c). During such an operation, taking into account the above mentioned small variability of the WG SST at short-time scale, SST MODIS and WG SST temporal av- erage computed in a time window of ±2 hours respect to the MODIS time acquisition have been compared. For this reason, MODIS data are represented by several red seg- ments. In addition, the different lengths of the segments highlight the variable numbers of measurements acquired at changing speeds by the WG during the mission. Unfor- Fig. 12. SST variation as measured by WG during the mission (a) and its frequency distribution (b). In (c) the subsets where it was pos- sible to perform the comparison between MODIS SST product and WG data are indicated with red segments along the WG path. N on-com m ercialuse only
  • 16. 31G. Aulicino et al. tunately, as already said, no useful MODIS SST products were available during most of L1. In Fig. 13 the SST Probability Density Function distri- butions of MODIS (purple line) and corresponding WG data (red line) have been compared. A good agreement between the two series is observed as well as a discrimination be- tween day-time and night-time data and a similar variability. This result was further confirmed by carrying out a correla- tion analysis between WG and satellite products (Fig. 14). A coefficient of correlation (R) of 0.76 was achieved (RMSE=0.41°C), with a maximum discrepancy of 0.7°C. Nonetheless, it is important to remark that SST is a challenging parameter to define precisely as the upper ocean (i.e., the first 10 m) has a complex and variable ver- tical temperature structure that is related to ocean turbu- lence and air-sea fluxes of heat, moisture and momentum. This is important to be considered when comparing (or merging) observations made by different satellites and in situ instruments that measures temperatures at depth of 10-20 µm (skin SST) and few meters (or centimeters) re- spectively. On the other hand, temperatures at all depths collapse to the same value before local sunrise. This value, free of diurnal temperature variability, is namely the SSTfnd, i.e. the temperature at the first time of the day when the heat gain from the solar radiation absorption ex- ceeds the heat loss at the sea surface (Le Traon, 2011). Thus, WG SST measurements (red line) were compared with co-located (in space and time) CMEMS Level-3 near real time (blue line) and Level-4 reprocessed (black line) SSTfnd information (Fig. 15). All the datasets were smoothed with a window-144 (the number of analyzed WG daily samples) running mean. Results show a very good agreement with both products. Statistical analysis pointed out that WG measurements were more linearly correlated to Level-3 ultra-high resolution SST-fnd (R=0.89, RMSE=0.29, maximum discrepancy of 0.90°C) than to Level-4 reprocessed data (R=0.86, RMSE=0.39, maximum discrepancy of 1.29°C). On the other hand, Level-3 values suffer the existence of data gaps due to bad weather conditions (mainly persistent cloud cover) that the optimal interpolation analysis applied to Level-4 prod- ucts resolves without corrupting much the reliability of SSTfnd information. These results confirm the potential of the WG in giving back, at a refined spatial resolution, SST patterns which are consistent with the ones observed by satellite at a wider scale and coarser resolution. CONCLUSIONS The results derived by the WG mission performed be- tween the 12th and the 26th of September 2012 in the South- ern Tyrrhenian Sea, the first WG experiment in the Southern Mediterranean region, showed the value of WG measurements in the framework of a multiplatform, in situ and satellite based, monitoring system of sea surface pa- rameters. Nonetheless, they draw attention to the existence of several limits in the combined use of satellite and WG observations, stressing the necessity of further analyses concerning the monitoring of the ocean optical properties. Temperature, salinity, currents, CDOM, turbidity and refined fuels were observed and monitored in the area comprised between the Gulf of Naples and the Marsili Seamount. The variability observed along the WG cruise in terms of water mass properties showed a decrease in tempera- ture in agreement with expected variation due to the changing weather conditions observed during the 15 days survey. WG observations pointed out the presence of a Fig. 13. Frequency distribution of MODIS SST data (purple line) overlapped on that of the corresponding WG data (red line). N on-com m ercialuse only
  • 17. 32 Wave Glider experiment in the southern Tyrrhenian Sea Fig. 14. Correlation between ±2 hours averaged WG SST data and MODIS SST products considering both day- and night-time data (top); residuals diagram (bottom). Fig. 15. Comparison between WG SST data (red line) and CMEMS Level-3 ultra-high resolution (blue line) and Level-4 reprocessed SSTfnd products during the WG mission. N on-com m ercialuse only
  • 18. 33G. Aulicino et al. colder coastal water mass in the eastern part of the study area and a typical coastal to open-sea haline gradient. Most of the WG data were coupled with equivalent, or near-equivalent, satellite measurements. Surface layer currents and sea surface temperature compared well to AVISO and MODIS information respectively, detecting a general pattern of SSH and SST that remains quite stable during the WG survey. The qualitative comparison be- tween AVISO geostrophic velocities and ADCP currents in the first 66 meters of the water column assessed the presence of a fine correspondence between the two datasets, confirming the usefulness of WG in observing local surface ocean circulation. A correlation analysis be- tween WG and MODIS co-located data confirmed that WG information, even if acquired at 5.8 meters depth, can be used in a first instance to provide information about surface temperature variability. The results showed a cor- relation coefficient of 0.76 (with a maximum discrepancy of 0.7°C) and a good agreement was found overlapping SST Probability Density Function distribution of MODIS and WG data. Nevertheless, this study suffered from the lack of continuous temperature measurements along the very first meters of the water column. During subsequent missions it would be useful to equipe the WG with a spe- cific system (i.e., a chain of high resolution thermistors) in order to complete and inter-validate surface tempera- ture information provided by satellite (skin and sub-skin) and CTD (subsurface) observations. Optical properties, instead, were more challenging to interpret and the in situ and remote sensed measurements were more poorly cor- related. As for the turbidity, the absence of correlation with MODIS products possibly indicate that the two sen- sors were looking at different depths of investigation, or at different scale of variability, for such a specific param- eter. Finally, no significant traces of refined fuels have been detected along the WG track. This implies the ne- cessity to properly select testing areas (in order to include a higher range of variation of fuel content in the testing areas) to better asses WG C3 sensors sensitivity as well as the satellite techniques used for wide scale monitoring purposes. Moreover, the opportunity to relocate the C3 sensors in a proper position in order to avoid the direct ef- fect of sunlight should be considered. Actually, LRI al- ready dealt with some of these problems in the last few years. Since this mission, WG technology moved to SV3 version mounting a pumped C3 fluorometer system which limits most of the diurnal and bubbling issues seen in this study. WG-SV3 has a lot more battery and propulsion ca- pability too and give the users the opportunity to choice an optional configuration with a thermistors chain that can be attached to the subsurface board umbilical for measur- ing the full depth of temperature in the surface ocean. It is important to remark that C3 observations should always be calibrated against measurements of chlorophyll-a from water samples co-located with the fluorometer. Consider- ing that such measurements are not practical during long autonomous missions, WG users should find solution for optimizing pre- and post-deployment calibrations (i.e., using formal computational algorithms for determining drift in the sensor signal). Nonetheless, these results con- firm the usefulness and the cost efficient strategy of a combined monitoring that involves both satellites, classi- cal oceanographic observations and autonomous vehicles. In particular, a valuable strategy should involve large scale satellite observations for monitoring the study re- gion and identifying the precise target areas, where WGs could realize high resolution observations with unique critical time and length scales, more than providing vali- dation dataset. On the other hand classical in situ meas- urements, especially for optical properties, and modelling products are still advisable for validation purposes. The sensitivity to diel rhythms in WG fluorescence products suggests that physiological information is possible to ob- tain with the appropriate sensors and calibrations. As for SST, statistical analysis pointed out also that WG meas- urements were more linearly correlated to Level-3 ultra- high resolution SST-fnd than to Level-4 reprocessed data. The fine results concerning the monitoring of the surface ocean currents achieved from the comparison between WG ADCP and NEMO products demonstrate the useful- ness of WGs and suggest their combined use as a possible solution for achieving a large scale synoptic monitoring of the small mesoscale surface circulation that usually cannot be completely resolved by satellite altimetry. Ad- ditional compared analyses between WG ADCP / CTD data collected during this experiment and a dedicated ultra-high-resolution model will also be performed in a forthcoming study in order to better describe the southern Tyrrhenian Sea circulation and hydrology. In that study, WG ADCP data at single depths and full spatial resolution will be coupled with co-located model data at the same specific depths to obtain additional detailed information about the advantages and the limits of the use of WGs in evaluating and/or complementing model outputs. ACKNOWLEDGMENTS This study was performed in the framework of the RITMARE (la Ricerca ITaliana per il MARE) Flagship Project funded by the Italian Ministry of University and Research. It has been also partly supported by the PO FESR BASILICATA 2007-2013 in the framework of the project IOnian Sea water quality MOnitoring by Satellite data (IOSMOS). The altimeter products were produced by Ssalto/Duacs and distributed by Aviso, with support from Cnes (http://www.aviso.altimetry.fr/duacs/). MODIS data were obtained from NASA/GSFC OCEANCOLOR web site (http://oceancolor.gsfc.nasa.gov). We acknowl- N on-com m ercialuse only
  • 19. 34 Wave Glider experiment in the southern Tyrrhenian Sea edge the support provided by Liquid Robotics Inc. and Communication Technology Srl for Wave Glider opera- tions and piloting and the important contribution in the analyses of MODIS products provided by Emanuele Ciancia at National Research Council Institute of Method- ologies for Environmental Analysis. REFERENCES Artale V, Astraldi M, Buffoni G, Gasparini GP, 1994. Seasonal variability of gyre-scale circulation in the northern Tyrrhen- ian sea. J. Geophys. Res. 99:14127-14137. Astraldi M, Gasparini GP, 1994. The seasonal characteristics of the circulation in the Tyrrhenian Sea. In: Seasonal and In- terannual Variability of the Western Mediterranean Sea, Coastal and Estuarine Studies, Geophys. Monogr., Amer. Geophys. Union, 46:115-134. Astraldi M, Gasparini GP, Sparnocchia S, Moretti M, Sansone E, 1996. The characteristics of the water masses and the water transport in the Sicily Channel at long time scales. Bull. Instit. Oceanogr. 17:95-116 Astraldi M, Gasparini GP, Vetrano A, Vignudelli S, 2002. Hy- drographic characteristics and interannual variability of water masses in the central Mediterranean: a sensitivity test for long-term changes in the Mediterranean Sea. Deep-Sea Res. Pt. I 49:661-680. Beatman L, Anderson T, Fong D, Jha R, 2013. Wave Glider® In- tegrated Sensor Validation Report: Teledyne RD Instruments Workhorse Monitor ADCP. Technical Report, Copyright© Liquid Robotics, Inc., Sunnyvale, CA, USA. Brand LE, 1982. Persistent diel rhythms in the chlorophyll flu- orescence of marine phytoplankton species. Mar. Biol. 69:253-262. Briggs N, Perry MJ, Cetinic I, Lee C, D’Asaro E, Gray AM, Rehm E, 2011. High-resolution observations of aggregate flux during a sub-polar North Atlantic spring bloom. Deep- Sea Res. Pt. I 58:1031-1039. Budillon G, Gasparini GP, Schroeder K, 2009. Persistence of an eddy signature in the central Tyrrhenian basin. Deep-Sea Res. Pt. II 56:713-724. Buongiorno Nardelli B, Tronconi C, Pisano A, Santoleri R, 2013. High and ultra-high resolution processing of satellite sea surface temperature data over southern European Seas in the framework of MyOcean project. Rem. Sens. Env. 129:1-16. Casciello D, Lacava T, Pergola N, Tramutoli V, 2007. Robust Satellite Techniques (RST) for oil spill detection and moni- toring. Proc. IVInt. Workshop on the Analysis of Multitem- poral Remote Sensing Images, Leuven, Belgium. IEEE, doi: 10.1109/multitemp.2007.4293040. Casciello D, Lacava T, Pergola N, Tramutoli V, 2011. Robust Satellite Techniques (RST) for oil spill detection and moni- toring using AVHRR Thermal Infrared bands. Int. J. Remote Sens. 32:4107-4129. Chapman CC, Haidvogel DB, 1992. Formation of Taylor caps over a tall isolated seamount in a stratified ocean. Geophys. Astrophys. Fluid. Dyn. 64:31-65. Cotroneo Y, Aulicino G, Ruiz S, Pascual A, Budillon G, Fusco G, Tintoré J, (2015). Glider and satellite high resolution monitoring of a mesoscale eddy in the Algerian basin: Eef- fects on the mixed layer depth and biochemistry. J. Mar. Syst. (In press). doi: 10.1016/j.jmarsys.2015.12.004 Fitzpatrick P, Lau Y, Moorhead R, Skarke A, Merritt D, Kreider K, Brown C, Carlon R, Hine G, Lampoudi T, Leonardi AP, 2014. A review of the 2014 Gulf of Mexico Wave Glider field program. Mar. Technol. Soc. J. 49:64-71. Fusco G, Artale V, Cotroneo Y, Sannino G, 2008. Thermohaline variability of Mediterranean Water in the Gulf of Cadiz, 1948-1999. Deep-Sea Res. Pt. I 55:1624-1638. Fusco G, Manzella GMR, Cruzado A, Gacic M, Gasparini GP, Kovacevic V, Millot C, Tziavos C, Velasquez ZR, Walne A, Zervakis V, Zodiatis G, 2003. Variability of mesoscale fea- tures in the Mediterranean Sea from XBT data analysis.Ann. Geophys. 21:21-32. Goebel NL, Frolov S, Edwards CA, 2014. Complementary use of Wave Glider and satellite measurements: Description of spatial decorrelation scales in Chl-a fluorescence across the Pacific basin. Methods Oceanogr. 10:90-103. Grimaldi CSL, Casciello D, Coviello I, Lacava T, Pergola N, Tra- mutoli V, 2011a. An improved RST approach for timely alert and Near Real Time monitoring of oil spill disasters by using AVHRR data. Nat. Hazards Earth Syst. Sci. 11:1281-1291. Grimaldi CSL, Coviello I, Lacava T, Pergola N, Tramutoli V, 2009a. Near real time oil spill detection and monitoring using satellite optical data. Proc. Geoscience and Remote Sensing Society Symp. IEEE International 2009 - IGARSS 2009, Cape Town, 4:709-712. Grimaldi CSL, Coviello I, Lacava T, Pergola N, Tramutoli V, 2009b. RST-based oil spill detection and monitoring by using optical data. pp. 323-330 in Proc. V Int. Workshop on the Analysis of Multi-temporal Remote Sensing Images, University of Connecticut, Storss. Grimaldi CSL, Coviello I, Lacava T, Pergola N, Tramutoli V, 2011b.Anew RST-based approach for continuous oil spill de- tection in TIR range: the case of the Deepwater Horizon plat- form in the Gulf of Mexico. In: Y. Liu, A. Macfadyen, Z.-G. Ji and R.H. Weisberg (eds), Monitoring and modeling the Deepwater Horizon oil spill: a record-breaking enterprise. American Geophysical Union, Washington, 195:19-31. Hine R, Willcox S, Hine G, Richardson T, 2009. The Wave Glider: A wave-powered autonomous marine vehicle. Proc. of MTS/IEEE OCEANS 2009, Biloxi, MS. Hopkins TS, 1988. Recent observations on the intermediate and deep water circulation in the southern Tyrrhenian Sea. Oceanologica Acta Special Issue (0399-1784):41-50. Hu C, Lee Z, Franz, BA, 2012. Chlorophyll-a algorithms for oligotrophic oceans: A novel approach based on three-band reflectance difference. J. Geophys. Res. 117:C01011. Iacono R, Napolitano E, Marullo S, Artale V, Vetrano A, 2013. Seasonal variability of the Tyrrhenian Sea surface geostrophic circulation as assessed by altimeter data. J. Phys. Oceanogr. 43:1710-1732. Jacquet S, Prieur L, Avois-Jacquet C, Lennon JF, Vaulot D, 2002. Short-timescale variability of picophytoplankton abundance and cellular parameters in surface waters of the Alboran Sea (western Mediterranean). J. Plankton Res. 24:635-651. Kilpatrick KA, Podestá G, Walsh S, Williams E, Halliwell V, Szczodrak M, Brown OB, Minnett PJ, Evans R, 2015. A N on-com m ercialuse only
  • 20. 35G. Aulicino et al. decade of sea surface temperature from MODIS. Remote Sens. Environ. 165:27-41. Krivosheya VG, 1983. Water circulation and structure in the Tyrrhenian Sea. Oceanology 23:166-171. Krivosheya VG, Ovchinnikov IM, 1973. Peculiarities in the geostrophic circulation of the water of the Tyrrhenian Sea. Oceanology 13:822-827. Le Traon PY, 2011. Satellites and operational oeanography. In: A. Schiller and G.B. Brassington (eds.), Operational oceanography in the 21st century. Springer-Verlag Berlin. Marullo S, Santoleri R, Bignami F, 1994. The surface characteris- tics of the Tyrrhenian Sea: Historical satellite data analysis. In: Seasonal and Interannual Variability of the Western Mediter- ranean Sea, Coastal and Estuarine Studies. Geophys. Monogr. American Geophysical Union, Washington 46:135-154. Millot C, 1987. Circulation in the Western Mediterranean Sea. Oceanologica Acta 10:143-149. Millot C, 1999. Circulation in the Western Mediterranean Sea. J. Mar. Syst., 20:423-442. Millot C, Candela J, Fuda JL, Tber Y, 2006. Large warming and salinification of the Mediterranean outflow due to changes in its composition. Deep-Sea Res. Pt. I 53:655-666. MorelA, Gentili B, 2009.Asimple band ratio technique to quan- tify the colored dissolved and detrital organic material from ocean color remotely sensed data. Remote Sens. Environ. 113:998-1011. Oddo P, Adani M, Pinardi N, Fratianni C, Tonani M, Pettenuzzo D, 2009. A Nested Atlantic-Mediterranean Sea General Cir- culation Model for Operational Forecasting. Ocean Sci. Dis- cuss. 6:1093-1127. O’Reilly JE O’Brien MC, Siegel DA, Toole D, Menzies D, Smith RC, Mueller JL, Mitchell BG, Kahru M, Chavez FP, Strutton P, Cota GE, Hooker SB, McClain CR, Carder KL, Harding L, Magnuson A, Phinney D, Moore GE, Aiken J, Arrigo KR, Letelier R, Culver M, 2000. SeaWiFS post- launch calibration and validation analyses, Part 3. NASA Technical Memorandum 2000-206892, vol. 11., NASA Goddard Space Flight Center: 49 pp. Pascual A, Pujol MI, Larnicol J, LeTraon PY, Rio MH, 2007. Mesoscale mapping capabilities of multisatellite altimeter missions: first results with real data in the Mediterranean Sea. J. Mar. Syst. 65:190-211. Pierini S, Simioli A, 1998. A wind-driven circulation model for the Tyrrhenian sea area. J. Mar. Syst. 18:161-178. Poulain PM, Zambianchi E, 2007. Near surface circulation in the central Mediterranean Sea as deduced from Lagrangian drifters in the1990s. Cont. Shelf Res. 27:981-1001. Rinaldi E, Buongiorno Nardelli B, Zambianchi E, Santoleri R, Poulain PM, 2010. Lagrangian and Eulerian observations of the surface circulation in the Tyrrhenian Sea. J. Geophys. Res. 115:C04024. Rio MH, Poulain PM, Pascual A, Mauri E, Larnicol G, Santoleri R, 2007.AMean Dynamic Topography of the Mediterranean Sea computed from altimetric data, in-situ measurements and a general circulation model. J. Mar. Syst. 65:484-508. Teledyne, 2011. Acoustic Doppler Current Profiler principle of operation – A practical primer. Teledyne, Poway: 56 pp. Tramutoli V, 2007. Robust Satellite Techniques (RST) for Nat- ural and environmental hazards monitoring and mitigation: theory and applications. Proc. IV Int. Workshop on the Analysis of Multitemporal Remote Sensing Images, Leuven, Belgium. IEEE, doi: 10.1109/multitemp.2007.4293057 Verron J, Le Provost C, 1985. A numerical study of a quasi- geostrophic flow over isolated topography. J. Fluid Mech. 154:231-252. Vignudelli S, Cipollini P, Reseghetti F, Fusco G, Gasparini GP, Manzella GMR, 2003. Comparison between XBT data and TOPEX/Poseidon satellite altimetry in the Ligurian- Tyrrhenian area. Ann. Geophys. 21:123-135. Villareal TA, Wilson C, 2014.AComparison of the Pac-X Trans- Pacific Wave Glider Data and Satellite Data (MODIS, Aquarius, TRMM and VIIRS). PLoSONE 9:e96968. Willcox S, Meinig C, Sabine C, Lawrence-Slavas N, Richardson T, Hine R, Manley J, 2009. An autonomous mobile platform for underway surface carbon measurements in open-ocean and coastal waters, p. 1-8. Proc. Conf. MTS/IEEE Oceans 2009, Biloxi. Wunsch C, 1997. The vertical partition of oceanic horizontal ki- netic energy. J. Phys. Oceanogr. 27:1770-1794. N on-com m ercialuse only