2. physical activity. Regarding these interactions, both studies had
different findings. In the PLACE study, physical activity behavior of
high-SES neighborhood residents was more strongly associated with
walkability than that of low-SES neighborhood residents (Owen et al.,
2007). In the NQLS, no such interactions were found (Sallis et al., 2009).
Addressing these moderating effects is important for several reasons.
First, walkability is a physical environment factor and neighborhood
SES a social environment factor with “physical” implications. The social
and physical characteristics of low-SES/high-walkable neighborhoods
are likely to differ from those of high-SES/high-walkable neighbor-
hoods. If these interactions are not investigated, important underlying
mechanisms could be ignored. Second, it is crucially important to
reduce known health disparities across socioeconomic groups.
Therefore, it is essential to determine whether walkability relates
similarly to several health behaviors in low- and high-SES neighbor-
hoods. Third, investigating these interactions is relevant for public
health and urban environment policy, and for future environmental
and social innovations aiming to increase physical activity.
Previous studies also showed that neighborhood SES can have a
significant direct relationship with physical activity (McNeill et al.,
2006; Ross and Mirowsky, 2008). However, findings are at this stage
ambiguous, with some studies finding that high-SES neighborhood
inhabitants are more physically active (Kavanagh et al., 2005; McNeill
et al., 2006) and other studies finding the opposite (van Lenthe et al.,
2005; Ross, 2000). Further research is therefore needed to clarify these
associations.
However, because large differences in physical environments and
physical activity behaviors (especially cycling) exist between Europe
and the US or Australia, European studies are needed. Moreover, the
physical environment of European cities differs in many ways from
other continents and the associations between walkability and
physical activity will probably be different when compared, for
example, to the US and Australia. Until now, most European physical
environmental studies have either used only self-reported physical
environmental perceptions (De Bourdeaudhuij et al., 2003; De
Bourdeaudhuij et al., 2005; Santos et al., 2008) or included relatively
small sample sizes (Van Dyck et al., 2009). For example, in Belgium
and Portugal, positive associations between perceived environmental
attributes and physical activity were found in a sample of 521 Belgian
adults (De Bourdeaudhuij et al., 2003) and a sample of 526 Portuguese
and Belgian adults (De Bourdeaudhuij et al., 2005). A Portuguese
study of 7330 adults also found positive associations between per-
ceived environment attributes and walking for transport (Santos
et al., 2008). Another Belgian study with objective environmental
measurements found a positive relationship between walkability and
active transportation in 120 adults (Van Dyck et al., 2009). Moreover,
no European studies investigated the link between neighborhood SES
and walkability, and no common designs are available to enhance
cross-national comparisons.
The Belgian Environmental Physical Activity Study (BEPAS) inves-
tigated associations between walkability, neighborhood SES, and
physical activity among Belgian adults. This is the first large-scale
European study with a design identical to NQLS and PLACE. Based on the
findings of these studies, we hypothesized that living in a high-walkable
neighborhood would be associated with more walking for transport.
Moreover, because of inconsistencies between findings from NQLS and
PLACE, we investigated whether neighborhood SES moderated the
relationship between walkability and physical activity behaviors.
Methods
Procedures
The BEPAS was conducted in Ghent (237,000 inhabitants, 156.18 sq km
(60.3 sq miles), 1468 inhabitants/km2
). Data were collected between May
2007 and September 2008. Research protocols of NQLS and PLACE were
modified for the Belgian setting by using Belgian census data (National
Institute of Statistics – Belgium, 2008) to define neighborhood SES and using
the available Geographic Information Systems (GIS) databases to define
walkability. The BEPAS was approved by the Ethics Committee of the Ghent
University Hospital (UZ Ghent) and participants gave written informed
consent.
In total, 24 neighborhoods were selected from the 201 existing statistical
sectors in Ghent. Statistical sectors are the smallest units for which
information on income, SES, and other demographic factors is available.
Every sector contains approximately 1000 inhabitants. The 24 neighborhoods
comprised clusters from 1 to 5 adjacent sectors (total: 36 statistical sectors).
Due to lower residential density, low-walkable neighborhoods were in all
cases larger than high-walkable neighborhoods. The neighborhoods were
stratified on GIS-based walkability, as described below. Subsequently,
neighborhoods were matched on SES variables, derived from the census data.
The neighborhood selection procedure resulted in 6 high-walkable/high-
SES neighborhoods, 6 high-walkable/low-SES neighborhoods, 6 low-walk-
able/high-SES neighborhoods, and 6 low-walkable/low-SES neighborhoods
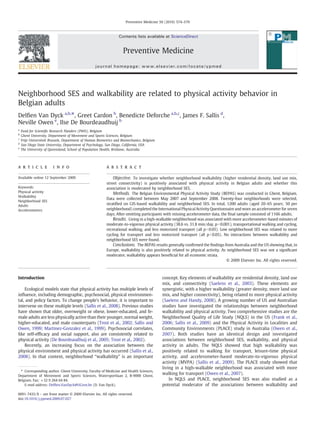
(Fig. 1).
After neighborhood selection, the Public Service of Ghent selected a
random sample of 250 adults (aged 20–65 years) in each neighborhood.
These adults received a letter with information on the study. Two to six
days later, potential participants were visited at home. Up to three
attempts were made on different days and different times of day to find
someone at home. Inclusion criteria were: between 20 and 65 years of
age, living in private dwellings, able to walk without assistance and to fill
in a questionnaire in Dutch. Adults who met inclusion criteria and agreed
to participate completed a written informed consent and filled in a
questionnaire on sociodemographics. Also, the long International Physical
Activity Questionnaire (IPAQ; http://www.ipaq.ki.se/index.htm; last seven
days interview version) was completed and participants were instructed
to wear an accelerometer for seven consecutive days. All self-reported
data were obtained through face-to-face interviews, which ensured that
no data were missing for these variables. One week after the first visit, the
accelerometer was collected during a second visit. Home visits were
carried out until 50 participants were recruited in each neighborhood. Six
trained researchers conducted the visits and IPAQ interviews.
Fig. 1. Distribution of neighborhoods in Ghent, Belgium.
S75D. Van Dyck et al. / Preventive Medicine 50 (2010) S74–S79
3. Measures
Physical activity
Self-reported physical activity was collected using the long Dutch IPAQ
(last seven days interview version). The interview version was chosen because
adults tend to overreport their physical activity levels with the self-
administration version (Rzewnicki et al., 2003). The IPAQ has good reliability
(intra-class range from 0.46 to 0.96). Criterion validity, assessed against the
CSA accelerometer (Computer Science & Applications, Inc., Shalimar, FL), is
fair-to-moderate with a median rho=0.30 (Craig et al., 2003). Frequency
(number of days in the last seven days) and duration (hours and minutes per
day) of physical activity in different domains (work, transportation,
recreation, and household) are assessed. The use of motorized transport also
was assessed, with one question asking to report the frequency and duration
of transport with any motorized vehicle (e.g., car, bus, train, tram).
Physical activity levels were objectively assessed with the CSA accel-
erometers (model 7164). Accelerometers are valid and reliable for assessing
physical activity in adults (Melanson and Freedson, 1995). The acceler-
ometers were set to measure physical activity in epochs of one minute.
Moderate intensity physical activity corresponds to 1952–5724 counts per
minute, and high intensity physical activity is N5724 counts per minute
(Freedson et al., 1998). Light intensity activity corresponds to 101–1952
counts per minute and sedentary behavior is defined as b100 counts per
minute (Ekelund and Griffin, 2007). Participants were asked to wear the
accelerometer above the right hip during the daytime (from waking up until
going to bed) and to remove it only for water activities. The accelerometer
data were reduced using MAHUffe Analyser 1.9.0.3 (www.mrc.epid.cam.ac.
uk). Data from participants with at least ten hours of wearing time for at least
four days (including one weekend day) were included in the analyses. Non-
wearing time was defined as ≥60 minutes of consecutive zero counts. Due to
technical problems and insufficient wearing time, data for 34 participants
(2.8%) were excluded from the analyses.
Demographic variables
Self-reported demographic variables included sex, age, education, living
situation, working situation, working status, height, weight, and address.
Neighborhood walkability
A neighborhood-level walkability index, based on objectively assessed
land use variables, was calculated using GIS. Geographical data were obtained
through the Service for Environmental Planning in Ghent. Three environ-
mental attributes found to be related to physical activity were included:
residential density, intersection density, and land use mix (Frank et al., in
press; Leslie et al., 2007). Cadastral data (residential land use, street centerline
data, zoning data) and census data were integrated in a GIS database to create
a walkability index for each statistical sector. NQLS and PLACE also included
“retail floor area ratio” in the index. In the BEPAS, this parameter was omitted
because of a lack of relevance for a Belgian context and because no GIS data
were available. Residential density per neighborhood was calculated using the
ratio of residential units to the land area devoted to residential use.
Connectivity was represented by the ratio of the number of true intersections
(3 or more streets) to the land area in each neighborhood. Land use mix
indicated the degree of diversity of land use types in each neighborhood. Five
land use types were considered: residential, retail (supermarkets, bakeries,
butchers, banks, and clothing shops), office, institutional, and recreational
(sport and non-sport). Subsequently, values were normalized and Z-scores
were calculated. The walkability index was computed, using an adjusted
version of the formula of Frank and colleagues (in press): Walkability=(2⁎z-
connectivity)+(z-residential density)+(z-land use mix). The formula used
in this study was equivalent to those used in NQLS and PLACE, except for the
omission of retail floor area. Neighborhoods were ranked, based on their
walkability index. The top and bottom quartiles represented “high-walkable”
and “low-walkable” neighborhoods, respectively.
Neighborhood SES: Because it is important to understand whether
neighborhood walkability has similar associations with physical activity in
high- and low-SES neighborhoods (Frank et al., 2004, 2005), neighborhood
SES for all statistical sectors was determined. Median annual household
income data (National Institute of Statistics – Belgium, 2008) were used to
determine neighborhood SES. Income data were categorized as “high-SES”
and “low-SES.” To avoid outliers, sectors with annual household income
values less than €11,600 (Euro) and greater than €116,000 were not included.
The second, third, and fourth deciles of the ranking contained the low-SES
neighborhoods; the seventh, eighth, and ninth deciles the high-SES
neighborhoods.
Analyses
Descriptive statistics of sample characteristics were analyzed using SPSS
15.0 for Windows. Multivariate regression analyses were conducted using
MLwiN version 2.02. Because the physical activity variables (dependent
variables) were skewed to the right, logarithmic transformations (log10)
were used to improve normality. Raw data were used to calculate mean
physical activity scores by walkability and neighborhood SES (shown in
Table 1) and mean physical activity scores of the total sample. Multi-level
modeling (two-level: participant–neighborhood) was applied to take into
account clustering of participants in neighborhoods. These two-level models
were used to examine independent associations between the dependent
variables and the walkability index (dummy), neighborhood SES (dummy),
and self-reported sociodemographic variables (gender, age, body mass index
[BMI], educational attainment, and working status). As suggested by Ross and
Mirowsky (2008), the analyses on associations of neighborhood walkability
and neighborhood SES with physical activity controlled for individual SES. A
variable, “neighborhood SES x neighborhood walkability,” was included, to
examine the moderating effects of neighborhood SES on the associations
between walkability and the dependent variables. Neighborhood-level
attributes were treated as level-2 variables, and individual-level variables
as level-1. For all analyses, significance was set at p=0.05.
Results
Demographic characteristics and physical activity behavior of
the sample
The overall response rate (participants/possible participants found
at home) was 58.0% (range 57.5% to 58.7%) across neighborhoods. The
Table 1
Physical activity behavior of the sample by neighborhood walkability and SES.
Variable Neighborhood walkability Mean (SD) Neighborhood SES Mean (SD)
High Low High Low
IPAQ
Walking transport (min/week) 117.3 (169.2) 37.6 (90.1) 54.5 (105.9) 100.9 (166.7)
Cycling transport (min/week) 82.3 (126.7) 43.9 (95.2) 65.4 (119.9) 60.8 (107.0)
Motorized transport (min/week) 309.2 (295.3) 344.8 (315.7) 361.2 (320.0) 292.3 (287.4)
Walking recreation (min/week) 85.3 (137.2) 67.6 (128.4) 65.7 (117.9) 87.4 (146.4)
Activity monitor
MVPA (min/day) 38.6 (23.8) 31.8 (23.1) 33.4 (22.1) 37.1 (25.2)
IPAQ, International Physical Activity Questionnaire; min, minutes; MVPA, moderate-to-vigorous physical activity.
Location of the study: Ghent, Belgium.
Date of the study: 2007-2008.
Data analysis: 2008.
Study population: 1166 adults (20–65 years): 47.9% men, 42.7±12.6 years, 76.1% employed.
S76 D. Van Dyck et al. / Preventive Medicine 50 (2010) S74–S79
4. final sample consisted of 1166 participants. Demographic character-
istics of the sample are shown in Table 2. Compared to data from the
National Institute of Statistics - Belgium (2008), the sample was more
likely to be highly educated and employed, and participating women
were more likely to have a lower BMI.
On average, participants reported a mean of 77.5 (SD=141.3)
minutes (min)/week of walking for transport, 63.1 (113.6) min/week
of cycling for transport, 327.0 (306.1) min/week of motorized
transport, and 76.4 (133.1) min/week of recreational walking. In
addition, accelerometer data showed that participants performed on
average 35.2 (23.7) min/day of MVPA. Table 1 shows the averages of
the different physical activity behaviors by neighborhood walkability
and neighborhood SES.
Associations between neighborhood walkability (level-2), neighborhood
SES (level-2), and physical activity
As shown in Table 3, living in a high-walkable neighborhood was
associated with significantly more walking for transport (pb0.001),
more cycling for transport (pb0.001), less motorized transport
(pb0.05), more recreational walking (pb0.01), and more accelero-
meter-based MVPA (pb0.001). Living in a high-SES neighborhood
was associated with significantly less walking for transport (pb0.05)
and more motorized transport (pb0.001).
For the moderating effects of neighborhood SES on the relation-
ship between walkability and the physical activity behaviors, no
significant results were found.
Associations of individual (level-1) variables with physical activity
In the multi-level analyses, the independent associations of sex,
age, education, working status, and BMI with physical activity
behaviors were studied. Because the BEPAS included physical activity
data for both transport and recreation, the associations of individual-
level variables with physical activity are important to consider.
Results are presented in Table 3 and are generally in line with prior
studies (Trost et al., 2002; Sallis and Owen, 1999; Martinez-Gonzalez
et al., 1999), showing that gender, age, education, working status, and
BMI are independently related to physical activity.
Discussion
For the first time in Europe, a large-scale study with a design
identical to studies in the US and Australia was undertaken to allow
comparison of environment and physical activity results across
countries. For self-reported walking for transport and accelerome-
ter-based MVPA, BEPAS results are in line with NQLS (Sallis et al.,
2009), and consistent with PLACE on self-reported walking for
Table 2
Demographic characteristics of participants from different types of neighborhoods.
Variable Total Low SES/low walk Low SES/high walk High SES/low walk High SES/high walk
Sex (%)
Male 47.9 45.8 48.3 48.5 49.1
Female 52.1 54.2 51.7 51.5 50.9
Age: mean (SD) 42.7 (12.6) 42.8 (12.1) 40.4 (13.1) 43.5 (12.4) 44.0 (12.6)
Body mass index: mean (SD) 24.3 (3.9) 25.1 (4.1) 23.6 (4.0) 24.3 (3.7) 24.3 (3.8)
Male 25.3 (3.7) 25.8 (3.9) 24.6 (4.2) 25.4 (3.3) 25.4 (3.4)
Female 23.8 (3.9) 24.4 (4.2) 22.7 (3.5) 23.4 (3.9) 23.3 (3.8)
Employment status (%)
Employed 76.1 75.4 76.1 77.1 75.8
Not employed 23.9 24.6 23.9 22.9 24.2
Education (%)
Primary 4.4 9.9 2.1 2.4 3.5
Secondary 34.6 55.1 19.9 38.9 24.9
College/University 60.9 35.0 78.1 58.7 71.6
Occupation (%)
Blue collar 24.9 45.5 17.6 21.7 14.8
White collar 75.1 54.5 82.4 78.3 85.2
Location of the study: Ghent, Belgium.
Date of the study: 2007-2008.
Data analysis: 2008.
Study population: 1166 adults (20–65 years): 47.9% men, 42.7±12.6 years, 76.1% employed.
Table 3
Multivariate multi-level analyses (β (SE)) of the associations between neighborhood level and individual level factors and physical activity behavior (logarithmic transformation).
Explanatory variables Multivariate multi-level analyses
Walking transport Cycling transport Motorized transport Walking recreation CSA MVPA
Walkability (ref. low walk) 0.746 (0.157)⁎⁎⁎ 0.447 (0.105)⁎⁎⁎ -0.125 (0.067)⁎ 0.334 (0.111)⁎⁎ 0.095 (0.030)⁎⁎⁎
Neighborhood SES (ref. low SES) -0.360 (0.155)⁎ 0.029 (0.102) 0.215 (0.065)⁎⁎⁎ -0.004 (0.109) -0.026 (0.029)
Interaction walkability x SES 0.027 (0.220) -0.051 (0.144) -0.052 (0.092) -0.184 (0.153) -0.014 (0.040)
Sex (ref. male) 0.107 (0.054)⁎ -0.049 (0.059) -0.100 (0.039)⁎⁎ 0.104 (0.062)⁎ -0.082 (0.020)⁎⁎⁎
Age -0.001 (0.002) 0.001 (0.002) -0.004 (0.002)⁎ 0.009 (0.003)⁎⁎ -0.003 (0.001)⁎⁎
Education (ref. no college/univ.) 0.131 (0.061)⁎ 0.148 (0.065)⁎ 0.005 (0.043) -0.035 (0.069) 0.066 (0.022)⁎⁎
Working status (ref. not employed) -0.205 (0.063)⁎⁎⁎ -0.167 (0.069)⁎⁎ 0.234 (0.046)⁎⁎ 0.051 (0.073) 0.080 (0.024)⁎⁎⁎
BMI -0.007 (0.005) -0.021 (0.005)⁎⁎⁎ 0.001 (0.004) -0.008 (0.006) -0.005 (0.002)⁎⁎
Age and BMI were centered on the grand mean.
BMI, Body mass index; CSA, Computer Science & Applications accelerometer; MVPA, Moderate-to-vigorous physical activity; SES, Socioeconomic status.
⁎ pb0.05, ⁎⁎ pb0.01, ⁎⁎⁎ pb0.001.
Location of the study: Ghent, Belgium.
Date of the study: 2007-2008.
Data analysis: 2008.
Study population: 1166 adults (20–65 years): 47.9% men, 42.7±12.6 years, 76.1% employed.
S77D. Van Dyck et al. / Preventive Medicine 50 (2010) S74–S79
5. transport (Owen et al., 2007). However, some new, and potentially
European-specific, findings on cycling for transport and recreational
walking also emerged.
The hypothesis—that high walkability would be positively associ-
ated with walking for transport—was confirmed (80 min/week
difference). Moreover, living in a high-walkable neighborhood was
associated with 80 min/week more walking for transport, 40 min/
week more cycling for transport, 20 min/week more recreational
walking, and 35 min/week less motorized transport. These self-
reported findings were supported by the accelerometer results:
49 min/week more accelerometer-derived MVPA was performed in
the high-walkable neighborhoods.
To our knowledge, the 40 min/week difference in cycling for
transport is a new and potentially European-specific finding. Several
researchers expected a relationship between walkability and cycling
for transport (Sallis et al., 2004; Rodriguez et al., 2006), but results
remained insignificant. This could be because previous studies were
conducted in the US and Australia, two countries with low cycling
rates (Pucher and Buehler, 2008). Cycling is a more typical European
behavior (Pucher and Buehler, 2008), and after Denmark and the
Netherlands, Belgium has the highest cycling rates of Europe (http://
dataservice.eea.europa.eu). Therefore, it is likely that future studies in
European countries with similar cycling rates will also find these
positive associations.
Until now, few consistent relationships between walkability and
leisure-time physical activity have been identified (Rodriguez et al.,
2006; Saelens and Handy, 2008), except for the NQLS results, where
high walkability was positively associated with leisure-time physical
activity (Sallis et al., 2009). In previous studies, recreational walking
appeared to be more related to other environmental features,
particularly aesthetics and the availability of recreation facilities
and green spaces (Rhodes et al., 2007; Humpel et al., 2002; Saelens
and Handy, 2008; Sugiyama et al., 2008). These features are more
common in rural areas (Sugiyama et al., 2008), which usually are
classified as less walkable (according to the walkability index).
Therefore, it is often assumed that living in a rural area would be
associated with more recreational walking. However, the BEPAS
findings show that living in high-walkable (and typically more
urban) neighborhoods can be associated with more recreational
walking. This finding is possibly a distinct “European” finding.
Potentially, walkable environments in Belgium are not only condu-
cive to active transportation, but may also facilitate recreational
walking. Neighborhood selection was only based on factors known to
correlate strongly to active transportation, and features like
aesthetics and public open spaces were not objectively measured.
Nevertheless, because high-walkable neighborhoods in this study
were often located in a city (or town) center, where aesthetically
attractive buildings, parks, and other green spaces are situated, it is
plausible that these factors are associated with recreational walking,
in addition to the objectively measured walkability attributes.
The positive relationship between walkability and both walking
for transport and recreation is promising, because it suggests that
improving walkability may increase physical activity in multiple
domains. However, future research should focus on investigating
relationships between specific neighborhood features and specific
physical activity behaviors (Sallis et al., 2008) to determine whether
neighborhood walkability itself is related to recreational walking or
whether, in particular countries, high walkability co-occurs with the
presence of features that stimulate recreational walking.
In general, conducting European studies is important because
walkability is likely to be a context-relative construct. High-walkable
neighborhoods in the US will probably be low-walkable according to
Belgian standards. Therefore, it is interesting to see that the
associations found in US and Australian studies also remain significant
in European environments, where the variation between high- and
low-walkable neighborhoods is less obvious.
Previous studies have suggested that neighborhood SES could
interact with the relationship between walkability and physical
activity (Cerin et al., 2007; Owen et al., 2007). Therefore, this factor
was included as a second condition in the BEPAS. In PLACE, a
significant interaction was found (Owen et al., 2007), but the NQLS
found no SES interactions, which was confirmed in the BEPAS.
Inconsistent findings on the relation of built environment variables
to physical activity in high- and low-income (or ethnic/racial
minority) groups in the US (Frank et al., 2004, 2005) indicate
interactive effects may be context-dependent, and further study is
needed. Because the BEPAS is the first large-scale European study
on walkability and physical activity, other European investigators
are encouraged to examine SES interactions with walkability. Both
the BEPAS and NQLS results suggest that adult residents of high- as
well as low-SES neighborhoods may benefit to the same extent
from a high-walkable environment.
An independent relationship between neighborhood SES and
several physical activity outcomes was established. Living in a low-
SES neighborhood was associated with 45 min/week more walking
for transport and 70 min/week less motorized transport. Previous
studies have shown neighborhood SES to be related to physical
activity, independent of individual SES (McNeill et al., 2006). In
most studies, neighborhood SES is positively related to physical
activity (Kavanagh et al., 2005; McNeill et al., 2006), possibly
because low neighborhood SES is also related to other factors
discouraging physical activity, like poorer safety and aesthetic
characteristics (Zhu and Lee, 2008). In a Dutch and a US study,
findings were similar to those reported here: living in a low-SES
neighborhood was related to more active transportation (van
Lenthe et al., 2005) or more walking (Ross, 2000). The BEPAS
findings potentially may be explained from a personal-prosperity
perspective. In Belgium, driving a car is expensive. This could
influence the physical activity behavior of low-SES neighborhood
inhabitants. In this context, it is important that public health
campaigns and other initiatives emphasize that active transport is
healthy, if there is the perception that not having a car is an
indication of being personally less prosperous.
Study Limitations and Strengths
Strengths of the BEPAS include that it was the first European study
with identical design and protocol, and similar instruments, to NQLS
and PLACE. Also, a comparable walkability index was used in the three
studies, facilitating cross-national comparisons. However, when
comparing results across countries, the contextual relativity of the
walkability construct and dissimilarities between walkability indices
used in these different settings need to be kept in mind. A second
strength was the large study sample. Third, both objective and self-
report measures of physical activity were used.
One limitation was the cross-sectional design, which precluded
determination of causality. Second, as statistical sectors were used
to define neighborhoods, no “real” communities were represented.
Therefore, important cultural and other differences between places
may not have been captured. Third, compared to the Belgian
population, the sample was more likely to be employed and more
highly educated. Moreover, Belgium has high cycling rates relative
to many other countries. These issues may limit generalizability of
our findings to Belgium and other European countries. Finally, in the
low-SES/high-walkable neighborhoods, a response bias toward
more highly educated adults was likely. However, we controlled
for educational attainment in the regression analyses.
Conclusions
In summary, the BEPAS showed that in Belgium, walkability was
related to different physical activity behaviors. The direction of effects
S78 D. Van Dyck et al. / Preventive Medicine 50 (2010) S74–S79
6. and even absolute differences in physical activity across low- and high-
walkable neighborhoods were very similar to those found in Australia
(Owenet al., 2007) and the US (Sallis et al., 2009). Neighborhood SES did
not interact with the relationship between walkability and physical
activity, which could have policy implications for the development of
interventions in high- and low-SES neighborhoods. The findings are
promising, and if longitudinal studies can confirm the temporal nature
of these relationships, interventions to enhance walkability could be
developed. However, to develop effective interventions, collaboration
among health researchers, urban planners, and city governments is
required. Some of these interventions (particularly the relevant physical
redevelopments) will be expensive and time-consuming, but poten-
tially they could increase the physical activity levels of entire
populations, and be sustainable over many decades.
Conflict of interest statement
The authors declare that there are no conflicts of interest.
Acknowledgments
This research was supported by Fund for Scientific Research
Flanders (FWO) B/09731/01. Dr. Sallis' contributions were supported
by NIH grant HL67350. Dr. Owen's contributions were supported by a
Program Grant (#301200) from the National Health and Medical
Research Council of Australia, and by a Research Infrastructure Grant
from Queensland Health.
References
Cerin, E., Leslie, E., du Toit, L., Owen, N., Frank, L., 2007. Destinations that matter:
Associations with walking for transport. Health Place 13, 713–724.
Craig, C.L., Marshall, A.L., Sjöström, M., et al., 2003. International Physical Acti-
vity Questionnaire: 12-country reliability and validity. Med. Sci. Sports Exerc. 35,
1381–1395.
De Bourdeaudhuij, I., Sallis, J.F., Saelens, B.E., 2003. Environmental correlates of physical
activity in a sample of Belgian adults. Am. J. Health Promot. 18, 83–92.
De Bourdeaudhuij, I., Teixeira, P., Cardon, G., Deforche, B., 2005. Environmental and
psychosocial correlates of physical activity in Portuguese and Belgian adults. Public
Health Nutr. 8, 886–895.
Ekelund, U., Griffin, S., 2007. Physical activity and metabolic risk in individuals with a
family history of type 2 diabetes. Diabetes Care 30, 337–342.
Frank, L.D., Andresen, M.A., Schmid, T.L., 2004. Obesity relationships with community
design, physical activity, and time spent in cars. Am. J. Prev. Med. 27, 87–96.
Frank, L.D., Schmid, T.L., Sallis, J.F., Chapman, J., Saelens, B.E., 2005. Linking objectively
measured physical activity with objectively measured urban form: findings from
SMARTRAQ. Am. J. Prev. Med. 28, 117–125.
Frank, L.D., Sallis, J.F., Conway, T., Chapman, J., Saelens, B.E., Bachman, W., 2006.
Many pathways from land use to health: Walkability associations with active
transportation, body mass index and air quality. J. Am. Plan. Assoc. 72, 75–87.
Frank, L.D., Sallis, J.F., Saelens, B.E., et al., in press. The development of a walkability
index: application to the Neighborhood Quality of Life Study. Br. J. Sports Med.
doi:10.1136/bjsm.2009.058701.
Freedson, P.S., Melanson, E., Sirard, J., 1998. Calibration of the Computer Science and
Applications, Inc. accelerometer. Med. Sci. Sports Exerc. 30, 777–781.
Humpel, N., Owen, N., Leslie, E., 2002. Environmental factors associated with adults'
participation in physical activity: A review. Am. J. Prev. Med. 22, 188–199.
Kavanagh, A.M., Goller, J.L., King, T., Jolley, D., Crawford, D., Turrell, G., 2005. Urban area
disadvantage and physical activity: A multilevel study in Melbourne, Australia.
J. Epidemiol. Community Health 59, 934–940.
Leslie, E., Coffee, N., Frank, L., Owen, N., Bauman, A., Hugo, G., 2007. Walkability of local
communities: Using geographic information systems to objectively assess relevant
environmental attributes. Health Place 13, 111–122.
Martinez-Gonzalez, M.A., Martinez, J.A., Hu, F.B., Gibney, M.J., Kearny, J., 1999. Physical
activity, sedentary lifestyle and obesity in the European Union. Int. J. Obes. 14,
305–313.
McNeill, L.H., Kreuter, M.W., Subramanian, S.V., 2006. Social environment and physical
activity: A review of concepts and evidence. Soc. Sci. Med. 63, 1011–1022.
Melanson, E.L., Freedson, P., 1995. Validity of the Computer Science and Applications,
Inc. (CSA) activity monitor. Med. Sci. Sports Exerc. 27, 934–940.
National Institute of Statistics - Belgium, 2008. www.statbel.fgov.be, FOD Economie-
Algemene Directie Statistiek.
Owen, N., Cerin, E., Leslie, E., et al., 2007. Neighborhood walkability and the walking
behavior of Australian adults. Am. J. Prev. Med. 33, 387–395.
Pucher, J., Buehler, R., 2008. Making cycling irresistible: Lessons from the Netherlands,
Denmark, and Germany. Transport Rev. 28, 495–528.
Rhodes, R.E., Courneya, K.S., Blanchard, C.M., Plotnikoff, R.C., 2007. Prediction of leisure-
time walking: An integration of social cognitive, perceived environmental, and
personality factors. Int. J. Behav. Nutr. Phys. Act. 4, 51.
Rodriguez, D.A., Khattak, A.J., Evenson, K.R., 2006. Can new urbanism encourage phy-
sical activity? Comparing a new urbanist neighborhood with conventional suburbs.
J. Am. Plan. Assoc. 72, 43–54.
Ross, C.E., 2000. Walking, exercising and smoking: Does neighborhood matter? Soc. Sci.
Med. 51, 265–274.
Ross, C.E., Mirowsky, J., 2008. Neighborhood socioeconomic status and health: Context
of composition? City Community 7, 163–179.
Rzewnicki, R., Vanden Auweele, Y., De Bourdeaudhuij, I., 2003. Addressing over-
reporting on the International Physical Activity Questionnaire (IPAQ) telephone
survey with a population sample. Public Health Nutr. 6, 299–305.
Saelens, B.E., Handy, S.L., 2008. Built environment correlates of walking: A review. Med.
Sci. Sports Exerc. 40, S550–S566.
Saelens, B.E., Sallis, J.F., Frank, L.D., 2003. Environmental correlates of walking and
cycling: Findings from the transportation, urban design and planning literatures.
Ann. Behav. Med. 25, 80–91.
Sallis, J., Owen, N., 1999. Physical activity and behavioral medicine. Sage Publications,
Thousand Oaks, CA.
Sallis, J.F., Frank, L.D., Saelens, B.E., Kraft, M.K., 2004. Active transportation and physical
activity: Opportunities for collaboration on transportation and public health
research. Transp. Res., Part. A. 38, 249–268.
Sallis, J.F., Owen, N., Fisher, E.B., 2008. Ecological models of health behavior, In: Glanz, K,
Rimer, BK, Viswanath, K (Eds.), Health behavior and health education: Theory,
research, and practice, 4th
Ed. Jossey-Bass, San Francisco, pp. 465–486.
Sallis, J.F., Saelens, B.E., Frank, L.D., et al., 2009. Neighborhood built environment and
income: Examining multiple health outcomes. Soc. Sci. Med. 68, 1285–1293.
Santos, R., Silva, P., Santos, P., Ribeiro, J.C., Mota, J., 2008. Physical activity and perceived
environmental attributes in a sample of Portuguese adults: Results from the
Azorean physical activity and health study. Prev. Med. 47, 83–88.
Sugiyama, T., Leslie, E., Giles-Corti, B., Owen, N., 2008. Associations of neighborhood
greenness with physical and mental health: Do walking, social coherence and
social interaction explain the relationships? J. Epidemiol. Community Health 62,
e9.
Trost, S.G., Owen, N., Bauman, A.E., Sallis, J.F., Brown, W., 2002. Correlates of adults'
participation in physical activity: review and update. Med. Sci. Sports Exerc. 34,
1996–2001.
Van Dyck, D., Deforche, B., Cardon, G., De Bourdeaudhuij, I., 2009. Neighbourhood
walkability and its particular importance for adults with a preference for passive
transport. Health Place 15, 496–504.
van Lenthe, F.J., Brug, J., Mackenbach, J.P., 2005. Neighbourhood inequalities in physical
activity: The role of neighbourhood attractiveness, proximity to local facilities and
safety in the Netherlands. Soc. Sci. Med. 60, 763–775.
Zhu, X., Lee, C., 2008. Walkability and safety around elementary schools: Economic and
ethnic disparities. Am. J. Prev. Med. 34, 282–290.
S79D. Van Dyck et al. / Preventive Medicine 50 (2010) S74–S79