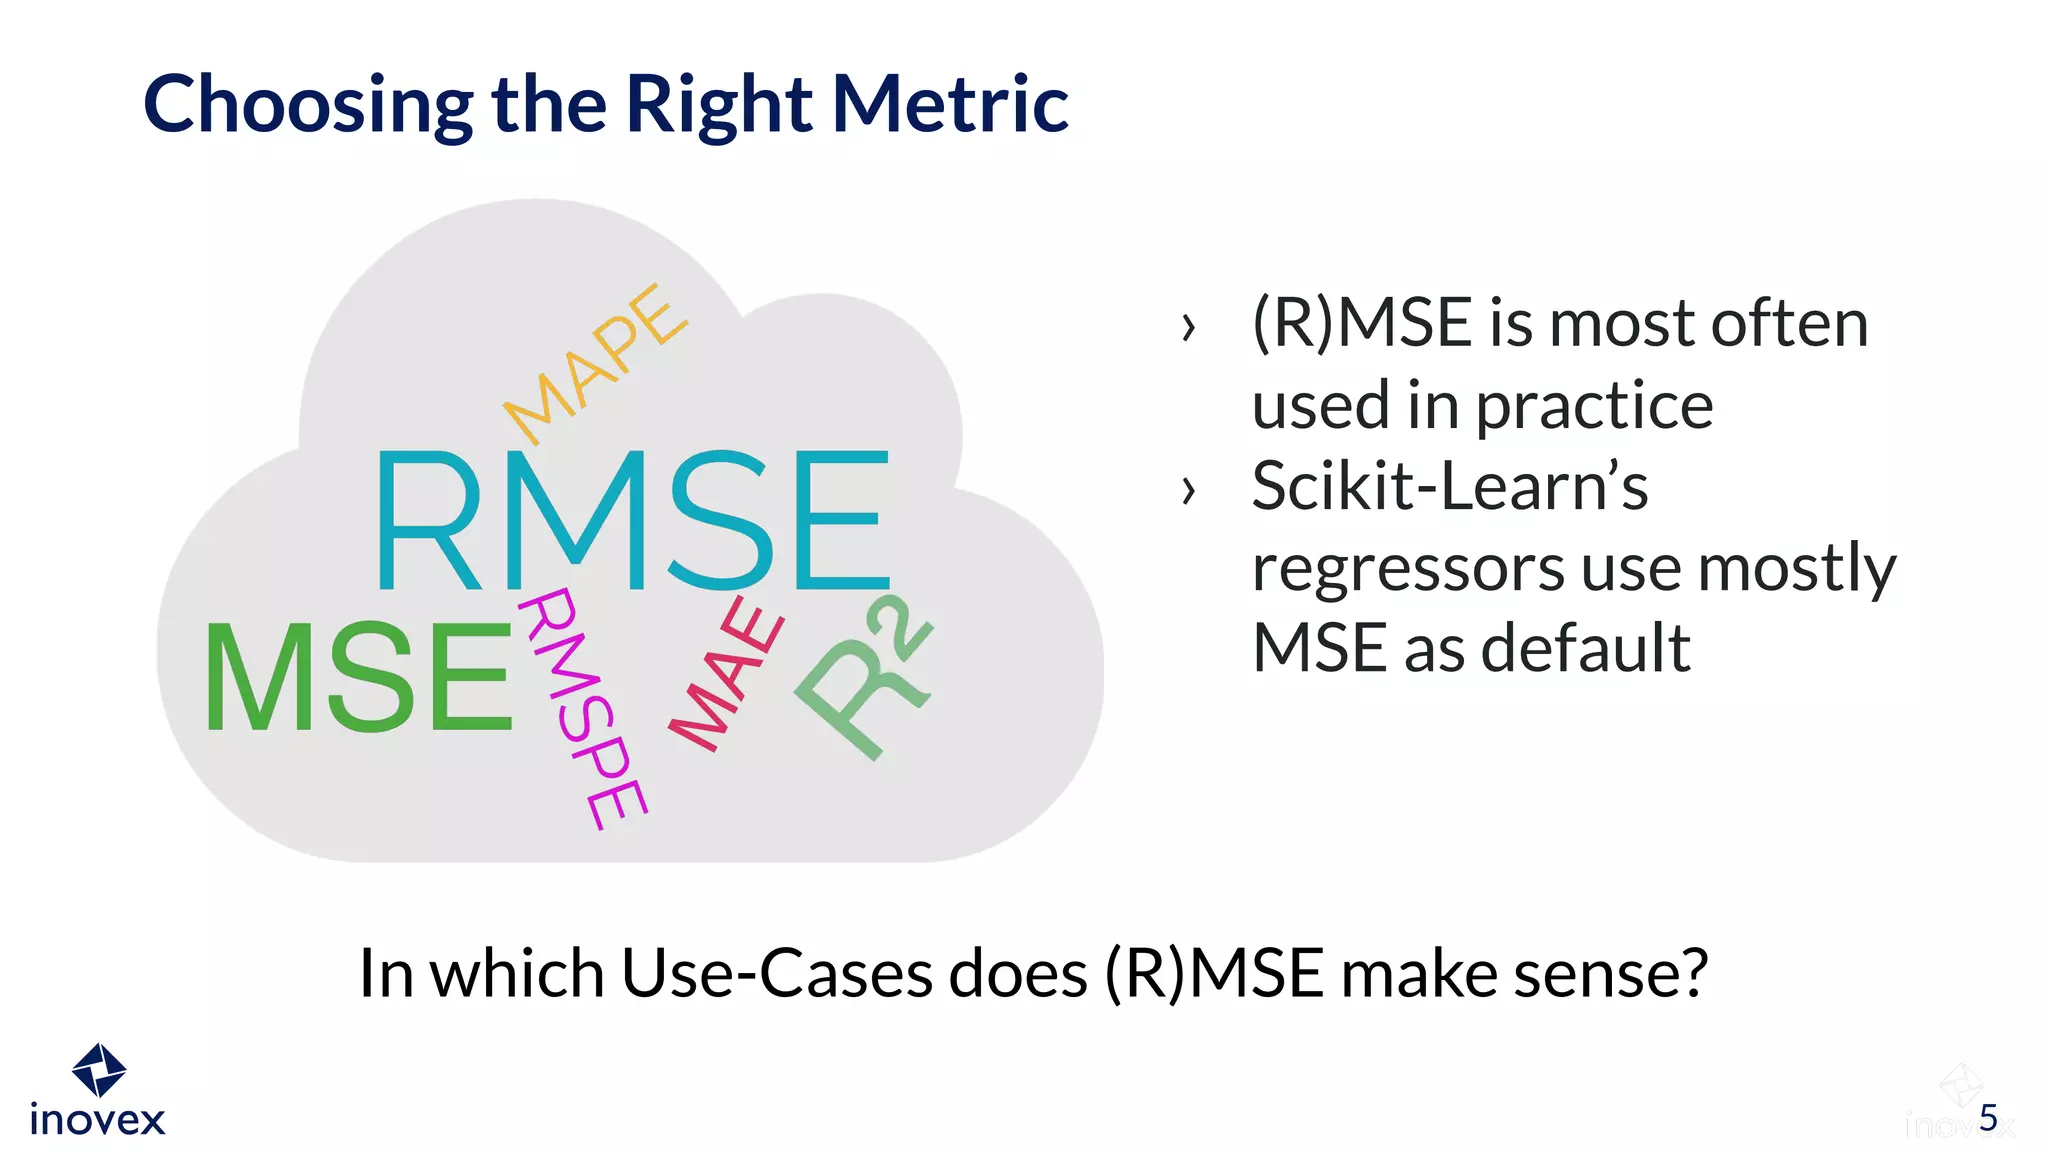
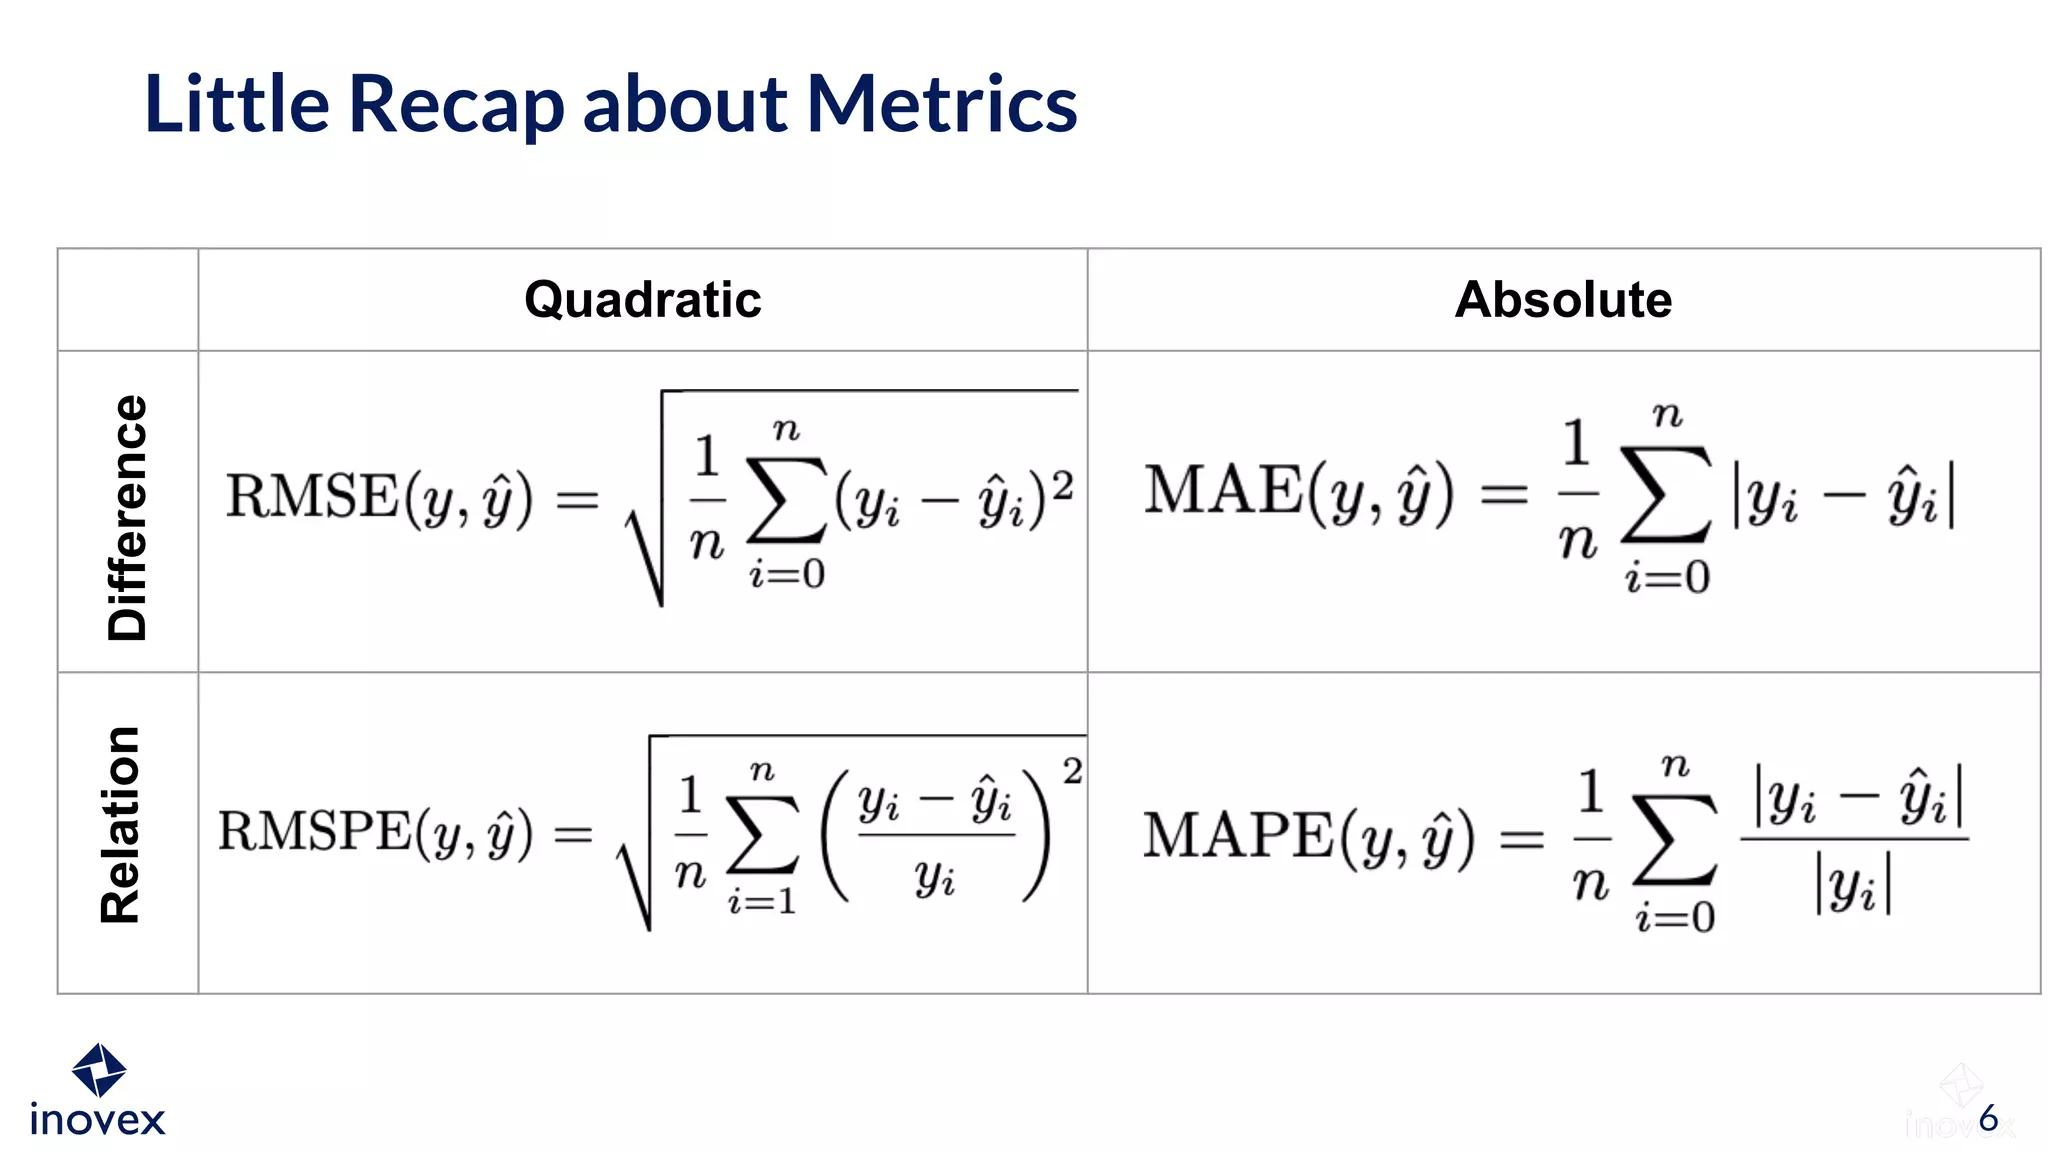
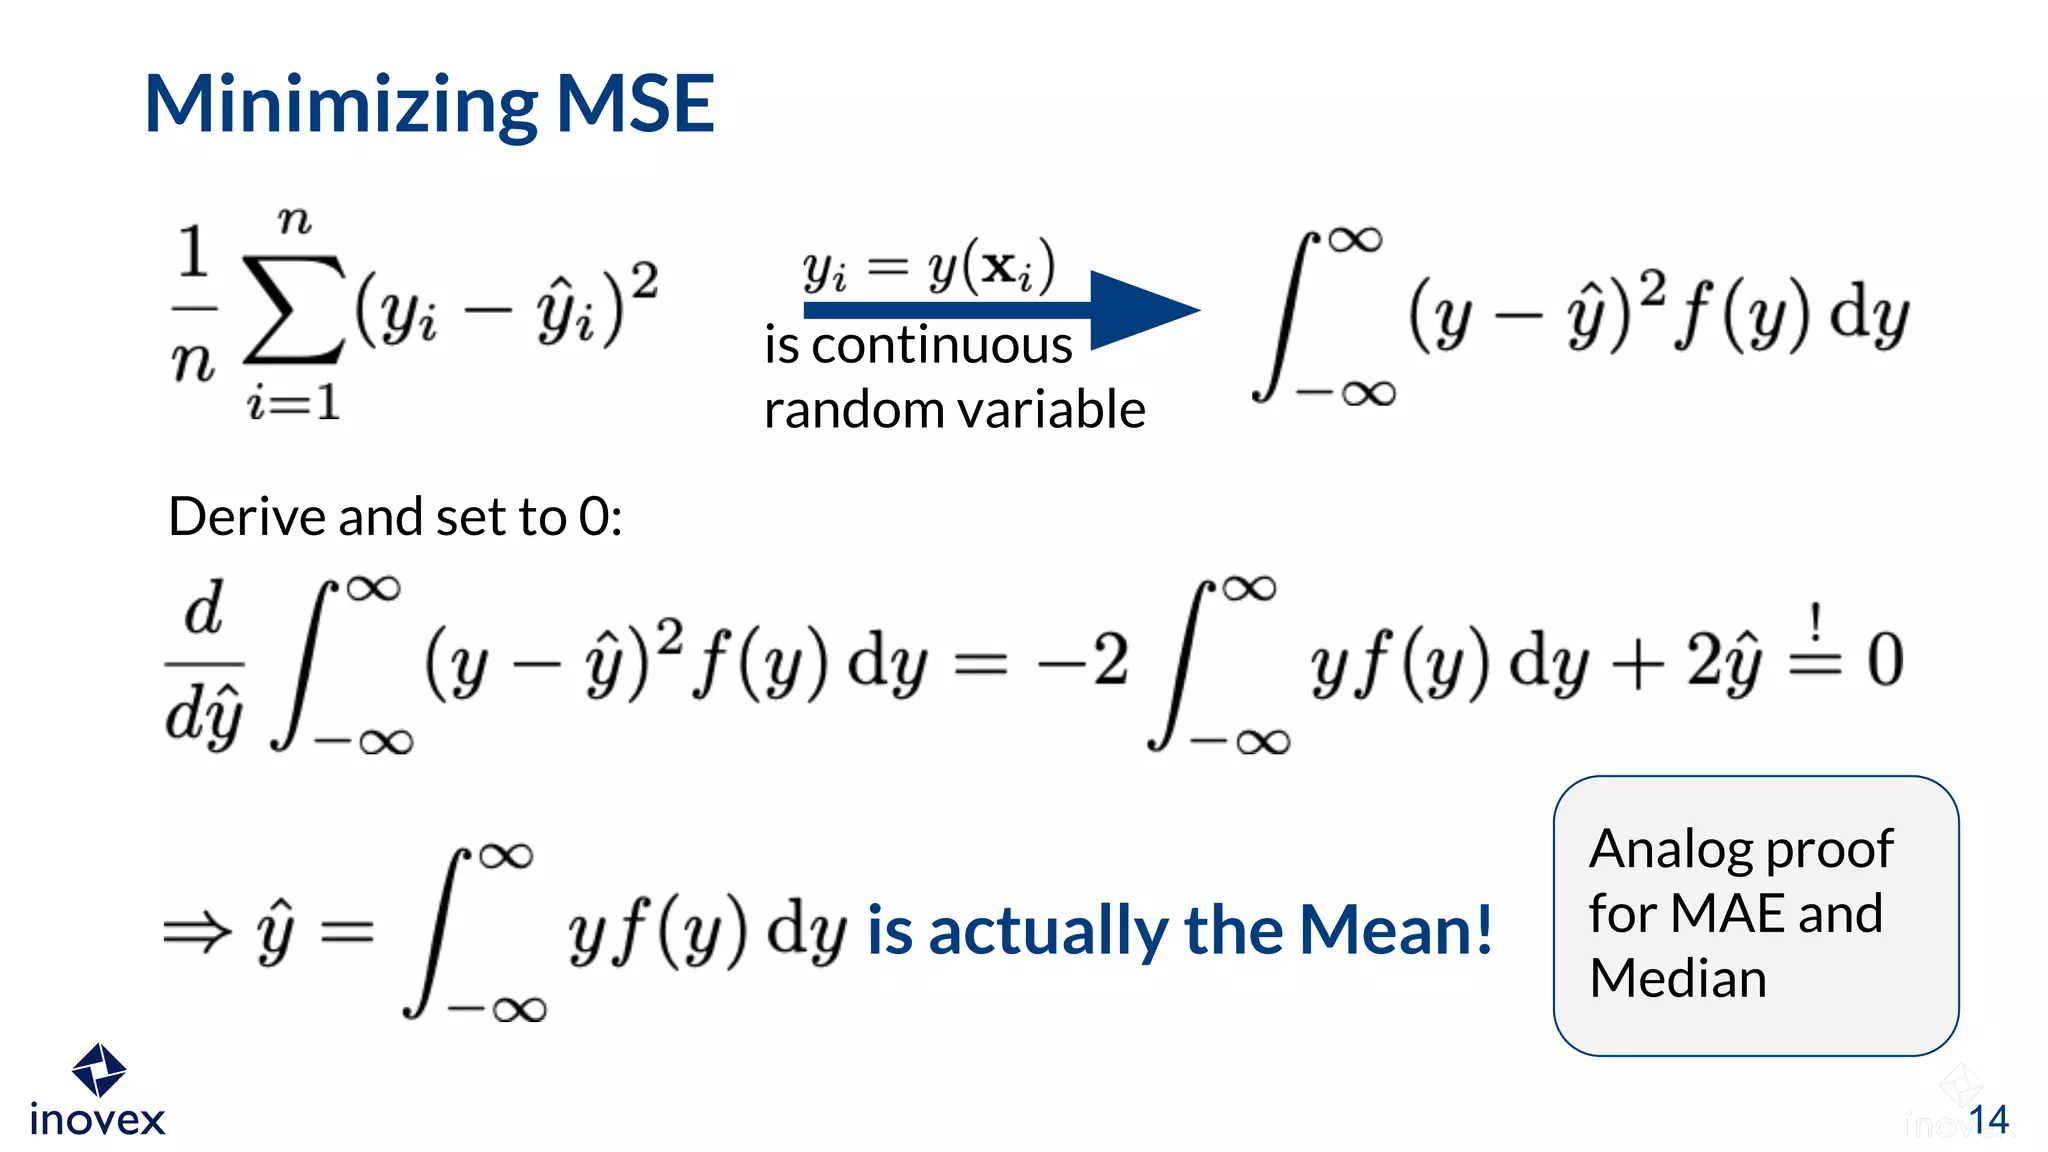
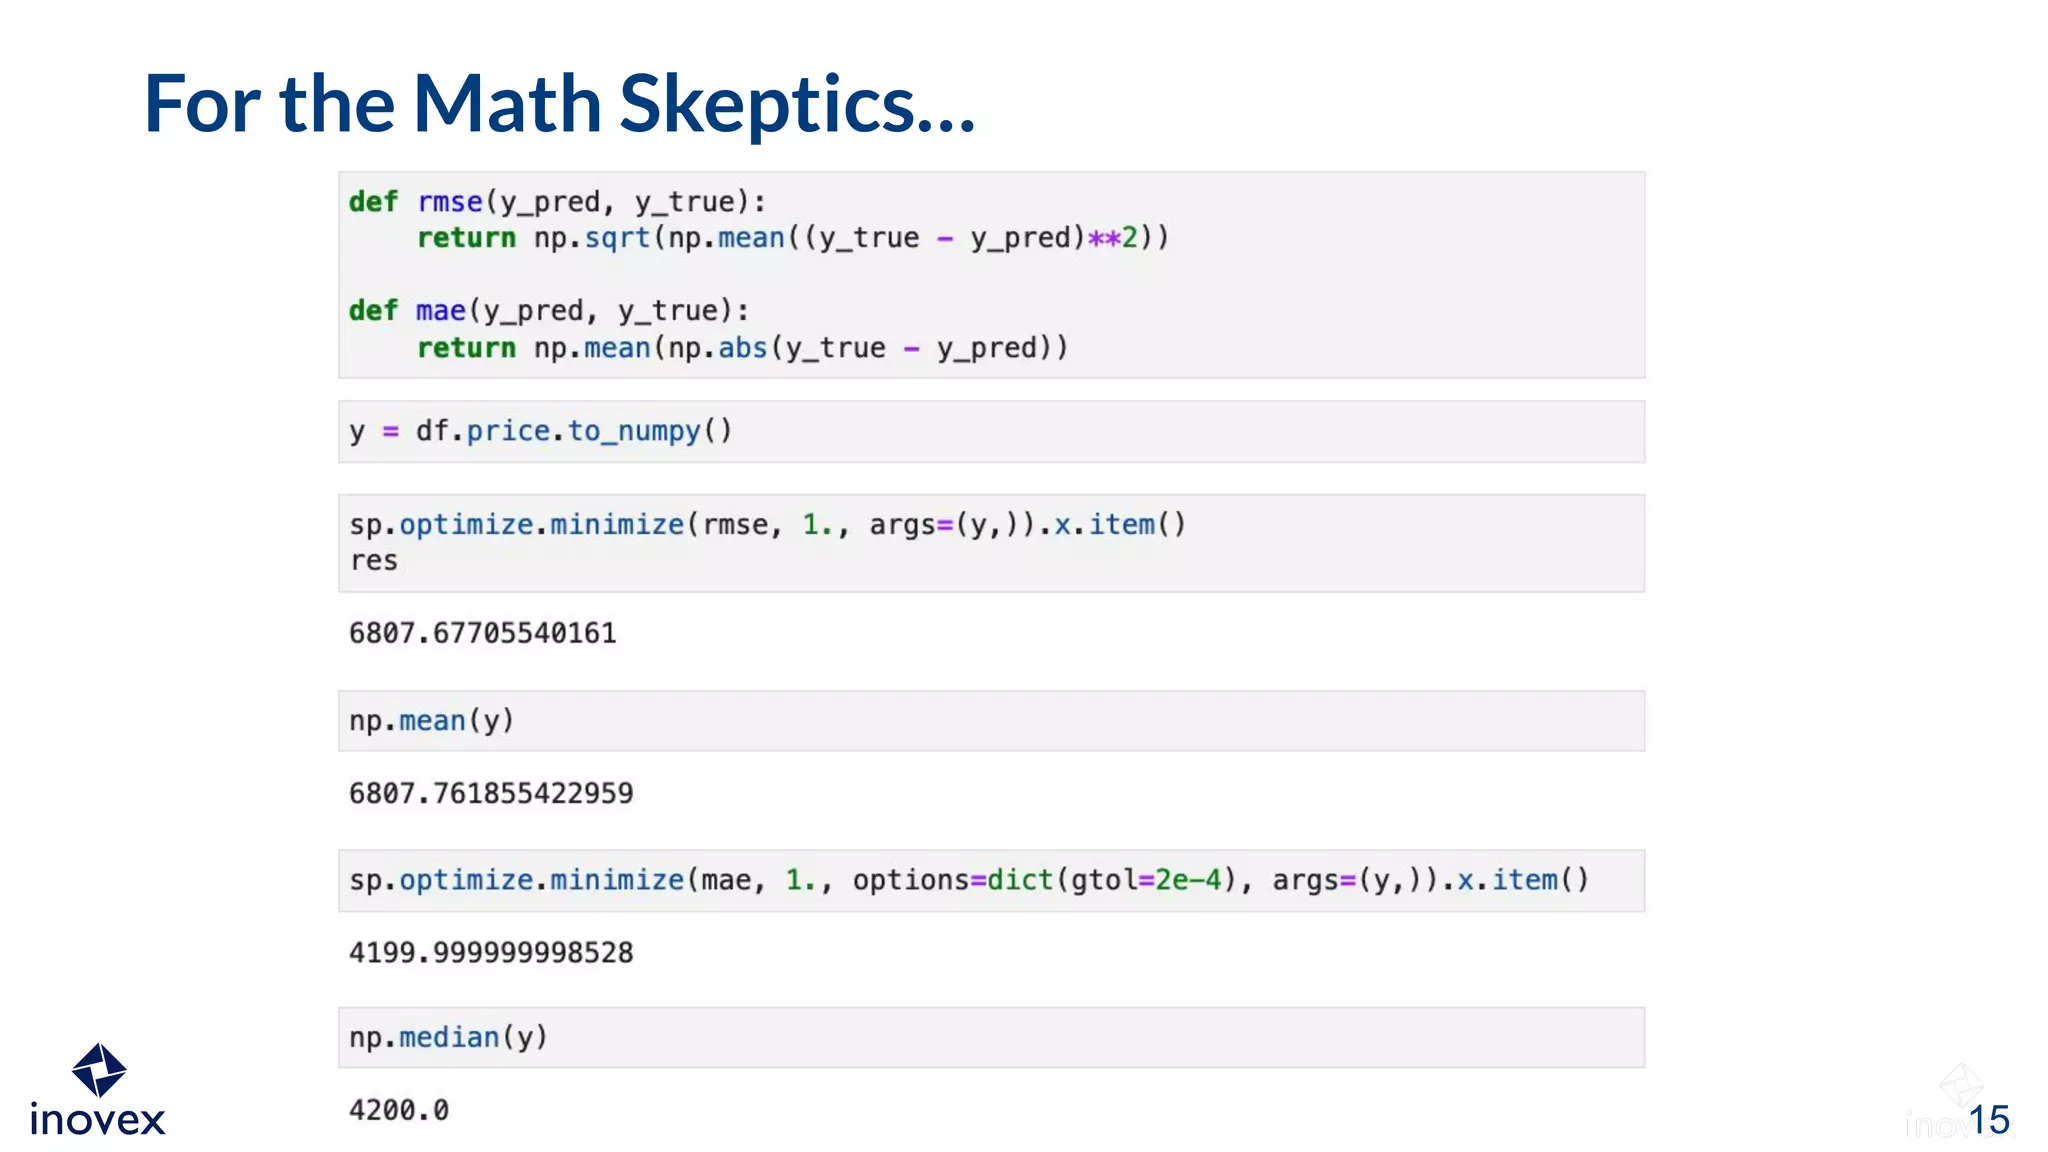
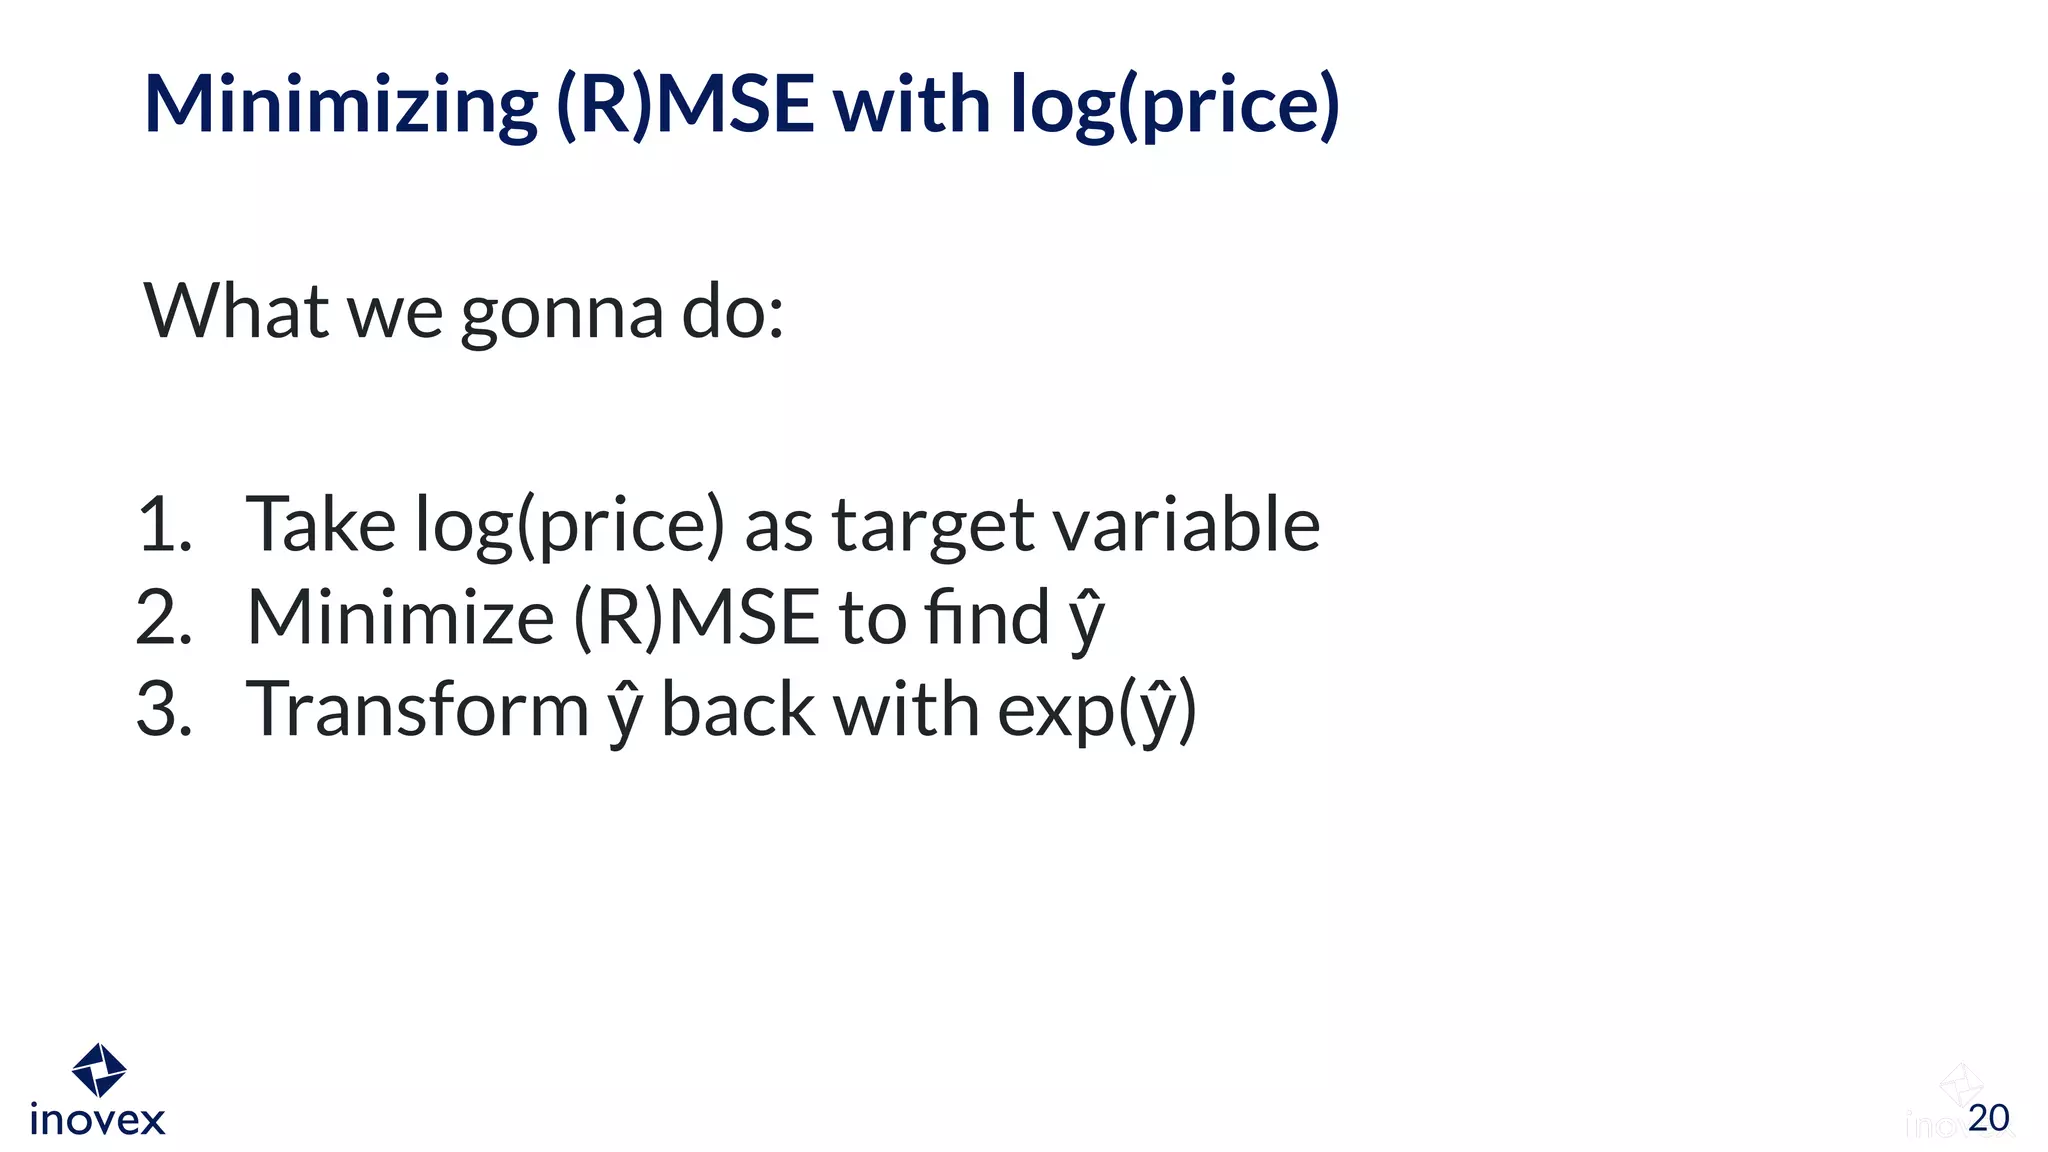
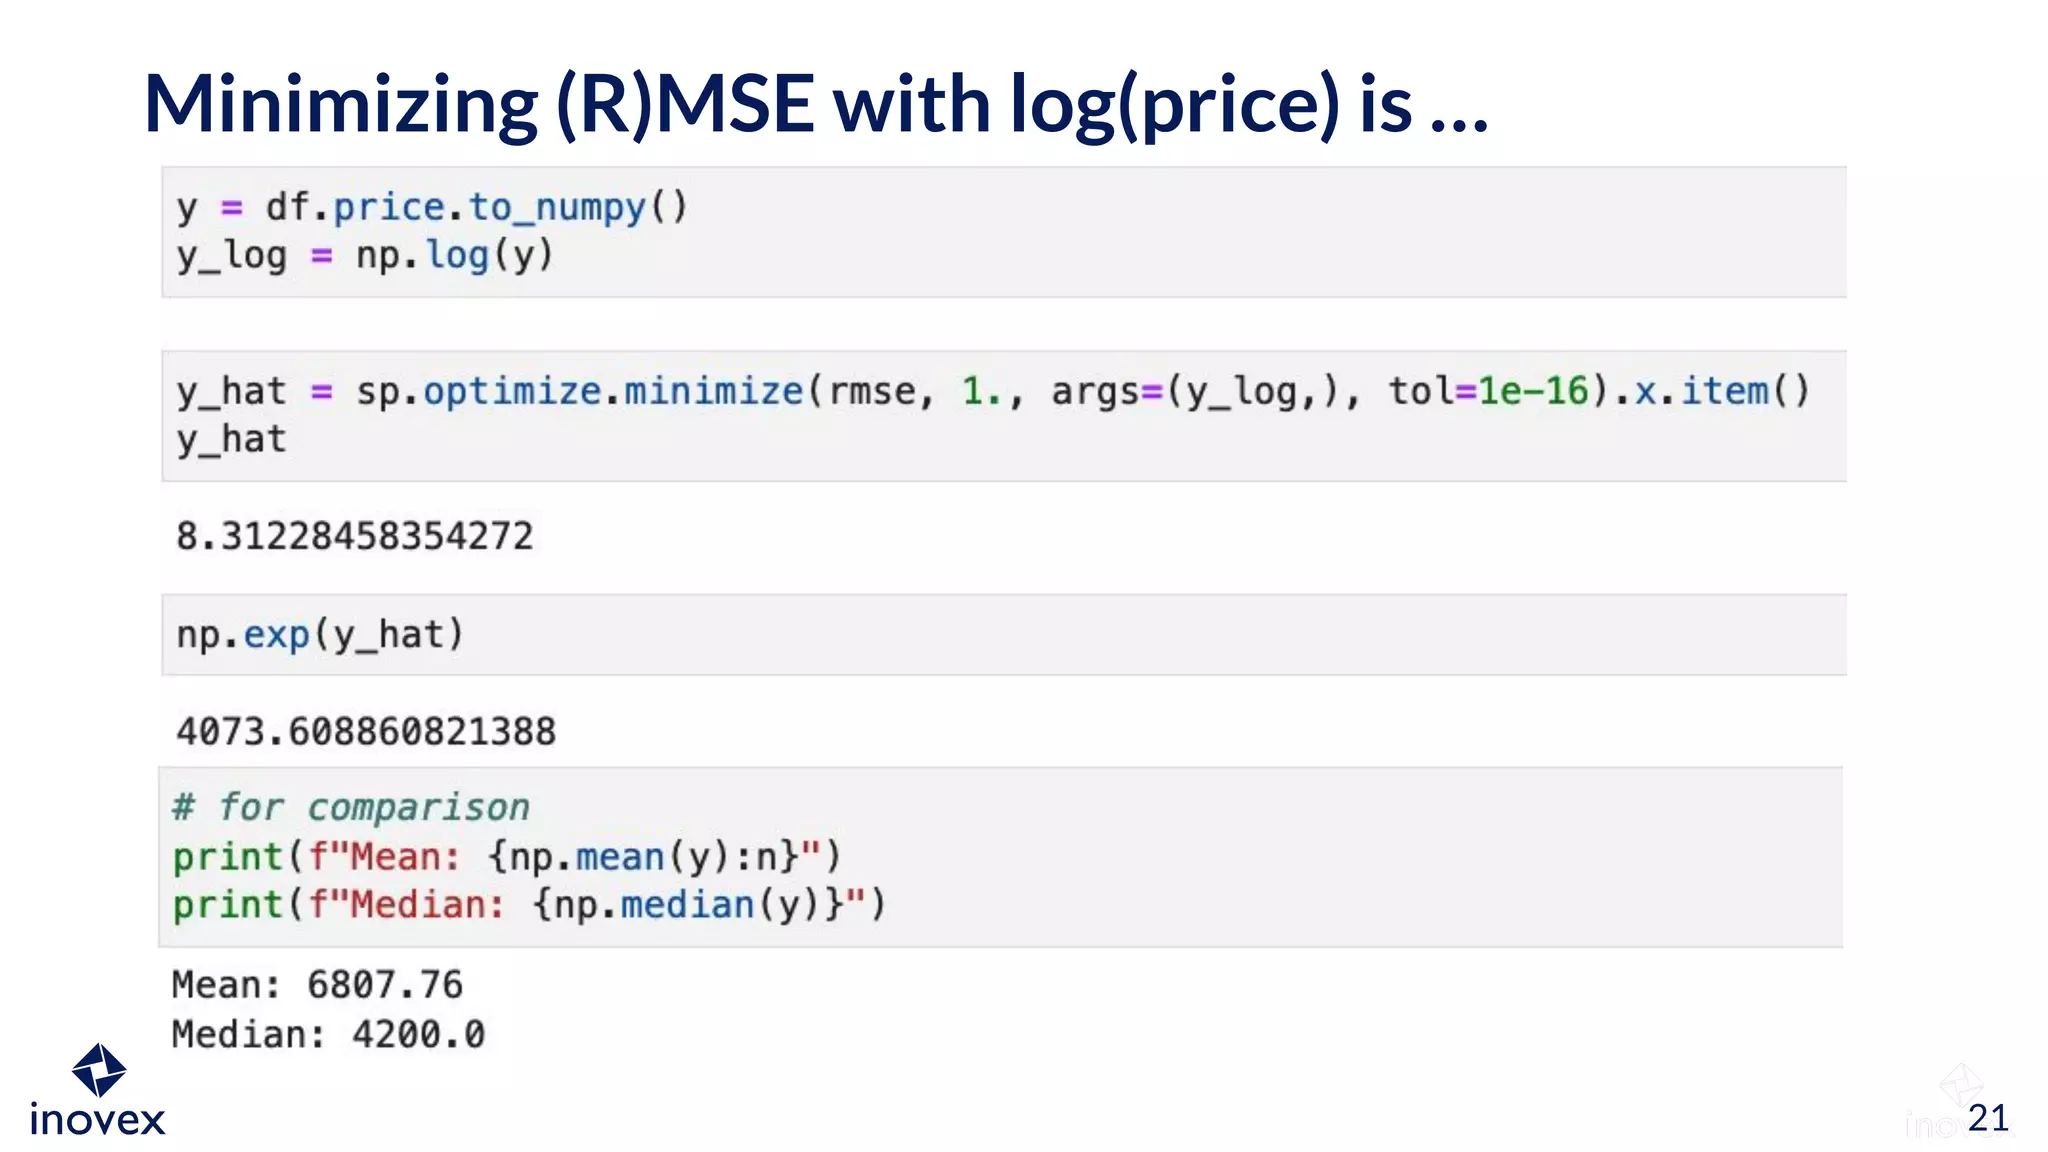
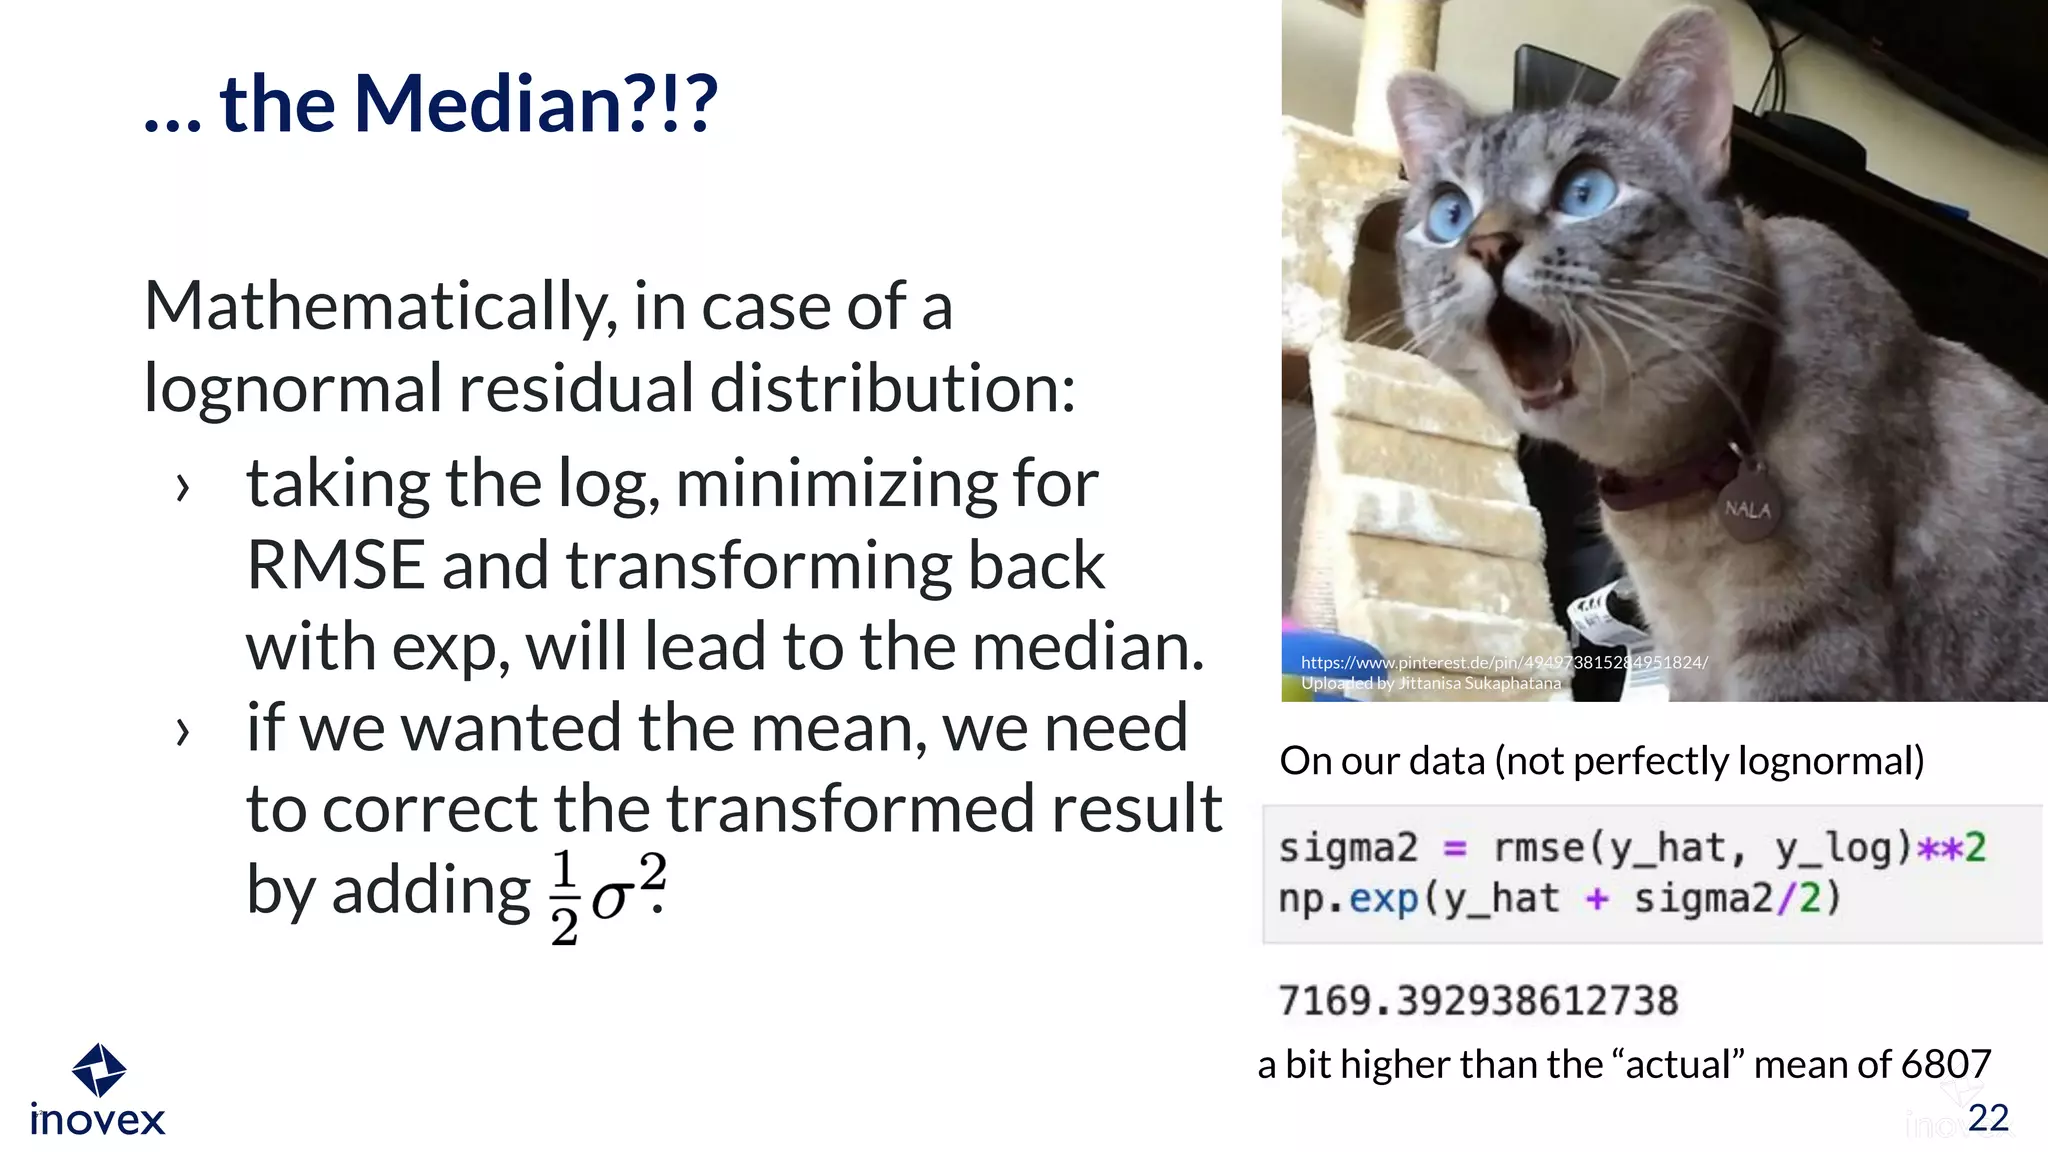
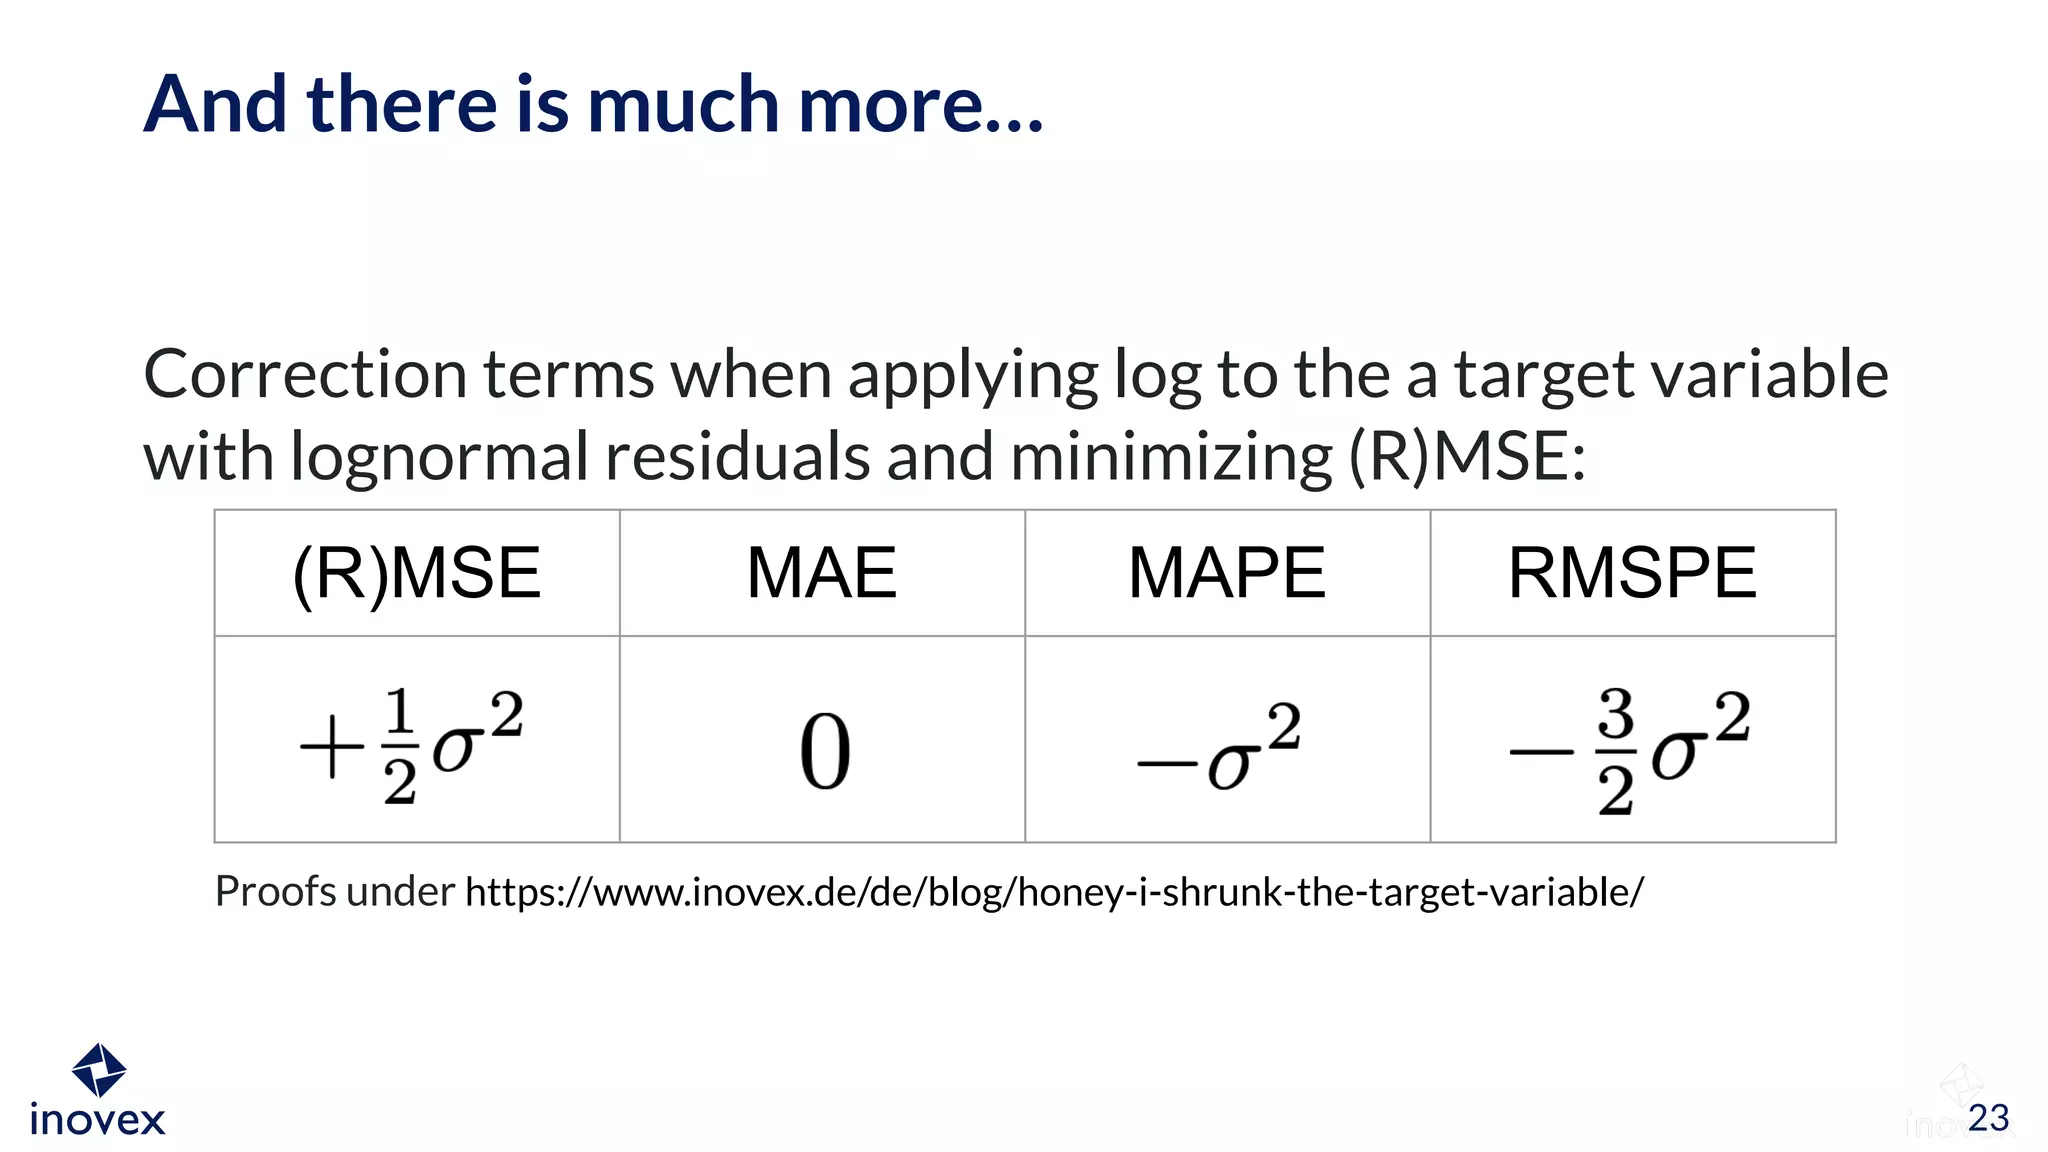
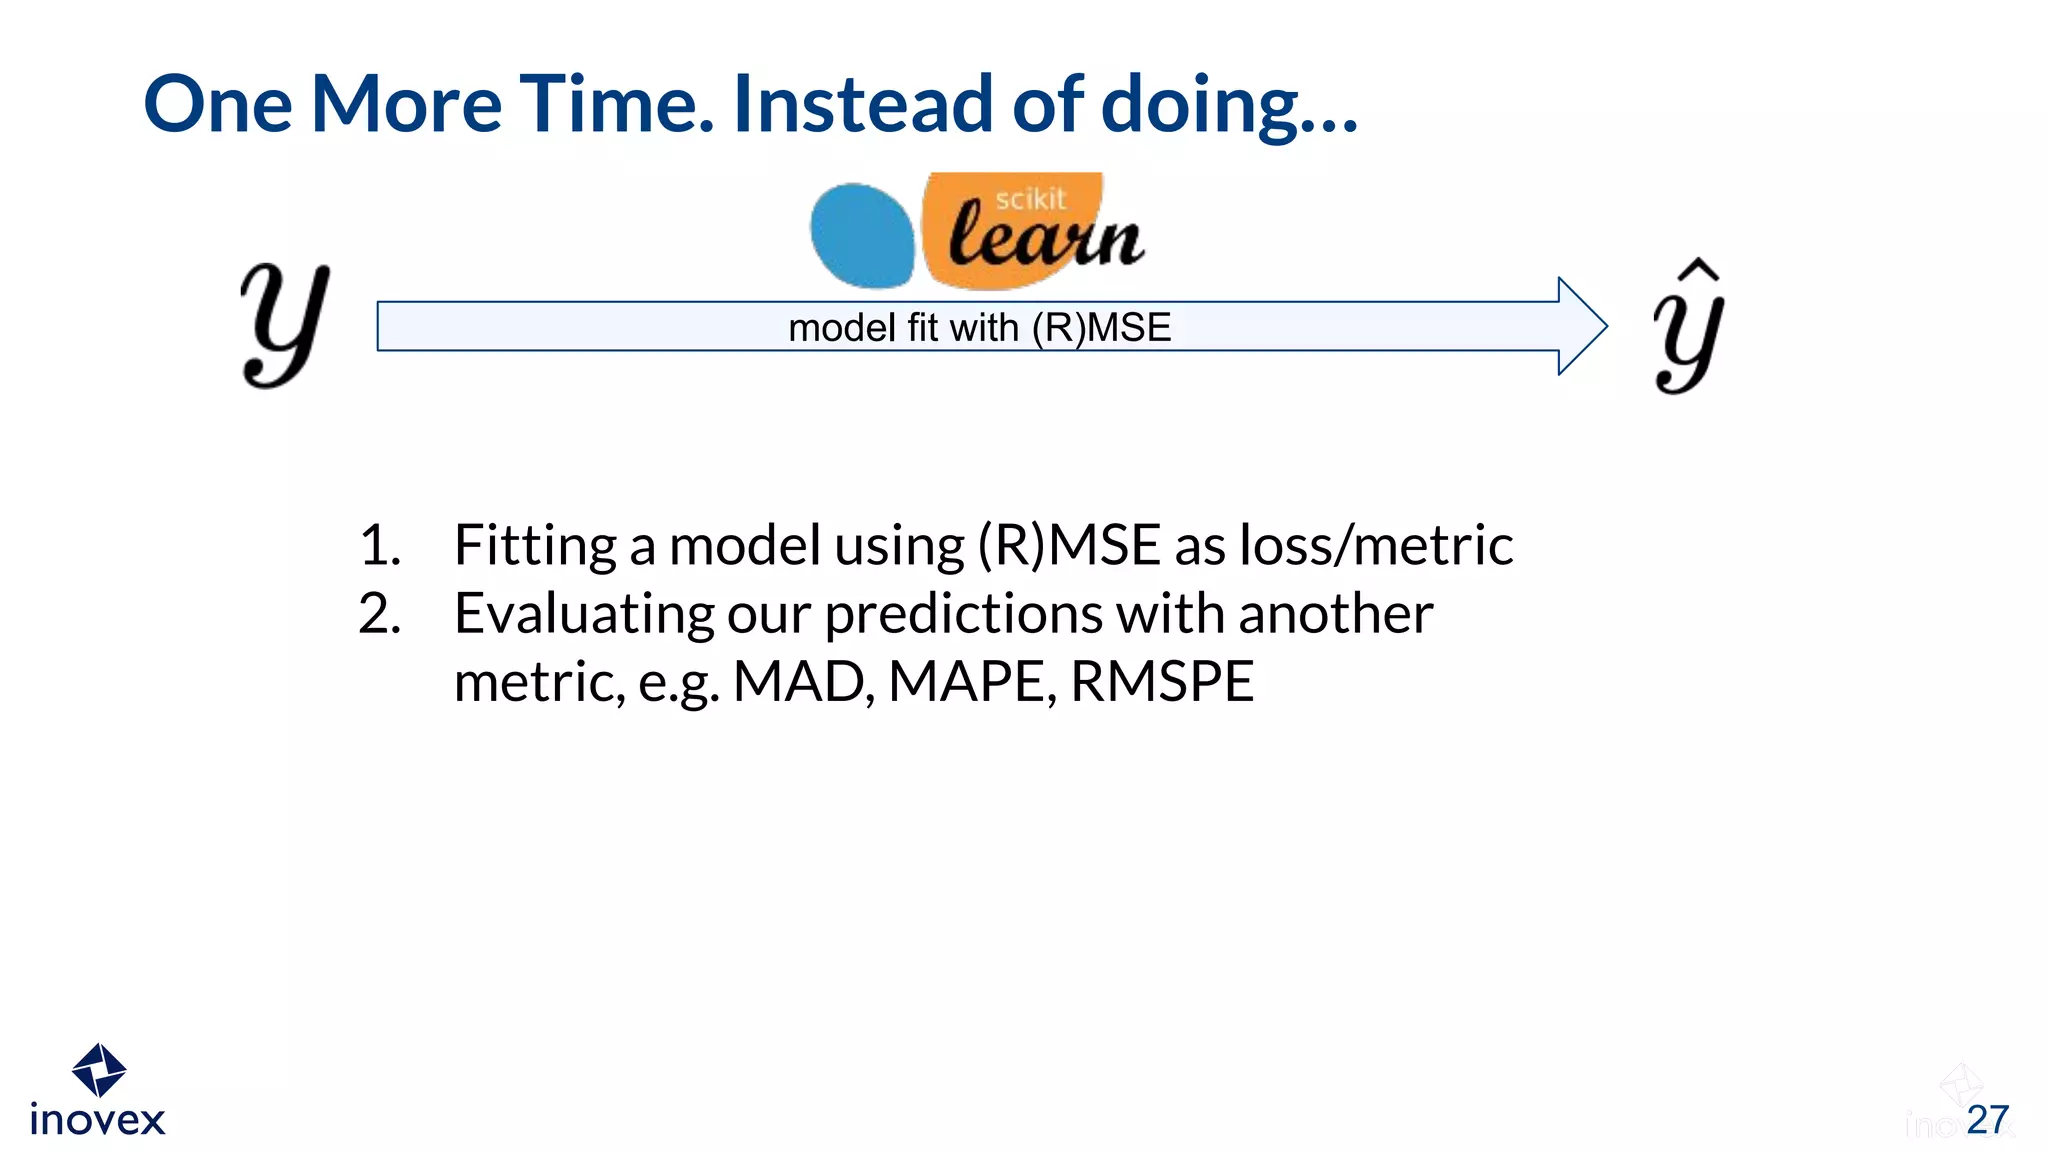
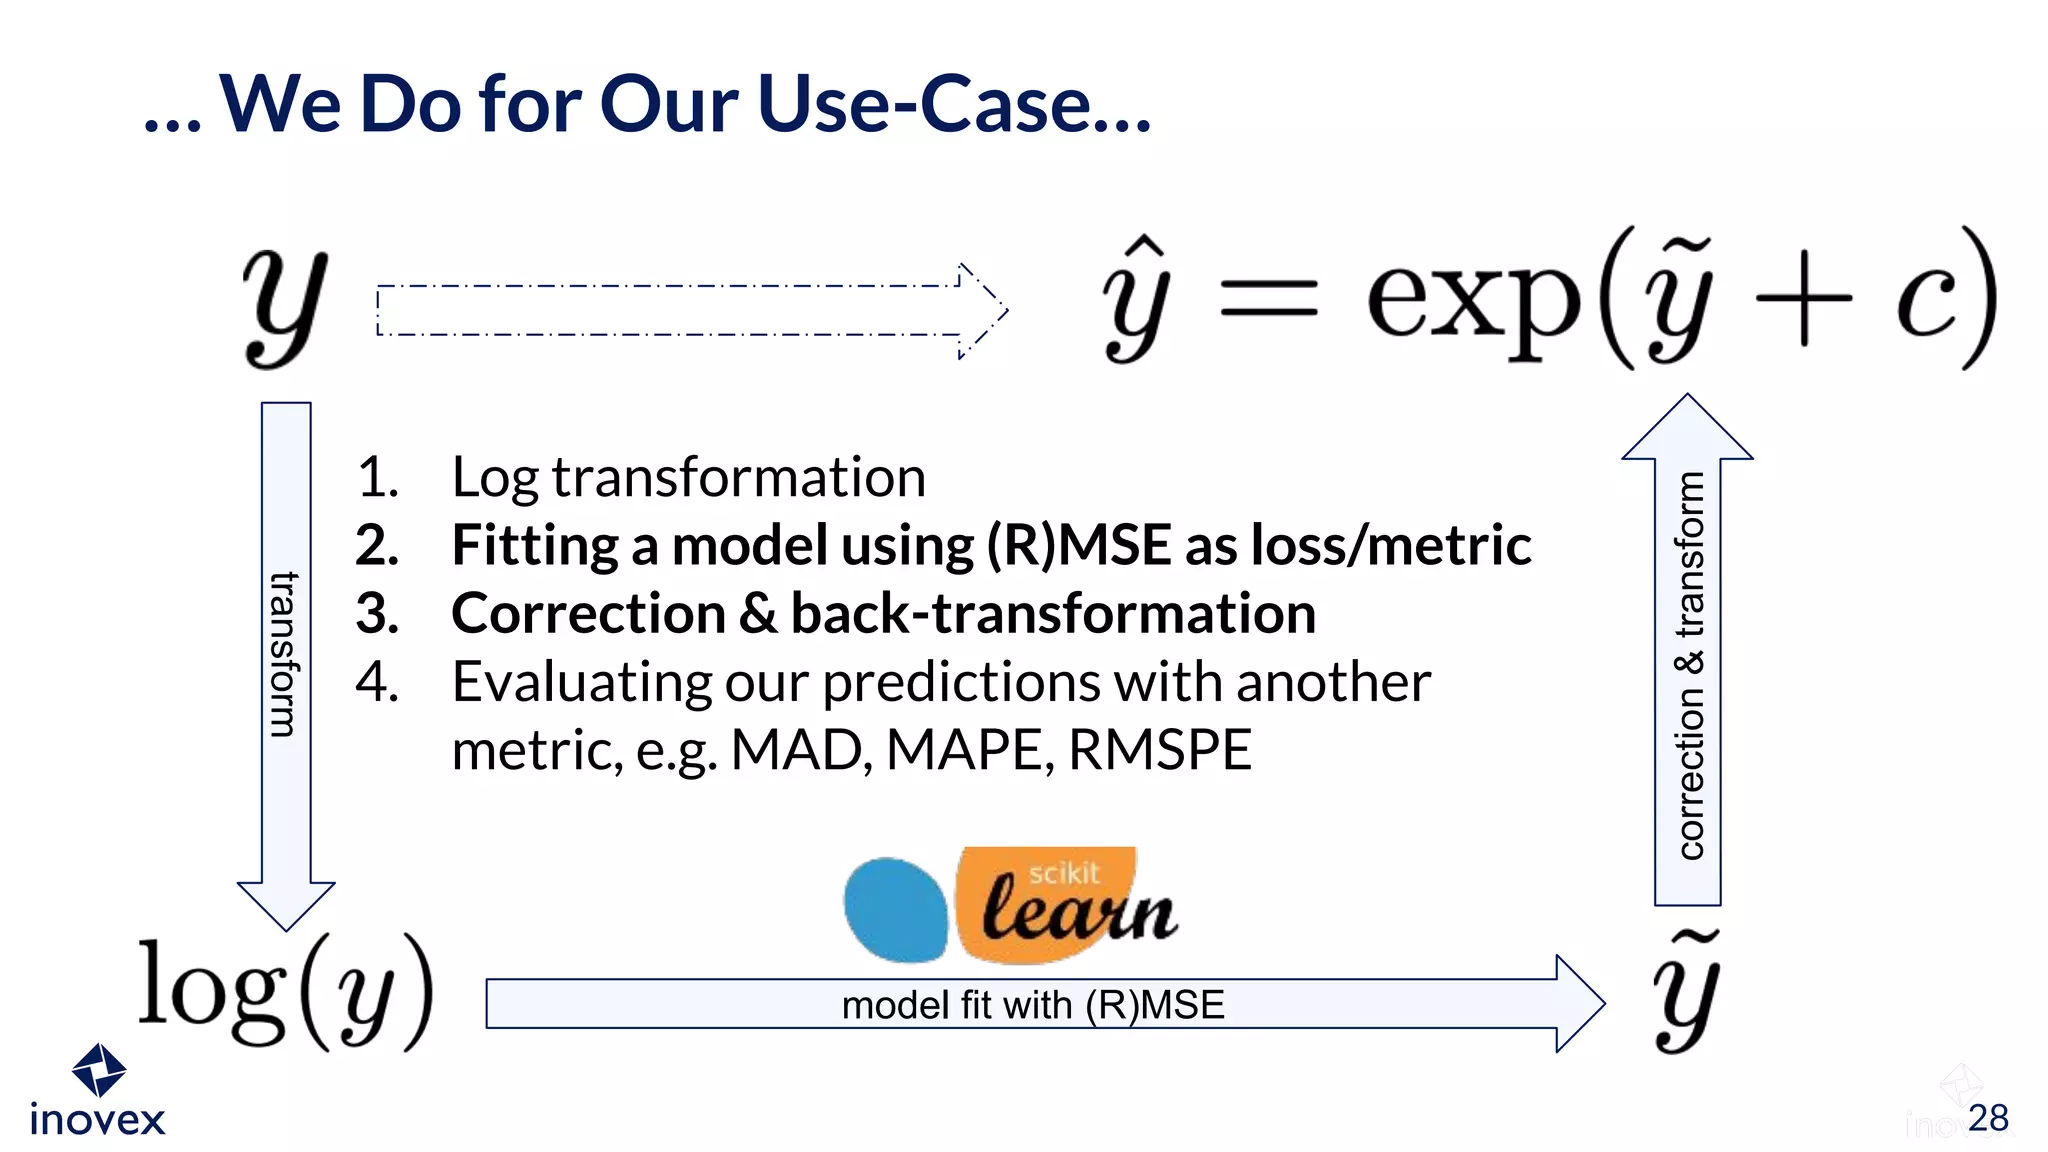
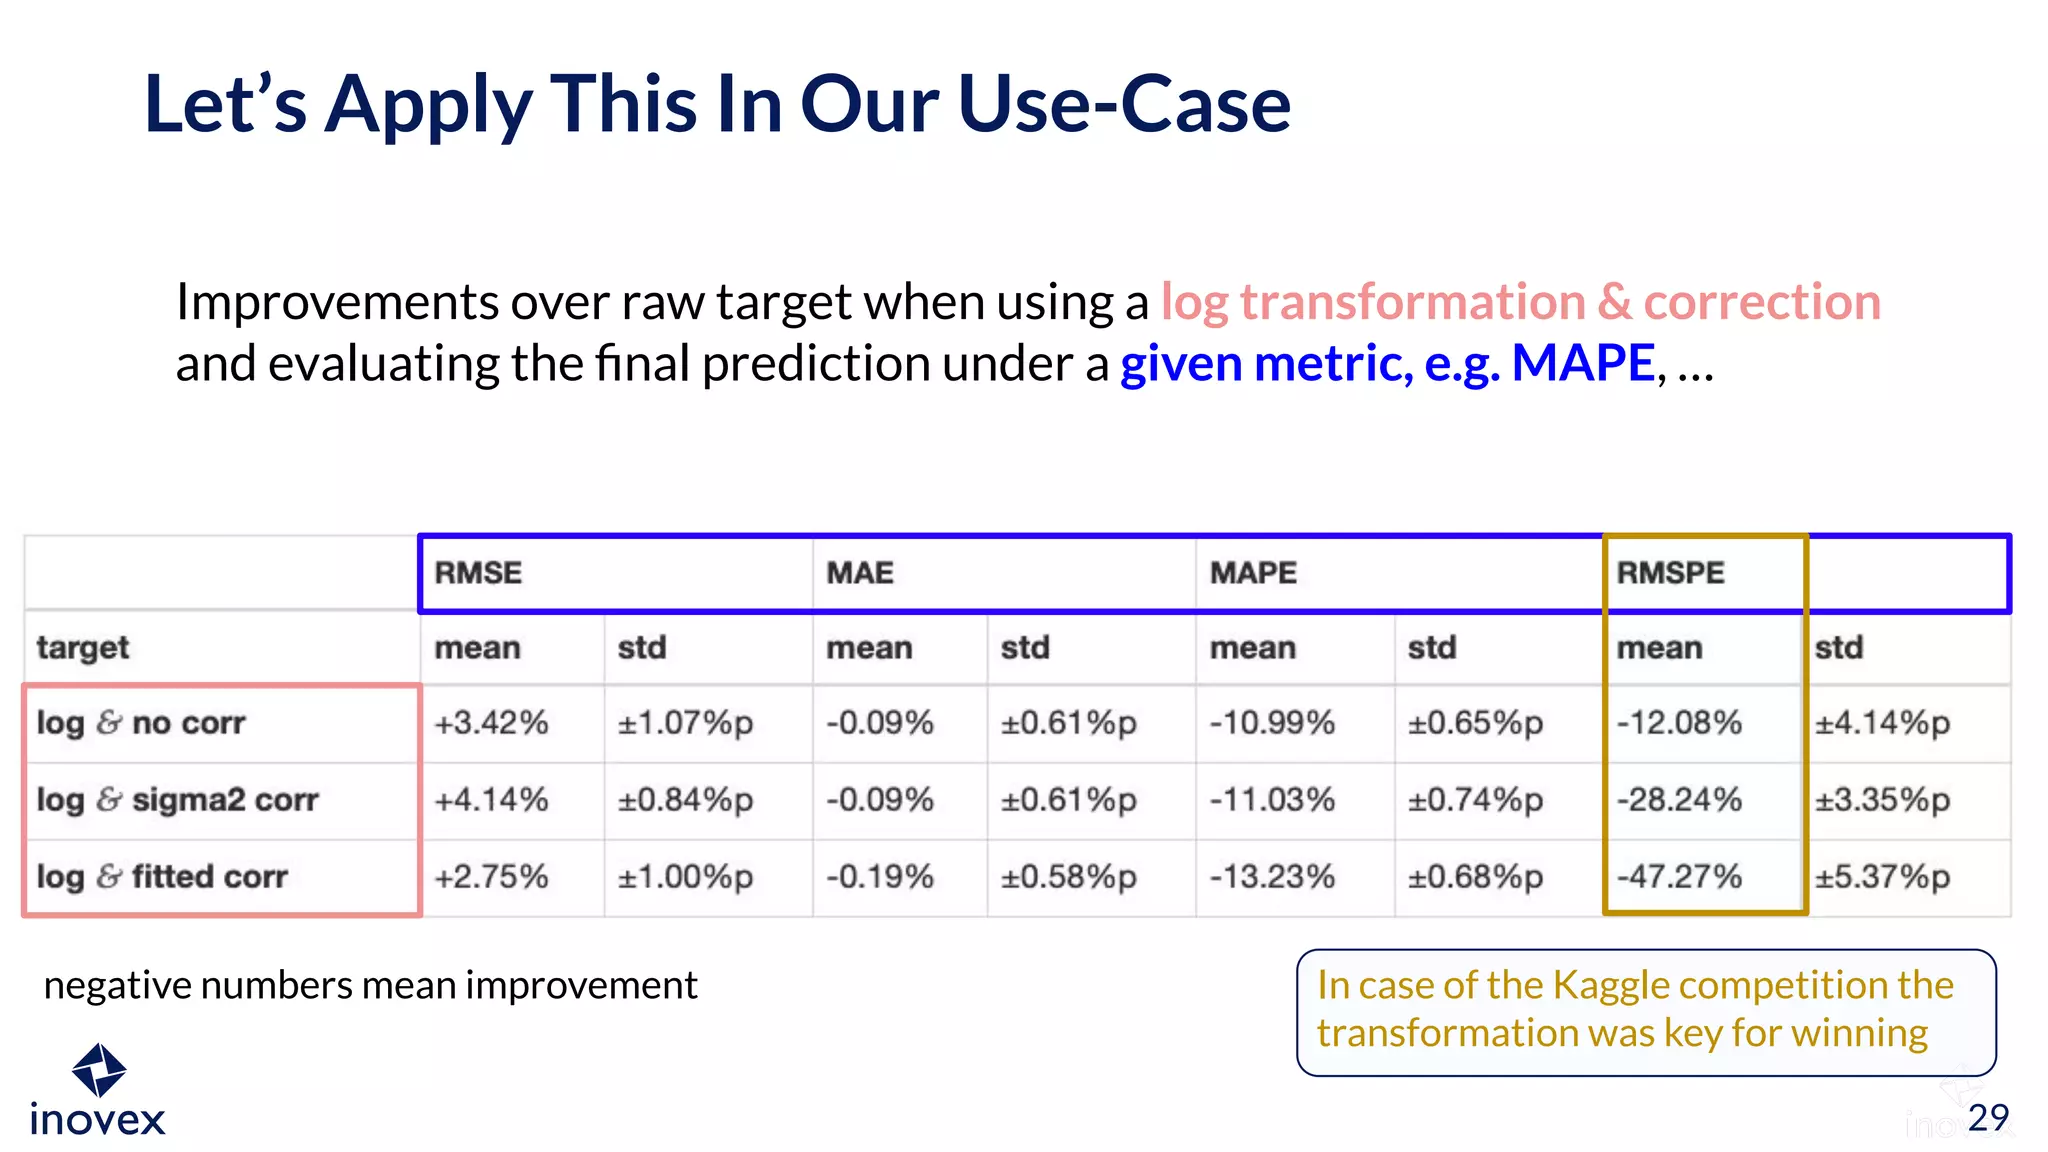
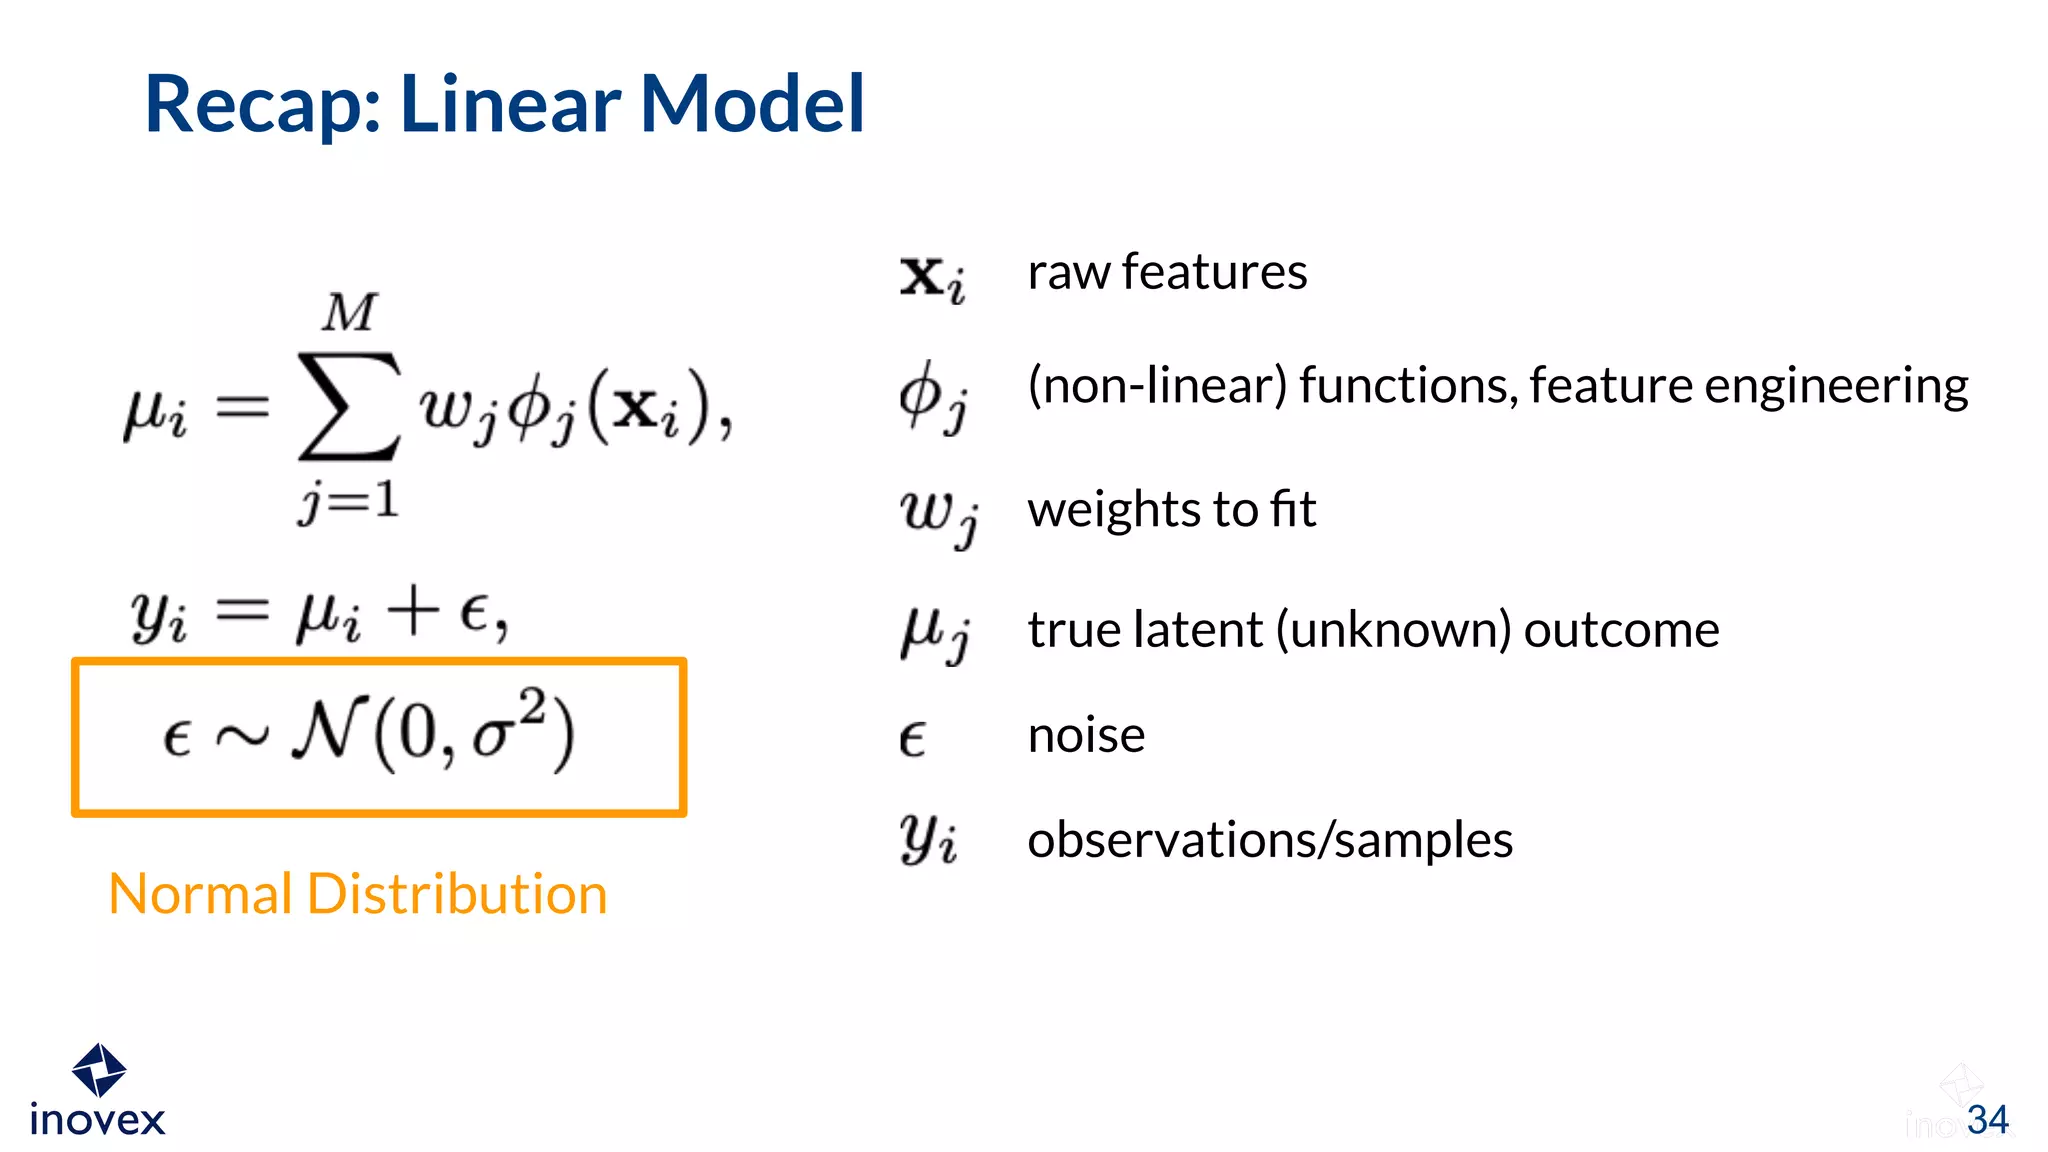
Honey, I Shrunk the Target Variable!
Florian Wilhelm
Common pitfalls when transforming the target variable and
how to exploit transformations
Berlin, April 12th 2022
Dein
Foto
hier
Mathematical Modelling
dA Data Science to Production & MLOps
Personalisation & RecSys
Uncertainty Quantification & Causality
Python Data Stack
Creator of PyScaffold
@FlorianWilhelm
FlorianWilhelm
FlorianWilhem.info
2
Dr. Florian Wilhelm
Head of Data Science @ inovex
inovex is an IT project house
with focus on digital transformation
› Product Discovery · Product Ownership
› Web · UI/UX · Replatforming · Microservices
› Mobile · Apps · Smart Devices · Robotics
› Big Data & Business Intelligence Platforms
› Data Science · Data Products · Search · Deep Learning
› Data Center Automation · DevOps · Cloud · Hosting
› Agile Training · Technology Training · Coaching
Karlsruhe · Pforzheim · Stuttgart · München · Köln · Hamburg
www.inovex.de/en
Using technology to inspire our clients.
And ourselves.
Recap about
Metrics
4
Choosing the Right Metric
› (R)MSE is most often
used in practice
› Scikit-Learn’s
regressors use mostly
MSE as default
5
In which Use-Cases does (R)MSE make sense?
Quadratic Absolute
Little Recap about Metrics
6
Difference
Relation
Our Use-Case
7
8
How much should
I sell my car for?
Model fitted on
many sold cars
and their features
could provide a
fair market value
Our Use-Case Setting
9
1. take used-cars database from Kaggle with 370k cars having
features: vehicle type, model, registration date, gearbox,
powerPS, model, mileage, fuel type, brand and price
2. built a model to estimate the price based on these features
and treat this as a fair market value
3. decide what’s a good/fair/bad price based on this fair
market value
source-code: https://github.com/FlorianWilhelm/used-cars-log-trans/
Question 1:
10
What’s worse? Selling 10 equal cars
with an actual price of 50,000 € and
1. getting the actual price for 9
but only 40,000 € for the last car or
2. getting 49,000 € for every car?
● For (R)MSE option 1 is much worse
● For MAE both options are equally good/bad
Question 2:
11
Which one is worse?
Getting 1,000 € less if your
car’s actual value is
1. 100,000 € or
2. 10,000 €?
● For RMSE & MAE this makes no difference
● For RMSPE & MAPE option 2 is much worse
Learning 1:
The right metric depends on the
use-case and will affect your results!
12
What does minimizing (R)MSE
actually Mean?
13
Minimizing MSE
14
is continuous
random variable
Derive and set to 0:
is actually the Mean!
Analog proof
for MAE and
Median
For the Math Skeptics…
15
Learning 2:
The mean (expected value) minimizes (R)MSE
and the median minimizes MAE.
16
Shrinking the Prices with Log
17
18
18
Distribution of Prices
19
19
Distribution of Prices and LogNormal Fit
Not perfectly lognormal,
which will be important later
Minimizing (R)MSE with log(price)
20
What we gonna do:
1. Take log(price) as target variable
2. Minimize (R)MSE to find ŷ
3. Transform ŷ back with exp(ŷ)
Minimizing (R)MSE with log(price) is …
21
… the Median?!?
Mathematically, in case of a
lognormal residual distribution:
› taking the log, minimizing for
RMSE and transforming back
with exp, will lead to the median.
› if we wanted the mean, we need
to correct the transformed result
by adding .
22
On our data (not perfectly lognormal)
https://www.pinterest.de/pin/494973815284951824/
Uploaded by Jittanisa Sukaphatana
a bit higher than the “actual” mean of 6807
And there is much more…
Correction terms when applying log to the a target variable
with lognormal residuals and minimizing (R)MSE:
23
(R)MSE MAE MAPE RMSPE
Proofs under https://www.inovex.de/de/blog/honey-i-shrunk-the-target-variable/
Learning 3:
Transforming your target might change the
metric you are actually minimizing!
24
Transforming the Target Variable
for Fun & Profit
25
What To Do If Your Metric Is Not Supported?
26
Imagine you want to optimise for RMSPE, and your data has
a lognormal residual distribution but the ML-library your
are using only supports (R)MSE?
One More Time. Instead of doing…
27
model fit with (R)MSE
1. Fitting a model using (R)MSE as loss/metric
2. Evaluating our predictions with another
metric, e.g. MAD, MAPE, RMSPE
… We Do for Our Use-Case…
28
transform
model fit with (R)MSE
correction
&
transform
1. Log transformation
2. Fitting a model using (R)MSE as loss/metric
3. Correction & back-transformation
4. Evaluating our predictions with another
metric, e.g. MAD, MAPE, RMSPE
Let’s Apply This In Our Use-Case
29
Improvements over raw target when using a log transformation & correction
and evaluating the final prediction under a given metric, e.g. MAPE, …
In case of the Kaggle competition the
transformation was key for winning
negative numbers mean improvement
30
Want to know more?
blog.inovex.de
31
https://www.inovex.de/de/blog/honey-i-shrunk-the-target-variable/
Thank you!
Florian Wilhelm
Head of Data Science
inovex GmbH
Schanzenstraße 6-20
Kupferhütte 1.13
51063 Köln
florian.wilhelm@inovex.de
Linear Models
&
Normal Distribution
33
Recap: Linear Model
34
raw features
(non-linear) functions, feature engineering
weights to fit
true latent (unknown) outcome
noise
observations/samples
Normal Distribution
Cathedral Distribution
35
Linear model with a single, binary feature variable x and random noise.
Appendix Learning:
The residuals of a linear model should be
normally distributed, not the target variable.
36

Honey I Shrunk the Target Variable! Common pitfalls when transforming the target variable and how to exploit transformations.

  • 1.
    Honey, I Shrunkthe Target Variable! Florian Wilhelm Common pitfalls when transforming the target variable and how to exploit transformations Berlin, April 12th 2022
  • 2.
    Dein Foto hier Mathematical Modelling dA DataScience to Production & MLOps Personalisation & RecSys Uncertainty Quantification & Causality Python Data Stack Creator of PyScaffold @FlorianWilhelm FlorianWilhelm FlorianWilhem.info 2 Dr. Florian Wilhelm Head of Data Science @ inovex
  • 3.
    inovex is anIT project house with focus on digital transformation › Product Discovery · Product Ownership › Web · UI/UX · Replatforming · Microservices › Mobile · Apps · Smart Devices · Robotics › Big Data & Business Intelligence Platforms › Data Science · Data Products · Search · Deep Learning › Data Center Automation · DevOps · Cloud · Hosting › Agile Training · Technology Training · Coaching Karlsruhe · Pforzheim · Stuttgart · München · Köln · Hamburg www.inovex.de/en Using technology to inspire our clients. And ourselves.
  • 4.
  • 5.
    Choosing the RightMetric › (R)MSE is most often used in practice › Scikit-Learn’s regressors use mostly MSE as default 5 In which Use-Cases does (R)MSE make sense?
  • 6.
    Quadratic Absolute Little Recapabout Metrics 6 Difference Relation
  • 7.
  • 8.
    8 How much should Isell my car for? Model fitted on many sold cars and their features could provide a fair market value
  • 9.
    Our Use-Case Setting 9 1.take used-cars database from Kaggle with 370k cars having features: vehicle type, model, registration date, gearbox, powerPS, model, mileage, fuel type, brand and price 2. built a model to estimate the price based on these features and treat this as a fair market value 3. decide what’s a good/fair/bad price based on this fair market value source-code: https://github.com/FlorianWilhelm/used-cars-log-trans/
  • 10.
    Question 1: 10 What’s worse?Selling 10 equal cars with an actual price of 50,000 € and 1. getting the actual price for 9 but only 40,000 € for the last car or 2. getting 49,000 € for every car? ● For (R)MSE option 1 is much worse ● For MAE both options are equally good/bad
  • 11.
    Question 2: 11 Which oneis worse? Getting 1,000 € less if your car’s actual value is 1. 100,000 € or 2. 10,000 €? ● For RMSE & MAE this makes no difference ● For RMSPE & MAPE option 2 is much worse
  • 12.
    Learning 1: The rightmetric depends on the use-case and will affect your results! 12
  • 13.
    What does minimizing(R)MSE actually Mean? 13
  • 14.
    Minimizing MSE 14 is continuous randomvariable Derive and set to 0: is actually the Mean! Analog proof for MAE and Median
  • 15.
    For the MathSkeptics… 15
  • 16.
    Learning 2: The mean(expected value) minimizes (R)MSE and the median minimizes MAE. 16
  • 17.
  • 18.
  • 19.
    19 19 Distribution of Pricesand LogNormal Fit Not perfectly lognormal, which will be important later
  • 20.
    Minimizing (R)MSE withlog(price) 20 What we gonna do: 1. Take log(price) as target variable 2. Minimize (R)MSE to find ŷ 3. Transform ŷ back with exp(ŷ)
  • 21.
    Minimizing (R)MSE withlog(price) is … 21
  • 22.
    … the Median?!? Mathematically,in case of a lognormal residual distribution: › taking the log, minimizing for RMSE and transforming back with exp, will lead to the median. › if we wanted the mean, we need to correct the transformed result by adding . 22 On our data (not perfectly lognormal) https://www.pinterest.de/pin/494973815284951824/ Uploaded by Jittanisa Sukaphatana a bit higher than the “actual” mean of 6807
  • 23.
    And there ismuch more… Correction terms when applying log to the a target variable with lognormal residuals and minimizing (R)MSE: 23 (R)MSE MAE MAPE RMSPE Proofs under https://www.inovex.de/de/blog/honey-i-shrunk-the-target-variable/
  • 24.
    Learning 3: Transforming yourtarget might change the metric you are actually minimizing! 24
  • 25.
    Transforming the TargetVariable for Fun & Profit 25
  • 26.
    What To DoIf Your Metric Is Not Supported? 26 Imagine you want to optimise for RMSPE, and your data has a lognormal residual distribution but the ML-library your are using only supports (R)MSE?
  • 27.
    One More Time.Instead of doing… 27 model fit with (R)MSE 1. Fitting a model using (R)MSE as loss/metric 2. Evaluating our predictions with another metric, e.g. MAD, MAPE, RMSPE
  • 28.
    … We Dofor Our Use-Case… 28 transform model fit with (R)MSE correction & transform 1. Log transformation 2. Fitting a model using (R)MSE as loss/metric 3. Correction & back-transformation 4. Evaluating our predictions with another metric, e.g. MAD, MAPE, RMSPE
  • 29.
    Let’s Apply ThisIn Our Use-Case 29 Improvements over raw target when using a log transformation & correction and evaluating the final prediction under a given metric, e.g. MAPE, … In case of the Kaggle competition the transformation was key for winning negative numbers mean improvement
  • 30.
  • 31.
    Want to knowmore? blog.inovex.de 31 https://www.inovex.de/de/blog/honey-i-shrunk-the-target-variable/
  • 32.
    Thank you! Florian Wilhelm Headof Data Science inovex GmbH Schanzenstraße 6-20 Kupferhütte 1.13 51063 Köln florian.wilhelm@inovex.de
  • 33.
  • 34.
    Recap: Linear Model 34 rawfeatures (non-linear) functions, feature engineering weights to fit true latent (unknown) outcome noise observations/samples Normal Distribution
  • 35.
    Cathedral Distribution 35 Linear modelwith a single, binary feature variable x and random noise.
  • 36.
    Appendix Learning: The residualsof a linear model should be normally distributed, not the target variable. 36