Downloaded 267 times
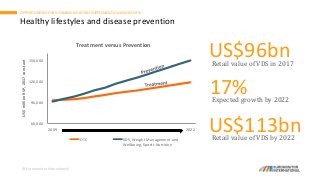
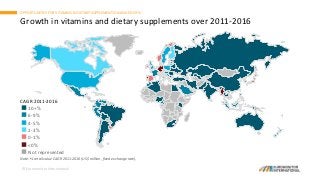
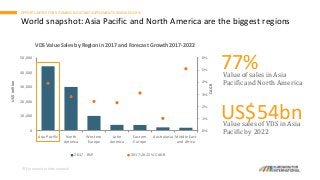
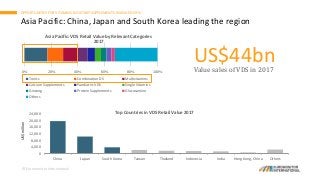
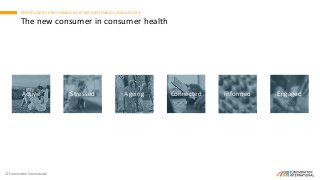
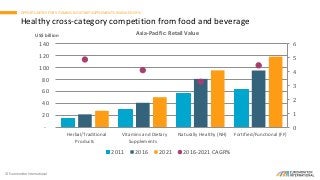
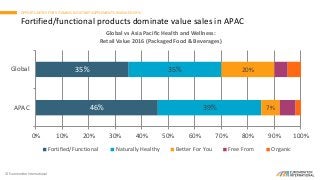
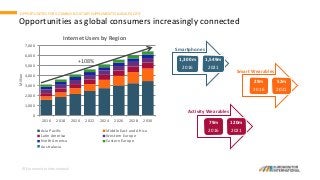
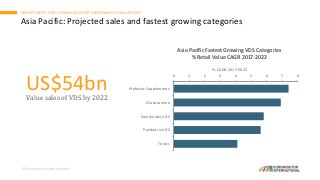

Asia Pacific is the world’s largest market for vitamins and dietary supplements generating US$44 billion in retail value sales in 2017. This presentation explores key trends and opportunities to tap into this rapidly growing industry.


