
Recommended
More Related Content
What's hot
What's hot (19)
Viewers also liked
Similar to RC Circuit Capacitance Analysis
Similar to RC Circuit Capacitance Analysis (20)
RC Circuit Capacitance Analysis
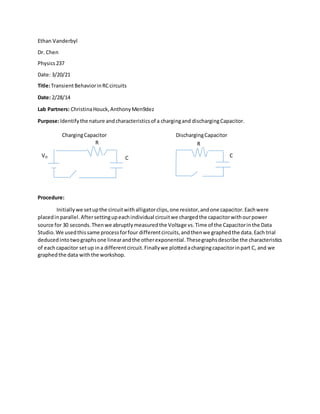
- 1. Ethan Vanderbyl Dr. Chen Physics237 Date: 3/20/21 Title:TransientBehaviorinRCcircuits Date: 2/28/14 Lab Partners: ChristinaHouck,AnthonyMen9dez Purpose:Identifythe nature andcharacteristicsof a chargingand dischargingCapacitor. Procedure: Initiallywe setupthe circuitwithalligatorclips,one resistor,andone capacitor.Eachwere placedinparallel.Aftersettingupeachindividual circuitwe chargedthe capacitorwithourpower source for 30 seconds.Thenwe abruptlymeasuredthe Voltage vs.Time of the Capacitorinthe Data Studio.We usedthissame processforfour differentcircuits,andthenwe graphedthe data.Each trial deducedintotwographsone linearandthe otherexponential.Thesegraphsdescribe the characteristics of eachcapacitor setup ina differentcircuit.Finallywe plottedachargingcapacitorinpart C, and we graphedthe data withthe workshop. ChargingCapacitor DischargingCapacitor R VO C R C
- 2. Data: y = 8.4047e-0.015x 0 1 2 3 4 5 6 7 8 9 10 0 20 40 60 80 100 120 140 160 Votage(V) Time (s) Graph 2: Circuit 1 Run #2 Volatge vs. Time y = 8.5046e-0.013x 0 2 4 6 8 10 0 50 100 150 200 Voltatge(V) Time (s) Graph 1: Circuit 1 Run # 1 Voltage vs. Time
- 3. Results: Graph Manufactured Capacitance (μFarads) Graph Capacitance (μ Farads) % difference 1 22000 24,150 9.77% 2 22000 21,000 4.5% Calculations: 1. I = 𝑉𝑒−𝑡/𝑅𝐶 y = 8.4705e-0.029x 0 1 2 3 4 5 6 7 8 9 0 10 20 30 40 50 60 70 80 90 Voltage(V) TIme (s) Graph 3: Circuit 2, Run #1 Voltage vs. time y = 8.3245e-0.007x 0 1 2 3 4 5 6 7 8 9 0 50 100 150 200 250 300 350 AxisTitle Axis Title Graph 4: CIrcuit 3, Run #1 Voltage vs. Time
- 4. 2. Time constant = 𝑚−1 3. C= time constant/R 4. %error=(Caccepted – Ccalculated )/Caccepted x 100 Sample Calculations: 1. I = 1𝑉𝑒 (− 170 (3300∗22000) ) = 1A 2. 78.402 3. 𝐶 = 78.402 3.26𝑘𝑜ℎ𝑚𝑠 = .02415 4. %𝑒𝑟𝑟𝑜𝑟 = 22000−24150 22000 ∗ 100 = 9.77% Questions(Analysis): 1. 2. 𝑖 = 𝑑𝑞 𝑑𝑡 𝑉𝑐 = 𝑉𝑒−𝑡/𝑅𝐶 𝑞 = 𝐶𝑉𝑒−𝑡/𝑅𝐶 = 𝐼𝑒−𝑡/𝑅𝐶 Graph 5: Voltage vs.Time
- 5. y = -0.0127x + 2.1406 -0.5 0 0.5 1 1.5 2 2.5 0 50 100 150 200 Voltage Time (s) Graph 1: Circuit 1 Run # 1 Voltage vs. Time y = -0.0146x + 2.1288 -0.5 0 0.5 1 1.5 2 2.5 0 20 40 60 80 100 120 140 160 Voltaage(V) Time (s) Graph 2: Ciruit 1 Run #2 Voltage vs. Time 3.
- 6. 4. Value Voltage (V) Time (s) VO 8.655 0 τ 3.185 76.28 VO to .5V 1.593 131.24 .5VO to .25VO 0.796 186.2 .25VO to .125VO 0.398 241.16 y = -0.0068x + 2.1192 0 0.5 1 1.5 2 2.5 0 50 100 150 200 250 300 350 Voltage(V) Time (s) Graph 4: Circuit 3, Run #1 Voltage vs. Time (Parallel) y = -0.0285x + 2.1366 -0.5 0 0.5 1 1.5 2 2.5 0 20 40 60 80 100 Voltage(V) Time (s) Graph 3: Circuit 2 Run #1 Voltage vs. TIme (Series)
- 7. 5. Graph Slope (m) Time Constant(s) 1 -.0127 78.7402 2 -.0146 68.4932 3 -.0285 35.0877 4 -.0068 147.059 6. Graph Time Constant(s) Capacitance (C) 1 78.7402 .02415 2 68.4932 .0210 3 35.0877 .0108 4 147.059 .0451 7. Graph Manufactured Capacitance (μFarads) Graph Capacitance (μ Farads) % difference 1 22000 24,150 9.77% 2 22000 21,000 4.5% 8. Graph CalculatedValues(μFarads) ExpectedValues(μFarads) 3 10800 11000 4 45100 11000 Conclusion: The principle thatwasprovedinthislabis the fact that a charging dischargingcapacitoris describedby 𝑞 = 𝑉𝐶𝑒−𝑡/𝑅𝐶.The graphsin thislabdescribe the capacitorswithrespecttovoltage vs. time.Fromthe graphs we were able todefine how differentcircuitsetupseffectthe efficiencyof the capacitor,whicheffectthe capacitorscharacteristicswithrespect tovelocityandtime.The slope relates to the time constant,whichwe usedtofindthe Capacitance.We accomplishedthe purpose of thislab because ourpercenterrorsof the Capacitance are verylow.Our percenterrorsbetweenourcalculated value andthe exceptedvalue were9.8% and 4.5%. Thisexperimentcouldhave beenimprovedif ourerrorswere eliminated.Some of these errors includedthe time we chargedanddischargedthe capacitor.If were able tomake these readingsmore precise ourpercenterrorswouldhave beenless.We alsoencounterederrorsbecauseof the constant resistance inanimperfectcircuit.These errorscouldhave beenavoidedbyusingamechanical device to
- 8. take the time measurementsandthe circuitcouldhave beenmade betterbyusingbettermetalsas conductors.Overall the errorsthatoccurred were minimal andtherefore we achievedgoodpercent errors.