Population Cultural Considerations and Genetic Predispositions.docx
Obesity and Physical Activity & SRH Poster
1. Obesity and physical activity: are they associated with self-rated health
among racially diverse adolescents?
Sanchez-Vaznaugh, EV1., Flores, E2., Giang, E2., Aldridge, A2., Barreiro, K2.
Abstract
Methods
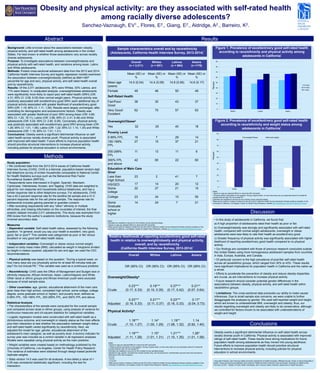
Results
Background: Little is known about the associations between obesity,
physical activity, and self-rated health among adolescents in the United
States. Far less known is whether those associations vary across racially
diverse adolescents.
Purpose: To investigate associations between overweight/obesity and
physical activity with self-rated health, and variations among Asian, Latino
and White adolescents.
Methods: Pooled cross-sectional adolescent data from the 2013 and 2014
California Health Interview Survey and logistic regression models examined
the association between overweight/obesity (defined as BMI>=85th
percentile for age and sex), physical activity, and self-rated health overall
and by race/ethnicity.
Results: Of the 2,011 adolescents, 36% were Whites, 53% Latinos, and
11% were Asians. In unadjusted analysis, overweight/obese adolescents
were significantly more likely to report poor self-rated health (SRH) (OR:
4.31; 95% CI: 3.08, 6.05) than normal weight peers. Physical activity was
positively associated with excellent/very good SRH; each additional day of
physical activity associated with greater likelihood of excellent/very good
SRH (OR: 1.19; 95% CI: 1.11, 1.28). Results were largely unchanged, after
controlling for demographic and socioeconomic factors. Obesity was
associated with greater likelihood of poor SRH among Asian (OR: 4.66;
95% CI: 1.20, 18.11), Latino (OR: 3.96; 95% CI: 2.41, 6.48) and White
adolescents (OR: 5.04; 95% CI: 2.80, 9.08). Conversely, physical activity
was positively associated with excellent/very good SRH among Asian (OR:
1.26; 95% CI: 1.01, 1.58), Latino (OR: 1.22; 95% CI: 1.10, 1.35) and White
adolescents (OR: 1.15; 95% CI: 1.01, 1.31).
Conclusions: Obesity exerts a significant detrimental influence on self-
rated health across racially diverse youth. Physical activity is associated
with improved self-rated health. Future efforts to improve population health
should prioritize structural interventions to increase physical activity,
including policies for physical education in school environments.
Study population
• We combined data from the 2013-2014 waves of California Health
Interview Survey (CHIS). CHIS is a biennial, population-based random-digit
dial telephone survey of civilian households comparable to National Center
for Health Statistics surveys such as the Behavioral Risk Factor
Surveillance System (BRFSS).
• Respondents were interviewed in English, Spanish, Mandarin,
Cantonese, Vietnamese, Korean, and Tagalog. CHIS data are weighted to
adjust for non-response and households without telephones, and has a
similar response rate to other telephone surveys. For adolescents, CHIS
has a 40.2 percent response rate for the landline list sample and a 41.0
percent response rate for the cell phone sample. The response rate for
adolescents includes gaining parental or guardian consent.
• After excluding respondents with any “other” ethnicity or multiple
ethnicities, and missing information on the covariates of interest, the final
analytic dataset included 2,011 adolescents. This study was exempted from
IRB review from the author’s academic institutions, because the study
involved secondary data.
Measures
• Dependent variable: Self-rated health status, assessed by the following
question: “In general, would you say your health is excellent, very good,
good, fair or poor?” This variable was categorized as poor or fair versus
excellent or very good self-rated health status.
• Independent variables: Overweight or obese versus normal weight,
based on body mass index (BMI), calculated as weight in kilograms divided
by height in meters squared, adjusted for sex and age; we used the CDC
recommendations.
• Physical activity was based on the question: “During a typical week, on
how many days are you physically active for at least 60 minutes total per
day? Do not include PE.” This variable was used as a continuous predictor.
• Race/ethnicity: CHIS uses the Office of Management and Budget race or
ethnicity measures; African American, Asian, Latino/Hispanic and White.
Other racial or ethnic groups and African American youth were excluded
because of small sample sizes.
• Other covariates: age, gender, educational attainment of the main care
giver (less than high school, completed high school, some college, college
degree, some graduate school or higher), and poverty level, defined as
0-99% FPL, 100-199% FPL, 200-299% FPL, and 300% FPL and above.
Statistical Analysis
• The characteristics of the sample were computed for the overall sample
and compared across racial or ethnic groups, using analysis of variance for
continuous measures and chi-square statistics for categorical variables.
• Logistic regression models were constructed with self-rated health as a
dichotomous outcome, and overweight or obesity status as the main effects
plus their interaction to test whether the association between weight status
and self-rated health varied significantly by race/ethnicity. Next, we
adjusted the model for age, gender, educational attainment of the
adolescent’s main caregiver, as well as poverty level. A dummy indicator for
survey year was included as a control variable in all regression analyses.
Models were repeated using physical activity as the main predictor.
• Weight variables were created based on methodology published by the
University of California, Los Angeles, Center for Health Policy Research.
The variance of estimates were obtained through design-based jackknife
replicate weights.
• Stata version 14.0 was used for all analyses. A two-tailed p value of <
0.05 was considered statistically significant, including the test for
interaction.
1 Associate Professor, San Francisco State University, Department of Health Education; Affiliated Faculty, Center on Social Disparities in
Health, Family and Community Medicine and Center for Health and Risk in Minority Youth and Adults, University of California San
Francisco (UCSF). 2 Master of Public Health Candidates, San Francisco State University, Department of Health Education.
Obesity exerts a significant detrimental influence on self-rated health across
racially diverse youth in California. Physical activity is associated with improved
ratings of self-rated health. These results have strong implications for future
population health among adolescents as they moved into young adulthood.
Future efforts to improve population health should prioritize structural
interventions to increase physical activity, including policies for physical
education in school environments.
Sample characteristics overall and by race/ethnicity
(Adolescents, California Health Interview Survey, 2013-2014)
¥
Overall
(n = 2,011)
Whites
(n = 851)
Latinos
(n = 984)
Asians
(n =176)
Mean (SE) or
%
Mean (SE) or
%
Mean (SE) or
%
Mean (SE) or
%
Mean age
(years)
14.5 (0.04) 14.4 (0.09) 14.6 (0.06) 14.6 (0.17)
Female 49 46 50 49
Self-Rated Health
Fair/Poor/
Good
38 30 43 37
Very Good/
Excellent
62 70 57 63
Overweight/Obesea
Yes 32 25 40 18
Poverty Level
0-99% FPL 19 7 29 14
100-199%
FPL
27 15 37 21
200-299%
FPL
11 13 11 6
300% FPL
and above
42 65 22 60
Education of Main Care
Giver
Less than
High School
23 2 41 7
HS/GED 17 14 20 12
Some
college
22 27 21 10
College 23 34 10 50
Some
Graduate
school or
higher
14 24 7 21
Notes:
Estimates are weighted to account for the complex survey sampling design.
a Based on age-sex adjusted BMI at or above the 85th percentile
¥ Data source: Authors’ analysis of data from the 2013-2014 California Health Survey Adolescent Sample (publicly available on the
University of California, Los Angeles, Center for Health Policy Research, website http://healthpolicy.ucla.edu/Pages/home.aspx)
Discussion
Conclusions
Overall Whites Latinos Asians
OR (95% CI) OR (95% CI) OR (95% CI) OR (95% CI)
Overweight/Obesitya
Crude
0.23***
(0.17, 0.33)
0.19***
(0.10, 0.35)
0.27***
(0.17, 0.42)
0.21**
(0.07, 0.64)
Adjusted
0.23***
(0.16, 0.33)
0.21***
(0.11, 0.37)
0.23***
(0.16, 0.33)
0.17*
(0.04, 0.73)
Physical Activityb
Crude
1.18***
(1.10, 1.27)
1.14*
(1.00, 1.29)
1.19**
(1.08, 1.32)
1.14
(0.92, 1.40)
Adjusted
1.19***
(1.11, 1.28)
1.15*
(1.01, 1.31)
1.21***
(1.10, 1.35)
1.26*
(1.01, 1.58)
Relative likelihoods of reporting excellent/very good self-rated
health in relation to overweight/obesity and physical activity,
overall, and by race/ethnicity
(California Health Interview Survey, 2013-2014)
¥
Notes:
a Based on age-sex adjusted BMI at or above the 85th percentile.
b Physical activity was based on the question “During a typical week, on how many days are you physically active for at least 60
minutes total per day? Do not include PE.”
Estimates are weighted to account for the complex survey sampling design.
Adjusted for age, gender, race/ethnicity (overall sample only), and socioeconomic characteristics (poverty level and educational
attainment of the main caregiver).
*p<0.05
**p<0.01
***p<0.001
¥Data source: Authors’ analysis of data from the 2013-2014 California Health Survey Adolescent Sample (publicly available on the
University of California, Los Angeles, Center for Health Policy Research, website http://healthpolicy.ucla.edu/Pages/home.aspx).
Figure 1. Prevalence of excellent/very good self-rated health
according to race/ethnicity and physical activity among
adolescents in California
¥
Notes:
a Based on age-sex adjusted BMI at or above the 85th percentile.
b Physical activity was based on the question “During a typical week, on how many days are you physically active for at least 60
minutes total per day? Do not include PE.”
Estimates are weighted to account for the complex survey sampling design.
¥Data source: Authors’ analysis of data from the 2013-2014 California Health Survey Adolescent Sample (publicly available on the
University of California, Los Angeles, Center for Health Policy Research, website http://healthpolicy.ucla.edu/Pages/home.aspx).
PercentPercent
Figure 2. Prevalence of excellent/very good self-rated health
according to race/ethnicity and weight status among
adolescents in California
¥
• In this study of adolescents in California, we found that:
a) A high proportion of adolescents rated their health as poor or fair.
b) Overweight/obesity was strongly and significantly associated with self-rated
health; compared with normal weight adolescents, overweight or obese
adolescents were less likely to rate their health as excellent/very good.
c) Greater frequency of physical activity was significantly associated with higher
likelihood of reporting excellent/very good health compared to no physical
activity.
• Our findings are consistent with those of previous research conducted outside
the United States using more homogeneous adolescent samples from countries
in Asia, Europe, Australia, and Canada.
• Of particular concern is the high prevalence of poor/fair self-rated health
across all racial/ethnic groups, which ranged from 30% to 43%. These results
have significant implications for population health in California and the nation as
a whole.
• Efforts to accelerate the prevention of obesity and reduce obesity disparities
are crucial, as are interventions to increase physical activity.
• Future research should consider potential gender differences in the
associations between obesity, physical activity, and self-rated health within
racial/ethnic groups.
• Limitations: The cross-sectional data precludes our ability to make causal
inferences. Due to small sample size concerns, we were unable to further
disaggregate the analyses by gender. We used self-reported weight and height,
which are known to underestimate BMI, overweight and obesity; thus, our
results regarding overweight and obesity are likely to be conservative, although
we controlled for factors known to be associated with underestimations of
weight and height.