1. Hitachi Review Vol. 61 (2012), No. 5 200
R&D Strategy for Smart Grids and Smart Cities in China
Jing Zhang OVERVIEW: Drawing on its ability to deliver a fusion of social infrastructure
Tao Ye and IT, and its extensive technology, experience, and know-how in the fields
Nariyasu Hamada of energy efficiency and environmental protection, Hitachi is participating in
a variety of environmentally conscious city projects in China, including smart
grid and smart city projects. To ensure that its research and development
remains closely tied to the region, Hitachi is also taking an increasingly
globalized and localized approach. This involves the development in China
of technologies that are designed for use with Chinese smart grids and
in Chinese smart cities, specifically network simulator technology for the
analysis of electric power distribution networks and technology for energy
management systems.
INTRODUCTION the northwest. The bulk of demand, in contrast, is
AGAINST a background that includes increasing located in eastern cities such as Beijing and Shanghai.
energy demand driven by economic growth, and a Achieving a balance of supply and demand across the
population that is increasingly concentrated in cities entire nation requires long-distance, very-high-voltage
(urbanization), China needs to strengthen its energy transmission networks with high capacity, and this is
supply capacity while also protecting the environment. behind a proposed West-East Electricity Transmission
The realization of smart grids and smart cities are seen
as offering ways of overcoming this challenge, where
Demand for electric power
a “smart grid” is one that uses next-generation power 120,000
infrastructure supported by information technology 100,000
(×108 kWh)
(IT), while a “smart city” is a next-generation city that 80,000
uses IT to strike a balance between the environment, 60,000
comfort, and economy. 40,000
Through its Social Innovation Business in China, 20,000
0
Hitachi is seeking to contribute to regional development 2000 2005 2010 2015 2020 2025 2030 (year)
by supplying solutions that draw on its strengths in
Planned future generation mix
machinery, control systems, and information systems. 2%
100%
This article describes the current situation in China 10%
5%
22% 30%
in the fields of smart grids and smart cities, together 80%
20% Wind and
photovoltaic
with the research and development strategy that Hitachi 60%
10%
Nuclear
15%
has formulated to keep pace with the nation’s progress. Hydro
40% 76% Thermal
65%
45%
SMART GRIDS AND SMART CITIES IN 20%
CHINA, AND HOW HITACHI IS INVOLVED 0%
2008 2020 2050 (year)
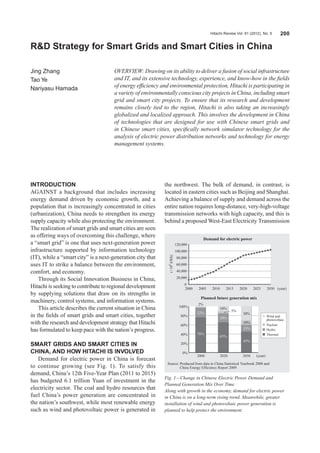
Demand for electric power in China is forecast
Source: Produced from data in China Statistical Yearbook 2008 and
to continue growing (see Fig. 1). To satisfy this China Energy Efficiency Report 2009
demand, China’s 12th Five-Year Plan (2011 to 2015)
Fig. 1—Change in Chinese Electric Power Demand and
has budgeted 6.1 trillion Yuan of investment in the
Planned Generation Mix Over Time.
electricity sector. The coal and hydro resources that Along with growth in the economy, demand for electric power
fuel China’s power generation are concentrated in in China is on a long-term rising trend. Meanwhile, greater
the nation’s southwest, while most renewable energy installation of wind and photovoltaic power generation is
such as wind and photovoltaic power is generated in planned to help protect the environment.
2. R&D Strategy for Smart Grids and Smart Cities in China 201
Urban population in information and telecommunications, digital
(×100 million) Rural population
10 equipment, and other similar fields. The following
8 sections describe the scope of this research, looking in
6 particular at its work on network simulator technology
4 for the analysis of electric power distribution networks
2 and technology for energy management systems.
0
1978
1980
1982
1984
1986
1988
1990
1992
1994
1996
1998
2000
2002
2004
2006
2008
Scope of Research
(year)
Urban and rural populations The systems covered by research at Hitachi (China)
(×100 million) Research & Development Corporation can be broadly
50
divided into distribution management systems used by
40 power suppliers and community energy management
30 systems used by consumers (see Fig. 3). In the future,
20
it is anticipated that these two classes of systems will
be coordinated using IT to optimize operation of the
10
power distribution system. Data on infrastructural and
0
consumer equipment is measured using IT, and this
1978
1980
1982
1984
1986
1988
1990
1992
1994
1996
1998
2000
2002
2004
2006
2008
(year) data is then used for analysis and control on various
Urbanization management systems. It is also anticipated that the
Source: China Statistical Yearbook 2009, 2010 future will see more widespread use of distributed
Fig. 2—Trend in China’s Urban Population.
generators such as wind or photovoltaic power, and
Each year, more than 10 million people migrate to the cities energy storage devices such as batteries or electric
from rural areas. vehicles (EVs).
Network Simulator Technology for Analysis of
Project. Based on the concept of a “strong smart grid,” Electric Power Distribution Network
China is currently strengthening its transmission (1) Challenge
and distribution network, and also expanding use of A challenge for management of the grid in China
renewable energy. today is that losses of electric power in the distribution
China’s urban population continues to grow year network make up approximately 70% of losses across
on year, with more than 10 million people annually the entire power system(3). Work is also underway on
migrating to the cities from rural areas. This represents strengthening the distribution network in response to
an annual movement of people comparable in size to issues with security of supply.
the population of metropolitan Tokyo (see Fig. 2). Meanwhile, greater use of wind, photovoltaic, and
A consequence has been a rise in concern about other forms of renewable energy is being encouraged
degradation of the natural environment caused by to reduce carbon dioxide (CO 2) emissions and
economic activity and the concentration of population. otherwise help protect the environment, and progress
Hitachi supplies electricity distribution is being made on use of distributed generators
management systems, grid stabilization systems, (including small gas turbines as well as renewables)
battery systems, community energy management to foster “local production for local consumption”
systems, and other solutions for smart grids and in the field of energy. However, greater use of
smart cities, and is currently promoting proposals and distributed generators leads to reverse power flows
participating in demonstration projects in cities around in the distribution network. If the change in the
China, including Tianjin and Dalian(1), (2). power flow is large, it can influence the generation
plans of power companies and complicate the task
RESEARCH AND DEVELOPMENT of maintaining power quality. Currently, the rules for
STRATEGY IN CHINA power transmission and distribution in China do not
Hitachi (China) Research & Development permit reverse power flow. This has created a need to
Corporation has for some time being conducting establish “local production for local consumption”
locally based research and development in the field of energy among power consumers by accurately
of power distribution and smart grids, as well as forecasting and controlling the generation output of
3. Hitachi Review Vol. 61 (2012), No. 5 202
Distributed
Power plant Transformer 110 kV 10 kV 0.4 kV EV charging generator
(centralized 10 kV station Distributed
power source) Batteries generator
10.5 kV Batteries
110 kV 0.4 kV
Home
10 kV
Office
building
500 kV Transformer
Factory
Trunk 35 kV
transmission
220 kV 110 kV
network 500 kV
HEMS BEMS FEMS
Distributed
generator 10 kV
110 kV
EV battery 10 kV
swapping station
Fig. 3—Overview of Smart City
RTU FTU TTU
Energy Infrastructure in China.
Future smart cities will make
Electric power greater use of renewable energy
distribution CEMS
Electric power grid management system and other distributed generators,
Information and
telecommunications and will coordinate the control
Electric power supplier Electric power consumer of electric power distribution
management systems and
RTU: remote terminal unit FTU: feeder terminal unit TTU: transformer terminal unit EV: electric vehicle
HEMS: home energy management system BEMS: building energy management system community energy management
FEMS: factory energy management system CEMS: community energy management system systems.
distributed generators (including renewable energy) Simulator for analyzing electric Distribution
to minimize the impact of reverse power flow on the power distribution networks management system
Minimize power losses. Distribution
distribution network. SCADA/DA Main management
server server server
Security State
(2) Research approach Reactive Network
analysis estimation
power reconfiguration
Power grid companies like State Grid Corporation optimization
of China and China Southern Power Grid Co., Ltd. Applications
…
stipulate rules for the operation and design of electric Calculation of three-phase
unbalanced power flow Server
power infrastructure on China’s power distribution Distribution network modeling
networks (4), and solutions are required for these (grid configuration)
Interface Distribution
technical issues that take account of actual conditions (compliant with IEC 61968 and IEC 61970) Geographic substation
information
in China. For example, Hitachi believes it is necessary OS and middleware system
to assess the security of supply, safety, economics, and Data Data Distribution network
Photovoltaic Energy
other aspects of the national grid stipulated by State Data link power
generation
storage
equipment
Database
Grid Corporation of China. This includes the reduction Operator Wind power Gas
in power quality that results from the connection of generation turbine
distributed generators to the distribution network, how SCADA: supervisory control and data acquisition
DA: distribution automation OS: operating system
to minimize the duration of power outages through
rapid fault detection and recovery, and the cost of Fig. 4—Overview of Simulator for Analyzing Electric Power
Distribution Networks in China.
equipment installed to strengthen the grid.
The network simulator has a data link to a distribution
Hitachi (China) Research & Development
management system and is used to recreate and analyze a
Corporation is developing a simulator for analyzing variety of phenomena that occur in distribution networks (such
electric power distribution networks that can analyze as the impact of connecting distributed generators).
a variety of phenomena associated with the connection
of distributed generators to a distribution network.
The network simulator has data links to a distribution The first step involves modeling factors such as
management system. It consists of a platform, with the configuration of China’s distribution network, the
core functions such as performing (three-phase features of its equipment, and its distributed generators
unbalanced) power flow calculations, and a set of (see Fig. 5). Modeling of distributed generators
applications for recreating a variety of distribution includes photovoltaic cells, synchronous generators,
network phenomena (see Fig. 4). asynchronous generators, and doubly-fed induction
4. R&D Strategy for Smart Grids and Smart Cities in China 203
Feeder line Feeder line Feeder line Hitachi (China) Research & Development Corporation
is developing energy management applications
Synchronous
that are built on IT platforms developed in Japan,
generator G but which also take account of the requirements
Photovoltaic
G
cells G and other circumstances specific to China. Energy
DFIG
Capacitor management is a cycle that involves measuring and
visualizing data from equipment and other sources;
conducting analysis, prediction, and evaluation of
Asynchronous
G generator
energy supply and demand; formulating plans for the
operation, equipment, and other aspects of energy
DFIG: doubly-fed induction generator
supply and demand; and performing actual control,
Fig. 5—Example Power Distribution Network in China. maintenance, and repair work (see Fig. 6). The main
The network simulator models the configuration of the power aims of control are to save energy; reduce energy
distribution network and equipment characteristics, and
costs; cut or shift peaks in energy demand; make
performs calculations such as minimization of power losses.
efficient use of photovoltaic power generation and
batteries; and reduce CO2 emissions. Specifically,
generators (DFIG). Next, the system calculates the this includes using meteorological information to
impact of connecting a distributed generator to the predict the generation output of photovoltaic and other
grid, and countermeasures for dealing with this. distributed generators, and also adjusting supply and
Examples include the voltage fluctuations in the demand in accordance with electricity tariffs that vary
distribution network and the amount of reactive power depending on the time of the day, and in accordance
that needs to be injected to minimize power losses. with other considerations such as which areas are
Other analyses include the impact of and recovery used (including homes, offices, and commercial
from grid faults, and the benefits of consumers using buildings) and how consumers behave (including
batteries for peak shifting (smoothing of power information on people’s movements, and when they
demand). In addition to existing analysis techniques arrive at, leave, or use a facility). Other considerations
developed and used in Japan, work is also in progress are the need for standardization and factors that are
on developing the simulator using actual data from difficult to measure or evaluate, such as ensuring
China. Hitachi is also working on joint research with consumer comfort (including temperature, humidity,
Tsinghua University to keep up with the technical illumination, and restrictions on when a facility can
issues, technology developments, and other trends in be used) and whether the KPIs referred to above have
China’s electric power infrastructure. been achieved.
Technology for Energy Management Systems
(1) Challenges TABLE 1. Examples of Key Indicators for Eco-cities (from Sino-
Singapore Tianjin Eco-city Key Performance Indicators)
Protection of the environment is becoming a higher
With the aim of building an environmentally conscious city, the
priority as China becomes increasingly urbanized,
development of the Sino-Singapore Tianjin Eco-city is targeting
bringing a growing need for energy management a set of key performance indicators (KPIs).
and control by consumers. One example can be
Eco-city KPI Target Target date
found at the Sino-Singapore Tianjin Eco-city, where Usage of renewable energy ≥ 20% 2020
development work is targeting 22 key performance Usage of water from non-
≥ 50% 2020
indicators (KPIs) (see Table 1). Controlling for a traditional sources*1
particular objective requires the collection of relevant ≥ 30% 2013
Proportion of green trips*2
data so that it can be used for analysis and prediction ≥ 90% 2020
*3
to elucidate the causal relationships with the control Proportion of green buildings 100% from 2011
Source: ino-Singapore Tianjin Eco-city Key Performance Indicators
S
objective. If the control objective changes, ongoing *1 on-traditional sources such as recycled water, rainwater, and seawater
N
data collection and the modification of the control desalination.
*2 se of forms of transportation that conserve energy, produce little pollution,
U
method to suit the objective are required. and are good for health, such as cycling or walking, and bus, subway, or other
modes of public transportation.
(2) Research approach *3 uildings that are environmentally conscious throughout their life cycle, from
B
Hitachi develops and supplies IT platforms (smart construction to use and demolition, including by making maximum use of
renewable energy, conserving resources, reducing pollution, and providing
city platforms) that support social infrastructure (5). comfortable spaces.
5. Hitachi Review Vol. 61 (2012), No. 5 204
Information on external environment
• Meteorological information
(weather, temperature, etc.)
• Power tariffs (time-specific tariffs)
Measurement and visualization
• Indoor and outdoor conditions
(temperature, humidity, illumination)
Analysis, prediction,
and evaluation
• Energy demand (electricity, heat)
• Output of distributed generators, • Prediction of energy demand
battery charging and discharging • Prediction of distributed
• Consumer information (information generator output
on movement of people, times when • Calculation of performance
Managed equipment facilities are used, etc.) indicators Models
Air conditioning, lighting, • Energy demand model
distributed generators Database • Energy supply model
(including photovoltaic (realtime, archive) • Equipment models
power generation), (characteristics of
batteries, heating, and Control Planning distributed generators,
other equipment or sensors batteries, and other
• Control of air conditioning and lighting • Supply and demand operation
plan for today and tomorrow equipment)
• Control of distributed generators
(distributed power generation, • Performance indicator
• Control of battery charging and models
battery charging and
discharging
discharging, supply of heating)
• Control of heating
• Medium- and long-term
• Control of other equipment equipment plan (maintenance
and repair of distributed
Maintenance and repair generators and other plant)
• Maintenance, repair, upgrading, and
removal of equipment
Fig. 6—Building Energy Management Flowchart.
Energy management involves a cycle that includes measuring and visualizing data from equipment and other sources; conducting
analysis, prediction, and evaluation of energy supply and demand; formulating plans for the operation, equipment, and other aspects
of energy supply and demand; and performing actual control, maintenance, and repair work.
Hitachi is currently involved in the international different parts of the nation (urban versus rural, costal
standardization of smart city infrastructure versus interior), customer needs in China are very
measurement indicators(6). This work aims to collate diverse. Hitachi is taking an increasingly globalized
the different requirements for urban infrastructure, and localized approach to research and development,
which include improving the quality of life for the most upstream of all corporate activities, seeking
residents, delivering sustainable growth and efficient to build a value chain that is closer to its customers and
operation for city managers, and taking account of extends from research and development through to sales
the environment to satisfy world opinion, and to and marketing and the supply of products, solutions,
standardize the evaluation and measurement methods and services. Hitachi aims to contribute to the progress
for determining the extent to which these are achieved. of social infrastructure in China by taking the system
Through its research and development in China, technologies it has built up through its experience with
Hitachi’s plan is to develop performance indicators social infrastructure in Japan and enhancing them based
and technology for energy management systems by on an understanding of Chinese culture.
using activities such as the smart city and eco-city
projects in Tianjin and Dalian to evaluate and verify
actual operational data. REFERENCES
(1) “Hitachi and SSTEC Agree to Details of Collaboration on
CONCLUSIONS Tianjin Eco-City,” Hitachi News Release, http://www.hitachi.
This article has described the current situation in co.jp/New/cnews/month/2010/09/0929b.html (Sep. 2010) in
China in the fields of smart grids and smart cities, Japanese.
(2) “Hitachi and Puwan New District in Dalian City Agree on
together with the research and development strategy
Collaborations in Energy Efficiency and Environmental
that Hitachi has formulated to keep pace with the Protection,” Hitachi News Release, http://www.hitachi.
nation’s progress. co.jp/New/cnews/month/2012/07/0711a.html (Jul. 2012) in
Being characterized by differences in the pace Japanese.
of progress and the development policies pursued in
6. RD Strategy for Smart Grids and Smart Cities in China 205
(3) Electric Power Reliability Statistics of China Electricity Platform for Public Infrastructure,” Hitachi Review 61,
Council (2009) in Chinese. pp. 167–171 (May 2012).
(4) State Grid Corporation of China, “‘12th Five-Year Plan’ (6) Y. Ichikawa et al., “Current Situation and Standardization
Power Distribution Network Plan (Technical Principles) for Overseas Deployment of Infrastructure,” 18th Railway
Direction Opinion” (Apr. 2010) in Chinese, and other sources. Technology and Policy Alliance Symposium (J-RAIL 2011)
(5) Y. Mizuno et al., “Information Control Technology (Dec. 2011) in Japanese.
ABOUT THE AUTHORS
Jing Zhang Tao Ye
Joined Hitachi (China) Research Development Joined Hitachi (China) Research Development
Corporation in 2010, and now works at the Social Corporation in 2005, and now works at the Social
Infrastructure System Laboratory. She is currently Infrastructure System Laboratory. He is currently
engaged in the research and development of engaged in the research and development of
analysis technology for power distribution networks. technology for energy management systems.
Ms. Zhang is a member of the IEEE.
Nariyasu Hamada
Joined Hitachi, Ltd. in 1989, and now works at the
Social Infrastructure System Laboratory, Hitachi
(China) Research Development Corporation. He
is currently engaged in the research and development
of Chinese social infrastructure. Mr. Hamada is a
member of The Institute of Electrical Engineers of
Japan (IEEJ).