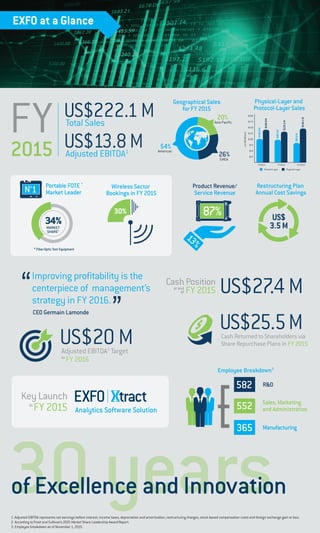
1. FY
2015 Adjusted EBITDA1
US$13.8M
Employee Breakdown3
R&D
Manufacturing
Sales, Marketing
and Administration
582
365
552
30 yearsof Excellence and Innovation
EXFO at a Glance
Adjusted EBITDA1
Target
for
FY 2016
US$20 M
Portable FOTE *
Market Leader
34%MARKET
SHARE2
No
1
Key Launch
in
FY 2015 Analytics Software Solution
Geographical Sales
for FY 2015
Asia-Pacific
Americas
54%
26%
20%
EMEA
Restructuring Plan
Annual Cost Savings
US$
3.5M
30%
Wireless Sector
Bookings in FY 2015
$132.1M
$99.6M
Physical-Layer and
Protocol-Layer Sales
(inUS$Millions)
FY2013 FY2014 FY 2015
$200
$175
$150
$125
$100
$75
$50
$25
$80.6M
$144.1M
$140.9M
$100.8M
Protocol-Layer Physical-Layer
US$222.1MTotal Sales
* Fiber-Optic Test Equipment
1. Adjusted EBITDA represents net earnings before interest, income taxes, depreciation and amortization, restructuring charges, stock-based compensation costs and foreign exchange gain or loss.
2. According to Frost and Sullivan’s 2015 Market Share Leadership Award Report.
3. Employee breakdown as of November 1, 2015.
13%
Product Revenue/
Service Revenue
87%
CEO Germain Lamonde
Improving profitability is the
centerpiece of management’s
strategy in FY 2016.
Cash Position
FY 2015 US$27.4 Mat end
of
Cash Returned to Shareholders via
Share Repurchase Plans in FY 2015
US$25.5M