Healthcare Sector Update - March 2016
•
1 like•596 views

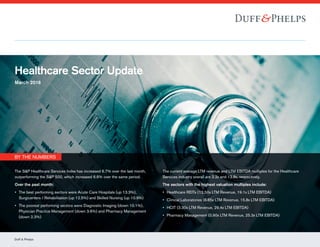
The S&P Healthcare Services Index increased 6.7% over the last month, outperforming the S&P 500, which increased 6.6% over the same period. The best performing sectors were Acute Care Hospitals (up 13.3%), Surgicenters / Rehabilitation (up 12.5%) and Skilled Nursing (up 10.9%).

Recommended
Recommended
More Related Content
What's hot
What's hot (20)
Similar to Healthcare Sector Update - March 2016
Similar to Healthcare Sector Update - March 2016 (13)
More from Duff & Phelps
More from Duff & Phelps (20)
Recently uploaded
Recently uploaded (20)
Healthcare Sector Update - March 2016
- 1. Duff & Phelps he S&P Healthcare Services Index has decreased 6.9% over the last month, performing worse than the S&P 500, which decreased 5.1% over the same period. ver the past month: The best performing sectors were Dialysis Services (up 1.4%) and Specialty Managed Care (up 0.2%) The worst performing sectors were Pharmacy Management (down 17.5%), Consumer Directed Health & Wellness (down 16.8%) and Distribution / Supply (down 12.4%) The current average LTM revenue and LTM EBITDA multiples for the Healthcare Services industry overall are 1.93x and 11.7x, respectively. The sectors with the highest valuation multiples include: Healthcare REITs (12.11x LTM Revenue, 17.1x LTM EBITDA) HCIT (3.35x LTM Revenue, 17.7x LTM EBITDA) Contract Research Orgs (2.44x LTM Revenue, 13.1x LTM EBITDA) Other Services (2.08x LTM Revenue, 16.9x LTM EBITDA) Healthcare Sector Update March 2016 BY THE NUMBERS The S&P Healthcare Services Index has increased 6.7% over the last month, outperforming the S&P 500, which increased 6.6% over the same period. Over the past month: •• The best performing sectors were Acute Care Hospitals (up 13.3%), Surgicenters / Rehabilitation (up 12.5%) and Skilled Nursing (up 10.9%) •• The poorest performing sectors were Diagnostic Imaging (down 10.1%), Physician Practice Management (down 3.6%) and Pharmacy Management (down 2.3%) The current average LTM revenue and LTM EBITDA multiples for the Healthcare Services industry overall are 2.3x and 13.8x, respectively. The sectors with the highest valuation multiples include: •• Healthcare REITs (12.50x LTM Revenue, 19.1x LTM EBITDA) •• Clinical Laboratories (6.85x LTM Revenue, 15.8x LTM EBITDA) •• HCIT (3.30x LTM Revenue, 29.4x LTM EBITDA) •• Pharmacy Management (0.90x LTM Revenue, 25.3x LTM EBITDA)
- 2. Healthcare Services Sector Update MARKET SECTOR No. of Cos. Ag. Eqty Mkt. Value Average % Change LTM Multiples Earnings Ratio PEG Ratio 2016E1 mo 12 mo Rev EBITDA LTM 2016E Acute Care Hospitals 5 $50,994 13.3% (1.6%) 1.29x 8.7x 15.7x 13.8x 1.4x Assisted / Independent Living 3 3,596 9.8% (53.2%) 1.84x 12.2x NM NM NM Care Management / TPA 7 10,340 1.1% (9.1%) 1.50x 11.9x 26.9x 28.5x 1.7x Clinical Laboratories 5 28,480 7.7% (7.5%) 6.85x 15.8x 28.0x 14.7x 1.5x Consumer Directed Health & Wellness 9 17,605 9.5% 1.0% 3.39x 17.9x 28.0x 28.5x 1.8x Contract Research Orgs 7 24,154 4.0% 5.6% 2.48x 13.4x 24.0x 16.7x 1.1x Diagnostic Imaging 3 316 (10.1%) (47.4%) 1.23x 5.5x 20.0x 14.0x 1.4x Dialysis Services 2 42,567 7.2% 0.9% 1.94x 10.9x 25.0x 20.3x 1.6x Distribution / Supply 7 104,558 1.4% (13.8%) 0.69x 11.9x 25.4x 17.0x 1.7x Emergency Services 2 2,197 (1.1%) (10.4%) 2.29x 14.5x 13.2x 16.4x 0.7x HCIT 17 39,741 5.2% (15.9%) 3.30x 29.4x 37.0x 33.0x 2.0x Healthcare REITs 18 94,640 9.7% (12.4%) 12.50x 19.1x 25.8x 30.3x 6.6x Healthcare Staffing 4 8,883 (2.2%) (21.8%) 1.15x 12.8x 28.1x 15.4x 0.9x Home Care / Hospice 7 6,530 9.5% 22.3% 0.98x 11.4x 18.9x 18.8x 1.4x Skilled Nursing 6 3,574 10.9% (23.5%) 2.65x 8.2x 20.0x 13.1x 1.3x Managed Care – Commercial 6 261,094 5.4% 4.7% 0.71x 12.4x 18.3x 20.7x 1.3x Managed Care – Government 3 15,233 5.8% (7.0%) 0.25x 7.0x 27.0x 18.0x 0.8x Other Services 4 13,429 9.3% (5.3%) 2.27x 24.5x 44.2x 26.4x 1.6x Pharmacy Management 4 45,288 (2.3%) (20.9%) 0.90x 25.3x 24.0x 13.4x 0.9x Physician Practice Mgmt 2 5,956 (3.6%) (10.9%) 1.50x 9.7x 18.1x 15.0x 1.0x Psychiatric Hospitals 3 6,941 1.3% (19.2%) 0.39x 15.8x 37.4x 21.7x 1.0x Specialty Managed Care 2 5,517 7.0% 25.6% 0.31x 8.9x 25.0x 14.7x 2.5x Surgicenters / Rehabilitation 8 12,316 12.5% 4.2% 1.92x 11.1x 17.2x 20.9x 1.4x Total / Average ($MM) 134 $803,949 4.8% (9.4%) 2.28x 13.8x 24.9x 19.6x 1.6x Source: Capital IQ CAPITALIZATION PROFILE No. of Cos. Ag. Eqty Mkt. Value % Total No. of Cos. % Ag. Eqty Mkt. Value Average Stock Performance 1 mo YTD 12 mo 36 mo > $5 billion 28 $646,301 20.9% 80.4% 5.9% (1.8%) (6.2%) 58.5% $1 billion – $5 billion 51 135,583 38.1% 16.9% 8.1% (0.4%) (4.9%) 41.1% $250 million – $1 billion 33 20,110 24.6% 2.5% 3.0% (8.1%) (14.1%) 38.4% $100 million – $250 million 8 1,424 6.0% 0.2% 17.5% (16.9%) (44.9%) (25.1%) < $100 million 14 530 10.4% 0.1% 8.7% (4.7%) (48.3%) (15.2%) Total / Average ($MM) 134 $803,949 100.0% 100.0% 8.6% (6.4%) (23.7%) 19.6% Source: Capital IQ MARKET INDICES Value at 3/31/16 % Change 1 mo YTD 12 mo 36 mo Dow Jones Industrial Average 17,685 7.1% 1.5% (0.5%) 21.3% S&P 500 Index 2,059.7 6.6% 0.8% (0.4%) 31.3% NASDAQ Composite Index 4,869.8 6.8% (2.7%) (0.6%) 49.0% Russell 2000 Index 1,114.0 7.7% (1.9%) (11.1%) 17.1% AMEX Sector Index – Healthcare 75.7 0.0% (20.9%) (30.2%) (11.1%) S&P Healthcare Facilities (Sub Ind) Index 325.1 12.9% (6.7%) (25.0%) 20.2% S&P Healthcare Providers & Services (Industry) Index 598.1 6.8% (2.5%) (9.1%) 57.6% S&P Managed Healthcare (Sub Ind) Index 435.0 6.0% 0.7% (3.3%) 104.8% S&P Healthcare Services 469.6 6.7% (2.7%) 6.3% 43.3% Source: Capital IQ Duff & Phelps 2 INTEREST RATES Value at 3/31/16 1 mo ago 3 mo ago 12 mo ago LIBOR – USD – 6 months 0.90% 0.89% 0.85% 0.40% U.S. Treasury – 2 years 0.73% 0.78% 1.06% 0.56% U.S. Treasury – 5 years 1.23% 1.22% 1.78% 1.38% U.S. Treasury – 10 years 1.78% 1.74% 2.28% 1.93% U.S. Treasury – 30 years 2.62% 2.62% 3.02% 3.02% U.S. Prime Rate 3.50% 3.50% 3.50% 3.50% Source: Capital IQ
- 3. 3/31/13 6/30/13 9/30/13 12/31/13 3/31/14 6/30/14 9/30/14 12/31/14 3/31/15 6/30/15 9/30/15 3/31/1612/31/15 S&P 500 Index NASDAQ Composite Index Russell 2000 Index S&P Healthcare ServicesDow Jones Industrial Average 180 160 140 120 100 80 Source: Capital IQ 15%10%(15%) (10%) (5%) 0% 5% Diagnostic Imaging Physician Practice Mgmt Pharmacy Management Healthcare Staffing Emergency Services Care Management/TPA Psychiatric Hospitals Distribution/Supply Contract Research Orgs HCIT Managed Care – Commercial Managed Care – Government S&P 500 Index Specialty Managed Care Dialysis Services Clinical Laboratories Other Services Home Care/Hospice Consumer Directed Health & Wellness Healthcare REITs Assisted/Independent Living Skilled Nursing Surgicenters/Rehabilitation Acute Care Hospitals Average % Change — 1 month Duff & Phelps 3 Healthcare Services Sector Update 0.0x 5.0x 10.0x 15.0x 20.0x 25.0x 35.0x 30.0x HCIT Pharm acyM anagem entOtherServices Consum erDirected Health and W ellness Healthcare REITs PsychiatricHospitals Em ergencyServices ClinicalLaboratories ContractResearch Orgs Healthcare Staffi ng M anaged Care – Com m ercial Assisted /IndependentLiving Distribution /Supply Care M anagem ent/TPA Hom e Care /Hospice Surgicenters/RehabilitationDialysisServices Physician Practice M gm t SpecialtyM anaged Care Acute Care HospitalsSkilled Nursing M anaged Care–Governm ent DiagnosticIm aging 29.4x 25.3x 24.5x 19.1x 17.9x 15.8x 15.8x 14.5x 13.4x 12.8x 12.4x 12.2x 11.9x 11.9x 11.4x 11.1x 10.9x 9.7x 8.9x 8.7x 8.2x 7.0x 5.5x 29.4x 25.3x 24.5x 19.1x 17.9x 15.8x 15.8x 14.5x 13.4x 12.8x 12.4x 12.2x 11.9x 11.9x 11.4x 11.1x 10.9x 9.7x 8.9x 8.7x 8.2x 7.0x 5.5x Overview of Subsector EV / LTM EBITDA Performance of Market Indices for Latest 36 Months Source: Capital IQ Source: Capital IQ
- 4. Duff & Phelps Copyright © 2013 Duff & Phelps LLC. All rights reserved. DPXXXXXX For more information, visit www.duffandphelps.com About Duff & Phelps Duff & Phelps is the premier global valuation and corporate finance advisor with expertise in complex valuation, dispute and legal management consulting, M&A, restructuring, and compliance and regulatory consulting. The firm’s more than 2,000 employees serve a diverse range of clients from offices around the world. M&A advisory and capital raising services in the United States are provided by Duff & Phelps Securities, LLC. Member FINRA/SIPC. Pagemill Partners is a Division of Duff & Phelps Securities, LLC. M&A advisory and capital raising services in the United Kingdom and Germany are provided by Duff & Phelps Securities Ltd., which is authorized and regulated by the Financial Conduct Authority. Duff & Phelps Copyright © 2016 Duff & Phelps LLC. All rights reserved. Brooks Dexter Head of Healthcare M&A Los Angeles +1 424 249 1646 brooks.dexter@duffandphelps.com Jordan Lampos Director Los Angeles +1 424 249 1668 jordan.lampos@duffandphelps.com Eric Coburn Managing Director New York +1 212 450 2839 eric.coburn@duffandphelps.com West Clark Vice President New York +1 212 871 9739 west.clark@duffandphelps.com Laca Wong-Hammond Managing Director New York +1 212 871 3915 laca.wong-hammond@duffandphelps.com For the detailed March trading multiples for individual healthcare services companies, please contact one of our professionals below.