Healthcare Sector Update - February 2016
•
0 likes•497 views

The document summarizes recent performance in the healthcare services sector. It notes that the S&P Healthcare Services Index decreased 2.1% over the last month, underperforming the S&P 500. The best performing subsector was Care Management/TPA, driven by an acquisition announcement. The worst performing subsectors were Assisted/Independent Living, HCIT, and Specialty Managed Care. It provides details on valuation multiples across various healthcare services subsectors.

Recommended
Recommended
More Related Content
What's hot
What's hot (20)
Similar to Healthcare Sector Update - February 2016
Similar to Healthcare Sector Update - February 2016 (13)
More from Duff & Phelps
More from Duff & Phelps (20)
Recently uploaded
Recently uploaded (20)
Healthcare Sector Update - February 2016
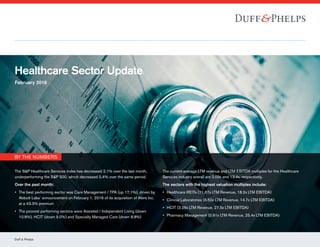
- 1. Duff & Phelps he S&P Healthcare Services Index has decreased 6.9% over the last month, performing worse than the S&P 500, which decreased 5.1% over the same period. ver the past month: The best performing sectors were Dialysis Services (up 1.4%) and Specialty Managed Care (up 0.2%) The worst performing sectors were Pharmacy Management (down 17.5%), Consumer Directed Health & Wellness (down 16.8%) and Distribution / Supply (down 12.4%) The current average LTM revenue and LTM EBITDA multiples for the Healthcare Services industry overall are 1.93x and 11.7x, respectively. The sectors with the highest valuation multiples include: Healthcare REITs (12.11x LTM Revenue, 17.1x LTM EBITDA) HCIT (3.35x LTM Revenue, 17.7x LTM EBITDA) Contract Research Orgs (2.44x LTM Revenue, 13.1x LTM EBITDA) Other Services (2.08x LTM Revenue, 16.9x LTM EBITDA) Healthcare Sector Update February 2016 BY THE NUMBERS The S&P Healthcare Services Index has decreased 2.1% over the last month, underperforming the S&P 500, which decreased 0.4% over the same period. Over the past month: •• The best performing sector was Care Management / TPA (up 17.1%), driven by Abbott Labs’ announcement on February 1, 2016 of its acquisition of Alere Inc. at a 43.3% premium •• The poorest performing sectors were Assisted / Independent Living (down 10.8%), HCIT (down 9.0%) and Specialty Managed Care (down 8.8%) The current average LTM revenue and LTM EBITDA multiples for the Healthcare Services industry overall are 2.09x and 13.4x, respectively. The sectors with the highest valuation multiples include: •• Healthcare REITs (11.87x LTM Revenue, 18.2x LTM EBITDA) •• Clinical Laboratories (5.50x LTM Revenue, 14.7x LTM EBITDA) •• HCIT (3.26x LTM Revenue, 27.5x LTM EBITDA) •• Pharmacy Management (0.91x LTM Revenue, 25.4x LTM EBITDA)
- 2. Healthcare Services Sector Update MARKET SECTOR No. of Cos. Ag. Eqty Mkt. Value Average % Change LTM Multiples Earnings Ratio PEG Ratio 2016E1 mo 12 mo Rev EBITDA LTM 2016E Acute Care Hospitals 5 $45,093 (3.0%) (8.5%) 1.22x 8.2x 13.7x 12.1x 1.3x Assisted / Independent Living 3 3,278 (10.8%) (56.1%) 1.78x 11.4x NM NM NM Care Management / TPA 7 10,288 17.1% (1.2%) 1.50x 11.8x 27.6x 27.3x 1.6x Clinical Laboratories 5 26,447 0.1% (9.8%) 5.50x 14.7x 26.2x 14.0x 1.4x Consumer Directed Health and Wellness 9 16,166 2.9% (1.1%) 3.14x 18.2x 24.9x 27.2x 1.5x Contract Research Orgs 7 23,395 0.3% 4.5% 2.39x 12.6x 23.2x 16.1x 1.0x Diagnostic Imaging 3 348 (3.9%) (42.2%) 1.61x 6.2x 16.4x 12.5x 1.3x Dialysis Services 2 39,422 (3.3%) (2.1%) 1.83x 10.3x 25.0x 18.7x 1.5x Distribution / Supply 7 101,147 (0.0%) (13.8%) 0.65x 11.4x 24.7x 16.4x 1.6x Emergency Services 2 2,221 3.3% (9.6%) 2.32x 14.8x 13.3x 16.7x 0.7x HCIT 17 37,913 (9.0%) (20.5%) 3.26x 27.5x 38.4x 31.1x 1.9x Healthcare REITs 18 86,031 (1.4%) (19.6%) 11.87x 18.2x 27.4x 27.8x 5.6x Healthcare Staffing 4 9,147 2.5% (23.1%) 1.13x 12.6x 28.6x 15.3x 0.9x Home Care / Hospice 7 6,107 (3.5%) 9.4% 0.94x 11.7x 19.7x 18.1x 1.5x Skilled Nursing 6 3,247 (0.1%) (22.8%) 0.78x 8.1x 20.5x 10.9x 0.9x Managed Care – Commercial 7 252,681 4.0% 5.1% 0.62x 11.7x 19.1x 19.5x 1.2x Managed Care – Government 3 14,381 4.2% (4.4%) 0.24x 6.6x 25.8x 17.3x 0.8x Other Services 4 12,329 (4.2%) (11.1%) 2.06x 23.4x 41.4x 25.1x 1.5x Pharmacy Management 4 48,852 (2.3%) (17.1%) 0.91x 25.4x 24.2x 13.5x 0.9x Physician Practice Mgmt 2 6,234 (3.5%) (6.3%) 1.55x 9.3x 18.7x 15.5x 1.1x Psychiatric Hospitals 3 6,847 (3.2%) (12.0%) 0.36x 15.7x 38.1x 21.9x 1.0x Specialty Managed Care 2 5,266 (8.8%) 18.9% 0.30x 8.8x 23.8x 14.6x 2.5x Surgicenters / Rehabilitation 8 11,099 (4.9%) (0.5%) 2.09x 10.8x 15.9x 16.8x 1.3x Total / Average ($MM) 135 $767,940 (1.2%) (10.6%) 2.09x 13.4x 24.4x 18.6x 1.5x Source: Capital IQ CAPITALIZATION PROFILE No. of Cos. Ag. Eqty Mkt. Value % Total No. of Cos. % Ag. Eqty Mkt. Value Average Stock Performance 1 mo YTD 12 mo 36 mo > $5 billion 28 $614,306 20.7% 80.0% (0.7%) (7.3%) (8.1%) 56.2% $1 billion – $5 billion 51 131,179 37.8% 17.1% (1.7%) (7.4%) (8.8%) 42.3% $250 million – $1 billion 34 20,615 25.2% 2.7% 0.2% (10.6%) (14.6%) 48.0% $100 million – $250 million 7 1,235 5.2% 0.2% 3.0% (8.2%) (35.7%) (20.0%) < $100 million 15 606 11.1% 0.1% (8.9%) (17.8%) (53.1%) (29.1%) Total / Average ($MM) 135 $767,940 100.0% 100.0% (1.6%) (10.2%) (24.1%) 19.5% Source: Capital IQ MARKET INDICES Value at 2/29/16 % Change 1 mo YTD 12 mo 36 mo Dow Jones Industrial Average 16,516.5 0.3% (5.2%) (8.9%) 17.5% S&P 500 Index 1,932.2 (0.4%) (5.5%) (8.2%) 27.6% NASDAQ Composite Index 4,558.0 (1.2%) (9.0%) (8.2%) 44.2% Russell 2000 Index 1,033.9 (0.1%) (9.0%) (16.2%) 13.5% AMEX Sector Index - Healthcare 75.7 (2.3%) (21.0%) (34.1%) (11.6%) S&P Healthcare Facilities (Sub Ind) Index 288.0 (10.0%) (17.3%) (30.4%) 18.8% S&P Healthcare Providers & Services (Industry) Index 560.2 (3.2%) (8.7%) (11.8%) 59.5% S&P Managed Healthcare (Sub Ind) Index 410.4 (0.1%) (5.0%) (0.8%) 104.5% S&P Healthcare Services 440.1 (2.1%) (8.8%) (1.8%) 38.9% Source: Capital IQ Duff & Phelps 2 INTEREST RATES Value at 2/29/16 1 mo ago 3 mo ago 12 mo ago LIBOR – USD – 6 months 0.89% 0.86% 0.65% 0.38% U.S. Treasury – 2 years 0.78% 0.76% 0.92% 0.66% U.S. Treasury – 5 years 1.22% 1.34% 1.66% 1.50% U.S. Treasury – 10 years 1.74% 1.93% 2.23% 2.00% U.S. Treasury – 30 years 2.62% 2.76% 3.00% 3.00% U.S. Prime Rate 3.50% 3.50% 3.25% 3.25% Source: Capital IQ
- 3. 12/31/12 3/31/13 6/30/13 9/30/13 12/31/13 3/31/14 6/30/14 9/30/14 12/31/14 3/31/15 6/30/15 9/30/15 12/31/15 S&P 500 Index NASDAQ Composite Index Russell 2000 Index S&P Healthcare ServicesDow Jones Industrial Average 180 160 140 120 100 80 Source: Capital IQ 20%(15%) (10%) (5%) 0% 5% 10% 15% Assisted/Independent Living HCIT Specialty Managed Care Surgicenters/Rehabilitation Other Services Diagnostic Imaging Physician Practice Mgmt Dialysis Services Psychiatric Hospitals Acute Care Hospitals Pharmacy Management Home Care/Hospice Healthcare REITs S&P 500 Index Skilled Nursing Distribution/Supply Clinical Laboratories Contract Research Orgs Healthcare Staffing Consumer Directed Health & Wellness Emergency Services Managed Care – Commercial Managed Care – Government Care Management/TPA Average % Change — 1 Month Duff & Phelps 3 Healthcare Services Sector Update 0.0x 5.0x 10.0x 15.0x 20.0x 25.0x 30.0x H C IT Pharm acy M anagem entO therServices C onsum erD irected H ealth and W ellness H ealthcare REITs Psychiatric H ospitals Em ergency Services C linicalLaboratories H ealthcare Staffing C ontractResearch O rgs C are M anagem ent/TPA M anaged C are – C om m ercial D istribution /Supply Assisted /IndependentLiving H om e C are /H ospice Surgicenters /RehabilitationD ialysis Services Physician Practice M gm t Specialty M anaged C are Acute C are H ospitalsSkilled N ursing M anaged C are – G overnm ent D iagnostic Im aging 27.5x 25.4x 23.4x 18.3x 18.3x 15.7x 14.8x 14.7x 13.0x 12.6x 11.9x 11.7x 11.4x 11.4x 11.3x 10.7x 10.3x 9.3x 8.8x 8.2x 8.1x 6.6x 6.2x 27.5x 25.4x 23.4x 18.3x 18.3x 15.7x 14.8x 14.7x 13.0x 12.6x 11.9x 11.7x 11.4x 11.4x 11.3x 10.7x 10.3x 9.3x 8.8x 8.2x 8.1x 6.6x 6.2x Overview of Subsector EV / LTM EBIDTA Performance of Market Indices for Latest 36 Months Source: Capital IQ Source: Capital IQ
- 4. Duff & Phelps Copyright © 2013 Duff & Phelps LLC. All rights reserved. DPXXXXXX For more information, visit www.duffandphelps.com About Duff & Phelps Duff & Phelps is the premier global valuation and corporate finance advisor with expertise in complex valuation, dispute and legal management consulting, M&A, restructuring, and compliance and regulatory consulting. The firm’s more than 2,000 employees serve a diverse range of clients from offices around the world. M&A advisory and capital raising services in the United States are provided by Duff & Phelps Securities, LLC. Member FINRA/SIPC. Pagemill Partners is a Division of Duff & Phelps Securities, LLC. M&A advisory and capital raising services in the United Kingdom and Germany are provided by Duff & Phelps Securities Ltd., which is authorized and regulated by the Financial Conduct Authority. Duff & Phelps Copyright © 2016 Duff & Phelps LLC. All rights reserved. Brooks Dexter Head of Healthcare M&A Los Angeles +1 424 249 1646 brooks.dexter@duffandphelps.com Jordan Lampos Director Los Angeles +1 424 249 1668 jordan.lampos@duffandphelps.com Laca Wong-Hammond Managing Director New York +1 212 871 3915 laca.wong-hammond@duffandphelps.com West Clark Vice President New York +1 212 871 9739 west.clark@duffandphelps.com Brad Hileman Managing Director Los Angeles +1 424 249 1664 brad.hileman@duffandphelps.com For the detailed February trading multiples for individual healthcare services companies, please contact one of our professionals below.