SlideShare a Scribd company logo
1 of 92
Download to read offline
SIMPLIFIED PROCEDURES FOR SEISMIC ANALYSIS AND 

DESIGN OF PIERS AND WHARVES IN MARINE OIL AND LNG 

TERMINALS 

by 

Rakesh K. Goel 

California Polytechnic State University, San Luis Obispo 

Research Conducted for the 

California State Lands Commission 

Contract No. C2005-051 

and 

Department of the Navy, Office of Naval Research 

Award No. N00014-08-1-1209 

Department of Civil and Environmental Engineering 

California Polytechnic State University, San Luis Obispo, CA 93407 

June 2010 

Report No. CP/SEAM-08/01
EXECUTIVE SUMMARY 

This investigation developed simplified procedures for the seismic analysis and design of pile
supported wharves and piers in Marine Oil and LNG Terminals. A simplified coefficient-based
approach is proposed for estimating seismic displacement demand for regular structures. This
approach is adopted from the performance-based analysis procedure recently approved for
buildings in the ASCE/SEI 41-06 standard (ASCE, 2007). A modal pushover analysis (MPA)
approach is proposed for irregular structures. The MPA procedure accounts for the higher-mode
effects that are important in irregular structures (Chopra and Goel, 2004). The acceptability of
piles in terms of displacement ductility limitation, instead of the material strain limitation, is
proposed. For this purpose, simplified expressions for estimating displacement ductility capacity
of piles are recommended. These expressions are calibrated such that the material strain limits in
Title 24, California Code of Regulations, Chapter 31F, informally known as the Marine Oil
Terminal Engineering and Maintenance Standards (MOTEMS), would not be exceeded if the
displacement ductility demand is kept below the proposed displacement ductility capacity. These
simplified procedures can be used as an alternative to the procedures currently specified in the
MOTEMS. The simplified procedures can be used for preliminary design or as a quick check on
the results from detailed nonlinear analyses. The more sophisticated analysis methodology can
still be used for final design.
The following is a summary of the procedures to estimate displacement demands and
capacities for pile-supported wharves and piers.
DISPLACEMENT DEMAND
Regular Structures
It is proposed that the seismic displacement demand in a regular structure (MOTEMS 2007) be
estimated from
T 2
Δ =d C C S1 2 A 2
(1)
4π
in which SA is the spectral acceleration of the linear-elastic system at vibration period, T . The
coefficient C1 is given by
i
⎧
⎪1.0; T >1.0s
⎪
⎪ R −1
C1 = ⎨1.0 + 2
; 0.2s<T ≤1.0s (2)
aT⎪
⎪ R −1
1.0 + ; T ≤ 0.2s⎪⎩ 0.04a
in which a is a site dependent constant equal to 130 for Site Class A and B, 90 for Site Class C,
and 60 for Site Class D, E, and F (definition of Site Class is available in ASCE/SEI 41-06
standard), and R is the ratio of the elastic and yield strength of the system and is defined as
S W
R = A
(3)
g Vy
where W is the seismic weight of the system, Vy is the yield force (or base shear) of the system,
and g is the acceleration due to gravity. The coefficient C2 is given by
⎧1.0; T > 0.7s
C2 =
⎪
⎨ 1 ⎛ R −1⎞
2 (4)
1+ ; T ≤ 0.7s⎪ ⎜ ⎟
⎩ 800 ⎝ T ⎠
Use of Equation (1) to compute the displacement demand should be restricted to systems
with R ≤ R where R is given bymax max
−t
Δd
αe
(5)
Δy 4
Rmax = +
in which Δd is the smaller of the computed displacement demand, Δd , from Equation (1) or the
displacement corresponding to the maximum strength in the pushover curve, Δy is the yield
displacement of the idealized bilinear force-deformation curve, t is a constant computed from
t 1 0.15ln(T )= + (6)
and αe is the effective post-elastic stiffness ratio computed from
α α + (7)e = P−Δ λ α α( 2 − P−Δ )
where λ is a near-field effect factor equal to 0.8 for sites that are subjected to near-field effects
ii
and 0.2 for sites that are not subjected to near field effects. The near field effects may be
considered to exist if the 1 second spectral value, S1 , at the site for the maximum considered
earthquake is equal to or exceeds 0.6g. The P-Delta stiffness ratio,αP−Δ , and the maximum
negative post-elastic stiffness ratio, α2 , in Equation (7) are estimated from the idealized force-
deformation curve.
Irregular Structures
A modal pushover analysis (MPA) procedure is proposed to estimate displacement demands in
irregular Marine Oil and LNG Terminal structures (MOTEMS 2007). The following is a step-by-
step summary of the MPA procedure:
1.	 Compute the natural frequencies, ωn and modes, φn , for linearly elastic vibration of the
irregular Marine Oil and LNG Terminal structure.
2. Select a reference point where the displacement, urn , is to be monitored in the selected
direction of analysis during the pushover analysis. Ideally, this reference point should be the
location on the structure with largest value of φrn in the selected direction of analysis.
3. For the nth-mode, develop the pushover curve, V −u , for the nth modal force distribution,bn rn
s*
= Mφ , where M is the mass matrix of the structure, and φ is the nth mode shape. Then n	 n
base shear Vbn should be monitored in the same direction as the direction of the selected
reference point displacement urn .
4. Convert the V −u pushover curve to the force-displacement, F Ln − Dn , relation for thebn rn	 sn
nth -“mode” inelastic SDF system by utilizing F Ln =Vbn M*
and D = u Γnφrn in whichsn n n rn
φrn is the value of φn at the reference point in the direction under consideration,
* T T	 T T
Mn = (φn Mι)
2
φn Mφn is the effective modal mass, and Γ =n φn Mι φn Mφn with ι equal to
the influence vector. The influence vector ι is a vector of size equal to the total number of
degrees of freedom. For analysis in the x-direction, the components of ι corresponding to x-
degree-of-freedom are equal to one and remaining components equal to zero. Similarly the
iii
components of ι corresponding to y-degree-of-freedom are equal to one and remaining
components equal to zero for analysis in the y-direction.
5. Idealize the force-displacement, F Ln − Dn , curve as a bilinear curve and compute the yieldsn
value Fsny Ln .
6. Compute the yield strength reduction factor, R = SA (F Ln ).sny
7.	 Compute the peak deformation Dn = Δd of the nth-“mode” inelastic SDF system defined by
the force-deformation relation developed in Step 4 and damping ratio ζn , from Equation (1).
The elastic vibration period of the system is based on the effective slope of the snF Ln − Dn
1/2
curve, which for a bilinear curve is given by T = 2π L Dn ( n ny Fsny ) .
8.	 Calculate peak reference point displacement urn associated with the nth-“mode” inelastic
SDF system from u = Γ φ D .rn n rn n
9.	 Push the structure to the reference point displacement equal to urn and note the values of
desired displacement δno .
10. Repeat Steps 3 to 9 for all significant modes identified.
11. Combine the peak modal displacement, δno , by an appropriate modal combination rule, e.g.,
CQC, to obtain the peak dynamic response, Δo .
DISPLACEMENT CAPACITY
It is proposed that the displacement capacity of piles in Marine Oil and LNG Terminals be
estimated from
Δc = μΔΔy	 (8)
where Δy is the yield displacement of the pile and μΔ is the displacement ductility capacity of
the pile. Following are the recommendations that have been developed for the yield displacement
and displacement ductility of piles commonly used in Marine Oil and LNG Terminals. These
recommendations have been developed to ensure that the material strains in the pile at its
iv
displacement capacity remain within the limits specified in the MOTEMS (2007).
The procedure to estimate the displacement capacity is intended to be a simplified procedure
for either initial design of piles or for checking results from more complex nonlinear finite
element analysis. The recommendations presented in this report are limited to: (1) piles with long
freestanding heights (length/diameter > 20) above the mud line; (2) piles with transverse
volumetric ratio greater than 0.5%; and (3) piles in which the displacement demand has been
estimated utilizing equivalent-fixity approximation. Results from this investigation should be
used with caution for parameters or cases outside of those described above.
Piles with Full-Moment- or Pin-Connection to the Deck Slab
The recommended values of displacement ductility capacity of piles with full-moment-
connection or pin-connection to the deck slab are
Design Earthquake
Level
Hinge Location Reinforced-
Concrete Piles
Hollow-Steel
Piles
Level 1
In-Ground 1.75 1.2
Pile-Deck 1.75 1.2
Level 2
In-Ground 2.5 2.75
Pile-Deck 5.0 2.75
The yield displacement of the pile may be estimated either from idealized pushover curve
developed from the nonlinear static pushover analysis or may be estimated from
⎧M L2
y
⎪ for full-moment-connection
6EI⎪ e
Δ = ⎨ (9)y
⎪ y
2
M L
for pin-connection⎪
3EI⎩ e
in which M y is the section yield moment and EIe is the effective value of EI that can be
estimated from the section moment-curvature analysis. Note that M y is not the section moment
at first-yield but the effective yield moment estimated from bilinear idealization of the moment-
curvature relationship.
v
Piles with Dowel-Connection to the Deck Slab
Simplified formulas are proposed for estimating displacement ductility capacity of piles with
dowel-connection, such as hollow-steel piles or prestressed concrete piles connected to the deck
slab with dowels. The following is a step-by-step summary of the procedure to implement these
formulas to estimate displacement capacity of such piles:
1. Establish the axial load, P , on the pile.
2. Estimate the pile length based on equivalent-fixity assumption.
3.	 Select an appropriate design level – Level 1 or Level 2 – and establish various strain limits
for the selected design level.
4.	 Develop the moment-rotation relationship of the dowel-connection using the procedure
described in Chapter 8 of this report.
5.	 Determine rotational stiffness, kθ , yield moment, M y,C , and yield rotation, θy,C of the
dowel-connection from the moment-rotation relationship developed in Step 4.
6.	 Establish the rotation of the dowel-connection, θL , and corresponding ductility,
μ =θ θy,C , when strain in the outer-most dowel of the connection reaches the strain limitθ	 L
established in Step 3 for the selected design level.
7.	 Conduct the moment-curvature analysis of the pile section with appropriate axial load and
idealize the moment-curvature relationship by a bi-linear curve.
8.	 Compute the effective, EIe , and effective yield moment, My,P , from the pile moment-
curvature relationship. Note that EIe is equal to initial elastic slope and My,P is the yield
value of the moment of the idealized bi-linear moment-curvature relationship. For steel piles,
EIe may be computed from section properties and material modulus, and My,P may be
approximated as M  fy (d3
− di
3
) 6 .y,P o
9. Estimate the yield curvature, φy,P = M y,P EIe .
vi
10. Establish the curvature of the steel pile, 	φL , and corresponding curvature ductility,
μ = φ φy,P , when material strain in the pile section reaches the strain limit established inφ	 L
Step 3 for the selected design level.
11. Select the value of ρ which defines the length of the plastic hinge as a fraction of the
“effective” length of the pile. The recommended value for hollow-steel piles with dowel-
connection is ρ = 0.03 for Level 1 design and ρ = 0.075 for Level 2; and for prestressed
concrete pile with dowel-connection for both design levels is ρ = 0.05.
12. Compute the dimensionless parameters: η = M y,P M y,C , and β = EIe k L .θ
13. Compute the normalized value of the plastic hinge length: L*
P = (ρη) (1+η).
14. Compute the yield displacement which corresponds to first effective yielding in the
connection as: Δ =θ L(1 4β ) 6β+y,C	 y,C
15. Compute 	the displacement ductility for yielding in the connection as
Δ = +( βμθ ) (1 4β ) if μθ computed in Step 6 is less than or equal to ( )−μ	 1 4 +	 η 1 2β
otherwise μ = (2 η β θΔ	 − + 6 μ ) (1+ 4β ).
16. Compute displacement ductility for yielding in the pile as
1 4 ) ( )η *
p ( *
pμΔ = (2η −1) ( + β + 6 L 1− L 2)(μφ −1) ( + β )1 4
17. Establish the displacement ductility capacity as lower of the values computed in Steps 15 and
16.
18. Compute the displacement capacity of the pile as product of the yield displacement computed
in Step14 and the displacement ductility capacity computed in Step 17.
The recommended value of displacement ductility for piles with full-moment-connection or
the simplified formulas for piles with dowel-connection have been shown to provide results that
are “accurate” enough for most practical applications. However, it may be useful to verify these
recommendations from experimental studies.
vii
ACKNOWLEDGMENTS 

This research investigation is supported by the California State Lands Commission (CSLC)
under Contract No. C2005-051 for Development of LNGTEMS/MOTEMS Performance-Based
Seismic Criteria. This support is gratefully acknowledged. The author would especially like to
thank Martin Eskijian, CSLC Project Manager and Hosny Hakim of the CSLC for their
continuing support. The author would also like to acknowledge advice from following
individuals: Gayle Johnson and Bill Bruin of Halcrow; Bob Harn of Berger/ABAM Engineers
Inc.; Dr. Omar Jeradat of Moffatt  Nichol; Peter Yin of Port of Los Angeles; Eduardo Miranda
of Stanford University; and Dr. Hassan Sedarat and Tom Ballard of SC Solutions Inc. Finally,
the author would like to acknowledge the editorial support provided by John Freckman of the
CSLC. Additional support for this research is provided by a grant entitled C3RP Building
Relationships 2008/2010” from the Department of the Navy, Office of Naval Research under
award No. N00014-08-1-1209. This support is also acknowledged.
viii
CONTENTS

EXECUTIVE SUMMARY ............................................................................................................. i

DISPLACEMENT DEMAND..................................................................................................... i 

Regular Structures.................................................................................................................... i 

Irregular Structures ................................................................................................................iii 

DISPLACEMENT CAPACITY................................................................................................ iv 

Piles with Full-Moment- or Pin-Connection to the Deck Slab............................................... v 

Piles with Dowel-Connection to the Deck Slab..................................................................... vi 

ACKNOWLEDGMENTS ...........................................................................................................viii 

CONTENTS................................................................................................................................... ix 

1. INTRODUCTION ...................................................................................................................... 1 

2. ESTIMATION OF DISPLACEMENT DEMANDS.................................................................. 4 

2.1 REGULAR STRUCTURES................................................................................................. 4 

2.1.1 Current MOTEMS Procedure................................................................................. 4 

2.1.2 Procedures to Compute Response of Single-Degree-of-Freedom (SDF) Systems ........ 5 

2.1.3 Proposed Alternate Displacement Demand Procedure for Regular Structures ............. 9 

2.2 IRREGULAR STRUCTURES........................................................................................... 11 

2.2.1 Current MOTEMS Procedure...................................................................................... 11 

2.2.2 Proposed Nonlinear Static Procedure for Irregular Structures .................................... 12 

3. simplifying assumption............................................................................................................. 14 

4. MOTEMS PROCEDURE FOR CAPACITY EVALUATION OF PILES.............................. 17 

5. SIMPLIFIED PROCEDURE TO COMPUTE PILE DISPLACEMENT CAPACITY ........... 21 

6. DISPLACEMENT CAPACITY OF REINFORCED CONCRETE PILES............................. 23 

6.1 THEORETICAL BACKGROUND.................................................................................... 23 

6.2 EVALUATION OF SIMPLIFIED EQUATIONS FOR DUCTILITY CAPACITY ......... 24 

6.3 SENSITIVITY OF DISPLACEMENT DUCTILITY TO PILE PARAMETERS............. 26 

6.3.1 Pile Length and Pile Diameter..................................................................................... 26 

6.3.2 Longitudinal and Transverse Reinforcement Ratio..................................................... 28 

6.3.3 Axial Force................................................................................................................... 29 

6.4 LOWER BOUND OF DISPLACEMENT DUCTILITY CAPACITY .............................. 29 

6.5 SIMPLIFIED PROCEDURE TO COMPUTE DISPLACEMENT CAPACITY............... 31 

7. DISPLACEMENT CAPACITY OF HOLLOW STEEL PILES.............................................. 33 

7.1 THEORETICAL BACKGROUND.................................................................................... 33 

7.2 EVALUATION OF SIMPLIFIED EQUATIONS FOR DUCTILITY CAPACITY ......... 34 

7.3 SENSITIVITY OF DISPLACEMENT DUCTILITY TO PILE PARAMETERS............. 36 

7.3.1 Pile Length and Pile Diameter..................................................................................... 36 

7.3.2 Pile Wall Thickness ..................................................................................................... 37 

7.3.3 Axial Force................................................................................................................... 38 

7.4 LOWER BOUND OF DISPLACEMENT DUCTILITY CAPACITY .............................. 39 

7.5 SIMPLIFIED PROCEDURE TO COMPUTE DISPLACEMENT CAPACITY............... 39 

8. DISPLACEMENT CAPACITY OF PILES WITH DOWEL-CONNECTION....................... 42 

ix
8.1 DOWEL-CONNECTIONS................................................................................................. 42 

8.1.1 Hollow Steel Piles........................................................................................................ 42 

8.1.2 Prestressed Concrete Piles ........................................................................................... 43 

8.1.3 Behavior of Dowel-Connection................................................................................... 44 

8.2 MOMENT-ROTATION RELATIONSHIP OF DOWEL-CONNECTION ...................... 44 

9. SIMPLIFIED MODEL OF PILE WITH DOWEL-CONNECTION........................................ 49 

9.1 IDEALIZED CONNECTION AND PILE BEHAVIOR.................................................... 49 

9.1.1 Moment-Rotation Behavior of Connection ................................................................. 49 

9.1.2 Moment-Curvature Behavior of Pile Section .............................................................. 50 

9.1.3 Force-Deformation Relationship of Pile with Dowel-Connection .............................. 51 

9.2 FORCE-DEFORMATION RESPONSE OF PILE WITH DOWEL-CONNECTION ...... 52 

9.2.1 Response at First Yielding in Connection ................................................................... 52 

9.2.2 Response at First Yielding in Pile................................................................................ 54 

9.3 DISPLACEMENT DUCTILITY CAPACITY OF PILE ................................................... 55 

9.3.1 Strain Limits in the Connection................................................................................... 56 

9.3.2 Strain Limits in the Pile ............................................................................................... 58 

9.4 STEP-BY-STEP SUMMARY............................................................................................ 59 

10. DUCTILITY CAPACITY OF HOLLOW STEEL PILES WITH DOWEL-CONNECTION62
11. DUCTILITY CAPACITY OF PRESTRESSED CONCRETE PILES WITH DOWEL-
CONNECTION............................................................................................................................. 67 

12. RECOMMENDATIONS........................................................................................................ 72 

12.1 DISPLACEMENT DEMAND ......................................................................................... 72 

12.1.1 Regular Structures...................................................................................................... 72 

12.1.2 Irregular Structures .................................................................................................... 73 

12.2 DISPLACEMENT CAPACITY....................................................................................... 75 

12.2.1 Piles with Full-Moment- or Pin-Connection to the Deck Slab.................................. 75 

12.2.2 Piles with Dowel-Connection to the Deck Slab......................................................... 76 

12.3 RECOMMENDATIONS FOR FUTURE WORK ........................................................... 78 

REFERENCES ............................................................................................................................. 79 

x
1. INTRODUCTION 

Seismic design of marine oil terminals in California is governed by 2007 Title 24 California
Code of Regulations (CCR), Part 2, California Building Code, Chapter 31F (Marine Oil
Terminals). These regulations are commonly known as the “Marine Oil Terminal Engineering
and Maintenance Standard” (MOTEMS). The MOTEMS describe the acceptable methods of
seismic analysis and provide the specific performance criteria for two levels of earthquake
motions to be used in the seismic assessment. The return period of the design earthquake for
each level depends on the risk level, which is a function of the oil susceptible to spillage at any
given time. For example, Level 1 and Level 2 design earthquakes for high risk terminals
correspond to return periods of 72 and 475 years, respectively. The performance goal for Level 1
earthquake is no or minor damage without interruption in service or with minor temporary
interruption in service. The performance goal for Level 2 earthquake is controlled inelastic
behavior with repairable damage resulting in temporary closure of service, restorable within
months and the prevention of a major oil spill (24 CCR 3104F.2.1). This is the formal short form
of the above cited regulation and specifies a particular section (24 CCR 3104F.2.1) of the
California Code of Regulations. It will be used throughout this document along with the informal
“MOTEMS” abbreviation.
The MOTEMS is currently being used for new construction in the Ports of Los Angeles and
Long Beach. In addition, the MOTEMS has been referenced in the FEMA 450 document (BSSC,
2003). The MOTEMS has also become the approved methodology for the seismic assessment of
US military wharf/pier facilities in high seismic areas (Department of Defense, 2005).
As with marine oil terminals, LNG receiving terminals are considered liquid hydrocarbons
reception terminals by the California State Lands Commission (CSLC), and as such fall under
the Lempert-Keen-Seastrand Oil Spill and Response Act of 1990. The “Act” states that the
“commission (CSLC) shall adopt rules, regulations, guidelines…, performance standards… for
all existing and proposed marine terminals within the state…”. It is through this “Act” that the
CSLC is developing standards for LNG terminals, and in this case mutually applicable to oil
terminals. The effort described in this report is through funding obtained by the CSLC for
development of standards for LNG terminals.
1
The MOTEMS seismic analysis requires that the seismic displacement demand in marine oil
terminal structures be determined using nonlinear static procedures except for irregular structures
(24 CCR 3104F.1.4) with high or moderate seismic risk classification (see 24 CCR 3104F2.3.2 ).
A linear modal procedure is required for irregular structures with high or moderate seismic risk
classification. The analysis method specified in the MOTEMS is based on the concept of
equivalent linearization presented by Priestley et al. (1996). The seismic design (or acceptability
criteria) involves making sure that the material strains at the seismic displacement demand not
exceed certain prescribed values.
The primary objective of this investigation is to develop simplified analysis and design
procedures for pile supported wharves and piers for Marine Oil and LNG Terminals. For this
purpose, a simplified coefficient-based approach is proposed for estimating seismic displacement
demand for regular structures. This approach is adopted from the performance-based analysis
procedure recently approved for buildings in the ASCE/SEI 41-06 standard (ASCE, 2007). A
modal pushover analysis (MPA) approach is proposed for irregular structures. The MPA
procedure accounts for the higher-mode effects that are important in irregular structures (Chopra
and Goel, 2004). The acceptability of piles in terms of displacement ductility limitation, instead
of the material strain limitations, is proposed. For this purpose, simplified expressions for
estimating displacement ductility capacity of piles are recommended. These expressions are
calibrated such that the material strain limits in the MOTEMS would not be exceeded if the
displacement ductility demand is kept below the proposed displacement ductility capacity. These
simplified procedures can be used as an alternative to the procedures currently specified in the
MOTEMS.
This report is organized as follows:
Chapter 2 presents the development of a simplified procedure for estimating seismic
displacement demand in regular and irregular structures.
Chapter 3 describes the equivalent fixity model utilized in developing the simplified seismic
acceptability criteria.
Chapter 4 summarizes the approach in the current MOTEMS for seismic evaluation of piles.
2
Chapter 5 presents the proposed approach to estimate the displacement ductility capacity of
piles.
Chapters 6 and 7 present development and evaluation of simplified expressions for the
displacement ductility capacity of reinforced concrete and hollow steel piles, respectively, with
full-moment connection to the concrete deck.
Chapter 8 discusses the behavior of partial-moment connections of hollow steel and
prestressed concrete piles to the concrete deck.
Chapter 9 presents the theoretical development of simplified expressions for estimating
displacement ductility demands in piles with partial-moment connections.
Chapters 10 and 11 evaluate these simplified expressions for hollow steel and prestressed
concrete piles, respectively.
3
2. ESTIMATION OF DISPLACEMENT DEMANDS 

The MOTEMS requires that the seismic displacement demand in marine oil terminal structures
be determined using nonlinear static procedures except for irregular structures with high or
moderate seismic risk classification (MOTEMS, 2007: Section 3104F2.3.2). A linear modal
procedure is required for irregular structures with high or moderate seismic risk classification.
2.1 REGULAR STRUCTURES
2.1.1 Current MOTEMS Procedure
The MOTEMS (2007) specifies that the displacement demand, Δd , be computed from
T 2
Δ = S (2.1)d A 2
4π
in which SA is the spectral response acceleration corresponding to the vibration period T of the
structure, with a 5% damping ratio. The spectral acceleration, SA , is computed from United
States Geological Survey (USGS) maps, or from site-specific probabilistic seismic hazard
analysis (PSHA).
Equation (2.1) assumes that the deformation demand in a system that is deformed beyond
the linear elastic limit is equal to that in a linear-elastic system. It is well known that for short
period systems, this equal displacement rule may not apply; deformation of a nonlinear system
may be larger than that of a linear system. For such systems, nonlinearity in the force-
deformation relationship must be considered to compute the displacement demand.
Therefore, the MOTEMS requires that a refined analysis be used to calculate the
displacement demand if the vibration period of the structure T is less than period To which
corresponds to the period at which constant acceleration and constant velocity regions of the
design spectrum intersect. The refined analysis (MOTEMS, 2007: Section 3104F.2.3.2.5)
utilizes the nonlinear force-deformation behavior of the structure developed from nonlinear static
pushover analysis and is based on the concept of equivalent linearization presented by Priestley
et al. (1996).
4
2.1.2 Procedures to Compute Response of Single-Degree-of-Freedom (SDF) Systems
An alternative approach to the equivalent linearization method is the coefficient method in which
the deformation of the inelastic SDF system is computed by multiplying the displacement of the
elastic SDF system by a coefficient as follows:
Δ = C Δ (2.2)i R e
where Δe is the deformation of the elastic SDF system, Δi is the deformation of the inelastic
SDF system, and CR is the coefficient that converts displacement of the elastic SDF system to
displacement of the inelastic SDF system. Several alternative definitions of the coefficient CR
are available. The following is a brief review of the ones which are commonly used.
Δ
A
Δ
e
Ae
Δ
y
Ay
Δ
i
R
Figure 2.1. Force-deformation properties of an inelastic and elastic SDF system.
Figure 2.1 shows a nonlinear inelastic SDF system with a bilinear force-deformation
relationship. The yield strength (or capacity) of the system is Vy and its yield displacement is
Δy . The yield strength Vy is related to the pseudo-acceleration (or spectral acceleration) at yield
level, A , and the seismic weight, W , as V = A W . If the system were to remain elastic, they y y
design force would be V = AW with A being the spectral acceleration of the elastic SDFe e e
system. The yield strength reduction factor, R , is defined as the ratio of the elastic level force
and the yield strength of the inelastic SDF system. Thus R is given as
Ve Ae
R = = (2.3)
Vy Ay
5
Note that the yield strength reduction factor, R , differs from the response modification
coefficient, R , generally used in the force-based design procedures of building [for example see
ASCE/SEI 7-05 (ASCE, 2005)]: the yield strength reduction factor in Equation (2.3) considers
the effects of system ductility alone whereas the response modification factor in force-based
design accounts for other factors, such as type and past performance of lateral load resisting
systems, over strength, etc., in addition to the system ductility.
The coefficient CR is generally defined as a function of vibration period, T , yield reduction
factor, R , and a few other factors. Nassar and Krawinkler (1991) defined CR as
1 ⎡ 1 c ⎤
C = 1+ ( )R −1 (2.4)R ⎢ ⎥R ⎣ c ⎦
where the constant c is defined by
T a
b
c = + (2.5)
1+T a
T
with constants a =1 and b = 0.42 for α = 0% , a =1 and b = 0.37 for α = 2% , and a = 0.8 and
b = 0.29 for α =10% . The parameter α is defined as the ratio of the post-yield stiffness and
initial elastic stiffness expressed as a percentage value. Ruiz-Garcia and Miranda (2003) defined
the CR as
⎡ ⎤
=1+
1
+
1
⎥( )−1C ⎢ R (2.6)R
⎣ ( ) c⎥⎢a T Ts
b
⎦
with Ts being the site characteristic period selected as 0.75 for site B, 0.85 for site C, and 1.05
for site D; and constants a = 50 , b =1.8, and c = 55 . Chopra and Chintanapakdee (2004)
defined CR as
⎡ d −1
⎤−1 ⎛ a ⎛ ⎞
C = +1 ⎢( )R − + ⎜ b
c
⎞
⎠ T
T
⎥ (2.8)R L 1 + ⎟⎜ ⎟
⎢ ⎝ R ⎝ ⎠s ⎥⎣ ⎦
in which
1 ⎛ R −1⎞
LR = ⎜1+ ⎟ (2.9)
R ⎝ α ⎠
6
Ts is the period corresponding to the transition between constant pseudo-acceleration and
constant pseudo-velocity regions of the design spectrum, a = 61, b = 2.4 , c =1.5 , and d = 2.4 .
The CR is also defined in several building design guidelines. For example, FEMA-356
(ASCE, 2000), defines CR as
C C C (2.10)= CR 1 2 3
where C1 is the modification factor to relate a maximum displacement of nonlinear elastic-
perfectly-plastic SDF system to displacement of elastic SDF system given by
1.0; for ≥ s⎧ T T
⎪
C1 = ⎨ 1 ⎛ 1 Ts
(2.11)⎞⎛ ⎞
+ 1− ≤1.5; for T T⎜ ⎟⎜ ⎟ s
⎩R R T⎝ ⎠
⎪
⎝ ⎠
C2 is the modification factor to represent effects of pinched hysteretic shape, stiffness
degradation, and strength deterioration (Table 2.1), and C3 is the modification factor to represent
P-Delta effects given by
( )
3/2
α R −1
3 1 (2.12)C = +
T
Table 2.1. Values of modification factor C2 in FEMA-356 (ASCE 2000).
Structural
Performance Level
T 0.1 s≤ sT T≥
Framing
Type 1
Framing
Type 2
Framing
Type 1
Framing
Type 2
Immediate Occupancy 1.0 1.0 1.0 1.0
Life safety 1.3 1.0 1.1 1.0
Collapse Prevention 1.5 1.0 1.2 1.0
The coefficients in FEMA-356 were re-examined and an improved version was proposed in
FEMA-440 (ATC, 2005). This proposal has also been adopted in ASCE/SEI 41-06 standard
(ASCE, 2007). The CR in FEMA-440 and ASCE/SEI 41-06 is defined as
C C= C (2.13)R 1 2
where C1 is the modification factor to relate maximum displacement of a nonlinear elastic-
perfectly-plastic SDF system to displacement of an elastic SDF system defined by
7
⎧
⎪1.0; T 1.0s
⎪
⎪ R −1
C1 = ⎨1.0 + 2
; 0.2sT ≤1.0s (2.14)
aT⎪
⎪ R −1
1.0 + ; T ≤ 0.2s⎪⎩ 0.04a
with a = 130 for Site Class B, 90 for Site Class C, and 60 for Site Class D. and C2 is the
modification factor to represent effects of cyclic degradation in stiffness and strength given by
⎧1.0; T  0.7s
⎪
C2 = ⎨ 1 ⎛ R −1⎞
2 (2.15)
⎪1+ ; T ≤ 0.7s⎜ ⎟
⎩ 800 ⎝ T ⎠
Base Shear
Displacement, ΔΔ
d
Vd
Δ
y
Vy
0.6V
y
Ke
α1
Ke
α2
Ke
αP−Δ
Ke
α
e
K
e
Figure 2.2. Idealized force-deformation curve for nonlinear static analysis.
The provisions of FEMA-440 and ASCE/SEI 41-06 can be used provided that R does not
exceed the limiting value given by
−h
Δd
αe
Rmax = + ( ); h =1.0 + 0.15ln T (2.16)
Δy 4
in which Δd is the deformation corresponding to peak strength, Δy is the yield deformation, and
α is the effective negative post-yield slope given bye
α = α + λ α α− (2.17)e P−Δ ( 2 P−Δ )
where α2 is the negative post-yield slope ratio defined in Figure 2.2, αP−Δ is the negative slope
8
0 0.5 1 1.5 2 2.5 3
0
1
2
3
4
5
C
R
Ruiz−Garcia−Miranda
Krawinkler−Nassar
Chopra−Chintanapakdee
FEMA−356
FEMA−440,ASCE/SEI41−06
FEMA−450
ratio caused by P − Δ effects, and λ is the near-field effect factor given as 0.8 for S ≥ 0.6 and1
0.2 for S1  0.6 ( S1 is defined as the 1-second spectral acceleration for the Maximum
Considered Earthquake). The α2 slope includes P − Δ effects, in-cycle degradation, and cyclic
degradation.
Finally, FEMA-450 (BSSC, 2003) defines CR as
⎧ 1.0; for T Ts
R
⎪
1 ⎡ (R T− ) s ⎤ (2.18)C = ⎨ 1
1+ ; for T T⎪ ⎢ ⎥ ≤ s
R T⎩ ⎣ ⎦
Period, T (s)
Figure 2.3. Comparison of CR from various recommendations. Results are for R = 3 and site
class B.
Figure 2.3 compares the CR values from the aforementioned recommendations. This
comparison indicates that all recommendations lead to essentially identical values of CR for
periods longer than 1 sec. The values due to FEMA-356 and FEMA-450 differ significantly from
those due to the remaining recommendations primarily for periods shorter than 0.5 sec.
2.1.3 Proposed Alternate Displacement Demand Procedure for Regular Structures
Presented here is an alternative procedure for estimating the seismic displacement demand of
regular structures with period T less than period To that can be idealized as a single-degree-of-
freedom (SDF) system. This procedure utilizes the nonlinear force-deformation behavior of the
structure developed from nonlinear static pushover analysis. The computation of the
9
displacement demand is adopted from the procedure recommended in the FEMA-440 document
(ATC, 2005) and ASCE/SEI 41-06 standard (ASCE 2007). Although this procedure has been
described previously in Section 2.1.2, it is re-organized here to be compatible with the current
MOTEMS procedure. The proposed alternative procedure involves estimating the displacement
demand in a nonlinear SDF system from
T 2
Δ = C C S (2.19)d 1 2 A 2
4π
in which C1 and C2 are the coefficients that convert displacement demand of a linear-elastic
SDF system to displacement demand of nonlinear SDF system.
The coefficient C1 is given by
⎧
⎪1.0; T 1.0s
⎪
⎪ R −1
C1 = ⎨1.0 + 2
; 0.2sT ≤1.0s (2.20)
aT⎪
⎪ R −1
1.0 + ; T ≤ 0.2s⎪⎩ 0.04a
in which a is a site dependent constant equal to 130 for Site Class A and B, 90 for Site Class C,
and 60 for Site Class D, E, and F; and R is the ratio of the elastic to the yield strength of the
system and is defined as
S W
R = A
(2.21)
g Vy
in which SA is the spectral acceleration used in Equation (2.1), W is the seismic weight of the
system, Vy is the yield force (or base shear) of the system, and g is the acceleration due to
gravity. The coefficient C2 is given by
⎧1.0; T  0.7s
C2 = ⎨
⎪
1 ⎛ R −1
2 (2.22)⎞
1+ ; T ≤ 0.7s⎪ ⎜ ⎟
⎩ 800 ⎝ T ⎠
Equation (2.19) can be used to compute the displacement demand for systems in which
R ≤ Rmax where Rmax is given by
10
−t
Δd
αe
(2.23)Rmax = +
Δy 4
in which Δd is smaller than the computed displacement demand, Δd , from Equation (2.19) or
the displacement corresponding to the maximum strength in the pushover curve, Δy is the yield
displacement of the idealized bilinear force-deformation curve, t is a constant computed from
1 0.15ln(T ) (2.24)t = +
and αe is the effective post-elastic stiffness ratio computed from
αe = αP−Δ + λ α( 2 −αP−Δ ) (2.25)
where λ is a near-field effect factor equal to 0.8 for sites that are subjected to near-field effects
and 0.2 for sites that are not subjected to near field effects. The near field effects may be
considered to exist if the 1 second spectral value, S1 , at the site for the maximum considered
earthquake is equal to or exceeds 0.6g. The P-Delta stiffness ratio, αP−Δ , and the maximum
negative post-elastic stiffness ratio, α2 , in Equation (2.25) are estimated from the idealized
force-deformation curve in Figure 2.2. The αP−Δ needed in Equation (2.25) may be estimated by
conducting pushover analysis with and without P-Delta effects.
2.2 IRREGULAR STRUCTURES
2.2.1 Current MOTEMS Procedure
The current MOTEMS procedure requires that the seismic displacement demand in irregular
concrete or steel structures with high or moderate seismic risk classification be computed from
linear modal analysis. This procedure assumes that the displacement demand in irregular
structures deformed beyond the linear elastic range may be approximated by that of a linear
elastic structure. For irregular concrete and steel structures with low seismic risk, the
displacement demand must be computed by a nonlinear static procedure; the nonlinear static
procedure for such irregular structures appears to be similar to that for regular structures.
11
2.2.2 Proposed Nonlinear Static Procedure for Irregular Structures
Presented here is a rational nonlinear static procedure for estimating displacement demand in
irregular structures. Proposed initially by Chopra and Goel (2004) to estimate seismic demands
in unsymmetric-plan buildings, this procedure has been slightly modified to estimate
displacement demands in irregular Marine Oil and LNG Terminals. The following is a step-by-
step summary of this procedure.
1.	 Compute the natural frequencies, ωn and modes, φn , for linearly elastic vibration of the
irregular Marine Oil and LNG Terminal.
2. Select a reference point where the displacement, urn , is to be monitored in the selected
direction of analysis during the pushover analysis. Ideally, this reference point should be the
location on the structure with largest value of φrn in the selected direction of analysis.
3.	 For the nth-mode, develop the pushover curve, Vbn −urn , for the nth modal force distribution,
sn
*
= Mφn , where s*
n is the vector of lateral forces used during the pushover analysis, M is
the mass matrix of the structure, and φn is the nth mode shape. The base shear Vbn should be
monitored in the same direction as the direction of selected reference point displacement urn .
4. Convert the V −u pushover curve to the force-displacement, F Ln − Dn , relation for thebn	 rn sn
nth -“mode” inelastic SDF system by utilizing F Ln =Vbn M *
and D = u Γnφrn in whichsn n n rn
φrn is the value of φn at the reference point in the direction under consideration,
Mn
*
= (φn
T
Mι)
2
φT
Mφ is the effective modal mass, and Γ = φT
Mι φT
Mφ with ι equal ton	 n n n n	 n
the influence vector. The influence vector ι is a vector of size equal to the total number of
degrees of freedom. For analysis in the x-direction, the components of ι corresponding to x-
degree-of-freedom are equal to one and the remaining components equal to zero. Similarly
the components of ι corresponding to y-degree-of-freedom are equal to one and the
remaining components equal to zero for analysis in the y-direction.
5. Idealize the force-displacement, F Ln − Dn , curve as a bilinear curve and compute the yieldsn
value Fsny Ln .
12
6. Compute the yield strength reduction factor, R = SA L ).(Fsny n
7.	 Compute the peak deformation Dn = Δd of the nth-“mode” inelastic SDF system defined by
the force-deformation relation developed in Step 4 and damping ratio ζn , from Equation
(2.19). The elastic vibration period of the system is based on the effective slope of the
1/2
F L − D curve, which for a bilinear curve is given by T = 2π (L D Fsny ) .sn n	 n n n ny
8.	 Calculate peak reference point displacement urn associated with the nth-“mode” inelastic
SDF system from u = Γ φ D .rn n rn n
9.	 Push the structure to reference point displacement equal to urn and note the values of desired
displacement δno .
10. Repeat Steps 3 to 9 for all significant modes identified.
11. Combine the peak modal displacement, δno , by an appropriate modal combination rule, e.g.,
CQC, to obtain the peak dynamic response, Δo .
13
3. SIMPLIFYING ASSUMPTION 

Figure 3.1b shows the mathematical model of a free-head pile of Figure 3.1a supported on
bedrock (or other competent soil) and surrounded by soil between the bedrock and mud line. In
this model, the pile is represented by beam-column elements and soil by Winkler reaction
springs connected to the pile between the bedrock and the mud line (Priestley et al., 1996). The
properties of the beam-column element are established based on the pile cross section whereas
properties of the reaction springs are specified based on geotechnical data (e.g., see Priestley et
al., 1996; Dowrick, 1987). Figure 3.1c shows the height-wise distribution of bending moment
under lateral load applied to the pile tip. Note that the maximum bending moment occurs slightly
below the mud line at a depth equal to Dm , typically denoted as the depth-to-maximum-moment
below the mud line (Figure 3.1c). Lateral displacement at the pile tip can be calculated based on
this bending moment distribution or from a discrete element model implemented in most
commonly available computer programs for structural analysis.
Mud Line
Bedrock
P
F
Mud Line
P
F
Δ
Mud Line Dm
Mud Line
Δ
L
D
f
P
F
(a) (b) (c) (d)
Figure 3.1. Simplified model of the pile-soil system for displacement capacity evaluation: (a)
Pile supported on bedrock; (b) Mathematical model of the pile; (c) Height-wise variation of
bending moment; and (d) Equivalent fixity model for displacement calculation.
An alternative approach to modeling soil flexibility effects of the pile with discrete soil
springs is the effective fixity approach (Priestley et al., 1996: Sec. 4.4.2; Dowrick, 1987: Sec.
6.4.5.3). In this approach (Figure 3.1d), the depth-to-fixity, Df , is defined as the depth that
produces in a fixed-base column with soil removed above the fixed base the same top-of-the-pile
lateral displacement under the lateral load, F , as that in the actual pile-soil system (Priestley et
al., 1996). Both the axial load, P , and top-of-the-pile moment, M (not shown in Figure 3.1d)
14
need to be considered. The depth-to-fixity, which depends on the pile diameter and soil
properties, is typically provided by the geotechnical engineer, estimated from charts available in
standard textbooks on the subject (e.g., Priestley, et al., 1996; Dowrick, 1987) or from
recommendations in several recent references (e.g., Chai, 2002; Chai and Hutchinson, 2002).
The equivalent fixity model is typically used for estimating displacement of piles that
remain within the linear-elastic range. For piles that are expected to be deformed beyond the
linear-elastic range, however, nonlinear analysis of the discrete soil spring model approach of
Figure 3.1b is recommended (Priestley et al., 1996: Sec. 4.4.2) because the plastic hinge forms at
the location of the maximum bending moment, i.e., at the depth-to-maximum-moment, Dm , and
not at the depth-to-fixity, Df . A recent investigation has developed equations for estimating
lateral displacement of equivalent fixity model of the nonlinear soil-pile system by recognizing
that the plastic hinge forms at the depth-to-maximum-moment (Chai, 2002); expressions for
estimating displacement ductility capacity of pile-soil system are also available (Priestley et al.,
1996: Sec. 5.3.1). However, calculation of lateral displacement capacity of nonlinear soil-pile
systems using these approaches requires significant information about the soil properties.
This investigation uses a simplifying assumption that the equivalent fixity model may
directly be used to estimate lateral displacement capacity of nonlinear piles. Clearly, such an
approach indicates that the plastic hinge would form at the depth-to-fixity, Df , which differs
from the actual location at the depth-to-maximum-moment, Dm . It is useful to note that Df is
typically in the range of 3 to 5 pile diameter whereas Dm is in the range of 1 to 2 pile diameter
(see Priestley et al., 1996). Obviously, plastic hinge at Df in the equivalent fixity model would
provide slightly larger plastic displacement compared to the plastic displacement if the plastic
hinge was correctly located at Dm ; note that plastic displacement is given by
Δ = p Lp θ ( a + Df or Dm ) where θp is the plastic hinge rotation and La is the free-standing height
of the pile. However, the simplifying assumption used in this investigation is appropriate because
difference between Df and Dm is unlikely to significantly affect the plastic displacement for
piles with very long free-standing height used in marine oil terminals. Note that the freestanding
height of piles in marine oil terminals is typically in excess of twenty times the pile diameter.
15
It is useful to emphasize that the simplified approach proposed in this investigation is
intended to be used for preliminary design of piles or as a check on the results from the detailed
nonlinear analysis. It is expected that this approach would provide results that are sufficiently
“accurate” for this purpose.
The recommendations to estimate displacement capacity of the pile using the equivalent
fixity approach are strictly valid only if the displacement demand is also estimated by utilizing
the equivalent fixity pile model – a practice that is commonly used for analysis of large piers and
wharves with many piles. The recommendations developed in this report should be used with
caution if the displacement demand is estimated from a model consisting of piles with soil
springs.
16
4. MOTEMS PROCEDURE FOR CAPACITY EVALUATION OF PILES 

The displacement capacity of piles in the MOTEMS is estimated from nonlinear static pushover
analysis. In this analysis, a force of increasing magnitude is applied statically in the transverse
direction (perpendicular to the pile) permitting the materials in the pile – steel and/or concrete –
to deform beyond their linear-elastic range. The displacement capacity is defined as the
maximum displacement that can occur at the tip of the pile without material strains exceeding the
permissible values corresponding to the desired design level.
The displacement capacity of a pile at a selected design level in the MOTEMS is obtained
from the procedure proposed by Priestley et al. (1996) as illustrated in Figure 4.1. This procedure
requires development of the pile section moment-curvature relationship. The moment-curvature
relationship may be developed from any standard moment-curvature analysis programs using
material constitutive relationships specified in the MOTEMS; the MOTEMS specifies guidelines
for selecting material properties such as concrete and steel strengths as well as stress-strain
curves for unconfined concrete, confined concrete, reinforcing steel, and prestressing steel. The
moment-curvature relationship is idealized as a bilinear relationship as shown in Figure 4.2.
It is useful to note that the formulation presented here is for a cantilever, i.e., a pile with a
pin-connection to the deck. Similar formulation is available for piles with full-moment-
connection to the deck that uses “effective” length defined as the length between points of
contra-flexure (e.g., see CALTRANS, 2006).
Δ ΔΔ y p
L
Lp
φ φ
θ
p
p y
(a) Member (b) BM (c) Curvature (d) Deflections
Figure 4.1. Deformation capacity of a pile: (a) Deflected shape, (b) Bending moment (BM)
diagram, (c) Curvature distribution, and (d) Yield and plastic displacements.
The total displacement capacity of the pile is computed as
17
Δ = Δ + Δ (4.1)y P
in which Δy is the yield displacement and Δp is the plastic displacement of the pile. The yield
displacement can be estimated as
2
Δ =
φyL
(4.2)y
3
where φy is the yield curvature computed from
M y
φy = (4.3)
E Ic e
with M being the yield moment and E I being the slope of the initial elastic portion of they c e
bilinear idealization of the moment-curvature relationship, and L is the pile “effective” length.
The “effective” length, defined as the length between points of contraflexure, for a cantilever
becomes equal to its total length (Figure 4.1).
It is useful to note that the yield displacement, Δy , of reinforced-concrete pile may be
estimated from Equation (4.2), without the need for section moment-curvature analysis, by using
the following expression for dimensionless yield curvature (Priestley et al., 1996: Sec. 7.4.6):
φyD = 2.45εy ± 0.15 (4.4)
in which D is the pile diameter and εy is the longitudinal yield reinforcement. Similar
expression for hollow-steel pile is currently not available.
Mu
M
y
Moment
First Yield
φ φ
y u
Figure 4.2. Bilinear idealization of the moment-curvature relationship.
18
Curvature
The plastic displacement, Δ p, is computed from
⎛ ⎞Mu
1 φ φ− L 0.5 (4.5)Δ = − Δ + L − Lp ⎜ ⎟ y p ( u y )( p )⎜ ⎟M⎝ y ⎠
The plastic displacement given by Equation (4.5) includes components due to the elastic
displacement resulting from the increase in moment from M y to Mu , i.e., post-yield stiffness of
the moment-curvature relationship (see Figure 4.2) and due to plastic rotation θp of the pile. In
order to compute the plastic rotation, it is assumed that a constant plastic curvature, φp = φ φyu − ,
occurs over a plastic hinge length Lp of the pile (see Figure 4.1c). Therefore, the plastic rotation
is given by
θp L = φ φ (4.6)= pφp Lp ( u − y )
The values of Mu and φu in equation (4.5) are the largest values of the pile section moment and
curvature, respectively, without exceeded the material strains at selected design level.
The MOTEMS specify the formula for estimating the plastic hinge length required in
Equation (4.5). If the hinge were to form against a supporting member, i.e., at the pile-deck
interface, the plastic hinge length is computed from
⎧0.08L + 0.022 fyedbl ≥ 0.044 fyedbl ( fye in MPA)
Lp = ⎨ (4.7)
⎩ 0.08L + 0.15 fyedbl ≥ 0.3 fyedbl ( fye in ksi)
in which fye is the expected yield strength of the reinforcing steel, and dbl is the diameter of the
longitudinal reinforcement. If the plastic hinge forms in-ground, the MOTEMS provide a chart to
estimate the plastic hinge length that depends on the pile diameter, subgrade modulus, effective
stiffness of the pile, and the distance from ground to the pile point of contraflexure. It is useful to
note that Equation (4.7), as specified in Priestley et al., (1996) or in the MOTEMS (2006), does
not explicitly impose an upper limit even though there may be some experimental evidence that
the plastic hinge length should not be greater than the pile diameter.
19
The plastic hinge length formula of Equation (4.7) specified in the MOTEMS is based on
the recommendation by Priestley et al. (1996) for reinforced concrete sections. The MOTEMS
do not provide recommendations for plastic hinge length for steel piles or prestressed concrete
piles.
The MOTEMS specify material strain limits for two levels of seismic design: Level 1 and
Level 2. These strain limits depend on whether the plastic hinge forms in-ground or at the pile-
deck interface. These strain limits are listed in Table 4.1.
Table 4.1. Material strain limits in the MOTEMS.
Pile Type Material Hinge Location Level 1 Level 2
Reinforced-Concrete
Pile
Concrete Pile-Deck 0.004cε ≤ 0.025cε ≤
In-Ground 0.004cε ≤ 0.008cε ≤
Steel rebar Pile-Deck 0.01sε ≤ 0.05sε ≤
In-Ground 0.01sε ≤ 0.025sε ≤
Prestressed Concrete
Pile with Dowel-
Connection
Strands In-Ground 0.005pε ≤
(Incremental)
0.025pε ≤
(Total)
Pile-Deck 0.01sε ≤ 0.05sε ≤
Hollow Steel Pile Steel 0.008sε ≤ 0.025sε ≤
Hollow Steel Pile with
Dowel-Connection
Steel In-Ground1
0.008sε ≤ 0.025sε ≤
Pile-Deck2
0.01sε ≤ 0.05sε ≤
1
The strain values are the same as for steel in hollow steel pile. 

2
The strain values are the same as for steel rebar at the pile-deck connection of a RC pile. 

20
5. SIMPLIFIED PROCEDURE TO COMPUTE PILE DISPLACEMENT CAPACITY
Estimation of displacement capacity of the pile according to the seismic provisions of the
MOTEMS require monitoring of material strains during the nonlinear static pushover analysis of
the pile if the pile is modeled using a distributed-plasticity approach in which section properties
are specified by a fiber-section. The estimation of the displacement capacity requires monitoring
of material strains during moment-curvature analysis if the pile is modeled using a concentrated-
plasticity approach in which nonlinearity is represented by rotational springs at two ends of the
pile. The nonlinear moment-rotation relationship of this spring is computed from the moment-
curvature relationship and estimated length of the plastic hinge. In either approach, the
displacement capacity is defined as the maximum displacement that can occur at the tip of the
pile without material strains exceeding the strain limits specified in the MOTEMS for any
selected design level.
Monitoring strains during pushover analysis of piles using a distributed-plasticity model is
cumbersome. Moreover, structural analysis programs commonly used by practicing engineers
may not have the capability to directly monitor strains during the pushover analysis. Although,
the concentrated-plasticity model, such as that employed in the current MOTEMS (see
description in Chapter 4), does not require direct monitoring of material strains during pushover
analysis; however, it still requires monitoring of material strains during moment-curvature
analysis. Most commercially available programs for moment-curvature analysis do provide the
capability to monitor material strains. However, this approach requires estimation of plastic
hinge length in order to convert the moment-curvature relationship to the moment-rotation
relationship of the rotational spring. While the MOTEMS provide guidelines for estimating
plastic hinge length for reinforced concrete piles [see Equation (4.7)], such guidelines are not
available for steel piles or prestressed concrete piles indicating that estimation of displacement
capacity of such piles using concentrated-plasticity model may also be cumbersome. Therefore,
there is a need to develop a simplified approach that avoids the need to monitor strains to the
extent possible and yet provides a “good” estimate of displacement capacity of the pile without
exceeding material strain limits specified in the MOTEMS.
It is useful to note that formulas and/or charts for estimating the plastic hinge length have
been recommended by several researchers (e.g., Priestley et al., 1996; Chai, 2002; Chai and
21
Hutchinson, 2002; Budek et al., 2000; Song et al., 2004). However, these recommendations were
developed for piles deformed significantly into the inelastic range. While such recommendations
are appropriate for seismic design of piles for Level 2, where piles are expected to be deformed
significantly into the inelastic range, they may not be appropriate for design of piles for Level 1
which corresponds to much lower level of inelastic action.
A simplified procedure is proposed in this report to compute the displacement capacity of
piles commonly used in Marine Oil and LNG Terminals. This approach computes the
displacement capacity as
Δc = μΔΔy (5.1)
where Δy is the yield displacement of the pile and μΔ is the displacement ductility capacity of
the pile. The displacement ductility capacity is selected such that the material strains remain
within the limits specified in the MOTEMS.
The guidelines to select the displacement ductility capacity and estimate the yield
displacement are developed next in this report for four types of piles: (1) reinforced-concrete
piles with either pin or full-moment connection to the deck; (2) hollow steel pipe pile with either
pin or full-moment connection to the deck; (3) hollow steel pipe pile with a dowel- connection to
the deck; and (4) prestressed concrete pile with a dowel-connection to the deck. The guidelines
developed for these piles utilize the concept of equivalent fixity model described in Chapter 3 of
this report.
Similar displacement ductility capacity based approaches have been proposed previously
(e.g., Priestly et al., 1996; Budek at al., 2000; Chai, 2002; Song et al., 2004). However, this
investigation specifically developed recommendations for displacement ductility capacity of long
piles typically used in Marine Oil and LNG Terminals.
The simplified procedure to estimate displacement capacity of piles presented in this report
is intended either for preliminary design of piles or as a quick check on the capacity that may be
obtained from detailed nonlinear analyses. The design engineers may still use the elaborate
analysis for final design of piles for a Marine Oil and LNG Terminals.
22
6. DISPLACEMENT CAPACITY OF REINFORCED CONCRETE PILES 

This Chapter presents development of a simplified procedure for estimating displacement
capacity of reinforced concrete piles connected to the deck either by a pin connection or by a
moment connection. For this purpose, the current approach in the MOTEMS (see Equations 4.1
to 4.7 in Chapter 4) is further simplified. Presented first in this Chapter is development of
simplified equations to compute displacement ductility of reinforced concrete piles that are
independent of the pile length and depend only on the pile section curvature ductility and seismic
design level. The accuracy of these equations is next evaluated against results from nonlinear
finite element analyses. Subsequently, results of a parametric study are presented to understand
the sensitivity of the displacement ductility capacity on pile diameter, longitudinal reinforcement
ratio, transverse reinforcement ratio, and axial force. Based on these results, lower bound
estimates of the ductility capacity of reinforced concrete piles for two design levels – Level 1 and
Level 2 – are proposed. Finally, it is demonstrated that the lower-bound displacement ductility
values along with simplified expressions for yield displacement provide very good estimate of
the displacement capacity of piles when compared against values from nonlinear finite element
analysis.
6.1 THEORETICAL BACKGROUND
The displacement ductility capacity of reinforced concrete piles is defined as (Priestley et al.,
1996)
Δ + Δ Δ L Ly p p Mu ⎛ p ⎞⎛ p ⎞
μΔ = = +1 = + 3(μφ −1)⎜ ⎟⎜1− 0.5 ⎟ (6.1)
Δ Δ M L Ly y y ⎝ ⎠⎝ ⎠
in which μφ is the pile section curvature ductility capacity given by
φu
μφ = (6.2)
φy
with φu being the section curvature at a selected design level material strain and φy is the yield
curvature defined by Equation (4.3) and Figure 4.2. For piles in Marine Oil and LNG Terminals,
which typically use piles with very long free-standing height, the second term in Equation (4.7)
for plastic hinge length becomes negligibly small compared to the first term implying that this
23
term may be ignored without introducing significant error. Therefore, the plastic hinge length
may be expressed as
Lp  0.08L (6.3)
Equation (6.3) implies that the ratio pL L needed in Equation (6.1) is independent of the
member “effective” length. It is useful to note that neglecting the second term in the Equation
(4.6) for the plastic hinge location leads to smaller plastic hinge length and therefore is likely to
provide a conservative estimate of the displacement ductility capacity of the pile.
The preceding approximation permits the following important simplification in Equation
(6.1):
M Mu u
μΔ = + 3(μφ −1)(0.08)(1− 0.5×0.08) = + 0.2304(μφ −1) (6.4)
M My y
which implies that the pile displacement ductility capacity is independent of its “effective”
length; it depends only on the section curvature ductility, μφ , and ratio of ultimate and yield
moments Mu M y . For moment-curvature relationship that exhibit very little post-yield
stiffness, i.e., M  M y , Equation (6.4) can be further simplified asu
1 μ 1μΔ = + 0.2304( φ − )= 0.7696 + 0.2304μφ (6.5)
Equation (6.5) indicates that member displacement ductility capacity can be computed directly
from the section curvature ductility capacity.
6.2 EVALUATION OF SIMPLIFIED EQUATIONS FOR DUCTILITY CAPACITY
The accuracy of Equations (6.5) in estimating displacement ductility capacity of reinforced
concrete piles at seismic design Level 2 and Level 1, respectively, is evaluated in this section.
For this purpose, displacement ductility capacity of reinforced concrete piles is evaluated from
nonlinear static pushover analysis of a finite element model. The pile is considered to be fixed at
top and bottom. These boundary conditions correspond to a pile that is connected to the pile-cap
with a full-moment connection, and utilizes the equivalent displacement fixity assumption at the
'
bottom. The axial load on the pile is assumed to be 0.05A f in which A is the gross cross-g c g
24
'
section area of the pile and f is the compressive strength of concrete. The longitudinal andc
transverse reinforcements in the pile section are assumed to be equal to 1% and 0.6%,
respectively.
The pile is modeled with a nonlinear beam-column element in computer program Open
System for Earthquake Engineering Simulation (OpenSees) (McKenna and Fenves, 2001). The
distributed plasticity is considered by specifying the section properties by a fiber section model
and then using seven integration points along the element length; details of such modeling may
be found in McKenna and Fenves (2001). The material properties are specified as per the
MOTEMS specifications (MOTEMS, 2007; Mander et al., 1988).
Strains in the concrete and steel are monitored during the pushover analysis. The limiting
values of compressive strain in concrete and tensile strain in reinforcing steel are 0.004 and 0.01,
respectively, for Level 1 and 0.025 and 0.05, respectively, for Level 2. If the hinge forms below
ground, the limiting value of compressive strain in concrete and tensile strain in reinforcing steel
are 0.004 and 0.01, respectively, for Level 1 and 0.008 and 0.025, respectively, for Level 2. The
concrete strains are assumed to be specified just inside the reinforcement cage. The displacement
ductility at a selected design level corresponds to the largest displacement that can occur at the
tip of the pile without strain limits either in concrete or steel being exceeded.
The results are presented in Figure 6.1 for four pile diameters – 61 cm, 76 cm, 91 cm, and
107 cm – and pile length in the range of 5 m to 40 m. These results confirm expectations from
Equation (6.5) that the displacement ductility capacity is independent of the pile length. This
becomes apparent from essentially no variation in the ductility capacity from the nonlinear finite
element analysis of the pile lengths in Figure 6.1 for both design levels and all pile diameters.
The presented results also demonstrate that Equation (6.5) provides a very good estimate of the
displacement ductility capacity of reinforced concrete piles (see Figure 6.1).
It is useful to note that the plastic hinge length used in this investigation does not include
contribution to the plastic hinge length due to strain-penetration effects. It would be useful to
verify these findings from experiments on reinforced concrete piles.
25
3
4
5
6
7
(a) Level 1, IG or PD	 (b) Level 2, IG (c) Level 2, PD
7
Pile Dia.= 61 cm	
7
Pile Dia.= 61 cm
6 6
Pile Dia.= 61 cm
Pile Dia.= 76 cm
Pile Dia.= 91 cm
Pile Dia.= 107 cm
0 10 20 30 40
μ	μμμ
Δ1,IGorPDΔ1,IGorPDΔ1,IGorPDΔ1,IGorPD
5 5
μμμ	μΔ2,IG	Δ2,IGΔ2,IGΔ2,IG
μ	μμμ
Δ2,PD	Δ2,PDΔ2,PDΔ2,PD
4 4
33
2 2 2
1 1 1
7 7 7
6
Pile Dia.= 76 cm
6
Pile Dia.= 76 cm
6
5 5 5
4 4 4
3 3 3
2 2 2
1 1 1
7 7 7
6
Pile Dia.= 91 cm
6
Pile Dia.= 91 cm
6
5 5 5
4 4 4
3 3 3
2 2 2
1 1 1
7 7 7
Pile Dia.= 107 cm
0 10 20 30 40
Pile Dia.= 107 cm
0 10 20 30 40
6 6 6
5 5 5
44 4
3 3 3
2 2 2
1 1 1
Pile length, m Pile length, m	 Pile length, m
Figure 6.1. Displacement ductility capacity from simplified equation (shown in dashed line) and
nonlinear finite element analysis (NLFEA) for seismic design (a) Level 1 for in-ground (IG) or
pile-deck (PD) hinge formation, (b) Level 2 for IG hinge formation, and (c) Level 2 for PD hinge
formation.
6.3 SENSITIVITY OF DISPLACEMENT DUCTILITY TO PILE PARAMETERS
6.3.1 Pile Length and Pile Diameter
Figure 6.2 presents variation of displacement ductility capacity with pile length for four values of
pile diameters: 61 cm, 76 cm, 91 cm, and 107 cm. The results are presented for piles with 1%
longitudinal reinforcement and 0.6% transverse reinforcement. As noted previously, results of
26
2
6
Figure 6.2 also indicate that the displacement ductility capacity of piles is essentially
independent of the pile length. This is expected because Equation (6.5) becomes independent of
the pile length. The results of Figure 6.2 indicate that the displacement ductility capacity of the
pile is also essentially independent of the pile diameter as apparent from almost identical curves
for the four pile diameters considered in Figure 6.2.
(a) Level 1, IG or PD	 (b) Level 2, IG (c) Level 2, PD
4 7
μΔ1,IG
91 cm
107 cm
1 1 1
μ
Δ2,PD
μΔ1,IGorPD
5
NLFEA: Pile Dia.
3
1.5
61 cm
76 cm2 3
0 10 20 30	 40 0 10 20 30 40 0 10 20 30
Pile Length, m	 Pile Length, m Pile Length, m
Figure 6.2. Variation of displacement ductility capacity computed from nonlinear finite element
analysis (NLFEA) with pile length and pile diameter: (a) Level 1 for in-ground (IG) or pile-deck
(PD) hinge formation, (b) Level 2 for IG hinge formation, and (c) Level 2 for PD hinge
formation.
In order to understand the aforementioned trend, i.e., independence of the displacement
ductility capacity of the pile diameter, it is useful to examine the variation of pile section
curvature ductility capacity. The results presented in Figure 6.3 indicate that the section
curvature ductility capacity is essentially independent of the pile diameter. This observation,
along with Equation (6.5), then confirms that the pile displacement ductility capacity should also
be independent of the pile diameter.
(a) Level 1, IG or PD	 (b) Level 2, IG (c) Level 2, PD
20 30
25
15
μ
φ1,IGorPD
4 20
φ2,PD
φ2,IG
10 15
μ
μ
2 10
5
5
50
0
70 90 110 50
0
70 90 110 50
0
70 90 110
Pile Diameter, cm Pile Diameter, cm Pile Diameter, cm
Figure 6.3. Variation of section curvature ductility capacity pile diameter: (a) Level 1 for in-
ground (IG) or pile-deck (PD) hinge formation, (b) Level 2 for IG hinge formation, and (c) Level
2 for PD hinge formation.
27
40
5
5
6.3.2 Longitudinal and Transverse Reinforcement Ratio
Figures 6.4 and 6.5 present variations of the displacement ductility capacity with longitudinal
and transverse reinforcement ratio, respectively. The results presented are for a pile with 91 cm
diameter and 15 m length. The values of longitudinal reinforcement varying between 0.5% and
2% and transverse reinforcement between 0.5% and 1.5% were considered.
(a) Level 1, IG or PD	 (b) Level 2, IG (c) Level 2, PD
5 9
4 4 7
Δ1,IGorPD
Δ2,PD
Δ2,IG
3 3 5
μ
μ
2 2 3
1 1 1
0.5 1 1.5 2 0.5 1 1.5 2 0.5 1 1.5 2
Pile Longitudinal Reinforcement, % Pile Longitudinal Reinforcement, % Pile Longitudinal Reinforcement, %
μ
Figure 6.4. Variation of displacement ductility capacity computed from nonlinear finite element
analysis (NLFEA) with pile longitudinal reinforcement ratio: (a) Level 1 for in-ground (IG) or
pile-deck (PD) hinge formation, (b) Level 2 for IG hinge formation, and (c) Level 2 for PD hinge
formation.
The results presented in Figure 6.4 indicate that the displacement ductility decreases with
increasing longitudinal reinforcement ratio for values up to about 1%. For longitudinal
reinforcement ratio in excess of about 1%, as may be the case for seismic piles in Marine Oil and
LNG Terminals, the displacement ductility capacity of piles is much less sensitive to the value of
the longitudinal reinforcement ratio. For such values, the displacement ductility capacity may be
considered to be essentially independent of the longitudinal reinforcement ratio.
(a) Level 1, IG or PD (b) Level 2, IG	 (c) Level 2, PD
9 9
4 7 7
Δ1,IGorPD
Δ2,PD
Δ2,IG
3 5 5
μ
μ
μ
2 3 3
1 1 1
0.5	 0.75 1 1.25 1.5 0.5 0.75 1 1.25 1.5 0.5 0.75 1 1.25 1.5
Pile Transverse Reinforcement, % Pile Transverse Reinforcement, % Pile Transverse Reinforcement, %
Figure 6.5. Variation of displacement ductility capacity computed from nonlinear finite element
analysis (NLFEA) with pile transverse reinforcement ratio: (a) Level 1 for in-ground (IG) or
pile-deck (PD) hinge formation, (b) Level 2 for IG hinge formation, and (c) Level 2 for PD hinge
formation.
28
5
The results presented in Figure 6.5 show that displacement ductility capacity of piles does
not depend on the transverse reinforcement ratio. This becomes apparent from essentially flat
variation of the displacement ductility capacity with pile transverse reinforcement ratio.
6.3.3 Axial Force
Figure 6.6 presents variation of displacement ductility capacity with axial force in the pile. The
presented results are for a pile with 91 cm diameter and 15 m length for values of axial force
'
varying from zero to 0.2A f . These results show that the displacement ductility for Level 1g c
tends to increase with increasing pile axial force (Figure 6.6 (a)). However, the ductility for
Level 2 appears to be insensitive to the axial force values (Figure 6.6 (b) and 6.6(c)).
(a) Level 1, IG or PD	 (b) Level 2, IG (c) Level 2, PD
5 9
0 0.05 0.1 0.15 0.2 0 0.05 0.1 0.15 0.2
4 4 7
μ
Δ1,IGorPD
2 2 3
μ
Δ2,PD
1 1 1
0	 0.05 0.1 0.15 0.2
Pile Axial Force/(A f′ ) Pile Axial Force/(A f′ ) Pile Axial Force/(A f′ )c c c c	 c c
μΔ2,IG
3 3 5
Figure 6.6. Variation of displacement ductility capacity computed from nonlinear finite element
analysis (NLFEA) with pile axial load ratio: (a) Level 1 for in-ground (IG) or pile-deck (PD)
hinge formation, (b) Level 2 for IG hinge formation, and (c) Level 2 for PD hinge formation.
6.4 LOWER BOUND OF DISPLACEMENT DUCTILITY CAPACITY
The results presented in the preceding section indicate that the displacement ductility is relatively
insensitive to pile length, pile diameter, pile longitudinal (for practical range), and transverse
steel. Furthermore, the displacement ductility for Level 2 is also independent of the pile axial
force. Therefore, the displacement ductility appears to be a very robust parameter that can be
used in simplified design of piles instead of the various axial strain limits which are currently
specified in the MOTEMS. While the displacement ductility may be related to the pile curvature
ductility using Equation (6.5), the results presented in the preceding section also indicate that a
lower bound of the member displacement ductility capacity may be estimated without any
knowledge about the section curvature ductility capacity for practical range of various
parameters.
29
(a) Level 1 (b) Level 2
3 7
μ = 1.75
Δ1, PD
1.5
1 1
μΔ2,PD
μΔ2, PD
= 5
NLFEA: Pile Dia.
61 cm
76 cm
91 cm
107 cm
2.5
5
μ
Δ1,PD
2
3
0 10 20 30 40 0 10 20 30 40
Pile Length, m Pile Length, m
Figure 6.7. Lower-bound value of displacement ductility capacity due to pile-deck hinge
formation for seismic design (a) Level 1, and (b) Level 2.
The results presented in Figure 6.7 for a pile-deck hinge indicates that the displacement
ductility capacity may be limited to 1.75 for seismic design Level 1 and 5.0 for seismic design
Level 2. Note that the displacement ductility for Level 1 is likely to be slightly lower for axial
force values than the 0.05A f ′ value considered in developing these results (see Figure 6.6 (a)).g c
Similarly, the displacement ductility is likely to be slightly larger for longitudinal reinforcement
less than the 1% value considered in developing these results (see Figure 6.4 (a)).
The displacement ductility capacity for an in-ground hinge is 1.75 for seismic design Level
1 and 2.5 for seismic design Level 2 (Figure 6.8). While the ductility capacity for in-ground
hinge is the same as for pile-deck hinge for design Level 1, it is much lower for design Level 2.
This is because the steel strain limit for design Level 2 is much lower for the in-ground hinge
compared to the pile-deck hinge.
(a) Level 1 (b) Level 2
2 4
0 10 20 30 40
μ
μ
Δ1, IG
= 1.75
NLFEA: Pile Dia.
61 cm
76 cm
91 cm
107 cm
μΔ2,IG
μ
Δ2, IG
= 2.5
0 10 20 30 40
3.5
3
2.5
2
1.5
1
Δ1,IG
1.5
1
Pile Length, m Pile Length, m
Figure 6.8. Lower-bound value of displacement ductility capacity due to in-ground hinge
formation for seismic design (a) Level 1, and (b) Level 2.
30
6.5 SIMPLIFIED PROCEDURE TO COMPUTE DISPLACEMENT CAPACITY
Displacement capacity of piles at a selected design level may be estimated from
Δc = μΔΔy (6.6)
in which μΔ is the ductility capacity at a selected design level and location of hinge, i.e., equal
to 1.75 for Level 1 design and 5 for Level 2 design if the hinge were to form in the pile near the
deck, and equal to 1.75 for Level 1 and 2.5 for Level 2 if the hinge were to form in-ground, and
Δy is the yield displacement of the pile. The yield displacement can be computed from nonlinear
pushover analysis of the pile. Alternatively, the yield displacement may be estimated based on
section yield moment and effective section EIe . For example, the yield displacement of a pile
that is fixed at the bottom and prevented from rotation at the top due to a rigid deck may be
estimated from
2
M Ly
y (6.7)Δ =
6EIe
and yield displacement of a cantilever may be estimated from
2
Δ =
M yL
(6.8)y
3EIe
in which M y is the section yield moment and EIe is the effective value of EI that can be
estimated from the section moment-curvature relationship analysis as the initial slope of the
idealized bilinear moment-curvature relationship (see Figure 4.2).
The accuracy of the procedure to estimate the displacement capacity of piles is evaluated
next. For this purpose, the approximate displacement capacity is computed first from Equation
(6.6) by utilizing the yield displacement from Equation (6.7) or (6.8) depending on the boundary
conditions. The exact displacement capacity is computed next from Equation (6.6) but with yield
displacement estimated from nonlinear static pushover analysis of the pile. For both cases, the
value of the ductility capacity obtained from the pushover analysis is used. The approximate and
exact displacement capacities are compared in Figure 6.9 for a pile with 91 cm diameter. These
31
1
1.5
2
results indicate that the approximate analysis provides an excellent estimate of the displacement
capacity of the pile for Level 1 as well as Level 2 design.
(a) Level 1, IG or PD (b) Level 2, IG (c) Level 2, PD
3 5
Exact
2.5
0.5
10.5
0 0 0
0 10 20 30 40 0 10 20 30 40 0 10 20 30 40Δ,m2,IG
Pile Length, m Pile Length, m Pile Length, m
Δ,m
2,PD
Approximate 4
Δ,m1,IGorPD
2
3
1.5
2
1
Figure 6.9. Comparison of displacement capacities due to pile-deck hinge formation from exact
and approximate analyses.
The approximate analysis is attractive because it eliminates the need for nonlinear static
analysis of the pile. However, it must be noted that the approximate analysis may only be used
for the soil-pile-deck system that can be idealized either by a fixed-fixed column or by a
cantilever column – the two cases for which closed form solutions to estimate yield displacement
are available (see Equations 6.7 and 6.8) – using the equivalent displacement fixity concept. For
other cases, the yield displacement may have to be estimated from nonlinear static pushover
analysis of the soil-pile-deck system.
32
7. DISPLACEMENT CAPACITY OF HOLLOW STEEL PILES 

This Chapter presents development of a simplified procedure for estimating displacement
capacity of hollow steel piles connected to the deck either by a pin connection or by a full-
moment-connection strong enough to force hinging in the steel pile. For this purpose, the current
approach in the MOTEMS (see Equations 4.1 to 4.6 in Chapter 4) is further simplified. Presented
first is the development of simplified equations to compute displacement ductility of hollow steel
piles that are independent of the pile length and depend only on the pile section ductility and
seismic design level. The accuracy of these equations is then evaluated against results from
nonlinear finite element analyses. Subsequently, results of a parametric study are presented to
show the sensitivity of the displacement ductility capacity on pile diameter, pile thickness, and
axial force level. Based on these results, lower bound estimates of the ductility capacity of
hollow steel piles for two design levels – Level 1 and Level 2 – are proposed. Finally, it is
demonstrated that the lower-bound displacement ductility values along with simplified
expressions for yield displacement provide very good estimates of the displacement capacity of
piles when compared against values from nonlinear finite element analysis.
7.1 THEORETICAL BACKGROUND
Similar to the displacement ductility of reinforced concrete piles, the displacement ductility
capacity of hollow steel piles may also be defined as
⎛ Lp ⎞⎛ Lp ⎞
Δ 1 3(μφ −1)⎜ ⎟⎜1− 0.5 ⎟ (7.1)μ  +
L L⎝ ⎠⎝ ⎠
The MOTEMS does not explicitly provide guidelines for selecting length of the plastic hinge for
hollow steel piles. Based on calibration of results from finite element analysis against those from
Equation (7.1) (see results presented later in Figure 7.1), it was found that the following plastic
hinge lengths are appropriate for the two seismic design levels for hollow steel piles in Marine
Oil and LNG Terminals:
Lp  0.03L for Level 1 (7.2a)
Lp  0.075L for Level 2 (7.2b)
33
With the plastic hinge length selected as given by Equations (7.2(a) and 7.2(b)), Equation
(7.1) simplifies to
μΔ = 0.9113+ 0.0886μφ for Level 1 (7.3a)
μΔ = 0.7834 + 0.2166μφ for Level 2 (7.3b)
As noted previously for reinforced concrete piles, Equations (7.3(a) and 7.3(b)) for displacement
ductility capacity of hollow steel piles also indicates that the displacement ductility capacity is
independent of the pile length and it can be computed directly from the section curvature
ductility capacity. Because the plastic hinge length differs for the two design levels, the
displacement ductility also depends on the seismic design level.
7.2 EVALUATION OF SIMPLIFIED EQUATIONS FOR DUCTILITY CAPACITY
The accuracy of Equations (7.3(a) and 7.3(b)) in estimating displacement ductility capacity of
hollow steel piles at seismic design Level 1 and Level 2, respectively, is evaluated in this section.
For this purpose, displacement ductility capacity of hollow steel piles is evaluated from nonlinear
static pushover analysis of a finite element model. The pile is considered to be fixed at top and
bottom. These boundary conditions correspond to a pile that is connected to the pile-cap with a
full-moment connection that would force formation of a plastic hinge in the steel pile, and
utilizes the equivalent displacement fixity assumption at the bottom. The axial load on the pile is
assumed to be 0.05Afy in which A is the cross section area of the pile and f is the yieldy
strength of steel. The pile wall thickness is assumed to be 1.27 cm.
The pile is modeled with a nonlinear beam-column element using the computer program
“Open System for Earthquake Engineering Simulation (OpenSees)”, (McKenna and Fenves,
2001). The distributed plasticity is considered by specifying the section properties by a fiber
section model and the using seven integration points along the element length; details of such
modeling may be found in McKenna and Fenves (2001). Strains in steel are monitored during the
pushover analysis. The limiting values of strain in steel are 0.008 and 0.025 for Level 1 and
Level 2, respectively for in-ground or pile-deck hinge formation. The displacement ductility at a
selected design level corresponds to the largest displacement that can occur at the tip of the pile
without the strain limit in steel being exceeded.
34
The results are presented in Figure 7.1 for three pile diameters – 61 cm, 91 cm, and 107 cm.
These results permit two important observations. First, results from the nonlinear finite element
analysis confirm expectations from Equation (7.3(a) and 7.3(b)) that the displacement ductility
capacity is independent of the pile length. This becomes apparent by essentially no variation in
the ductility capacity from the nonlinear finite element analysis with the various pile lengths in
Figure 7.1 for both design levels and all pile diameters.
(a) Level 1 (b) Level 2
2 4
Pile Dia.= 61 cm Pile Dia.= 61 cm
1.8
μμμ
Δ1,IGorPDΔ1,IGorPDΔ1,IGorPD
μμμ
Δ2,IGorPDΔ2,IGorPDΔ2,IGorPD
3
1.6
1.4 Level 2 (Eq. 7.3b)
2 Level 1 (Eq. 7.3a)
NLFEA1.2
1 1
2 4
Pile Dia.= 91 cm Pile Dia.= 91 cm
1.8
1.6
1.4
3
2
1.2
1 1
2 4
Pile Dia.= 107 cm Pile Dia.= 107 cm
1.8
1.6
1.4
3
2
1.2
1 1
0 10 20 30 40 50 0 10 20 30 40 50
Pile Length, m Pile Length, m
Figure 7.1. Displacement ductility capacity from simplified equations and nonlinear finite
element analysis (NLFEA) for seismic design (a) Level 1 and (b) Level 2.
Second, Equations (7.3(a) and 7.3(b)) provide very good estimates of the displacement
ductility capacity of hollow steel piles at seismic design Level 1 (see Figure 7.1(a)) and Level 2
(see Figure 7.1(b)), respectively. If Equation (7.3(b)) were to be used to estimate, displacement
35
ductility capacity at seismic design Level 1, it would provide an estimate that significantly
exceeds the value from nonlinear finite element analysis (see Figure 7.1(a)). Therefore, a lower
value of the plastic hinge length, as has been used in Equation (7.3(a)) for seismic design Level 1
is justified.
These results indicate that the moment-rotation relationship to be used in the concentrated
plasticity model of hollow steel piles should consider different plastic hinge lengths for the two
design levels. If the same plastic hinge length, i.e., that for seismic design Level 2, is used in the
model that computes the displacement ductility capacity for Level 1, it may significantly
overestimate the displacement capacity for that design level (Level 1).
It is useful to note that the plastic hinge length for hollow steel piles in this investigation is
proposed based on calibration against nonlinear finite element results. It would be useful to
verify these findings from experiments on hollow steel pile conducted at displacement levels that
are expected during seismic design Level 1 and Level 2.
(a) Level 1 (b) Level 2
2 4
NLFEA: Pile Dia.
1.8 61 cm
μ
Δ1,IGorPD
91 cm
107 cm1.6
1.4
μΔ2,IGorPD
3
2
1.2
1 1
0 10 20 30 40 50 0 10 20 30 40 50
Pile Length, ft Pile Length, ft
Figure 7.2. Variation of displacement ductility capacity computed from nonlinear finite element
analysis (NLFEA) with pile length and pile diameter: (a) Level 1, and (b) Level 2.
7.3 SENSITIVITY OF DISPLACEMENT DUCTILITY TO PILE PARAMETERS
7.3.1 Pile Length and Pile Diameter
Figure 7.2 presents variation of displacement ductility capacity with pile length for three values
of pile diameters: 61 cm, 91 cm, and 107 cm. The results are presented for piles with wall
thickness of 1.27 cm. Results in Figure 7.2 indicate that the displacement ductility capacity of
piles is essentially independent of the pile length. This is expected because Equations (7.3(a) and
7.3(b)) becomes independent of the pile length. The results of Figure 7.2 also indicate that the
36
displacement ductility capacity of the pile is also essentially independent of the pile diameter as
apparent from almost identical curves for the three pile diameters considered.
In order to understand the aforementioned trend, i.e., independence of the displacement
ductility capacity of pile diameter, it is useful to examine the variation of pile section curvature
ductility capacity. The results presented in Figure 7.3 indicate that the section curvature ductility
capacity is essentially independent of the pile diameter. This observation, along with Equations
(7.3(a) and 7.3(b)), then confirms that the pile displacement ductility capacity should also be
independent of the pile diameter.
(a) Level 1 (b) Level 2
6 20
15
μ
φ1,IGorPD
4
2
μφ2,IGorPD
10
5
0 0
50 70 90 110 50 70 90 110
Pile Diameter, cm Pile Diameter, cm
Figure 7.3. Variation of section curvature ductility capacity with pile diameter: (a) Level 1, and
(b) Level 2.
7.3.2 Pile Wall Thickness
The effects of the pile wall thickness on the displacement ductility capacity are examined
next. For this purpose, variations of displacement ductility with pile length for three values of
pile thickness are compared in Figure 7.4. The results presented are for a pile with 91 cm
diameter and axial force equal to 0.05Afy . These results show that the displacement ductility is
essentially independent of the pile wall thickness as indicated by essentially identical curves for
the three values of pile wall thickness.
37
(a) Level 1 (b) Level 2
2 4
NLFEA: Wall Thickness
1.8 1.27 cm
Δ1,IGorPD 2.54 cm
3.81 cm1.6
1.4
Δ2,IGorPD
3
2
μ
μ
1.2
1 1
0 10 20 30 40 50 0 10 20 30 40 50
Pile Length, ft Pile Length, ft
Figure 7.4. Variation of displacement ductility capacity computed from nonlinear finite element
analysis (NLFEA) with pile length for three values of pile wall thickness: (a) Level 1, and (b)
Level 2.
7.3.3 Axial Force
Figure 7.5 presents variation of displacement ductility capacity with axial force in the pile. The
presented results are for a pile with 91 cm diameter and 15 m length with values of axial force
varying from zero to 0.2Afy . These results show that the displacement ductility for Level 1 is
essentially independent of the pile axial load (Figure 7.5(a)). For Level 2, while the displacement
ductility may depend on the axial load for very-low axial loads, it becomes essentially
independent of the axial load for more realistic values. However, the ductility for Level 2
appears to be insensitive to the axial force values, i.e., axial loads greater than 0.05Afy (Figure
7.5(b)).
(a) Level 1 (b) Level 2
2 4
1.8
Δ1,IGorPD
Δ2,IGorPD
3
1.6
1.4
2
μ
μ
1.2
1 1
0 0.05 0.1 0.15 0.2 0 0.05 0.1 0.15 0.2
Pile Axial Force/(Afy
) Pile Axial Force/(Afy
)
Figure 7.5. Variation of displacement ductility capacity computed from nonlinear finite element
analysis with pile axial load ratio: (a) Level 1, and (b) Level 2.
38
7.4 LOWER BOUND OF DISPLACEMENT DUCTILITY CAPACITY
The results presented so far indicate that the displacement ductility of hollow steel piles is
relatively insensitive to pile length, pile diameter, pile wall thickness, and pile axial load.
Therefore, the displacement ductility appears to be a very robust parameter that can be used in
simplified design of piles instead of the various axial strain limits which are currently specified
in the MOTEMS. While the displacement ductility may be related to the pile curvature ductility
using Equation (7.3), the results presented in the preceding section also indicate that a lower
bound of the member displacement ductility capacity may be estimated without any knowledge
about the section curvature ductility capacity for practical range of various parameters. The
results presented in Figure 7.6 for pile-deck hinge indicate that the displacement ductility
capacity may be limited to 1.2 for seismic design Level 1 and 2.75 for seismic design Level 2.
1
1.2
1.4
1.6
1.8
2
μ
Δ1,IGorPD
(a) Level 1
μΔ
= 1.2
Pile Dia.
61 cm
91 cm
107 cm
1
2
3
4
μΔ2,IGorPD
(b) Level 2
μΔ
= 2.75
0 10 20 30 40 50 0 10 20 30 40 50
Pile Length, m Pile Length, m
Figure 7.6. Lower-bound value of displacement ductility capacity of hollow steel piles for
seismic design (a) Level 1, and (b) Level 2.
7.5 SIMPLIFIED PROCEDURE TO COMPUTE DISPLACEMENT CAPACITY
Displacement capacity of piles at a selected design level may be estimated from
Δc = μΔΔy (7.4)
in which μΔ is the ductility capacity at a selected design level, i.e., equal to 1.2 for Level 1
design and 2.75 for Level 2 design, and Δy is the yield displacement of the pile. The yield
displacement can be computed from nonlinear pushover analysis of the pile. Alternatively, the
yield displacement may be computed based on section properties. For example, the yield
displacement of a pile that is fixed at the bottom and prevented from rotation at the top due to
39
rigid deck may be estimated from
2
Δ =
M yL
(7.5)y
6EI
and yield displacement of a cantilever may be estimated from
2
M L
Δ =
y
(7.6)y
3EI
in which M y is the effective section yield moment that can be estimated from section moment-
curvature analysis and I is the section moment of inertia that can be estimated from the section
properties, and E is the modulus of elasticity for steel.
The accuracy of the approximate procedure to estimate the displacement capacity of piles is
evaluated next. For this purpose, the approximate displacement capacity is computed first from
Equation (7.4) by utilizing the yield displacement from Equation (7.5) or (7.6) depending on the
boundary conditions. The exact displacement capacity is computed next from Equation (7.4) but
with yield displacement estimated from nonlinear the static pushover analysis of the pile. For
both cases, value of the ductility capacity obtained from the pushover analysis is used. The
approximate and exact displacement capacities are compared in Figure 7.7 for a pile with 91 cm
diameter. These results indicate that the approximate analysis provides an excellent estimate of
the displacement capacity of the pile for Level 1 as well as Level 2 design.
(a) Level 1 (b) Level 2
5 8
Exact
Approximate4
3
Δ,m1,IGorPD
Δ,m2,IGorPD
6
4
2
0 10 20 30 40 50
2
1
0 0
0 10 20 30 40 50
Pile Length, m Pile Length, m
Figure 7.7. Comparison of displacement capacities from exact and approximate analyses.
The approximate analysis is attractive because it eliminates the need for nonlinear static
analysis of the pile. However, it must be noted that the approximate analysis may only be used
40
for the soil-pile-deck system that can be idealized either by a fixed-fixed column or by a
cantilever column – the two cases for which closed form solutions to estimate yield displacement
are available (see Equations 7.5 and 7.6) – using equivalent displacement fixity concept. For
other cases, the yield displacement may have to be estimated from nonlinear static pushover
analysis of the soil-pile-deck system.
41
8. DISPLACEMENT CAPACITY OF PILES WITH DOWEL-CONNECTION
Piles are often connected to the deck using dowels. The size and number of dowel bars are
typically selected so that the moment capacity of the connection is smaller than the moment
capacity of the pile. As a result, the yielding is expected to occur in the connection rather than
the pile. The nonlinear behavior of piles with such partial-moment connection to the deck slab
may differ significantly compared to the piles with full-moment connections presented in the
previous chapters. This chapter describes two types of dowel-connections – hollow steel piles
connected to the deck by a concrete plug and dowels, and prestressed concrete piles connected to
the deck by dowels grouted into the pile and embedded in the deck concrete. Subsequently,
nonlinear behavior of such connections is examined. Finally, closed form solutions for
estimating displacement capacity of piles with partial-moment connections are presented.
8.1 DOWEL-CONNECTIONS
8.1.1 Hollow Steel Piles
Figure 8.1 shows details of the connections between a hollow steel pile and the concrete deck of
a Marine Oil or LNG Terminal. In this connection, denoted as the concrete-plug connection,
dowels are embedded in a concrete plug at the top of the pile. The concrete plug is held in place
by shear rings at its top and bottom; the shear rings would prevent the concrete plug from
slipping out (or popping-out) during lateral loads imposed by earthquakes. Others have proposed
details in which the concrete plug is held in place either by natural roughness of the inside
surface of the steel shell or use of weld-metal laid on the inside of the steel shell in a continuous
spiral in the connection region prior to placing the concrete plug (Ferritto et al., 1999). The
dowels are then embedded in the concrete deck to provide sufficient development length. A
small gap may or may not be provided between top of the pile and top of the concrete plug. This
concrete-plug connection has been shown to provide remarkable ductility capacity of hollow
steel piles (Priestley and Park, 1984; Park et al., 1987). The force transfer mechanism between
the steel pile and the concrete plug has also been investigated by Nezamian et al. (2006).
42
Steel Pipe Pile
Concrete Plug
Shear Rings
Deck
Dowel
Figure 8.1. Concrete-plug connection between hollow steel pile and concrete deck.
8.1.2 Prestressed Concrete Piles
Figure 8.2 shows details of the connections between a prestressed pile and the concrete deck of a
Marine Oil or LNG Terminal (Klusmeyer and Harn, 2004; Wray et al., 2007; Roeder et al.,
2005). Prestressed piles typically have corrugated metal sleeves that are embedded in the
concrete. These sleeves are located inside of the confined concrete core formed by the
prestressing strands and confining steel. Once the prestressed pile has been driven to the desired
depth, the dowels are grouted into the sleeves. If higher flexibility of the connection is desired, a
small portion of the dowel at the top of the pile may be wrapped in Teflon to ensure de-bonding
between the dowel and the grout. The dowels are then embedded in the concrete deck to provide
sufficient development length. Note that Figure 8.2 shows only two outermost dowels; the other
dowels are not shown to preserve clarity in the figure.
Prestressed
Concrete Pile
Deck
Dowel
De−Bonded
Dowel
Grouted
Sleeve
Figure 8.2. Dowel-connection between prestressed concrete pile and concrete deck.
43
8.1.3 Behavior of Dowel-Connection
While analyzing Marine Oil and LNG Terminal structures, nonlinear behavior of pile and
connection is typically represented by moment-rotation relationships. The moment-rotation
relationship is developed based on the assumption of a plane section remaining plane and a
perfect bond between the steel reinforcing bars and concrete. For the concrete-plug connection
between hollow steel piles and deck or the dowel-connection between a prestressed pile and
deck; however, such assumptions may not be valid. In particular, the pile in a such connection
rotates about a small area on compression side of the pile forming a gap between the top of the
pile and the deck on the tension side of the pile (see Figure 8.3). This behavior is akin to the pile
acting like a crowbar bearing on a small compression area. This behavior leads to de-bonding of
the dowel (or strain penetration) on each side of the joint. Additional de-bonding may also occur
in the dowel over the portion that is intentionally wrapped in Teflon.
Lsp
Figure 8.3. Behavior of piles with concrete-plug or dowel-connection.
8.2 MOMENT-ROTATION RELATIONSHIP OF DOWEL-CONNECTION
Bob Harn and George Sheng of Berger/ABAM Engineers Inc recently proposed a simple
analytical model for developing nonlinear moment-rotation behavior of concrete-plug
connections for hollow steel piles (see Figure 8.4) or dowel-connections for prestressed piles (see
Figure 8.5). For a selected value of the reinforcing bar yield stress, fy , concrete strength, fc
'
,
diameter and area of reinforcing bars, dbi and Asi , respectively, bearing strength of deck
concrete against pile concrete as fm
'
=1.7 fc
'
, and bearing strength of deck concrete against steel
shell of hollow steel pile as fm
'
= 5.6 fc
'
, the moment-rotation relationship is developed as
44
Seismic wharves and str

More Related Content

What's hot

A two equation VLES turbulence model with near-wall delayed behaviour
A two equation VLES turbulence model with near-wall delayed behaviourA two equation VLES turbulence model with near-wall delayed behaviour
A two equation VLES turbulence model with near-wall delayed behaviourApplied CCM Pty Ltd
 
"Reduction of uncertainties associated to the dynamic response of a ship unlo...
"Reduction of uncertainties associated to the dynamic response of a ship unlo..."Reduction of uncertainties associated to the dynamic response of a ship unlo...
"Reduction of uncertainties associated to the dynamic response of a ship unlo...TRUSS ITN
 
Modeling of turbulent flow
Modeling of turbulent flowModeling of turbulent flow
Modeling of turbulent flowTuong Do
 
"Field characterization of location-specific dynamic amplification factors to...
"Field characterization of location-specific dynamic amplification factors to..."Field characterization of location-specific dynamic amplification factors to...
"Field characterization of location-specific dynamic amplification factors to...TRUSS ITN
 
Nonlinear modelling of RC frame structures
Nonlinear modelling of RC frame structuresNonlinear modelling of RC frame structures
Nonlinear modelling of RC frame structuresFabioDiTrapani2
 
2006 Green Incorporating Pulse to Pulse Motion Effects anto Side Looking Arra...
2006 Green Incorporating Pulse to Pulse Motion Effects anto Side Looking Arra...2006 Green Incorporating Pulse to Pulse Motion Effects anto Side Looking Arra...
2006 Green Incorporating Pulse to Pulse Motion Effects anto Side Looking Arra...Justin Green
 
Modification of rmr system for indian coal mines
Modification of rmr system for indian coal minesModification of rmr system for indian coal mines
Modification of rmr system for indian coal minesTIKESHWAR MAHTO
 
М.Г.Гоман, А.В.Храмцовский (1998) - Использование методов непрерывного продол...
М.Г.Гоман, А.В.Храмцовский (1998) - Использование методов непрерывного продол...М.Г.Гоман, А.В.Храмцовский (1998) - Использование методов непрерывного продол...
М.Г.Гоман, А.В.Храмцовский (1998) - Использование методов непрерывного продол...Project KRIT
 
Non linear static pushover analysis
Non linear static pushover analysisNon linear static pushover analysis
Non linear static pushover analysisjeyanthi4
 
Closed-Form Solutions For Optimum Rotor in Hover and Climb
Closed-Form Solutions For Optimum Rotor in Hover and ClimbClosed-Form Solutions For Optimum Rotor in Hover and Climb
Closed-Form Solutions For Optimum Rotor in Hover and ClimbWilliam Luer
 
Time History Analysis With Recorded Accelerograms
Time History Analysis With Recorded AccelerogramsTime History Analysis With Recorded Accelerograms
Time History Analysis With Recorded AccelerogramsAlessandro Palmeri
 
1223989 static pushover analysis
1223989 static pushover analysis1223989 static pushover analysis
1223989 static pushover analysismansoor_yakhchalian
 
To compare different turbulence models for the simulation of the flow over NA...
To compare different turbulence models for the simulation of the flow over NA...To compare different turbulence models for the simulation of the flow over NA...
To compare different turbulence models for the simulation of the flow over NA...Kirtan Gohel
 

What's hot (19)

A two equation VLES turbulence model with near-wall delayed behaviour
A two equation VLES turbulence model with near-wall delayed behaviourA two equation VLES turbulence model with near-wall delayed behaviour
A two equation VLES turbulence model with near-wall delayed behaviour
 
"Reduction of uncertainties associated to the dynamic response of a ship unlo...
"Reduction of uncertainties associated to the dynamic response of a ship unlo..."Reduction of uncertainties associated to the dynamic response of a ship unlo...
"Reduction of uncertainties associated to the dynamic response of a ship unlo...
 
Modeling of turbulent flow
Modeling of turbulent flowModeling of turbulent flow
Modeling of turbulent flow
 
"Field characterization of location-specific dynamic amplification factors to...
"Field characterization of location-specific dynamic amplification factors to..."Field characterization of location-specific dynamic amplification factors to...
"Field characterization of location-specific dynamic amplification factors to...
 
Adaptive Sliding Mode Control of PMLSM Drive
Adaptive Sliding Mode Control of PMLSM DriveAdaptive Sliding Mode Control of PMLSM Drive
Adaptive Sliding Mode Control of PMLSM Drive
 
Nonlinear modelling of RC frame structures
Nonlinear modelling of RC frame structuresNonlinear modelling of RC frame structures
Nonlinear modelling of RC frame structures
 
83
8383
83
 
2006 Green Incorporating Pulse to Pulse Motion Effects anto Side Looking Arra...
2006 Green Incorporating Pulse to Pulse Motion Effects anto Side Looking Arra...2006 Green Incorporating Pulse to Pulse Motion Effects anto Side Looking Arra...
2006 Green Incorporating Pulse to Pulse Motion Effects anto Side Looking Arra...
 
Module 4
Module 4Module 4
Module 4
 
Modification of rmr system for indian coal mines
Modification of rmr system for indian coal minesModification of rmr system for indian coal mines
Modification of rmr system for indian coal mines
 
8 (1)
8 (1)8 (1)
8 (1)
 
М.Г.Гоман, А.В.Храмцовский (1998) - Использование методов непрерывного продол...
М.Г.Гоман, А.В.Храмцовский (1998) - Использование методов непрерывного продол...М.Г.Гоман, А.В.Храмцовский (1998) - Использование методов непрерывного продол...
М.Г.Гоман, А.В.Храмцовский (1998) - Использование методов непрерывного продол...
 
F05823843
F05823843F05823843
F05823843
 
Non linear static pushover analysis
Non linear static pushover analysisNon linear static pushover analysis
Non linear static pushover analysis
 
Closed-Form Solutions For Optimum Rotor in Hover and Climb
Closed-Form Solutions For Optimum Rotor in Hover and ClimbClosed-Form Solutions For Optimum Rotor in Hover and Climb
Closed-Form Solutions For Optimum Rotor in Hover and Climb
 
Time History Analysis With Recorded Accelerograms
Time History Analysis With Recorded AccelerogramsTime History Analysis With Recorded Accelerograms
Time History Analysis With Recorded Accelerograms
 
1223989 static pushover analysis
1223989 static pushover analysis1223989 static pushover analysis
1223989 static pushover analysis
 
To compare different turbulence models for the simulation of the flow over NA...
To compare different turbulence models for the simulation of the flow over NA...To compare different turbulence models for the simulation of the flow over NA...
To compare different turbulence models for the simulation of the flow over NA...
 
Di 00028
Di 00028Di 00028
Di 00028
 

Similar to Seismic wharves and str

PSO and SMC based Closed Loop V/F Control of AC Drive using SVPWM
PSO and SMC based Closed Loop V/F Control of AC Drive using SVPWMPSO and SMC based Closed Loop V/F Control of AC Drive using SVPWM
PSO and SMC based Closed Loop V/F Control of AC Drive using SVPWMIRJET Journal
 
Aircraft propulsion turbomachine 3 d
Aircraft propulsion   turbomachine 3 dAircraft propulsion   turbomachine 3 d
Aircraft propulsion turbomachine 3 dAnurak Atthasit
 
Multi-Fidelity Optimization of a High Speed, Foil-Assisted Catamaran for Low ...
Multi-Fidelity Optimization of a High Speed, Foil-Assisted Catamaran for Low ...Multi-Fidelity Optimization of a High Speed, Foil-Assisted Catamaran for Low ...
Multi-Fidelity Optimization of a High Speed, Foil-Assisted Catamaran for Low ...Kellen Betts
 
Aircraft Loads 5 Report
Aircraft Loads 5 ReportAircraft Loads 5 Report
Aircraft Loads 5 ReportLee Ramsay
 
Capacity Spectrum Method for RC Building with Cracked and Uncracked Section
Capacity Spectrum Method for RC Building with Cracked and Uncracked SectionCapacity Spectrum Method for RC Building with Cracked and Uncracked Section
Capacity Spectrum Method for RC Building with Cracked and Uncracked SectionIOSR Journals
 
Ee6501 psa-eee-vst-au-units-v (1)
Ee6501 psa-eee-vst-au-units-v (1)Ee6501 psa-eee-vst-au-units-v (1)
Ee6501 psa-eee-vst-au-units-v (1)Vara Prasad
 
International Refereed Journal of Engineering and Science (IRJES)
International Refereed Journal of Engineering and Science (IRJES)International Refereed Journal of Engineering and Science (IRJES)
International Refereed Journal of Engineering and Science (IRJES)irjes
 
International Refereed Journal of Engineering and Science (IRJES)
International Refereed Journal of Engineering and Science (IRJES)International Refereed Journal of Engineering and Science (IRJES)
International Refereed Journal of Engineering and Science (IRJES)irjes
 
Comparision of flow analysis through a different geometry of flowmeters using...
Comparision of flow analysis through a different geometry of flowmeters using...Comparision of flow analysis through a different geometry of flowmeters using...
Comparision of flow analysis through a different geometry of flowmeters using...eSAT Publishing House
 
Meltblowing ii-linear and nonlinear waves on viscoelastic polymer jets
Meltblowing  ii-linear and nonlinear waves on viscoelastic polymer jetsMeltblowing  ii-linear and nonlinear waves on viscoelastic polymer jets
Meltblowing ii-linear and nonlinear waves on viscoelastic polymer jetsVinod Kumar
 
Numerical Calculation of Solid-Liquid two-Phase Flow Inside a Small Sewage Pump
Numerical Calculation of Solid-Liquid two-Phase Flow Inside a Small Sewage PumpNumerical Calculation of Solid-Liquid two-Phase Flow Inside a Small Sewage Pump
Numerical Calculation of Solid-Liquid two-Phase Flow Inside a Small Sewage Pumptheijes
 
H13 TRANSIENT STABILITY EMERSON EDUARDO RODRIGUES.pdf
H13 TRANSIENT STABILITY  EMERSON EDUARDO RODRIGUES.pdfH13 TRANSIENT STABILITY  EMERSON EDUARDO RODRIGUES.pdf
H13 TRANSIENT STABILITY EMERSON EDUARDO RODRIGUES.pdfEMERSON EDUARDO RODRIGUES
 
Adaptive terminal sliding mode control strategy for dc–dc buck converters
Adaptive terminal sliding mode control strategy for dc–dc buck convertersAdaptive terminal sliding mode control strategy for dc–dc buck converters
Adaptive terminal sliding mode control strategy for dc–dc buck convertersISA Interchange
 
Adaptive terminal sliding mode control strategy for DC–DC buck converters
Adaptive terminal sliding mode control strategy for DC–DC buck convertersAdaptive terminal sliding mode control strategy for DC–DC buck converters
Adaptive terminal sliding mode control strategy for DC–DC buck convertersISA Interchange
 
Flood routing by kinematic wave model
Flood routing by kinematic wave modelFlood routing by kinematic wave model
Flood routing by kinematic wave modelIOSR Journals
 
New folderelec425_2016_hw5.pdfMar 25, 2016 ELEC 425 S.docx
New folderelec425_2016_hw5.pdfMar 25, 2016 ELEC 425 S.docxNew folderelec425_2016_hw5.pdfMar 25, 2016 ELEC 425 S.docx
New folderelec425_2016_hw5.pdfMar 25, 2016 ELEC 425 S.docxcurwenmichaela
 

Similar to Seismic wharves and str (20)

PSO and SMC based Closed Loop V/F Control of AC Drive using SVPWM
PSO and SMC based Closed Loop V/F Control of AC Drive using SVPWMPSO and SMC based Closed Loop V/F Control of AC Drive using SVPWM
PSO and SMC based Closed Loop V/F Control of AC Drive using SVPWM
 
cfd ahmed body
cfd ahmed bodycfd ahmed body
cfd ahmed body
 
Aircraft propulsion turbomachine 3 d
Aircraft propulsion   turbomachine 3 dAircraft propulsion   turbomachine 3 d
Aircraft propulsion turbomachine 3 d
 
Af03101880194
Af03101880194Af03101880194
Af03101880194
 
Multi-Fidelity Optimization of a High Speed, Foil-Assisted Catamaran for Low ...
Multi-Fidelity Optimization of a High Speed, Foil-Assisted Catamaran for Low ...Multi-Fidelity Optimization of a High Speed, Foil-Assisted Catamaran for Low ...
Multi-Fidelity Optimization of a High Speed, Foil-Assisted Catamaran for Low ...
 
Aircraft Loads 5 Report
Aircraft Loads 5 ReportAircraft Loads 5 Report
Aircraft Loads 5 Report
 
C012131116
C012131116C012131116
C012131116
 
Capacity Spectrum Method for RC Building with Cracked and Uncracked Section
Capacity Spectrum Method for RC Building with Cracked and Uncracked SectionCapacity Spectrum Method for RC Building with Cracked and Uncracked Section
Capacity Spectrum Method for RC Building with Cracked and Uncracked Section
 
Ee6501 psa-eee-vst-au-units-v (1)
Ee6501 psa-eee-vst-au-units-v (1)Ee6501 psa-eee-vst-au-units-v (1)
Ee6501 psa-eee-vst-au-units-v (1)
 
International Refereed Journal of Engineering and Science (IRJES)
International Refereed Journal of Engineering and Science (IRJES)International Refereed Journal of Engineering and Science (IRJES)
International Refereed Journal of Engineering and Science (IRJES)
 
International Refereed Journal of Engineering and Science (IRJES)
International Refereed Journal of Engineering and Science (IRJES)International Refereed Journal of Engineering and Science (IRJES)
International Refereed Journal of Engineering and Science (IRJES)
 
Comparision of flow analysis through a different geometry of flowmeters using...
Comparision of flow analysis through a different geometry of flowmeters using...Comparision of flow analysis through a different geometry of flowmeters using...
Comparision of flow analysis through a different geometry of flowmeters using...
 
Meltblowing ii-linear and nonlinear waves on viscoelastic polymer jets
Meltblowing  ii-linear and nonlinear waves on viscoelastic polymer jetsMeltblowing  ii-linear and nonlinear waves on viscoelastic polymer jets
Meltblowing ii-linear and nonlinear waves on viscoelastic polymer jets
 
Numerical Calculation of Solid-Liquid two-Phase Flow Inside a Small Sewage Pump
Numerical Calculation of Solid-Liquid two-Phase Flow Inside a Small Sewage PumpNumerical Calculation of Solid-Liquid two-Phase Flow Inside a Small Sewage Pump
Numerical Calculation of Solid-Liquid two-Phase Flow Inside a Small Sewage Pump
 
H13 TRANSIENT STABILITY EMERSON EDUARDO RODRIGUES.pdf
H13 TRANSIENT STABILITY  EMERSON EDUARDO RODRIGUES.pdfH13 TRANSIENT STABILITY  EMERSON EDUARDO RODRIGUES.pdf
H13 TRANSIENT STABILITY EMERSON EDUARDO RODRIGUES.pdf
 
Adaptive terminal sliding mode control strategy for dc–dc buck converters
Adaptive terminal sliding mode control strategy for dc–dc buck convertersAdaptive terminal sliding mode control strategy for dc–dc buck converters
Adaptive terminal sliding mode control strategy for dc–dc buck converters
 
Adaptive terminal sliding mode control strategy for DC–DC buck converters
Adaptive terminal sliding mode control strategy for DC–DC buck convertersAdaptive terminal sliding mode control strategy for DC–DC buck converters
Adaptive terminal sliding mode control strategy for DC–DC buck converters
 
dighe (3)
dighe (3)dighe (3)
dighe (3)
 
Flood routing by kinematic wave model
Flood routing by kinematic wave modelFlood routing by kinematic wave model
Flood routing by kinematic wave model
 
New folderelec425_2016_hw5.pdfMar 25, 2016 ELEC 425 S.docx
New folderelec425_2016_hw5.pdfMar 25, 2016 ELEC 425 S.docxNew folderelec425_2016_hw5.pdfMar 25, 2016 ELEC 425 S.docx
New folderelec425_2016_hw5.pdfMar 25, 2016 ELEC 425 S.docx
 

Seismic wharves and str

  • 1. SIMPLIFIED PROCEDURES FOR SEISMIC ANALYSIS AND DESIGN OF PIERS AND WHARVES IN MARINE OIL AND LNG TERMINALS by Rakesh K. Goel California Polytechnic State University, San Luis Obispo Research Conducted for the California State Lands Commission Contract No. C2005-051 and Department of the Navy, Office of Naval Research Award No. N00014-08-1-1209 Department of Civil and Environmental Engineering California Polytechnic State University, San Luis Obispo, CA 93407 June 2010 Report No. CP/SEAM-08/01
  • 2. EXECUTIVE SUMMARY This investigation developed simplified procedures for the seismic analysis and design of pile supported wharves and piers in Marine Oil and LNG Terminals. A simplified coefficient-based approach is proposed for estimating seismic displacement demand for regular structures. This approach is adopted from the performance-based analysis procedure recently approved for buildings in the ASCE/SEI 41-06 standard (ASCE, 2007). A modal pushover analysis (MPA) approach is proposed for irregular structures. The MPA procedure accounts for the higher-mode effects that are important in irregular structures (Chopra and Goel, 2004). The acceptability of piles in terms of displacement ductility limitation, instead of the material strain limitation, is proposed. For this purpose, simplified expressions for estimating displacement ductility capacity of piles are recommended. These expressions are calibrated such that the material strain limits in Title 24, California Code of Regulations, Chapter 31F, informally known as the Marine Oil Terminal Engineering and Maintenance Standards (MOTEMS), would not be exceeded if the displacement ductility demand is kept below the proposed displacement ductility capacity. These simplified procedures can be used as an alternative to the procedures currently specified in the MOTEMS. The simplified procedures can be used for preliminary design or as a quick check on the results from detailed nonlinear analyses. The more sophisticated analysis methodology can still be used for final design. The following is a summary of the procedures to estimate displacement demands and capacities for pile-supported wharves and piers. DISPLACEMENT DEMAND Regular Structures It is proposed that the seismic displacement demand in a regular structure (MOTEMS 2007) be estimated from T 2 Δ =d C C S1 2 A 2 (1) 4π in which SA is the spectral acceleration of the linear-elastic system at vibration period, T . The coefficient C1 is given by i
  • 3. ⎧ ⎪1.0; T >1.0s ⎪ ⎪ R −1 C1 = ⎨1.0 + 2 ; 0.2s<T ≤1.0s (2) aT⎪ ⎪ R −1 1.0 + ; T ≤ 0.2s⎪⎩ 0.04a in which a is a site dependent constant equal to 130 for Site Class A and B, 90 for Site Class C, and 60 for Site Class D, E, and F (definition of Site Class is available in ASCE/SEI 41-06 standard), and R is the ratio of the elastic and yield strength of the system and is defined as S W R = A (3) g Vy where W is the seismic weight of the system, Vy is the yield force (or base shear) of the system, and g is the acceleration due to gravity. The coefficient C2 is given by ⎧1.0; T > 0.7s C2 = ⎪ ⎨ 1 ⎛ R −1⎞ 2 (4) 1+ ; T ≤ 0.7s⎪ ⎜ ⎟ ⎩ 800 ⎝ T ⎠ Use of Equation (1) to compute the displacement demand should be restricted to systems with R ≤ R where R is given bymax max −t Δd αe (5) Δy 4 Rmax = + in which Δd is the smaller of the computed displacement demand, Δd , from Equation (1) or the displacement corresponding to the maximum strength in the pushover curve, Δy is the yield displacement of the idealized bilinear force-deformation curve, t is a constant computed from t 1 0.15ln(T )= + (6) and αe is the effective post-elastic stiffness ratio computed from α α + (7)e = P−Δ λ α α( 2 − P−Δ ) where λ is a near-field effect factor equal to 0.8 for sites that are subjected to near-field effects ii
  • 4. and 0.2 for sites that are not subjected to near field effects. The near field effects may be considered to exist if the 1 second spectral value, S1 , at the site for the maximum considered earthquake is equal to or exceeds 0.6g. The P-Delta stiffness ratio,αP−Δ , and the maximum negative post-elastic stiffness ratio, α2 , in Equation (7) are estimated from the idealized force- deformation curve. Irregular Structures A modal pushover analysis (MPA) procedure is proposed to estimate displacement demands in irregular Marine Oil and LNG Terminal structures (MOTEMS 2007). The following is a step-by- step summary of the MPA procedure: 1. Compute the natural frequencies, ωn and modes, φn , for linearly elastic vibration of the irregular Marine Oil and LNG Terminal structure. 2. Select a reference point where the displacement, urn , is to be monitored in the selected direction of analysis during the pushover analysis. Ideally, this reference point should be the location on the structure with largest value of φrn in the selected direction of analysis. 3. For the nth-mode, develop the pushover curve, V −u , for the nth modal force distribution,bn rn s* = Mφ , where M is the mass matrix of the structure, and φ is the nth mode shape. Then n n base shear Vbn should be monitored in the same direction as the direction of the selected reference point displacement urn . 4. Convert the V −u pushover curve to the force-displacement, F Ln − Dn , relation for thebn rn sn nth -“mode” inelastic SDF system by utilizing F Ln =Vbn M* and D = u Γnφrn in whichsn n n rn φrn is the value of φn at the reference point in the direction under consideration, * T T T T Mn = (φn Mι) 2 φn Mφn is the effective modal mass, and Γ =n φn Mι φn Mφn with ι equal to the influence vector. The influence vector ι is a vector of size equal to the total number of degrees of freedom. For analysis in the x-direction, the components of ι corresponding to x- degree-of-freedom are equal to one and remaining components equal to zero. Similarly the iii
  • 5. components of ι corresponding to y-degree-of-freedom are equal to one and remaining components equal to zero for analysis in the y-direction. 5. Idealize the force-displacement, F Ln − Dn , curve as a bilinear curve and compute the yieldsn value Fsny Ln . 6. Compute the yield strength reduction factor, R = SA (F Ln ).sny 7. Compute the peak deformation Dn = Δd of the nth-“mode” inelastic SDF system defined by the force-deformation relation developed in Step 4 and damping ratio ζn , from Equation (1). The elastic vibration period of the system is based on the effective slope of the snF Ln − Dn 1/2 curve, which for a bilinear curve is given by T = 2π L Dn ( n ny Fsny ) . 8. Calculate peak reference point displacement urn associated with the nth-“mode” inelastic SDF system from u = Γ φ D .rn n rn n 9. Push the structure to the reference point displacement equal to urn and note the values of desired displacement δno . 10. Repeat Steps 3 to 9 for all significant modes identified. 11. Combine the peak modal displacement, δno , by an appropriate modal combination rule, e.g., CQC, to obtain the peak dynamic response, Δo . DISPLACEMENT CAPACITY It is proposed that the displacement capacity of piles in Marine Oil and LNG Terminals be estimated from Δc = μΔΔy (8) where Δy is the yield displacement of the pile and μΔ is the displacement ductility capacity of the pile. Following are the recommendations that have been developed for the yield displacement and displacement ductility of piles commonly used in Marine Oil and LNG Terminals. These recommendations have been developed to ensure that the material strains in the pile at its iv
  • 6. displacement capacity remain within the limits specified in the MOTEMS (2007). The procedure to estimate the displacement capacity is intended to be a simplified procedure for either initial design of piles or for checking results from more complex nonlinear finite element analysis. The recommendations presented in this report are limited to: (1) piles with long freestanding heights (length/diameter > 20) above the mud line; (2) piles with transverse volumetric ratio greater than 0.5%; and (3) piles in which the displacement demand has been estimated utilizing equivalent-fixity approximation. Results from this investigation should be used with caution for parameters or cases outside of those described above. Piles with Full-Moment- or Pin-Connection to the Deck Slab The recommended values of displacement ductility capacity of piles with full-moment- connection or pin-connection to the deck slab are Design Earthquake Level Hinge Location Reinforced- Concrete Piles Hollow-Steel Piles Level 1 In-Ground 1.75 1.2 Pile-Deck 1.75 1.2 Level 2 In-Ground 2.5 2.75 Pile-Deck 5.0 2.75 The yield displacement of the pile may be estimated either from idealized pushover curve developed from the nonlinear static pushover analysis or may be estimated from ⎧M L2 y ⎪ for full-moment-connection 6EI⎪ e Δ = ⎨ (9)y ⎪ y 2 M L for pin-connection⎪ 3EI⎩ e in which M y is the section yield moment and EIe is the effective value of EI that can be estimated from the section moment-curvature analysis. Note that M y is not the section moment at first-yield but the effective yield moment estimated from bilinear idealization of the moment- curvature relationship. v
  • 7. Piles with Dowel-Connection to the Deck Slab Simplified formulas are proposed for estimating displacement ductility capacity of piles with dowel-connection, such as hollow-steel piles or prestressed concrete piles connected to the deck slab with dowels. The following is a step-by-step summary of the procedure to implement these formulas to estimate displacement capacity of such piles: 1. Establish the axial load, P , on the pile. 2. Estimate the pile length based on equivalent-fixity assumption. 3. Select an appropriate design level – Level 1 or Level 2 – and establish various strain limits for the selected design level. 4. Develop the moment-rotation relationship of the dowel-connection using the procedure described in Chapter 8 of this report. 5. Determine rotational stiffness, kθ , yield moment, M y,C , and yield rotation, θy,C of the dowel-connection from the moment-rotation relationship developed in Step 4. 6. Establish the rotation of the dowel-connection, θL , and corresponding ductility, μ =θ θy,C , when strain in the outer-most dowel of the connection reaches the strain limitθ L established in Step 3 for the selected design level. 7. Conduct the moment-curvature analysis of the pile section with appropriate axial load and idealize the moment-curvature relationship by a bi-linear curve. 8. Compute the effective, EIe , and effective yield moment, My,P , from the pile moment- curvature relationship. Note that EIe is equal to initial elastic slope and My,P is the yield value of the moment of the idealized bi-linear moment-curvature relationship. For steel piles, EIe may be computed from section properties and material modulus, and My,P may be approximated as M fy (d3 − di 3 ) 6 .y,P o 9. Estimate the yield curvature, φy,P = M y,P EIe . vi
  • 8. 10. Establish the curvature of the steel pile, φL , and corresponding curvature ductility, μ = φ φy,P , when material strain in the pile section reaches the strain limit established inφ L Step 3 for the selected design level. 11. Select the value of ρ which defines the length of the plastic hinge as a fraction of the “effective” length of the pile. The recommended value for hollow-steel piles with dowel- connection is ρ = 0.03 for Level 1 design and ρ = 0.075 for Level 2; and for prestressed concrete pile with dowel-connection for both design levels is ρ = 0.05. 12. Compute the dimensionless parameters: η = M y,P M y,C , and β = EIe k L .θ 13. Compute the normalized value of the plastic hinge length: L* P = (ρη) (1+η). 14. Compute the yield displacement which corresponds to first effective yielding in the connection as: Δ =θ L(1 4β ) 6β+y,C y,C 15. Compute the displacement ductility for yielding in the connection as Δ = +( βμθ ) (1 4β ) if μθ computed in Step 6 is less than or equal to ( )−μ 1 4 + η 1 2β otherwise μ = (2 η β θΔ − + 6 μ ) (1+ 4β ). 16. Compute displacement ductility for yielding in the pile as 1 4 ) ( )η * p ( * pμΔ = (2η −1) ( + β + 6 L 1− L 2)(μφ −1) ( + β )1 4 17. Establish the displacement ductility capacity as lower of the values computed in Steps 15 and 16. 18. Compute the displacement capacity of the pile as product of the yield displacement computed in Step14 and the displacement ductility capacity computed in Step 17. The recommended value of displacement ductility for piles with full-moment-connection or the simplified formulas for piles with dowel-connection have been shown to provide results that are “accurate” enough for most practical applications. However, it may be useful to verify these recommendations from experimental studies. vii
  • 9. ACKNOWLEDGMENTS This research investigation is supported by the California State Lands Commission (CSLC) under Contract No. C2005-051 for Development of LNGTEMS/MOTEMS Performance-Based Seismic Criteria. This support is gratefully acknowledged. The author would especially like to thank Martin Eskijian, CSLC Project Manager and Hosny Hakim of the CSLC for their continuing support. The author would also like to acknowledge advice from following individuals: Gayle Johnson and Bill Bruin of Halcrow; Bob Harn of Berger/ABAM Engineers Inc.; Dr. Omar Jeradat of Moffatt Nichol; Peter Yin of Port of Los Angeles; Eduardo Miranda of Stanford University; and Dr. Hassan Sedarat and Tom Ballard of SC Solutions Inc. Finally, the author would like to acknowledge the editorial support provided by John Freckman of the CSLC. Additional support for this research is provided by a grant entitled C3RP Building Relationships 2008/2010” from the Department of the Navy, Office of Naval Research under award No. N00014-08-1-1209. This support is also acknowledged. viii
  • 10. CONTENTS EXECUTIVE SUMMARY ............................................................................................................. i DISPLACEMENT DEMAND..................................................................................................... i Regular Structures.................................................................................................................... i Irregular Structures ................................................................................................................iii DISPLACEMENT CAPACITY................................................................................................ iv Piles with Full-Moment- or Pin-Connection to the Deck Slab............................................... v Piles with Dowel-Connection to the Deck Slab..................................................................... vi ACKNOWLEDGMENTS ...........................................................................................................viii CONTENTS................................................................................................................................... ix 1. INTRODUCTION ...................................................................................................................... 1 2. ESTIMATION OF DISPLACEMENT DEMANDS.................................................................. 4 2.1 REGULAR STRUCTURES................................................................................................. 4 2.1.1 Current MOTEMS Procedure................................................................................. 4 2.1.2 Procedures to Compute Response of Single-Degree-of-Freedom (SDF) Systems ........ 5 2.1.3 Proposed Alternate Displacement Demand Procedure for Regular Structures ............. 9 2.2 IRREGULAR STRUCTURES........................................................................................... 11 2.2.1 Current MOTEMS Procedure...................................................................................... 11 2.2.2 Proposed Nonlinear Static Procedure for Irregular Structures .................................... 12 3. simplifying assumption............................................................................................................. 14 4. MOTEMS PROCEDURE FOR CAPACITY EVALUATION OF PILES.............................. 17 5. SIMPLIFIED PROCEDURE TO COMPUTE PILE DISPLACEMENT CAPACITY ........... 21 6. DISPLACEMENT CAPACITY OF REINFORCED CONCRETE PILES............................. 23 6.1 THEORETICAL BACKGROUND.................................................................................... 23 6.2 EVALUATION OF SIMPLIFIED EQUATIONS FOR DUCTILITY CAPACITY ......... 24 6.3 SENSITIVITY OF DISPLACEMENT DUCTILITY TO PILE PARAMETERS............. 26 6.3.1 Pile Length and Pile Diameter..................................................................................... 26 6.3.2 Longitudinal and Transverse Reinforcement Ratio..................................................... 28 6.3.3 Axial Force................................................................................................................... 29 6.4 LOWER BOUND OF DISPLACEMENT DUCTILITY CAPACITY .............................. 29 6.5 SIMPLIFIED PROCEDURE TO COMPUTE DISPLACEMENT CAPACITY............... 31 7. DISPLACEMENT CAPACITY OF HOLLOW STEEL PILES.............................................. 33 7.1 THEORETICAL BACKGROUND.................................................................................... 33 7.2 EVALUATION OF SIMPLIFIED EQUATIONS FOR DUCTILITY CAPACITY ......... 34 7.3 SENSITIVITY OF DISPLACEMENT DUCTILITY TO PILE PARAMETERS............. 36 7.3.1 Pile Length and Pile Diameter..................................................................................... 36 7.3.2 Pile Wall Thickness ..................................................................................................... 37 7.3.3 Axial Force................................................................................................................... 38 7.4 LOWER BOUND OF DISPLACEMENT DUCTILITY CAPACITY .............................. 39 7.5 SIMPLIFIED PROCEDURE TO COMPUTE DISPLACEMENT CAPACITY............... 39 8. DISPLACEMENT CAPACITY OF PILES WITH DOWEL-CONNECTION....................... 42 ix
  • 11. 8.1 DOWEL-CONNECTIONS................................................................................................. 42 8.1.1 Hollow Steel Piles........................................................................................................ 42 8.1.2 Prestressed Concrete Piles ........................................................................................... 43 8.1.3 Behavior of Dowel-Connection................................................................................... 44 8.2 MOMENT-ROTATION RELATIONSHIP OF DOWEL-CONNECTION ...................... 44 9. SIMPLIFIED MODEL OF PILE WITH DOWEL-CONNECTION........................................ 49 9.1 IDEALIZED CONNECTION AND PILE BEHAVIOR.................................................... 49 9.1.1 Moment-Rotation Behavior of Connection ................................................................. 49 9.1.2 Moment-Curvature Behavior of Pile Section .............................................................. 50 9.1.3 Force-Deformation Relationship of Pile with Dowel-Connection .............................. 51 9.2 FORCE-DEFORMATION RESPONSE OF PILE WITH DOWEL-CONNECTION ...... 52 9.2.1 Response at First Yielding in Connection ................................................................... 52 9.2.2 Response at First Yielding in Pile................................................................................ 54 9.3 DISPLACEMENT DUCTILITY CAPACITY OF PILE ................................................... 55 9.3.1 Strain Limits in the Connection................................................................................... 56 9.3.2 Strain Limits in the Pile ............................................................................................... 58 9.4 STEP-BY-STEP SUMMARY............................................................................................ 59 10. DUCTILITY CAPACITY OF HOLLOW STEEL PILES WITH DOWEL-CONNECTION62 11. DUCTILITY CAPACITY OF PRESTRESSED CONCRETE PILES WITH DOWEL- CONNECTION............................................................................................................................. 67 12. RECOMMENDATIONS........................................................................................................ 72 12.1 DISPLACEMENT DEMAND ......................................................................................... 72 12.1.1 Regular Structures...................................................................................................... 72 12.1.2 Irregular Structures .................................................................................................... 73 12.2 DISPLACEMENT CAPACITY....................................................................................... 75 12.2.1 Piles with Full-Moment- or Pin-Connection to the Deck Slab.................................. 75 12.2.2 Piles with Dowel-Connection to the Deck Slab......................................................... 76 12.3 RECOMMENDATIONS FOR FUTURE WORK ........................................................... 78 REFERENCES ............................................................................................................................. 79 x
  • 12. 1. INTRODUCTION Seismic design of marine oil terminals in California is governed by 2007 Title 24 California Code of Regulations (CCR), Part 2, California Building Code, Chapter 31F (Marine Oil Terminals). These regulations are commonly known as the “Marine Oil Terminal Engineering and Maintenance Standard” (MOTEMS). The MOTEMS describe the acceptable methods of seismic analysis and provide the specific performance criteria for two levels of earthquake motions to be used in the seismic assessment. The return period of the design earthquake for each level depends on the risk level, which is a function of the oil susceptible to spillage at any given time. For example, Level 1 and Level 2 design earthquakes for high risk terminals correspond to return periods of 72 and 475 years, respectively. The performance goal for Level 1 earthquake is no or minor damage without interruption in service or with minor temporary interruption in service. The performance goal for Level 2 earthquake is controlled inelastic behavior with repairable damage resulting in temporary closure of service, restorable within months and the prevention of a major oil spill (24 CCR 3104F.2.1). This is the formal short form of the above cited regulation and specifies a particular section (24 CCR 3104F.2.1) of the California Code of Regulations. It will be used throughout this document along with the informal “MOTEMS” abbreviation. The MOTEMS is currently being used for new construction in the Ports of Los Angeles and Long Beach. In addition, the MOTEMS has been referenced in the FEMA 450 document (BSSC, 2003). The MOTEMS has also become the approved methodology for the seismic assessment of US military wharf/pier facilities in high seismic areas (Department of Defense, 2005). As with marine oil terminals, LNG receiving terminals are considered liquid hydrocarbons reception terminals by the California State Lands Commission (CSLC), and as such fall under the Lempert-Keen-Seastrand Oil Spill and Response Act of 1990. The “Act” states that the “commission (CSLC) shall adopt rules, regulations, guidelines…, performance standards… for all existing and proposed marine terminals within the state…”. It is through this “Act” that the CSLC is developing standards for LNG terminals, and in this case mutually applicable to oil terminals. The effort described in this report is through funding obtained by the CSLC for development of standards for LNG terminals. 1
  • 13. The MOTEMS seismic analysis requires that the seismic displacement demand in marine oil terminal structures be determined using nonlinear static procedures except for irregular structures (24 CCR 3104F.1.4) with high or moderate seismic risk classification (see 24 CCR 3104F2.3.2 ). A linear modal procedure is required for irregular structures with high or moderate seismic risk classification. The analysis method specified in the MOTEMS is based on the concept of equivalent linearization presented by Priestley et al. (1996). The seismic design (or acceptability criteria) involves making sure that the material strains at the seismic displacement demand not exceed certain prescribed values. The primary objective of this investigation is to develop simplified analysis and design procedures for pile supported wharves and piers for Marine Oil and LNG Terminals. For this purpose, a simplified coefficient-based approach is proposed for estimating seismic displacement demand for regular structures. This approach is adopted from the performance-based analysis procedure recently approved for buildings in the ASCE/SEI 41-06 standard (ASCE, 2007). A modal pushover analysis (MPA) approach is proposed for irregular structures. The MPA procedure accounts for the higher-mode effects that are important in irregular structures (Chopra and Goel, 2004). The acceptability of piles in terms of displacement ductility limitation, instead of the material strain limitations, is proposed. For this purpose, simplified expressions for estimating displacement ductility capacity of piles are recommended. These expressions are calibrated such that the material strain limits in the MOTEMS would not be exceeded if the displacement ductility demand is kept below the proposed displacement ductility capacity. These simplified procedures can be used as an alternative to the procedures currently specified in the MOTEMS. This report is organized as follows: Chapter 2 presents the development of a simplified procedure for estimating seismic displacement demand in regular and irregular structures. Chapter 3 describes the equivalent fixity model utilized in developing the simplified seismic acceptability criteria. Chapter 4 summarizes the approach in the current MOTEMS for seismic evaluation of piles. 2
  • 14. Chapter 5 presents the proposed approach to estimate the displacement ductility capacity of piles. Chapters 6 and 7 present development and evaluation of simplified expressions for the displacement ductility capacity of reinforced concrete and hollow steel piles, respectively, with full-moment connection to the concrete deck. Chapter 8 discusses the behavior of partial-moment connections of hollow steel and prestressed concrete piles to the concrete deck. Chapter 9 presents the theoretical development of simplified expressions for estimating displacement ductility demands in piles with partial-moment connections. Chapters 10 and 11 evaluate these simplified expressions for hollow steel and prestressed concrete piles, respectively. 3
  • 15. 2. ESTIMATION OF DISPLACEMENT DEMANDS The MOTEMS requires that the seismic displacement demand in marine oil terminal structures be determined using nonlinear static procedures except for irregular structures with high or moderate seismic risk classification (MOTEMS, 2007: Section 3104F2.3.2). A linear modal procedure is required for irregular structures with high or moderate seismic risk classification. 2.1 REGULAR STRUCTURES 2.1.1 Current MOTEMS Procedure The MOTEMS (2007) specifies that the displacement demand, Δd , be computed from T 2 Δ = S (2.1)d A 2 4π in which SA is the spectral response acceleration corresponding to the vibration period T of the structure, with a 5% damping ratio. The spectral acceleration, SA , is computed from United States Geological Survey (USGS) maps, or from site-specific probabilistic seismic hazard analysis (PSHA). Equation (2.1) assumes that the deformation demand in a system that is deformed beyond the linear elastic limit is equal to that in a linear-elastic system. It is well known that for short period systems, this equal displacement rule may not apply; deformation of a nonlinear system may be larger than that of a linear system. For such systems, nonlinearity in the force- deformation relationship must be considered to compute the displacement demand. Therefore, the MOTEMS requires that a refined analysis be used to calculate the displacement demand if the vibration period of the structure T is less than period To which corresponds to the period at which constant acceleration and constant velocity regions of the design spectrum intersect. The refined analysis (MOTEMS, 2007: Section 3104F.2.3.2.5) utilizes the nonlinear force-deformation behavior of the structure developed from nonlinear static pushover analysis and is based on the concept of equivalent linearization presented by Priestley et al. (1996). 4
  • 16. 2.1.2 Procedures to Compute Response of Single-Degree-of-Freedom (SDF) Systems An alternative approach to the equivalent linearization method is the coefficient method in which the deformation of the inelastic SDF system is computed by multiplying the displacement of the elastic SDF system by a coefficient as follows: Δ = C Δ (2.2)i R e where Δe is the deformation of the elastic SDF system, Δi is the deformation of the inelastic SDF system, and CR is the coefficient that converts displacement of the elastic SDF system to displacement of the inelastic SDF system. Several alternative definitions of the coefficient CR are available. The following is a brief review of the ones which are commonly used. Δ A Δ e Ae Δ y Ay Δ i R Figure 2.1. Force-deformation properties of an inelastic and elastic SDF system. Figure 2.1 shows a nonlinear inelastic SDF system with a bilinear force-deformation relationship. The yield strength (or capacity) of the system is Vy and its yield displacement is Δy . The yield strength Vy is related to the pseudo-acceleration (or spectral acceleration) at yield level, A , and the seismic weight, W , as V = A W . If the system were to remain elastic, they y y design force would be V = AW with A being the spectral acceleration of the elastic SDFe e e system. The yield strength reduction factor, R , is defined as the ratio of the elastic level force and the yield strength of the inelastic SDF system. Thus R is given as Ve Ae R = = (2.3) Vy Ay 5
  • 17. Note that the yield strength reduction factor, R , differs from the response modification coefficient, R , generally used in the force-based design procedures of building [for example see ASCE/SEI 7-05 (ASCE, 2005)]: the yield strength reduction factor in Equation (2.3) considers the effects of system ductility alone whereas the response modification factor in force-based design accounts for other factors, such as type and past performance of lateral load resisting systems, over strength, etc., in addition to the system ductility. The coefficient CR is generally defined as a function of vibration period, T , yield reduction factor, R , and a few other factors. Nassar and Krawinkler (1991) defined CR as 1 ⎡ 1 c ⎤ C = 1+ ( )R −1 (2.4)R ⎢ ⎥R ⎣ c ⎦ where the constant c is defined by T a b c = + (2.5) 1+T a T with constants a =1 and b = 0.42 for α = 0% , a =1 and b = 0.37 for α = 2% , and a = 0.8 and b = 0.29 for α =10% . The parameter α is defined as the ratio of the post-yield stiffness and initial elastic stiffness expressed as a percentage value. Ruiz-Garcia and Miranda (2003) defined the CR as ⎡ ⎤ =1+ 1 + 1 ⎥( )−1C ⎢ R (2.6)R ⎣ ( ) c⎥⎢a T Ts b ⎦ with Ts being the site characteristic period selected as 0.75 for site B, 0.85 for site C, and 1.05 for site D; and constants a = 50 , b =1.8, and c = 55 . Chopra and Chintanapakdee (2004) defined CR as ⎡ d −1 ⎤−1 ⎛ a ⎛ ⎞ C = +1 ⎢( )R − + ⎜ b c ⎞ ⎠ T T ⎥ (2.8)R L 1 + ⎟⎜ ⎟ ⎢ ⎝ R ⎝ ⎠s ⎥⎣ ⎦ in which 1 ⎛ R −1⎞ LR = ⎜1+ ⎟ (2.9) R ⎝ α ⎠ 6
  • 18. Ts is the period corresponding to the transition between constant pseudo-acceleration and constant pseudo-velocity regions of the design spectrum, a = 61, b = 2.4 , c =1.5 , and d = 2.4 . The CR is also defined in several building design guidelines. For example, FEMA-356 (ASCE, 2000), defines CR as C C C (2.10)= CR 1 2 3 where C1 is the modification factor to relate a maximum displacement of nonlinear elastic- perfectly-plastic SDF system to displacement of elastic SDF system given by 1.0; for ≥ s⎧ T T ⎪ C1 = ⎨ 1 ⎛ 1 Ts (2.11)⎞⎛ ⎞ + 1− ≤1.5; for T T⎜ ⎟⎜ ⎟ s ⎩R R T⎝ ⎠ ⎪ ⎝ ⎠ C2 is the modification factor to represent effects of pinched hysteretic shape, stiffness degradation, and strength deterioration (Table 2.1), and C3 is the modification factor to represent P-Delta effects given by ( ) 3/2 α R −1 3 1 (2.12)C = + T Table 2.1. Values of modification factor C2 in FEMA-356 (ASCE 2000). Structural Performance Level T 0.1 s≤ sT T≥ Framing Type 1 Framing Type 2 Framing Type 1 Framing Type 2 Immediate Occupancy 1.0 1.0 1.0 1.0 Life safety 1.3 1.0 1.1 1.0 Collapse Prevention 1.5 1.0 1.2 1.0 The coefficients in FEMA-356 were re-examined and an improved version was proposed in FEMA-440 (ATC, 2005). This proposal has also been adopted in ASCE/SEI 41-06 standard (ASCE, 2007). The CR in FEMA-440 and ASCE/SEI 41-06 is defined as C C= C (2.13)R 1 2 where C1 is the modification factor to relate maximum displacement of a nonlinear elastic- perfectly-plastic SDF system to displacement of an elastic SDF system defined by 7
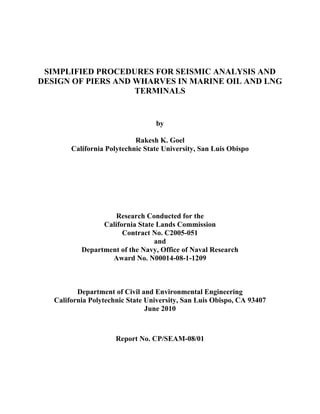
  • 19. ⎧ ⎪1.0; T 1.0s ⎪ ⎪ R −1 C1 = ⎨1.0 + 2 ; 0.2sT ≤1.0s (2.14) aT⎪ ⎪ R −1 1.0 + ; T ≤ 0.2s⎪⎩ 0.04a with a = 130 for Site Class B, 90 for Site Class C, and 60 for Site Class D. and C2 is the modification factor to represent effects of cyclic degradation in stiffness and strength given by ⎧1.0; T 0.7s ⎪ C2 = ⎨ 1 ⎛ R −1⎞ 2 (2.15) ⎪1+ ; T ≤ 0.7s⎜ ⎟ ⎩ 800 ⎝ T ⎠ Base Shear Displacement, ΔΔ d Vd Δ y Vy 0.6V y Ke α1 Ke α2 Ke αP−Δ Ke α e K e Figure 2.2. Idealized force-deformation curve for nonlinear static analysis. The provisions of FEMA-440 and ASCE/SEI 41-06 can be used provided that R does not exceed the limiting value given by −h Δd αe Rmax = + ( ); h =1.0 + 0.15ln T (2.16) Δy 4 in which Δd is the deformation corresponding to peak strength, Δy is the yield deformation, and α is the effective negative post-yield slope given bye α = α + λ α α− (2.17)e P−Δ ( 2 P−Δ ) where α2 is the negative post-yield slope ratio defined in Figure 2.2, αP−Δ is the negative slope 8
  • 20. 0 0.5 1 1.5 2 2.5 3 0 1 2 3 4 5 C R Ruiz−Garcia−Miranda Krawinkler−Nassar Chopra−Chintanapakdee FEMA−356 FEMA−440,ASCE/SEI41−06 FEMA−450 ratio caused by P − Δ effects, and λ is the near-field effect factor given as 0.8 for S ≥ 0.6 and1 0.2 for S1 0.6 ( S1 is defined as the 1-second spectral acceleration for the Maximum Considered Earthquake). The α2 slope includes P − Δ effects, in-cycle degradation, and cyclic degradation. Finally, FEMA-450 (BSSC, 2003) defines CR as ⎧ 1.0; for T Ts R ⎪ 1 ⎡ (R T− ) s ⎤ (2.18)C = ⎨ 1 1+ ; for T T⎪ ⎢ ⎥ ≤ s R T⎩ ⎣ ⎦ Period, T (s) Figure 2.3. Comparison of CR from various recommendations. Results are for R = 3 and site class B. Figure 2.3 compares the CR values from the aforementioned recommendations. This comparison indicates that all recommendations lead to essentially identical values of CR for periods longer than 1 sec. The values due to FEMA-356 and FEMA-450 differ significantly from those due to the remaining recommendations primarily for periods shorter than 0.5 sec. 2.1.3 Proposed Alternate Displacement Demand Procedure for Regular Structures Presented here is an alternative procedure for estimating the seismic displacement demand of regular structures with period T less than period To that can be idealized as a single-degree-of- freedom (SDF) system. This procedure utilizes the nonlinear force-deformation behavior of the structure developed from nonlinear static pushover analysis. The computation of the 9
  • 21. displacement demand is adopted from the procedure recommended in the FEMA-440 document (ATC, 2005) and ASCE/SEI 41-06 standard (ASCE 2007). Although this procedure has been described previously in Section 2.1.2, it is re-organized here to be compatible with the current MOTEMS procedure. The proposed alternative procedure involves estimating the displacement demand in a nonlinear SDF system from T 2 Δ = C C S (2.19)d 1 2 A 2 4π in which C1 and C2 are the coefficients that convert displacement demand of a linear-elastic SDF system to displacement demand of nonlinear SDF system. The coefficient C1 is given by ⎧ ⎪1.0; T 1.0s ⎪ ⎪ R −1 C1 = ⎨1.0 + 2 ; 0.2sT ≤1.0s (2.20) aT⎪ ⎪ R −1 1.0 + ; T ≤ 0.2s⎪⎩ 0.04a in which a is a site dependent constant equal to 130 for Site Class A and B, 90 for Site Class C, and 60 for Site Class D, E, and F; and R is the ratio of the elastic to the yield strength of the system and is defined as S W R = A (2.21) g Vy in which SA is the spectral acceleration used in Equation (2.1), W is the seismic weight of the system, Vy is the yield force (or base shear) of the system, and g is the acceleration due to gravity. The coefficient C2 is given by ⎧1.0; T 0.7s C2 = ⎨ ⎪ 1 ⎛ R −1 2 (2.22)⎞ 1+ ; T ≤ 0.7s⎪ ⎜ ⎟ ⎩ 800 ⎝ T ⎠ Equation (2.19) can be used to compute the displacement demand for systems in which R ≤ Rmax where Rmax is given by 10
  • 22. −t Δd αe (2.23)Rmax = + Δy 4 in which Δd is smaller than the computed displacement demand, Δd , from Equation (2.19) or the displacement corresponding to the maximum strength in the pushover curve, Δy is the yield displacement of the idealized bilinear force-deformation curve, t is a constant computed from 1 0.15ln(T ) (2.24)t = + and αe is the effective post-elastic stiffness ratio computed from αe = αP−Δ + λ α( 2 −αP−Δ ) (2.25) where λ is a near-field effect factor equal to 0.8 for sites that are subjected to near-field effects and 0.2 for sites that are not subjected to near field effects. The near field effects may be considered to exist if the 1 second spectral value, S1 , at the site for the maximum considered earthquake is equal to or exceeds 0.6g. The P-Delta stiffness ratio, αP−Δ , and the maximum negative post-elastic stiffness ratio, α2 , in Equation (2.25) are estimated from the idealized force-deformation curve in Figure 2.2. The αP−Δ needed in Equation (2.25) may be estimated by conducting pushover analysis with and without P-Delta effects. 2.2 IRREGULAR STRUCTURES 2.2.1 Current MOTEMS Procedure The current MOTEMS procedure requires that the seismic displacement demand in irregular concrete or steel structures with high or moderate seismic risk classification be computed from linear modal analysis. This procedure assumes that the displacement demand in irregular structures deformed beyond the linear elastic range may be approximated by that of a linear elastic structure. For irregular concrete and steel structures with low seismic risk, the displacement demand must be computed by a nonlinear static procedure; the nonlinear static procedure for such irregular structures appears to be similar to that for regular structures. 11
  • 23. 2.2.2 Proposed Nonlinear Static Procedure for Irregular Structures Presented here is a rational nonlinear static procedure for estimating displacement demand in irregular structures. Proposed initially by Chopra and Goel (2004) to estimate seismic demands in unsymmetric-plan buildings, this procedure has been slightly modified to estimate displacement demands in irregular Marine Oil and LNG Terminals. The following is a step-by- step summary of this procedure. 1. Compute the natural frequencies, ωn and modes, φn , for linearly elastic vibration of the irregular Marine Oil and LNG Terminal. 2. Select a reference point where the displacement, urn , is to be monitored in the selected direction of analysis during the pushover analysis. Ideally, this reference point should be the location on the structure with largest value of φrn in the selected direction of analysis. 3. For the nth-mode, develop the pushover curve, Vbn −urn , for the nth modal force distribution, sn * = Mφn , where s* n is the vector of lateral forces used during the pushover analysis, M is the mass matrix of the structure, and φn is the nth mode shape. The base shear Vbn should be monitored in the same direction as the direction of selected reference point displacement urn . 4. Convert the V −u pushover curve to the force-displacement, F Ln − Dn , relation for thebn rn sn nth -“mode” inelastic SDF system by utilizing F Ln =Vbn M * and D = u Γnφrn in whichsn n n rn φrn is the value of φn at the reference point in the direction under consideration, Mn * = (φn T Mι) 2 φT Mφ is the effective modal mass, and Γ = φT Mι φT Mφ with ι equal ton n n n n n the influence vector. The influence vector ι is a vector of size equal to the total number of degrees of freedom. For analysis in the x-direction, the components of ι corresponding to x- degree-of-freedom are equal to one and the remaining components equal to zero. Similarly the components of ι corresponding to y-degree-of-freedom are equal to one and the remaining components equal to zero for analysis in the y-direction. 5. Idealize the force-displacement, F Ln − Dn , curve as a bilinear curve and compute the yieldsn value Fsny Ln . 12
  • 24. 6. Compute the yield strength reduction factor, R = SA L ).(Fsny n 7. Compute the peak deformation Dn = Δd of the nth-“mode” inelastic SDF system defined by the force-deformation relation developed in Step 4 and damping ratio ζn , from Equation (2.19). The elastic vibration period of the system is based on the effective slope of the 1/2 F L − D curve, which for a bilinear curve is given by T = 2π (L D Fsny ) .sn n n n n ny 8. Calculate peak reference point displacement urn associated with the nth-“mode” inelastic SDF system from u = Γ φ D .rn n rn n 9. Push the structure to reference point displacement equal to urn and note the values of desired displacement δno . 10. Repeat Steps 3 to 9 for all significant modes identified. 11. Combine the peak modal displacement, δno , by an appropriate modal combination rule, e.g., CQC, to obtain the peak dynamic response, Δo . 13
  • 25. 3. SIMPLIFYING ASSUMPTION Figure 3.1b shows the mathematical model of a free-head pile of Figure 3.1a supported on bedrock (or other competent soil) and surrounded by soil between the bedrock and mud line. In this model, the pile is represented by beam-column elements and soil by Winkler reaction springs connected to the pile between the bedrock and the mud line (Priestley et al., 1996). The properties of the beam-column element are established based on the pile cross section whereas properties of the reaction springs are specified based on geotechnical data (e.g., see Priestley et al., 1996; Dowrick, 1987). Figure 3.1c shows the height-wise distribution of bending moment under lateral load applied to the pile tip. Note that the maximum bending moment occurs slightly below the mud line at a depth equal to Dm , typically denoted as the depth-to-maximum-moment below the mud line (Figure 3.1c). Lateral displacement at the pile tip can be calculated based on this bending moment distribution or from a discrete element model implemented in most commonly available computer programs for structural analysis. Mud Line Bedrock P F Mud Line P F Δ Mud Line Dm Mud Line Δ L D f P F (a) (b) (c) (d) Figure 3.1. Simplified model of the pile-soil system for displacement capacity evaluation: (a) Pile supported on bedrock; (b) Mathematical model of the pile; (c) Height-wise variation of bending moment; and (d) Equivalent fixity model for displacement calculation. An alternative approach to modeling soil flexibility effects of the pile with discrete soil springs is the effective fixity approach (Priestley et al., 1996: Sec. 4.4.2; Dowrick, 1987: Sec. 6.4.5.3). In this approach (Figure 3.1d), the depth-to-fixity, Df , is defined as the depth that produces in a fixed-base column with soil removed above the fixed base the same top-of-the-pile lateral displacement under the lateral load, F , as that in the actual pile-soil system (Priestley et al., 1996). Both the axial load, P , and top-of-the-pile moment, M (not shown in Figure 3.1d) 14
  • 26. need to be considered. The depth-to-fixity, which depends on the pile diameter and soil properties, is typically provided by the geotechnical engineer, estimated from charts available in standard textbooks on the subject (e.g., Priestley, et al., 1996; Dowrick, 1987) or from recommendations in several recent references (e.g., Chai, 2002; Chai and Hutchinson, 2002). The equivalent fixity model is typically used for estimating displacement of piles that remain within the linear-elastic range. For piles that are expected to be deformed beyond the linear-elastic range, however, nonlinear analysis of the discrete soil spring model approach of Figure 3.1b is recommended (Priestley et al., 1996: Sec. 4.4.2) because the plastic hinge forms at the location of the maximum bending moment, i.e., at the depth-to-maximum-moment, Dm , and not at the depth-to-fixity, Df . A recent investigation has developed equations for estimating lateral displacement of equivalent fixity model of the nonlinear soil-pile system by recognizing that the plastic hinge forms at the depth-to-maximum-moment (Chai, 2002); expressions for estimating displacement ductility capacity of pile-soil system are also available (Priestley et al., 1996: Sec. 5.3.1). However, calculation of lateral displacement capacity of nonlinear soil-pile systems using these approaches requires significant information about the soil properties. This investigation uses a simplifying assumption that the equivalent fixity model may directly be used to estimate lateral displacement capacity of nonlinear piles. Clearly, such an approach indicates that the plastic hinge would form at the depth-to-fixity, Df , which differs from the actual location at the depth-to-maximum-moment, Dm . It is useful to note that Df is typically in the range of 3 to 5 pile diameter whereas Dm is in the range of 1 to 2 pile diameter (see Priestley et al., 1996). Obviously, plastic hinge at Df in the equivalent fixity model would provide slightly larger plastic displacement compared to the plastic displacement if the plastic hinge was correctly located at Dm ; note that plastic displacement is given by Δ = p Lp θ ( a + Df or Dm ) where θp is the plastic hinge rotation and La is the free-standing height of the pile. However, the simplifying assumption used in this investigation is appropriate because difference between Df and Dm is unlikely to significantly affect the plastic displacement for piles with very long free-standing height used in marine oil terminals. Note that the freestanding height of piles in marine oil terminals is typically in excess of twenty times the pile diameter. 15
  • 27. It is useful to emphasize that the simplified approach proposed in this investigation is intended to be used for preliminary design of piles or as a check on the results from the detailed nonlinear analysis. It is expected that this approach would provide results that are sufficiently “accurate” for this purpose. The recommendations to estimate displacement capacity of the pile using the equivalent fixity approach are strictly valid only if the displacement demand is also estimated by utilizing the equivalent fixity pile model – a practice that is commonly used for analysis of large piers and wharves with many piles. The recommendations developed in this report should be used with caution if the displacement demand is estimated from a model consisting of piles with soil springs. 16
  • 28. 4. MOTEMS PROCEDURE FOR CAPACITY EVALUATION OF PILES The displacement capacity of piles in the MOTEMS is estimated from nonlinear static pushover analysis. In this analysis, a force of increasing magnitude is applied statically in the transverse direction (perpendicular to the pile) permitting the materials in the pile – steel and/or concrete – to deform beyond their linear-elastic range. The displacement capacity is defined as the maximum displacement that can occur at the tip of the pile without material strains exceeding the permissible values corresponding to the desired design level. The displacement capacity of a pile at a selected design level in the MOTEMS is obtained from the procedure proposed by Priestley et al. (1996) as illustrated in Figure 4.1. This procedure requires development of the pile section moment-curvature relationship. The moment-curvature relationship may be developed from any standard moment-curvature analysis programs using material constitutive relationships specified in the MOTEMS; the MOTEMS specifies guidelines for selecting material properties such as concrete and steel strengths as well as stress-strain curves for unconfined concrete, confined concrete, reinforcing steel, and prestressing steel. The moment-curvature relationship is idealized as a bilinear relationship as shown in Figure 4.2. It is useful to note that the formulation presented here is for a cantilever, i.e., a pile with a pin-connection to the deck. Similar formulation is available for piles with full-moment- connection to the deck that uses “effective” length defined as the length between points of contra-flexure (e.g., see CALTRANS, 2006). Δ ΔΔ y p L Lp φ φ θ p p y (a) Member (b) BM (c) Curvature (d) Deflections Figure 4.1. Deformation capacity of a pile: (a) Deflected shape, (b) Bending moment (BM) diagram, (c) Curvature distribution, and (d) Yield and plastic displacements. The total displacement capacity of the pile is computed as 17
  • 29. Δ = Δ + Δ (4.1)y P in which Δy is the yield displacement and Δp is the plastic displacement of the pile. The yield displacement can be estimated as 2 Δ = φyL (4.2)y 3 where φy is the yield curvature computed from M y φy = (4.3) E Ic e with M being the yield moment and E I being the slope of the initial elastic portion of they c e bilinear idealization of the moment-curvature relationship, and L is the pile “effective” length. The “effective” length, defined as the length between points of contraflexure, for a cantilever becomes equal to its total length (Figure 4.1). It is useful to note that the yield displacement, Δy , of reinforced-concrete pile may be estimated from Equation (4.2), without the need for section moment-curvature analysis, by using the following expression for dimensionless yield curvature (Priestley et al., 1996: Sec. 7.4.6): φyD = 2.45εy ± 0.15 (4.4) in which D is the pile diameter and εy is the longitudinal yield reinforcement. Similar expression for hollow-steel pile is currently not available. Mu M y Moment First Yield φ φ y u Figure 4.2. Bilinear idealization of the moment-curvature relationship. 18 Curvature
  • 30. The plastic displacement, Δ p, is computed from ⎛ ⎞Mu 1 φ φ− L 0.5 (4.5)Δ = − Δ + L − Lp ⎜ ⎟ y p ( u y )( p )⎜ ⎟M⎝ y ⎠ The plastic displacement given by Equation (4.5) includes components due to the elastic displacement resulting from the increase in moment from M y to Mu , i.e., post-yield stiffness of the moment-curvature relationship (see Figure 4.2) and due to plastic rotation θp of the pile. In order to compute the plastic rotation, it is assumed that a constant plastic curvature, φp = φ φyu − , occurs over a plastic hinge length Lp of the pile (see Figure 4.1c). Therefore, the plastic rotation is given by θp L = φ φ (4.6)= pφp Lp ( u − y ) The values of Mu and φu in equation (4.5) are the largest values of the pile section moment and curvature, respectively, without exceeded the material strains at selected design level. The MOTEMS specify the formula for estimating the plastic hinge length required in Equation (4.5). If the hinge were to form against a supporting member, i.e., at the pile-deck interface, the plastic hinge length is computed from ⎧0.08L + 0.022 fyedbl ≥ 0.044 fyedbl ( fye in MPA) Lp = ⎨ (4.7) ⎩ 0.08L + 0.15 fyedbl ≥ 0.3 fyedbl ( fye in ksi) in which fye is the expected yield strength of the reinforcing steel, and dbl is the diameter of the longitudinal reinforcement. If the plastic hinge forms in-ground, the MOTEMS provide a chart to estimate the plastic hinge length that depends on the pile diameter, subgrade modulus, effective stiffness of the pile, and the distance from ground to the pile point of contraflexure. It is useful to note that Equation (4.7), as specified in Priestley et al., (1996) or in the MOTEMS (2006), does not explicitly impose an upper limit even though there may be some experimental evidence that the plastic hinge length should not be greater than the pile diameter. 19
  • 31. The plastic hinge length formula of Equation (4.7) specified in the MOTEMS is based on the recommendation by Priestley et al. (1996) for reinforced concrete sections. The MOTEMS do not provide recommendations for plastic hinge length for steel piles or prestressed concrete piles. The MOTEMS specify material strain limits for two levels of seismic design: Level 1 and Level 2. These strain limits depend on whether the plastic hinge forms in-ground or at the pile- deck interface. These strain limits are listed in Table 4.1. Table 4.1. Material strain limits in the MOTEMS. Pile Type Material Hinge Location Level 1 Level 2 Reinforced-Concrete Pile Concrete Pile-Deck 0.004cε ≤ 0.025cε ≤ In-Ground 0.004cε ≤ 0.008cε ≤ Steel rebar Pile-Deck 0.01sε ≤ 0.05sε ≤ In-Ground 0.01sε ≤ 0.025sε ≤ Prestressed Concrete Pile with Dowel- Connection Strands In-Ground 0.005pε ≤ (Incremental) 0.025pε ≤ (Total) Pile-Deck 0.01sε ≤ 0.05sε ≤ Hollow Steel Pile Steel 0.008sε ≤ 0.025sε ≤ Hollow Steel Pile with Dowel-Connection Steel In-Ground1 0.008sε ≤ 0.025sε ≤ Pile-Deck2 0.01sε ≤ 0.05sε ≤ 1 The strain values are the same as for steel in hollow steel pile. 2 The strain values are the same as for steel rebar at the pile-deck connection of a RC pile. 20
  • 32. 5. SIMPLIFIED PROCEDURE TO COMPUTE PILE DISPLACEMENT CAPACITY Estimation of displacement capacity of the pile according to the seismic provisions of the MOTEMS require monitoring of material strains during the nonlinear static pushover analysis of the pile if the pile is modeled using a distributed-plasticity approach in which section properties are specified by a fiber-section. The estimation of the displacement capacity requires monitoring of material strains during moment-curvature analysis if the pile is modeled using a concentrated- plasticity approach in which nonlinearity is represented by rotational springs at two ends of the pile. The nonlinear moment-rotation relationship of this spring is computed from the moment- curvature relationship and estimated length of the plastic hinge. In either approach, the displacement capacity is defined as the maximum displacement that can occur at the tip of the pile without material strains exceeding the strain limits specified in the MOTEMS for any selected design level. Monitoring strains during pushover analysis of piles using a distributed-plasticity model is cumbersome. Moreover, structural analysis programs commonly used by practicing engineers may not have the capability to directly monitor strains during the pushover analysis. Although, the concentrated-plasticity model, such as that employed in the current MOTEMS (see description in Chapter 4), does not require direct monitoring of material strains during pushover analysis; however, it still requires monitoring of material strains during moment-curvature analysis. Most commercially available programs for moment-curvature analysis do provide the capability to monitor material strains. However, this approach requires estimation of plastic hinge length in order to convert the moment-curvature relationship to the moment-rotation relationship of the rotational spring. While the MOTEMS provide guidelines for estimating plastic hinge length for reinforced concrete piles [see Equation (4.7)], such guidelines are not available for steel piles or prestressed concrete piles indicating that estimation of displacement capacity of such piles using concentrated-plasticity model may also be cumbersome. Therefore, there is a need to develop a simplified approach that avoids the need to monitor strains to the extent possible and yet provides a “good” estimate of displacement capacity of the pile without exceeding material strain limits specified in the MOTEMS. It is useful to note that formulas and/or charts for estimating the plastic hinge length have been recommended by several researchers (e.g., Priestley et al., 1996; Chai, 2002; Chai and 21
  • 33. Hutchinson, 2002; Budek et al., 2000; Song et al., 2004). However, these recommendations were developed for piles deformed significantly into the inelastic range. While such recommendations are appropriate for seismic design of piles for Level 2, where piles are expected to be deformed significantly into the inelastic range, they may not be appropriate for design of piles for Level 1 which corresponds to much lower level of inelastic action. A simplified procedure is proposed in this report to compute the displacement capacity of piles commonly used in Marine Oil and LNG Terminals. This approach computes the displacement capacity as Δc = μΔΔy (5.1) where Δy is the yield displacement of the pile and μΔ is the displacement ductility capacity of the pile. The displacement ductility capacity is selected such that the material strains remain within the limits specified in the MOTEMS. The guidelines to select the displacement ductility capacity and estimate the yield displacement are developed next in this report for four types of piles: (1) reinforced-concrete piles with either pin or full-moment connection to the deck; (2) hollow steel pipe pile with either pin or full-moment connection to the deck; (3) hollow steel pipe pile with a dowel- connection to the deck; and (4) prestressed concrete pile with a dowel-connection to the deck. The guidelines developed for these piles utilize the concept of equivalent fixity model described in Chapter 3 of this report. Similar displacement ductility capacity based approaches have been proposed previously (e.g., Priestly et al., 1996; Budek at al., 2000; Chai, 2002; Song et al., 2004). However, this investigation specifically developed recommendations for displacement ductility capacity of long piles typically used in Marine Oil and LNG Terminals. The simplified procedure to estimate displacement capacity of piles presented in this report is intended either for preliminary design of piles or as a quick check on the capacity that may be obtained from detailed nonlinear analyses. The design engineers may still use the elaborate analysis for final design of piles for a Marine Oil and LNG Terminals. 22
  • 34. 6. DISPLACEMENT CAPACITY OF REINFORCED CONCRETE PILES This Chapter presents development of a simplified procedure for estimating displacement capacity of reinforced concrete piles connected to the deck either by a pin connection or by a moment connection. For this purpose, the current approach in the MOTEMS (see Equations 4.1 to 4.7 in Chapter 4) is further simplified. Presented first in this Chapter is development of simplified equations to compute displacement ductility of reinforced concrete piles that are independent of the pile length and depend only on the pile section curvature ductility and seismic design level. The accuracy of these equations is next evaluated against results from nonlinear finite element analyses. Subsequently, results of a parametric study are presented to understand the sensitivity of the displacement ductility capacity on pile diameter, longitudinal reinforcement ratio, transverse reinforcement ratio, and axial force. Based on these results, lower bound estimates of the ductility capacity of reinforced concrete piles for two design levels – Level 1 and Level 2 – are proposed. Finally, it is demonstrated that the lower-bound displacement ductility values along with simplified expressions for yield displacement provide very good estimate of the displacement capacity of piles when compared against values from nonlinear finite element analysis. 6.1 THEORETICAL BACKGROUND The displacement ductility capacity of reinforced concrete piles is defined as (Priestley et al., 1996) Δ + Δ Δ L Ly p p Mu ⎛ p ⎞⎛ p ⎞ μΔ = = +1 = + 3(μφ −1)⎜ ⎟⎜1− 0.5 ⎟ (6.1) Δ Δ M L Ly y y ⎝ ⎠⎝ ⎠ in which μφ is the pile section curvature ductility capacity given by φu μφ = (6.2) φy with φu being the section curvature at a selected design level material strain and φy is the yield curvature defined by Equation (4.3) and Figure 4.2. For piles in Marine Oil and LNG Terminals, which typically use piles with very long free-standing height, the second term in Equation (4.7) for plastic hinge length becomes negligibly small compared to the first term implying that this 23
  • 35. term may be ignored without introducing significant error. Therefore, the plastic hinge length may be expressed as Lp 0.08L (6.3) Equation (6.3) implies that the ratio pL L needed in Equation (6.1) is independent of the member “effective” length. It is useful to note that neglecting the second term in the Equation (4.6) for the plastic hinge location leads to smaller plastic hinge length and therefore is likely to provide a conservative estimate of the displacement ductility capacity of the pile. The preceding approximation permits the following important simplification in Equation (6.1): M Mu u μΔ = + 3(μφ −1)(0.08)(1− 0.5×0.08) = + 0.2304(μφ −1) (6.4) M My y which implies that the pile displacement ductility capacity is independent of its “effective” length; it depends only on the section curvature ductility, μφ , and ratio of ultimate and yield moments Mu M y . For moment-curvature relationship that exhibit very little post-yield stiffness, i.e., M M y , Equation (6.4) can be further simplified asu 1 μ 1μΔ = + 0.2304( φ − )= 0.7696 + 0.2304μφ (6.5) Equation (6.5) indicates that member displacement ductility capacity can be computed directly from the section curvature ductility capacity. 6.2 EVALUATION OF SIMPLIFIED EQUATIONS FOR DUCTILITY CAPACITY The accuracy of Equations (6.5) in estimating displacement ductility capacity of reinforced concrete piles at seismic design Level 2 and Level 1, respectively, is evaluated in this section. For this purpose, displacement ductility capacity of reinforced concrete piles is evaluated from nonlinear static pushover analysis of a finite element model. The pile is considered to be fixed at top and bottom. These boundary conditions correspond to a pile that is connected to the pile-cap with a full-moment connection, and utilizes the equivalent displacement fixity assumption at the ' bottom. The axial load on the pile is assumed to be 0.05A f in which A is the gross cross-g c g 24
  • 36. ' section area of the pile and f is the compressive strength of concrete. The longitudinal andc transverse reinforcements in the pile section are assumed to be equal to 1% and 0.6%, respectively. The pile is modeled with a nonlinear beam-column element in computer program Open System for Earthquake Engineering Simulation (OpenSees) (McKenna and Fenves, 2001). The distributed plasticity is considered by specifying the section properties by a fiber section model and then using seven integration points along the element length; details of such modeling may be found in McKenna and Fenves (2001). The material properties are specified as per the MOTEMS specifications (MOTEMS, 2007; Mander et al., 1988). Strains in the concrete and steel are monitored during the pushover analysis. The limiting values of compressive strain in concrete and tensile strain in reinforcing steel are 0.004 and 0.01, respectively, for Level 1 and 0.025 and 0.05, respectively, for Level 2. If the hinge forms below ground, the limiting value of compressive strain in concrete and tensile strain in reinforcing steel are 0.004 and 0.01, respectively, for Level 1 and 0.008 and 0.025, respectively, for Level 2. The concrete strains are assumed to be specified just inside the reinforcement cage. The displacement ductility at a selected design level corresponds to the largest displacement that can occur at the tip of the pile without strain limits either in concrete or steel being exceeded. The results are presented in Figure 6.1 for four pile diameters – 61 cm, 76 cm, 91 cm, and 107 cm – and pile length in the range of 5 m to 40 m. These results confirm expectations from Equation (6.5) that the displacement ductility capacity is independent of the pile length. This becomes apparent from essentially no variation in the ductility capacity from the nonlinear finite element analysis of the pile lengths in Figure 6.1 for both design levels and all pile diameters. The presented results also demonstrate that Equation (6.5) provides a very good estimate of the displacement ductility capacity of reinforced concrete piles (see Figure 6.1). It is useful to note that the plastic hinge length used in this investigation does not include contribution to the plastic hinge length due to strain-penetration effects. It would be useful to verify these findings from experiments on reinforced concrete piles. 25
  • 37. 3 4 5 6 7 (a) Level 1, IG or PD (b) Level 2, IG (c) Level 2, PD 7 Pile Dia.= 61 cm 7 Pile Dia.= 61 cm 6 6 Pile Dia.= 61 cm Pile Dia.= 76 cm Pile Dia.= 91 cm Pile Dia.= 107 cm 0 10 20 30 40 μ μμμ Δ1,IGorPDΔ1,IGorPDΔ1,IGorPDΔ1,IGorPD 5 5 μμμ μΔ2,IG Δ2,IGΔ2,IGΔ2,IG μ μμμ Δ2,PD Δ2,PDΔ2,PDΔ2,PD 4 4 33 2 2 2 1 1 1 7 7 7 6 Pile Dia.= 76 cm 6 Pile Dia.= 76 cm 6 5 5 5 4 4 4 3 3 3 2 2 2 1 1 1 7 7 7 6 Pile Dia.= 91 cm 6 Pile Dia.= 91 cm 6 5 5 5 4 4 4 3 3 3 2 2 2 1 1 1 7 7 7 Pile Dia.= 107 cm 0 10 20 30 40 Pile Dia.= 107 cm 0 10 20 30 40 6 6 6 5 5 5 44 4 3 3 3 2 2 2 1 1 1 Pile length, m Pile length, m Pile length, m Figure 6.1. Displacement ductility capacity from simplified equation (shown in dashed line) and nonlinear finite element analysis (NLFEA) for seismic design (a) Level 1 for in-ground (IG) or pile-deck (PD) hinge formation, (b) Level 2 for IG hinge formation, and (c) Level 2 for PD hinge formation. 6.3 SENSITIVITY OF DISPLACEMENT DUCTILITY TO PILE PARAMETERS 6.3.1 Pile Length and Pile Diameter Figure 6.2 presents variation of displacement ductility capacity with pile length for four values of pile diameters: 61 cm, 76 cm, 91 cm, and 107 cm. The results are presented for piles with 1% longitudinal reinforcement and 0.6% transverse reinforcement. As noted previously, results of 26
  • 38. 2 6 Figure 6.2 also indicate that the displacement ductility capacity of piles is essentially independent of the pile length. This is expected because Equation (6.5) becomes independent of the pile length. The results of Figure 6.2 indicate that the displacement ductility capacity of the pile is also essentially independent of the pile diameter as apparent from almost identical curves for the four pile diameters considered in Figure 6.2. (a) Level 1, IG or PD (b) Level 2, IG (c) Level 2, PD 4 7 μΔ1,IG 91 cm 107 cm 1 1 1 μ Δ2,PD μΔ1,IGorPD 5 NLFEA: Pile Dia. 3 1.5 61 cm 76 cm2 3 0 10 20 30 40 0 10 20 30 40 0 10 20 30 Pile Length, m Pile Length, m Pile Length, m Figure 6.2. Variation of displacement ductility capacity computed from nonlinear finite element analysis (NLFEA) with pile length and pile diameter: (a) Level 1 for in-ground (IG) or pile-deck (PD) hinge formation, (b) Level 2 for IG hinge formation, and (c) Level 2 for PD hinge formation. In order to understand the aforementioned trend, i.e., independence of the displacement ductility capacity of the pile diameter, it is useful to examine the variation of pile section curvature ductility capacity. The results presented in Figure 6.3 indicate that the section curvature ductility capacity is essentially independent of the pile diameter. This observation, along with Equation (6.5), then confirms that the pile displacement ductility capacity should also be independent of the pile diameter. (a) Level 1, IG or PD (b) Level 2, IG (c) Level 2, PD 20 30 25 15 μ φ1,IGorPD 4 20 φ2,PD φ2,IG 10 15 μ μ 2 10 5 5 50 0 70 90 110 50 0 70 90 110 50 0 70 90 110 Pile Diameter, cm Pile Diameter, cm Pile Diameter, cm Figure 6.3. Variation of section curvature ductility capacity pile diameter: (a) Level 1 for in- ground (IG) or pile-deck (PD) hinge formation, (b) Level 2 for IG hinge formation, and (c) Level 2 for PD hinge formation. 27 40
  • 39. 5 5 6.3.2 Longitudinal and Transverse Reinforcement Ratio Figures 6.4 and 6.5 present variations of the displacement ductility capacity with longitudinal and transverse reinforcement ratio, respectively. The results presented are for a pile with 91 cm diameter and 15 m length. The values of longitudinal reinforcement varying between 0.5% and 2% and transverse reinforcement between 0.5% and 1.5% were considered. (a) Level 1, IG or PD (b) Level 2, IG (c) Level 2, PD 5 9 4 4 7 Δ1,IGorPD Δ2,PD Δ2,IG 3 3 5 μ μ 2 2 3 1 1 1 0.5 1 1.5 2 0.5 1 1.5 2 0.5 1 1.5 2 Pile Longitudinal Reinforcement, % Pile Longitudinal Reinforcement, % Pile Longitudinal Reinforcement, % μ Figure 6.4. Variation of displacement ductility capacity computed from nonlinear finite element analysis (NLFEA) with pile longitudinal reinforcement ratio: (a) Level 1 for in-ground (IG) or pile-deck (PD) hinge formation, (b) Level 2 for IG hinge formation, and (c) Level 2 for PD hinge formation. The results presented in Figure 6.4 indicate that the displacement ductility decreases with increasing longitudinal reinforcement ratio for values up to about 1%. For longitudinal reinforcement ratio in excess of about 1%, as may be the case for seismic piles in Marine Oil and LNG Terminals, the displacement ductility capacity of piles is much less sensitive to the value of the longitudinal reinforcement ratio. For such values, the displacement ductility capacity may be considered to be essentially independent of the longitudinal reinforcement ratio. (a) Level 1, IG or PD (b) Level 2, IG (c) Level 2, PD 9 9 4 7 7 Δ1,IGorPD Δ2,PD Δ2,IG 3 5 5 μ μ μ 2 3 3 1 1 1 0.5 0.75 1 1.25 1.5 0.5 0.75 1 1.25 1.5 0.5 0.75 1 1.25 1.5 Pile Transverse Reinforcement, % Pile Transverse Reinforcement, % Pile Transverse Reinforcement, % Figure 6.5. Variation of displacement ductility capacity computed from nonlinear finite element analysis (NLFEA) with pile transverse reinforcement ratio: (a) Level 1 for in-ground (IG) or pile-deck (PD) hinge formation, (b) Level 2 for IG hinge formation, and (c) Level 2 for PD hinge formation. 28
  • 40. 5 The results presented in Figure 6.5 show that displacement ductility capacity of piles does not depend on the transverse reinforcement ratio. This becomes apparent from essentially flat variation of the displacement ductility capacity with pile transverse reinforcement ratio. 6.3.3 Axial Force Figure 6.6 presents variation of displacement ductility capacity with axial force in the pile. The presented results are for a pile with 91 cm diameter and 15 m length for values of axial force ' varying from zero to 0.2A f . These results show that the displacement ductility for Level 1g c tends to increase with increasing pile axial force (Figure 6.6 (a)). However, the ductility for Level 2 appears to be insensitive to the axial force values (Figure 6.6 (b) and 6.6(c)). (a) Level 1, IG or PD (b) Level 2, IG (c) Level 2, PD 5 9 0 0.05 0.1 0.15 0.2 0 0.05 0.1 0.15 0.2 4 4 7 μ Δ1,IGorPD 2 2 3 μ Δ2,PD 1 1 1 0 0.05 0.1 0.15 0.2 Pile Axial Force/(A f′ ) Pile Axial Force/(A f′ ) Pile Axial Force/(A f′ )c c c c c c μΔ2,IG 3 3 5 Figure 6.6. Variation of displacement ductility capacity computed from nonlinear finite element analysis (NLFEA) with pile axial load ratio: (a) Level 1 for in-ground (IG) or pile-deck (PD) hinge formation, (b) Level 2 for IG hinge formation, and (c) Level 2 for PD hinge formation. 6.4 LOWER BOUND OF DISPLACEMENT DUCTILITY CAPACITY The results presented in the preceding section indicate that the displacement ductility is relatively insensitive to pile length, pile diameter, pile longitudinal (for practical range), and transverse steel. Furthermore, the displacement ductility for Level 2 is also independent of the pile axial force. Therefore, the displacement ductility appears to be a very robust parameter that can be used in simplified design of piles instead of the various axial strain limits which are currently specified in the MOTEMS. While the displacement ductility may be related to the pile curvature ductility using Equation (6.5), the results presented in the preceding section also indicate that a lower bound of the member displacement ductility capacity may be estimated without any knowledge about the section curvature ductility capacity for practical range of various parameters. 29
  • 41. (a) Level 1 (b) Level 2 3 7 μ = 1.75 Δ1, PD 1.5 1 1 μΔ2,PD μΔ2, PD = 5 NLFEA: Pile Dia. 61 cm 76 cm 91 cm 107 cm 2.5 5 μ Δ1,PD 2 3 0 10 20 30 40 0 10 20 30 40 Pile Length, m Pile Length, m Figure 6.7. Lower-bound value of displacement ductility capacity due to pile-deck hinge formation for seismic design (a) Level 1, and (b) Level 2. The results presented in Figure 6.7 for a pile-deck hinge indicates that the displacement ductility capacity may be limited to 1.75 for seismic design Level 1 and 5.0 for seismic design Level 2. Note that the displacement ductility for Level 1 is likely to be slightly lower for axial force values than the 0.05A f ′ value considered in developing these results (see Figure 6.6 (a)).g c Similarly, the displacement ductility is likely to be slightly larger for longitudinal reinforcement less than the 1% value considered in developing these results (see Figure 6.4 (a)). The displacement ductility capacity for an in-ground hinge is 1.75 for seismic design Level 1 and 2.5 for seismic design Level 2 (Figure 6.8). While the ductility capacity for in-ground hinge is the same as for pile-deck hinge for design Level 1, it is much lower for design Level 2. This is because the steel strain limit for design Level 2 is much lower for the in-ground hinge compared to the pile-deck hinge. (a) Level 1 (b) Level 2 2 4 0 10 20 30 40 μ μ Δ1, IG = 1.75 NLFEA: Pile Dia. 61 cm 76 cm 91 cm 107 cm μΔ2,IG μ Δ2, IG = 2.5 0 10 20 30 40 3.5 3 2.5 2 1.5 1 Δ1,IG 1.5 1 Pile Length, m Pile Length, m Figure 6.8. Lower-bound value of displacement ductility capacity due to in-ground hinge formation for seismic design (a) Level 1, and (b) Level 2. 30
  • 42. 6.5 SIMPLIFIED PROCEDURE TO COMPUTE DISPLACEMENT CAPACITY Displacement capacity of piles at a selected design level may be estimated from Δc = μΔΔy (6.6) in which μΔ is the ductility capacity at a selected design level and location of hinge, i.e., equal to 1.75 for Level 1 design and 5 for Level 2 design if the hinge were to form in the pile near the deck, and equal to 1.75 for Level 1 and 2.5 for Level 2 if the hinge were to form in-ground, and Δy is the yield displacement of the pile. The yield displacement can be computed from nonlinear pushover analysis of the pile. Alternatively, the yield displacement may be estimated based on section yield moment and effective section EIe . For example, the yield displacement of a pile that is fixed at the bottom and prevented from rotation at the top due to a rigid deck may be estimated from 2 M Ly y (6.7)Δ = 6EIe and yield displacement of a cantilever may be estimated from 2 Δ = M yL (6.8)y 3EIe in which M y is the section yield moment and EIe is the effective value of EI that can be estimated from the section moment-curvature relationship analysis as the initial slope of the idealized bilinear moment-curvature relationship (see Figure 4.2). The accuracy of the procedure to estimate the displacement capacity of piles is evaluated next. For this purpose, the approximate displacement capacity is computed first from Equation (6.6) by utilizing the yield displacement from Equation (6.7) or (6.8) depending on the boundary conditions. The exact displacement capacity is computed next from Equation (6.6) but with yield displacement estimated from nonlinear static pushover analysis of the pile. For both cases, the value of the ductility capacity obtained from the pushover analysis is used. The approximate and exact displacement capacities are compared in Figure 6.9 for a pile with 91 cm diameter. These 31
  • 43. 1 1.5 2 results indicate that the approximate analysis provides an excellent estimate of the displacement capacity of the pile for Level 1 as well as Level 2 design. (a) Level 1, IG or PD (b) Level 2, IG (c) Level 2, PD 3 5 Exact 2.5 0.5 10.5 0 0 0 0 10 20 30 40 0 10 20 30 40 0 10 20 30 40Δ,m2,IG Pile Length, m Pile Length, m Pile Length, m Δ,m 2,PD Approximate 4 Δ,m1,IGorPD 2 3 1.5 2 1 Figure 6.9. Comparison of displacement capacities due to pile-deck hinge formation from exact and approximate analyses. The approximate analysis is attractive because it eliminates the need for nonlinear static analysis of the pile. However, it must be noted that the approximate analysis may only be used for the soil-pile-deck system that can be idealized either by a fixed-fixed column or by a cantilever column – the two cases for which closed form solutions to estimate yield displacement are available (see Equations 6.7 and 6.8) – using the equivalent displacement fixity concept. For other cases, the yield displacement may have to be estimated from nonlinear static pushover analysis of the soil-pile-deck system. 32
  • 44. 7. DISPLACEMENT CAPACITY OF HOLLOW STEEL PILES This Chapter presents development of a simplified procedure for estimating displacement capacity of hollow steel piles connected to the deck either by a pin connection or by a full- moment-connection strong enough to force hinging in the steel pile. For this purpose, the current approach in the MOTEMS (see Equations 4.1 to 4.6 in Chapter 4) is further simplified. Presented first is the development of simplified equations to compute displacement ductility of hollow steel piles that are independent of the pile length and depend only on the pile section ductility and seismic design level. The accuracy of these equations is then evaluated against results from nonlinear finite element analyses. Subsequently, results of a parametric study are presented to show the sensitivity of the displacement ductility capacity on pile diameter, pile thickness, and axial force level. Based on these results, lower bound estimates of the ductility capacity of hollow steel piles for two design levels – Level 1 and Level 2 – are proposed. Finally, it is demonstrated that the lower-bound displacement ductility values along with simplified expressions for yield displacement provide very good estimates of the displacement capacity of piles when compared against values from nonlinear finite element analysis. 7.1 THEORETICAL BACKGROUND Similar to the displacement ductility of reinforced concrete piles, the displacement ductility capacity of hollow steel piles may also be defined as ⎛ Lp ⎞⎛ Lp ⎞ Δ 1 3(μφ −1)⎜ ⎟⎜1− 0.5 ⎟ (7.1)μ + L L⎝ ⎠⎝ ⎠ The MOTEMS does not explicitly provide guidelines for selecting length of the plastic hinge for hollow steel piles. Based on calibration of results from finite element analysis against those from Equation (7.1) (see results presented later in Figure 7.1), it was found that the following plastic hinge lengths are appropriate for the two seismic design levels for hollow steel piles in Marine Oil and LNG Terminals: Lp 0.03L for Level 1 (7.2a) Lp 0.075L for Level 2 (7.2b) 33
  • 45. With the plastic hinge length selected as given by Equations (7.2(a) and 7.2(b)), Equation (7.1) simplifies to μΔ = 0.9113+ 0.0886μφ for Level 1 (7.3a) μΔ = 0.7834 + 0.2166μφ for Level 2 (7.3b) As noted previously for reinforced concrete piles, Equations (7.3(a) and 7.3(b)) for displacement ductility capacity of hollow steel piles also indicates that the displacement ductility capacity is independent of the pile length and it can be computed directly from the section curvature ductility capacity. Because the plastic hinge length differs for the two design levels, the displacement ductility also depends on the seismic design level. 7.2 EVALUATION OF SIMPLIFIED EQUATIONS FOR DUCTILITY CAPACITY The accuracy of Equations (7.3(a) and 7.3(b)) in estimating displacement ductility capacity of hollow steel piles at seismic design Level 1 and Level 2, respectively, is evaluated in this section. For this purpose, displacement ductility capacity of hollow steel piles is evaluated from nonlinear static pushover analysis of a finite element model. The pile is considered to be fixed at top and bottom. These boundary conditions correspond to a pile that is connected to the pile-cap with a full-moment connection that would force formation of a plastic hinge in the steel pile, and utilizes the equivalent displacement fixity assumption at the bottom. The axial load on the pile is assumed to be 0.05Afy in which A is the cross section area of the pile and f is the yieldy strength of steel. The pile wall thickness is assumed to be 1.27 cm. The pile is modeled with a nonlinear beam-column element using the computer program “Open System for Earthquake Engineering Simulation (OpenSees)”, (McKenna and Fenves, 2001). The distributed plasticity is considered by specifying the section properties by a fiber section model and the using seven integration points along the element length; details of such modeling may be found in McKenna and Fenves (2001). Strains in steel are monitored during the pushover analysis. The limiting values of strain in steel are 0.008 and 0.025 for Level 1 and Level 2, respectively for in-ground or pile-deck hinge formation. The displacement ductility at a selected design level corresponds to the largest displacement that can occur at the tip of the pile without the strain limit in steel being exceeded. 34
  • 46. The results are presented in Figure 7.1 for three pile diameters – 61 cm, 91 cm, and 107 cm. These results permit two important observations. First, results from the nonlinear finite element analysis confirm expectations from Equation (7.3(a) and 7.3(b)) that the displacement ductility capacity is independent of the pile length. This becomes apparent by essentially no variation in the ductility capacity from the nonlinear finite element analysis with the various pile lengths in Figure 7.1 for both design levels and all pile diameters. (a) Level 1 (b) Level 2 2 4 Pile Dia.= 61 cm Pile Dia.= 61 cm 1.8 μμμ Δ1,IGorPDΔ1,IGorPDΔ1,IGorPD μμμ Δ2,IGorPDΔ2,IGorPDΔ2,IGorPD 3 1.6 1.4 Level 2 (Eq. 7.3b) 2 Level 1 (Eq. 7.3a) NLFEA1.2 1 1 2 4 Pile Dia.= 91 cm Pile Dia.= 91 cm 1.8 1.6 1.4 3 2 1.2 1 1 2 4 Pile Dia.= 107 cm Pile Dia.= 107 cm 1.8 1.6 1.4 3 2 1.2 1 1 0 10 20 30 40 50 0 10 20 30 40 50 Pile Length, m Pile Length, m Figure 7.1. Displacement ductility capacity from simplified equations and nonlinear finite element analysis (NLFEA) for seismic design (a) Level 1 and (b) Level 2. Second, Equations (7.3(a) and 7.3(b)) provide very good estimates of the displacement ductility capacity of hollow steel piles at seismic design Level 1 (see Figure 7.1(a)) and Level 2 (see Figure 7.1(b)), respectively. If Equation (7.3(b)) were to be used to estimate, displacement 35
  • 47. ductility capacity at seismic design Level 1, it would provide an estimate that significantly exceeds the value from nonlinear finite element analysis (see Figure 7.1(a)). Therefore, a lower value of the plastic hinge length, as has been used in Equation (7.3(a)) for seismic design Level 1 is justified. These results indicate that the moment-rotation relationship to be used in the concentrated plasticity model of hollow steel piles should consider different plastic hinge lengths for the two design levels. If the same plastic hinge length, i.e., that for seismic design Level 2, is used in the model that computes the displacement ductility capacity for Level 1, it may significantly overestimate the displacement capacity for that design level (Level 1). It is useful to note that the plastic hinge length for hollow steel piles in this investigation is proposed based on calibration against nonlinear finite element results. It would be useful to verify these findings from experiments on hollow steel pile conducted at displacement levels that are expected during seismic design Level 1 and Level 2. (a) Level 1 (b) Level 2 2 4 NLFEA: Pile Dia. 1.8 61 cm μ Δ1,IGorPD 91 cm 107 cm1.6 1.4 μΔ2,IGorPD 3 2 1.2 1 1 0 10 20 30 40 50 0 10 20 30 40 50 Pile Length, ft Pile Length, ft Figure 7.2. Variation of displacement ductility capacity computed from nonlinear finite element analysis (NLFEA) with pile length and pile diameter: (a) Level 1, and (b) Level 2. 7.3 SENSITIVITY OF DISPLACEMENT DUCTILITY TO PILE PARAMETERS 7.3.1 Pile Length and Pile Diameter Figure 7.2 presents variation of displacement ductility capacity with pile length for three values of pile diameters: 61 cm, 91 cm, and 107 cm. The results are presented for piles with wall thickness of 1.27 cm. Results in Figure 7.2 indicate that the displacement ductility capacity of piles is essentially independent of the pile length. This is expected because Equations (7.3(a) and 7.3(b)) becomes independent of the pile length. The results of Figure 7.2 also indicate that the 36
  • 48. displacement ductility capacity of the pile is also essentially independent of the pile diameter as apparent from almost identical curves for the three pile diameters considered. In order to understand the aforementioned trend, i.e., independence of the displacement ductility capacity of pile diameter, it is useful to examine the variation of pile section curvature ductility capacity. The results presented in Figure 7.3 indicate that the section curvature ductility capacity is essentially independent of the pile diameter. This observation, along with Equations (7.3(a) and 7.3(b)), then confirms that the pile displacement ductility capacity should also be independent of the pile diameter. (a) Level 1 (b) Level 2 6 20 15 μ φ1,IGorPD 4 2 μφ2,IGorPD 10 5 0 0 50 70 90 110 50 70 90 110 Pile Diameter, cm Pile Diameter, cm Figure 7.3. Variation of section curvature ductility capacity with pile diameter: (a) Level 1, and (b) Level 2. 7.3.2 Pile Wall Thickness The effects of the pile wall thickness on the displacement ductility capacity are examined next. For this purpose, variations of displacement ductility with pile length for three values of pile thickness are compared in Figure 7.4. The results presented are for a pile with 91 cm diameter and axial force equal to 0.05Afy . These results show that the displacement ductility is essentially independent of the pile wall thickness as indicated by essentially identical curves for the three values of pile wall thickness. 37
  • 49. (a) Level 1 (b) Level 2 2 4 NLFEA: Wall Thickness 1.8 1.27 cm Δ1,IGorPD 2.54 cm 3.81 cm1.6 1.4 Δ2,IGorPD 3 2 μ μ 1.2 1 1 0 10 20 30 40 50 0 10 20 30 40 50 Pile Length, ft Pile Length, ft Figure 7.4. Variation of displacement ductility capacity computed from nonlinear finite element analysis (NLFEA) with pile length for three values of pile wall thickness: (a) Level 1, and (b) Level 2. 7.3.3 Axial Force Figure 7.5 presents variation of displacement ductility capacity with axial force in the pile. The presented results are for a pile with 91 cm diameter and 15 m length with values of axial force varying from zero to 0.2Afy . These results show that the displacement ductility for Level 1 is essentially independent of the pile axial load (Figure 7.5(a)). For Level 2, while the displacement ductility may depend on the axial load for very-low axial loads, it becomes essentially independent of the axial load for more realistic values. However, the ductility for Level 2 appears to be insensitive to the axial force values, i.e., axial loads greater than 0.05Afy (Figure 7.5(b)). (a) Level 1 (b) Level 2 2 4 1.8 Δ1,IGorPD Δ2,IGorPD 3 1.6 1.4 2 μ μ 1.2 1 1 0 0.05 0.1 0.15 0.2 0 0.05 0.1 0.15 0.2 Pile Axial Force/(Afy ) Pile Axial Force/(Afy ) Figure 7.5. Variation of displacement ductility capacity computed from nonlinear finite element analysis with pile axial load ratio: (a) Level 1, and (b) Level 2. 38
  • 50. 7.4 LOWER BOUND OF DISPLACEMENT DUCTILITY CAPACITY The results presented so far indicate that the displacement ductility of hollow steel piles is relatively insensitive to pile length, pile diameter, pile wall thickness, and pile axial load. Therefore, the displacement ductility appears to be a very robust parameter that can be used in simplified design of piles instead of the various axial strain limits which are currently specified in the MOTEMS. While the displacement ductility may be related to the pile curvature ductility using Equation (7.3), the results presented in the preceding section also indicate that a lower bound of the member displacement ductility capacity may be estimated without any knowledge about the section curvature ductility capacity for practical range of various parameters. The results presented in Figure 7.6 for pile-deck hinge indicate that the displacement ductility capacity may be limited to 1.2 for seismic design Level 1 and 2.75 for seismic design Level 2. 1 1.2 1.4 1.6 1.8 2 μ Δ1,IGorPD (a) Level 1 μΔ = 1.2 Pile Dia. 61 cm 91 cm 107 cm 1 2 3 4 μΔ2,IGorPD (b) Level 2 μΔ = 2.75 0 10 20 30 40 50 0 10 20 30 40 50 Pile Length, m Pile Length, m Figure 7.6. Lower-bound value of displacement ductility capacity of hollow steel piles for seismic design (a) Level 1, and (b) Level 2. 7.5 SIMPLIFIED PROCEDURE TO COMPUTE DISPLACEMENT CAPACITY Displacement capacity of piles at a selected design level may be estimated from Δc = μΔΔy (7.4) in which μΔ is the ductility capacity at a selected design level, i.e., equal to 1.2 for Level 1 design and 2.75 for Level 2 design, and Δy is the yield displacement of the pile. The yield displacement can be computed from nonlinear pushover analysis of the pile. Alternatively, the yield displacement may be computed based on section properties. For example, the yield displacement of a pile that is fixed at the bottom and prevented from rotation at the top due to 39
  • 51. rigid deck may be estimated from 2 Δ = M yL (7.5)y 6EI and yield displacement of a cantilever may be estimated from 2 M L Δ = y (7.6)y 3EI in which M y is the effective section yield moment that can be estimated from section moment- curvature analysis and I is the section moment of inertia that can be estimated from the section properties, and E is the modulus of elasticity for steel. The accuracy of the approximate procedure to estimate the displacement capacity of piles is evaluated next. For this purpose, the approximate displacement capacity is computed first from Equation (7.4) by utilizing the yield displacement from Equation (7.5) or (7.6) depending on the boundary conditions. The exact displacement capacity is computed next from Equation (7.4) but with yield displacement estimated from nonlinear the static pushover analysis of the pile. For both cases, value of the ductility capacity obtained from the pushover analysis is used. The approximate and exact displacement capacities are compared in Figure 7.7 for a pile with 91 cm diameter. These results indicate that the approximate analysis provides an excellent estimate of the displacement capacity of the pile for Level 1 as well as Level 2 design. (a) Level 1 (b) Level 2 5 8 Exact Approximate4 3 Δ,m1,IGorPD Δ,m2,IGorPD 6 4 2 0 10 20 30 40 50 2 1 0 0 0 10 20 30 40 50 Pile Length, m Pile Length, m Figure 7.7. Comparison of displacement capacities from exact and approximate analyses. The approximate analysis is attractive because it eliminates the need for nonlinear static analysis of the pile. However, it must be noted that the approximate analysis may only be used 40
  • 52. for the soil-pile-deck system that can be idealized either by a fixed-fixed column or by a cantilever column – the two cases for which closed form solutions to estimate yield displacement are available (see Equations 7.5 and 7.6) – using equivalent displacement fixity concept. For other cases, the yield displacement may have to be estimated from nonlinear static pushover analysis of the soil-pile-deck system. 41
  • 53. 8. DISPLACEMENT CAPACITY OF PILES WITH DOWEL-CONNECTION Piles are often connected to the deck using dowels. The size and number of dowel bars are typically selected so that the moment capacity of the connection is smaller than the moment capacity of the pile. As a result, the yielding is expected to occur in the connection rather than the pile. The nonlinear behavior of piles with such partial-moment connection to the deck slab may differ significantly compared to the piles with full-moment connections presented in the previous chapters. This chapter describes two types of dowel-connections – hollow steel piles connected to the deck by a concrete plug and dowels, and prestressed concrete piles connected to the deck by dowels grouted into the pile and embedded in the deck concrete. Subsequently, nonlinear behavior of such connections is examined. Finally, closed form solutions for estimating displacement capacity of piles with partial-moment connections are presented. 8.1 DOWEL-CONNECTIONS 8.1.1 Hollow Steel Piles Figure 8.1 shows details of the connections between a hollow steel pile and the concrete deck of a Marine Oil or LNG Terminal. In this connection, denoted as the concrete-plug connection, dowels are embedded in a concrete plug at the top of the pile. The concrete plug is held in place by shear rings at its top and bottom; the shear rings would prevent the concrete plug from slipping out (or popping-out) during lateral loads imposed by earthquakes. Others have proposed details in which the concrete plug is held in place either by natural roughness of the inside surface of the steel shell or use of weld-metal laid on the inside of the steel shell in a continuous spiral in the connection region prior to placing the concrete plug (Ferritto et al., 1999). The dowels are then embedded in the concrete deck to provide sufficient development length. A small gap may or may not be provided between top of the pile and top of the concrete plug. This concrete-plug connection has been shown to provide remarkable ductility capacity of hollow steel piles (Priestley and Park, 1984; Park et al., 1987). The force transfer mechanism between the steel pile and the concrete plug has also been investigated by Nezamian et al. (2006). 42
  • 54. Steel Pipe Pile Concrete Plug Shear Rings Deck Dowel Figure 8.1. Concrete-plug connection between hollow steel pile and concrete deck. 8.1.2 Prestressed Concrete Piles Figure 8.2 shows details of the connections between a prestressed pile and the concrete deck of a Marine Oil or LNG Terminal (Klusmeyer and Harn, 2004; Wray et al., 2007; Roeder et al., 2005). Prestressed piles typically have corrugated metal sleeves that are embedded in the concrete. These sleeves are located inside of the confined concrete core formed by the prestressing strands and confining steel. Once the prestressed pile has been driven to the desired depth, the dowels are grouted into the sleeves. If higher flexibility of the connection is desired, a small portion of the dowel at the top of the pile may be wrapped in Teflon to ensure de-bonding between the dowel and the grout. The dowels are then embedded in the concrete deck to provide sufficient development length. Note that Figure 8.2 shows only two outermost dowels; the other dowels are not shown to preserve clarity in the figure. Prestressed Concrete Pile Deck Dowel De−Bonded Dowel Grouted Sleeve Figure 8.2. Dowel-connection between prestressed concrete pile and concrete deck. 43
  • 55. 8.1.3 Behavior of Dowel-Connection While analyzing Marine Oil and LNG Terminal structures, nonlinear behavior of pile and connection is typically represented by moment-rotation relationships. The moment-rotation relationship is developed based on the assumption of a plane section remaining plane and a perfect bond between the steel reinforcing bars and concrete. For the concrete-plug connection between hollow steel piles and deck or the dowel-connection between a prestressed pile and deck; however, such assumptions may not be valid. In particular, the pile in a such connection rotates about a small area on compression side of the pile forming a gap between the top of the pile and the deck on the tension side of the pile (see Figure 8.3). This behavior is akin to the pile acting like a crowbar bearing on a small compression area. This behavior leads to de-bonding of the dowel (or strain penetration) on each side of the joint. Additional de-bonding may also occur in the dowel over the portion that is intentionally wrapped in Teflon. Lsp Figure 8.3. Behavior of piles with concrete-plug or dowel-connection. 8.2 MOMENT-ROTATION RELATIONSHIP OF DOWEL-CONNECTION Bob Harn and George Sheng of Berger/ABAM Engineers Inc recently proposed a simple analytical model for developing nonlinear moment-rotation behavior of concrete-plug connections for hollow steel piles (see Figure 8.4) or dowel-connections for prestressed piles (see Figure 8.5). For a selected value of the reinforcing bar yield stress, fy , concrete strength, fc ' , diameter and area of reinforcing bars, dbi and Asi , respectively, bearing strength of deck concrete against pile concrete as fm ' =1.7 fc ' , and bearing strength of deck concrete against steel shell of hollow steel pile as fm ' = 5.6 fc ' , the moment-rotation relationship is developed as 44