1. Joseph I. Esformes, Marco V. Narici and Constantinos N. Maganaris
Centre for Biophysical and Clinical Research into Human Movement
Manchester Metropolitan University
Alsager ST7 2HL, United Kingdom
HUMAN MUSCLE VOLUME ESTIMATION USING
ULTRASONOGRAPHY
Introduction
Information about the volume of a muscle is crucial when assessing the muscle’s power-
producing potential. Magnetic resonance imaging (MRI) has often been used to estimate
human muscle volume in vivo (e.g. Maganaris et al. 2001; Fukunaga et al. 1992). This method
has been validated through comparisons with phantoms of known volume and it is now
considered as being the “gold standard” for assessing the validity of other methods
(Mitsiopoulos et al. 1998; Miyatani et al. 2000). Another imaging tool often used for muscle
morphometry is ultrasonography (ULT). Like MRI, ULT distinguishes muscle from fat and
does not involve exposure to ionising radiation. Moreover, it is cheaper than MRI, portable
and more widely available.
Aim
The aim of the present study was to examine the applicability of ULT for estimating human
muscle volume.
Methods
The volume of the human tibialis anterior muscle was estimated in vivo by ULT and by MRI in
three healthy males and three healthy females (age: 23±3 yrs., height: 175±8 cm and body
mass: 70±6 kg; means±SD; n=6). In either method, 11 axial scans were taken along the
muscle belly of the left leg, from the origin to the insertion of the muscle. To avoid tissue
compression in the ULT measurements, all sonographs were taken without touching the
scanning probe on the skin, with the lower leg immersed in a water-filled container (Fig. 1).
Fig. 1. Sonographs taken without touching the skin, with the lower leg
immersed in a water-filled container.
In each scan, the muscle’s cross-sectional area was traced and digitized using computerized
image analysis. Examples of MRI and ULT axial-plane scans are shown in Fig. 2. Muscle
volume was calculated by treating the muscle as a series of truncated cones. The volume V
of the muscular portion between every two consecutive scans was therefore calculated from
the equation:
To assess the reproducibility of ULT, each subject was scanned twice, 5 min apart. All images
were taken after 20-30 min of rest to avoid fluid shifts that might induce interstitial and/or
intracellular changes (Berg et al. 1993).
Results
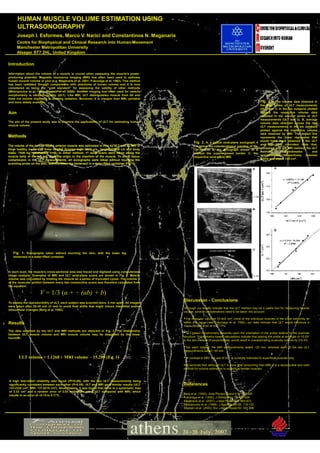
The data obtained by the ULT and MRI methods are depicted in Fig. 3. The relationship
between ULT muscle volume and MRI muscle volume may be described by the linear
function:
A high test-retest reliability was found (R2=0.99), with the two ULT measurements being
significantly correlated between each other (P<0.05). ULT and MRI gave similar results (ULT:
133.2±20 cm3; MRI: 131.8±18 cm3). Nevertheless, it was found that there is a systematic bias
of 3.33 cm3 and a random error of 3.53 cm3 when using ULT compared with MRI, which
results in an error of –0.15 to 5.17%.
ULT volume = 1.1268 MRI volume 15.285 (Eq. 1)
Fig. 2. A, a typical axial-plane sonograph 4
cm below the osteotendinous junction of the
TA muscle. B, the sonograph shown in A
without the superimposed border. C, the
respective axial-plane MRI.
Discussion - Conclusions
Although our results indicate that the ULT method may be a useful tool for measuring muscle
volume, several considerations need to be taken into account:
• For muscular volumes 70-400 cm3 (most of the individual muscles of the lower extremity lie
within this range; see Fukunaga et al. 1992), our data indicate that ULT would introduce a
measurement error of only ~7%.
• ULT-based morphometry depends upon the orientation of the probe relative to the scanned
structure. Trigonometry-based calculations indicate that placing the probe at an angle of 10-20o
to the skin instead of perpendicular, would result in overestimating muscular volume by 2-6.5%.
• For each subject, the MRI measurements lasted ~20 min, whereas each of the two ULT
measurements lasted ~45 min.
• In contrast to MRI, the use of ULT is currently restricted to superficial muscles only.
We conclude that, although ULT is more time consuming than MRI, it is a reproducible and valid
method for volume estimation in superficial human muscles.
References
Berg et al. (1993). Acta Physiol Scand 418: 379-385
Fukunaga et al. (1992). J Orthop Res 10: 926-934
Maganaris et al. (2001). J Appl Physiol 90: 865-872
Mitsiopoulos et al. (1998). J Appl Physiol 85: 115-122
Miyatani et al. (2000). Eur J Appl Physiol 82: 391-396
Fig. 3. A, the volume data obtained in
the first series of ULT measurements
(ULT test 1) in the six subjects plotted
against the respective volume data
obtained in the second series of ULT
measurements (ULT test 2). B, average
volume data obtained across the two
ULT measurements in the six subjects
plotted against the respective volume
data obtained by MRI. The dotted line
represents the linear regression that
would have been obtained if the ULT
and MRI data coincided. Note that,
compared with the MRI method, the ULT
method underestimates and
overestimates, respectively, volumes
below and above 120 cm3.
V = 1/3 (α + (αb) + b)