SlideShare a Scribd company logo
1 of 14
Download to read offline
39
OCCURRENCE OF URANIUM BEARING MINERALS IN UM SAFI
PYROCLASTICS, CENTRAL EASTERN DESERT, EGYPT.
Ibrahim, M. E.*
, Attawiya, M. Y.*
, Osman, A. M.**
and Ibrahim, I. H.*
*
Nuclear Materials Authority, Cairo, Egypt.
**
Ain Shams University, Cairo, Egypt.
ABSTRACT:
Um Safi rhyolite (USR) and associated pyroclastic rocks form relatively moderate to high relief (615m) extruded
volcanoclastic and volcano-sedimentary association, serpentinites and ortho-amphibolites with Knife sharp
contact, forming small oblate body striking NW-SE, covering about 0.3 km2
. These rocks show different degrees
of subsoildus autometasomatic processes; argillization, greisenization, silicification, hematitization and
fluoritization. USR is originated by a combination of fractional crystallization of lithospheric source and crustal
contamination, whereas the magma was extruded at active continental margin environment
Um Safi pyroclastics (USP) comprise agglomerates and laminated tuffs. The coarsers (agglomerates) show
fragmental structure at the base of rhyolite extrusion whereas the finer laminated tuffs show contorted bands
(0.5-1 cm) of differing shades and occur upward direction. The pyroclastics were erupted with explosive
violence as a turbulent mixture of hot, expanding gases and gas-emitting lava fragments at relatively low
pressures. The pyroclastics could be considered as a good trap for secondary uranium and U-bearing minerals.
The base metal minerals (pyrite, arsenopyrite and corondite) are formed in the deeper part of the epithermal
zone. In the next zone to the top where ascending solutions rise further towards the surface and mingled with the
descending meteoric water, precipitation of secondary uranium mineral (kasolite) and U-bearing minerals
(plumbobetafite, columbite and betafite) occur as a function of oxidation and failing temperature.
Keywords: Um Safi – uranium bearing minerals - pyroclastics.
1. INTRODUCTION
Um Safi volcanic rocks were mapped previously as
felsite by several workers (Akaad and El Ramly,
1963; El Ghawaby, 1966; Akaad et al., 1996;
Abdalla, 2001). Radioactive mineralization of
columbite, uranothorite and zircon were recorded as
fracture filling in the sheared parts of the felsite
rocks at Um Safi (El Ghawaby, 1966). Abdalla
(2001) considered Um Safi as subvolcanic
equivalent for the metaluminous alkali rare metal
granites and is belonging to the post-collision and
orogenically related A2-type granites with only
zircon and uranothorite as radioactive minerals. Um
Safi granitoids (southern part of the studied area)
are composed of a succession of metaluminous
calc-alkaline (older granitoids) and metaluminous
to peraluminous sub-alkaline sub-leucogranites
(younger granites) emplaced during three
successive tectonic events (Ibrahim et al., 2001).
The shear zone (N-S) in muscovite sub-
leucogranites (1.5 km south USR) is considered as
a good trap for uranium mineralizations (zippeite
and beta-uranophane). This work is a contribution
to the understanding of geology, geochemistry and
genesis of secondary uranium and uranium-bearing
mineralization in USP.
2. GEOLOGIC SETTING AND
PETROGRAPHY
USR form relatively moderate to high relief (615m)
extruded the volcano-sedimentary association
(slate, phyllite, Banded Iron Formation and schist),
serpentinites and ortho-amphibolites with Knife
sharp contact, forming small oblated body striking
NW-SE, covering about 0.3 km2
(Fig. 1). The
volcanic rocks of Um Safi are successive sheets of
lavas and pyroclastics, the former being dominant.
The bulk composition of lavas is mainly rhyolitic.
The USR are fine-grained, massive and varies in
colours from buff, yellow or even grey and pink
with dark buff in colour. They show locally
porphyritic and fracturing particularly along the
marginal parts of the extrusion. These rocks show
different degrees of alteration, hematitization,
kaolinitization and silicification so that the colour
sometimes is reddish brown or dark brown due to
the presence of considerable iron oxides and other
opaque minerals. Fluorite veinlets (1 –3 cm thick,
and up to 2 m long) are common through
pyroclastics and made up of violet, green and black
fluorite, quartz and calcite. Quartzification is
clarified by development of many quartz vein,
veinlets and pods in decreasing order. They
crosscut the USR body at its northern part. Some
Egyptian Journal of Geology, v. 46/1, 2002, pp. 39-54
40
quartz veins contain pyrite and arsenopyrite.
Hematitization is manifested by change of USR
colour into red to brown especially along fractures
due to the presence of impregnation of iron oxide.
The USR are invaded by N-S sub-vertically
greisenized microgranite, which shows exfoliated
and cavernous.
The USP consist of detrital materials expelled from
rhyolite volcanics, transported aerially and
deposited upon land surface in lakes or in marine
waters (Heinrich, 1956). They comprise
agglomerates and laminated tuffs. The coarse-
grained agglomerates show fragmental structure at
the base of rhyolite extrusion (0.5-2 m above Wadi
level) whereas the finer-grained laminated tuffs
exhibit contorted bands of differing shades and
occur upward direction (1.5 – 3 m). The
pyroclastics and greisen rocks gain importance due
to their high intensities of radioactivity (114-280
ppm eU and 167-1133 ppm eTh respectively) (Fig.
2). Visible non-radioactive minerals are observed
such as pyrite, arsenopyrite and manganese oxides
or dendrites, as well as, violet fluorite and metallic
black veinlets (N-S trend).
A- Rhyolite is extrusive holocrystalline to
hypocrystalline with aphanitic matrix. The rock is
hard, massive and light coloured. They are often
banded with flow structures, which may appear as
coloured bands strips or lines of spherulites and
spherulitic textures. Breccias, tuffs and welded tuffs
are often associated. They are composed of quartz
and alkali potash feldspars (sanidine) embedded in
cryptocrystalline groundmass and consist of quartz,
sanidine and secondary muscovite. The common
accessories are opaques, apatite and zircon.
Quartz occurs as phenocrysts (0.7×1.2 mm) and
fine-grained groundmass in the matrix. The matrix
quartz is either fine-grained, or intergrown with
alkali feldspar in a complex pattern. Some quartz
forms aggregate of tiny plates and spherulites,
which composed of radiating fibres of feldspar and
cristobalite (Moorhouse, 1959).
Potash feldspar occurs either as subhedral to
anhedral phenocrysts (0.5×0.8 mm) or as fine-
grained groundmass in matrix. Phenocrysts
(sanidine and microperthite) are usually clear and
may be untwinned or twinned according to the
Carlsbad low, sometimes exhibit corrosion effects
due to corrosion by the matrix. Also radial
spherulitic texture appears from central elongated
microperthite phenocrysts. The common alteration
products are kaolinite, sericite and calcite.
Muscovite occurs either as anhedral fine-grained
crystals in groundmass due to alteration products of
potash feldspars, or as veinlets crosscut the other
constituents.
Opaques occur as anhedral crystals or small
veinlets associated with fluorite. Epidote occurs as
small aggregates associated with opaques and
fluorite. Fluorite varies in colours from colourless
to pale violet through deep violet or black. It
usually occurs as small veinlets associated with
opaque minerals. Apatite, allanite and zircon are
present as individual euhedral crystals enclosed
within quartz and feldspar.
B- Pyroclastics are well banded, reddish grey in
colour and composed mainly of crystals and rock
fragments in fine-grained groundmass. The coarser
agglomerates are not well represented for thin
section studies, except forming fine-grained matrix
they may possess. According to Schmid (1981) the
pyroclastics can be classified into fine crystal tuffs
and crystal lithic tuffs.
i. Fine crystal tuffs are fine-grained, laminated or
banded and composed of more than 50% crystal
fragments of quartz, feldspars and epidote set in a
fine-grained matrix of quartz and potash feldspars.
ii. Crystal lithic tuffs are composed of lithic
fragment of rhyolite and quartzite, as well as, sub-
angular to subrounded crystal fragments of quartz
and perthite embedded in fine-grained groundmass
of the same mineral composition. Quartz crystals
are strongly fractured, probably owing to
compaction and cooling of the glass matrix
(Williams and Mc Birnery, 1979). Perthite crystals
sometimes show one side with a crystal face and
elsewhere show irregular or fractured edges. Other
perthite crystals are rounded or irregularly embayed
indicating a high temperature of the environment of
deposition. Ferromagnesian minerals are altered
and commonly bent.
3. GEOCHEMISTRY
3.1. Methodology
Seven samples from fresh volcanics and five
samples from altered rock, as well as, two samples
from greisen were analyzed in the laboratories of
the Nuclear Materials Authority for major elements
by the wet chemical and atomic absorption (with <
1 % error). Some trace elements are determined
using the X-ray fluorescence technique (with 1-5 %
error). The data of chemical analyses and CIPW
normative values are given in Tables 1 and 2. Two
samples from pyroclastic and greisenized rocks
were crushed and their heavy minerals were
separated using Frantz isodynamic separator and
bromoform. XRD and EDAX-SEM techniques
were used for mineral separation by hand picking
under the binocular microscope.
3.2. Fresh Samples
41
The average chemical composition of the studied
fresh volcanic rocks is compared with the average
corresponding published Egyptian and World
rhyolite rocks (Table 3). Generally the values of
major oxide compositions of USR fall between the
corresponding values of the Egyptian and World
rhyolites. It contains nearly similar values of SiO2,
Al2O3, MgO, K2O, CaO and P2O5 with less Fe2O3
and Na2O contents compared with the Egyptian
rhyolite that given by Aly and Moustafa (1984).
Cox et al., (1979) used the total alkalis versus silica
diagram (Fig. 3) for the geochemical classification
of the volcanic rocks. The data points of the studied
fresh volcanic rocks fall in the rhyolite field.
Miyashiro and Shido (1975) proposed the Cr-
FeOt
/MgO and Ni- FeOt
/MgO discrimination
diagrams to identify island arc volcanic rocks
through the behavior of Cr and Ni with advancing
fractional crystallization of basaltic magma. The
plots of the examined rhyolite on these diagrams
(Figs. 4&5) show that, they fall mostly within the
island arc and continental margin tectonic setting.
The normalized values of the studied rhyolite rocks
relative to MORB (Hofmann, 1988) are given in
(Fig. 6a). It shows a strong enrichment in all
compatible elements except Sr due to the effects of
assimilation of either crustal materials or oceanic
matter. In comparison with normalized values
related to the bulk continental crust (Hofmann,
1988), the plot in (Fig. 6b) shows that rhyolite is
enriched in Rb, Ba, Zr and Y and depleted in Sr and
Nb, suggesting a significant role of crustal
contamination.
3.3. Altered Samples
According to the normative Q-Ab-Or compositions, the
altered samples could be classified as sodic,
potassic, silicic and greisen as shown in Fig. (7)
after Stemprok (1979). Two altered samples lie
below the granitic eutectic temperature and exhibit
a trend corresponding to crystallization in high PH2O
range (the range is from 0.5 to 3 k bar after Winker
et al., 1975 and closely parallel to the sodic trend).
The other altered samples lie in silicic trend. The
greisenized samples fall close to the greisen trend.
The Na-K variations diagram after (Cuney et al.,
1989) shows five alteration types; Na-
metasomatism, K-metasomatism, silicification,
desilicification and argillization. On figure (8)
argillization and silicification are the main
alteration processes affected the investigated
samples.
Figures (9 a&b) shows that the major oxides of the
altered samples suffered enrichment in MgO, MnO,
CaO, Fe2O3, P2O5, and SiO2 and depletion in K2O,
Na2O, FeO, Al2O3 and, TiO2, than fresh rhyolite
samples, while the trace elements of the altered
samples display enrichment in Th, U, Nb and Zn
and also show depletion in Rb, Ba, Ni, Pb and V
than fresh rhyolite samples.
3.4. Distribution of eU and eTh
The eU-content in fresh rhyolite ranges from 17 to
34 ppm with an average 26 ppm, and the eTh-
content ranges from 32 to 75 ppm with an average
50 ppm, while the eTh/eU ratio is equal 1.9 (Table
4). The eU and eTh values of USR are greater than
values of acidic effusive rocks of Adams et al.,
(1956) while their eTh/eU ratios are lower than
those reported, indicate to uranium enrichment
rather than thorium.
The field radiometric measurements localized three
radioactive anomalies, two within pyroclastics
(includes one tunnel and eleven trenches were
dugged by nuclear materials authority since 1964)
and one within greisenized microgranite.
a- The first one is represented by only one tunnel
(about 1.5 m in width and 6 m in length), which
considered as one of the highst radioactive zones.
The mineralized joint sets in the tunnel strike ENE-
WSW and NE-SW. Kaolinitized, sericitized and
argillized products of USP contain the higher
radioactive values with violet fluorite. The eU-
content ranges from 53 to 563 ppm with an average
of 285 ppm, whereas the eTh-content ranges from
236 to 2229 ppm with an average of 1133 ppm. The
eTh/eU ratio ranges from 2.8 to 4.71 with an
average of 3.9 (Table 4).
b- The second anomaly is represented by trenches.
It is clear that the common mineralized joints,
striking ENE-WSW and NE-SW. The alteration
product; ferrugenation, Mn-dendrites and oxidized
with oxidized sulphide crystals support the
hydrothermal effect. The eU-content (ranges from
132 to 335 ppm with an average of 236 ppm), is
less than the eTh-content (ranges from 157 to 1188
ppm with an average of 905 ppm). The eTh/eU
ratio ranges from 0.5 to 5.8 with an average of 4.1
(Table 4), which is related to mobilization and
redistribution of uranium.
c- The third anomaly is close to greisenized
microgranite, which trend N-S to N20ºE-S20ºW
directions. It is characterized by brownish to
reddish colour (due to ferrugenation) ranging from
4 to 5 m thick and rich by vugs due to oxidized
cubic sulphide crystals. The eU- content (ranges
from 101 to 125 ppm with an average of 114 ppm)
is less than eTh-content (ranges from 161 to 172
ppm with an average of 167 ppm). The eTh/eU
ratio ranges from 1.33 to 1.61 with an average of
1.48 (Table 4).
42
4. MINERALIZATIONS
The mineralizations in Um Safi pyroclastics can be
classified into five categories; 1) U-bearing
minerals (columbite, plumbobetafite and betafite),
2) secondary U-mineral (kasolite), 3) thorium-
bearing minerals (uranothorite and yttrialite), 4)
base-metal minerals (pyrite, arsenopyrite,
cassiterite and corondite) and 5) accessory minerals
(zircon, allanite and fluorite).
i) Columbite [(Fe,Mn)(Nb,Ta,U)2O6] is
isomorphous with tantalite, black in colour and is
an ore of niobium as well as a source of tantalum
(Nb/Ta ratio 4.9). The columbite of Um Safi (Fig.
10a) is radioactive due to presence of moderate
UO2 and ThO2 contents (16.7% and 13.3%
respectively).
ii) Plumbobetafite [(Pb,Ca,U)(Nb,Ti)2O6(OH,F)]
confirmed by EDAX (Fig. 10b). The mineral is
composed mainly of TiO2 (41.3%) and Nb2O5
(20.1%) while UO2 and ThO2 are not common
(1.7% and 2.1% respectively).
iii) Yttrialite [(Y,Th)2Si2O7] is olive-green mineral.
Semi-quantitative analyses (Fig. 10c) indicate that,
it has ThO2 (41.1%) more than Y2O3 (14.3%) and
SiO2 (26.0%).
iv) Uranothorite [(Th,U)O2] is confirmed by
EDAX (Fig. 11a) and contains 40.65% ThO2,
14.0% UO2, 12.0% Y2O3 and 16.0 % SiO2.
v) Arsenopyrite (FeAsS) occurs as silver-white to
steel-grey colour. it is isomorphous with loellingite
mineral and constituting the principle ore of
arsenite. Semi-quantitative analyses of picked
grains were using the EDAX-SEM technique
(Fig.11b ) gives 37.3% As, 35.1% Fe and 25.0% S.
vi) Coronadite (PbMn6O14) is black mineral
associated with iron oxides in ferruginated
pyroclastics (trenches). Semi-quantitative analyses
of picked grains were obtained using the EDAX-
SEM technique (Fig.11c). It contains 67.8% MnO
and 21.5% PbO2 with Pb/Mn ratio equal to 3.2.
vii) Betafite [(Ca,Na,U)2(Ti,Nb,Ta)2O6.(OH)]
occurs as radiated black mineral associated with
quartzo-feldspathic groundmass in pyroclastics
(Fig. 12a).
viii) Kasolite [Pb(UO2)SiO4.H2O] shows dark
yellowish brown colour with radiated or fan likes
shape under Crossed Nicol and considered as
secondary uranium minerals (Fig.12b).
ix) Zircon (ZrSiO4) occurs as euhedral six-sided or
eight-sided form with clusters of opaque inclusions.
It is mainly colourless to pale yellow and associated
with iron oxides and fluorite. Average zirconium
contents is higher in fresh samples (1030 ppm) than
in altered samples (936 ppm). Rankama and
Sahama (1955) stated that thorite is isomorphic
with zircon and it is evident that a large part of
thorium is incorporated in the zircon structure. The
ionic size of zirconium and thorium are not too
unlike and therefore thorium is able to enter the
zircon structure in which it replaces. Two thin
section from greisen were tested for their
radiometrically using SSNDTD type Kodak CN-85
films. The test reveals that zircon in greisen is
radioactivity carrier and show high concentrations
of alpha tracks (Figs. 12c&d).
x) Fluorite (CaF2) minerals possess vitreous luster
and white streak. It is mainly recorded filling
cavities and micro-fractures, which reflect their
secondary origin as resulting from hydrothermal
alteration of rhyolite and/or associated greisen.
Fluorite in USR and greisen samples exhibits a
wide range of colours. Some of them are colourless,
while others are pale rose, pale violet, deep violet
and very deep to blackish violet to black. Some
fluorite grains have various gradations of colours
was separated by hand picking under the
microscope to be tested for their radiometically by
using the Solid State Nuclear Track Detectores
(SSNDTD) type Kodak CN-85 films. This test
reveals that violet and black fluorite grains are
radioactivity carrier and show high concentrations
of alpha tracks (Figs. 12 e&f). Serra (1947) and
Allen (1952) stated that fluorite colour is attributed
to the action of their rare earth elements during the
differentiation of magma or due to the presence of
manganese. Derr et al., (1962) indicated that the
presence of trace and/or rare earth may cause the
different colouration of fluorite. Abdalla (2001)
recorded that Um Safi fluorite is characterized by
considerable enrichment in REE (av. Σ REE = 4179
ppm).
xi) Allanite [(Ce,Ca,La,Y)(Al,Fe)3(SiO4)3.OH] is
brown in colour and pleochroic from pale brown to
dark brown (Fig.12g ). In most cases the allanite
mineral is uranium and thorium carrier but altered
and inverted to an amorphous substance product by
break down of the space lattice by radioactive
emanation (Kerr, 1977).
xii) Cassiterite (SnO2) is a brown or black
tetragonal mineral. It is the principal ore of tin.
They occur in prismatic crystals, massive and form
compact concentric structure (Fig. 12h). Swart and
Moore (1982) suggested that the presence of
coloured zones in the cassiterite crystals is due to
variation in U concentration that range from 0-6
ppm in darker bands.
xiii) Pyrite (FeS2) occurs as well developed cubic
crystals, with pale brass-yellow colour and metallic
luster, often with yellowish brown tarnish
43
associated with goethite. Pyrite occurs either
disseminated in smoky quartz veins or associated
with USP.
xiv) Thorite (ThSiO4) is strongly radioactive
mineral, brown to black tetragonal mineral like
zircon and dimorph with huttonite. It is
isostructural with thorogummite [Th (SiO4)1-X
(OH)4X] and may contains as much as 10%
uranium.
5. SUMMARY AND CONCLUSIONS
The average of eTh/eU ratios are increased from
1.5 in the greisenized microgranite through 1.9 in
the fresh rhyolite to about 4.0 in the pyroclastic
samples (kaolinized and argillite). The lowering of
the eTh/eU ratio indicates redistribution and
localization of secondary uranium mineral
(kasolite). The enrichment of U and Th in
pyroclastics (425-520 ppm eU and 1700-2000 ppm
eTh) may indicate the stabilization of them in late-
to post-magmatic fluids. In the pyroclastics
samples, U and Th are largely incorporated in
uranium bearing-minerals e.g. columbite, yttrialite,
betafite, plumbobetafite and uranothorite. The
higher mobility of U could be retained by Fe- and
Mn-rich solutions and adsorbed by lately deposited
amorphous Fe-oxides and explained its lower Th/U
ratio (Table 2).
The greisen (pneumatolytically altered granitic
rocks) is composed mainly of quartz and mica
(muscovite and sericite) as well as fluorite,
cassiterite, kasolite, allanite, zircon and
arsenopyrite in decreasing order. The lower eTh/eU
ratio (1.6) of greisen rather than tunnel (average
eTh/eU= 3.9) and trenches (average eTh/eU= 4.1)
indicates that the greisen is affected by
hydrothermal-bearing uraniferous solution. The
normal Th/U in the crust is equal to 3.5. So, the
lower ratio may be attributed to the magmatic
activity through the N-S shear zone in muscovite
subleucogranite where their Th/U ratio around 0.2
(Ibrahim et al., 2001).
Kaolinitization, ferrugenation, and argillation
represent the hydrothermal alterations associated
with the high radioactivity values in rhyolites and
greisen. The widespread sericitization through the
rhyolite rocks provides additional evidence of
large-scale movement of solutions through these
rocks. The hexavalent U is ready leached from
rhyolites by dilute acid solutions so some U may
have been transported as UO2(OH)+
and UO2
-
complex
The USP appears to have provided less-welded
layers and lenses. This is coincidence with the
similar observation (Smellie, 1982) described from
Duobblon rhyolitic ignimbrites. The leached U
from solutions percolating through fractures,
fissures and permeable bands were re-deposited and
sink. The pyroclastics were erupted with explosive
violence as a turbulent mixture of hot, expanding
gases and gas-emitting lava fragments at relatively
low pressures. The base metal minerals (pyrite,
arsenopyrite and corondite) are formed in the
deeper part in the epithermal zone. In the next zone
to the top where ascending solutions rise further
towards the surface and mingled with the
descending meteoric water, precipitation of
secondary uranium mineral (kasolite) and U-
bearing minerals (plumbobetafite, columbite,
yttrialite, betafite and uranothorite) occur as a
function of oxidation and failing temperature
6. REFERENCES
Adams, J.A., Osmand, J.K. and Rogers, J.I.W.,
1956, The geochemistry of thorium and
uranium. In: Physics and chemistry of the Earth.
Pergamon Press, New York, v. 3, p. 298-348.
Akaad, M.K. and El Ramly, M.F., 1963, Geology
and structure of Um Lassaf - Um Nar iron belt,
Eastern Desert of Egypt. Geol. Surv. Egypt, No.
17, 23 p.
Akaad, M.K., Noweir, A.M. and Abu El Ela,
A.M., 1996, Geology of Pan-African basement
rocks of the Gabal Al Hadid – Wadi Mubarak
District, E.D., Egypt. Geol. Surv., Egypt. No.73,
78 p.
Allen, R.D., 1952, Variations in chemical and
physical properties of fluorite. Am. Min., v. 37,
p. 901-932.
Aly, M.M. and Moustafa, M.M., 1984, Major
chemistry statistics characterizing common
igneous rocks of Egypt. 9th
Inter. Cong. Stat.
Comp. Sci. Soc. Res., Ain Shams Univ., Cairo.
Abdalla, H.M., 2001, Geochemistry and origin of
rare metal mineralization of Um Safi felsite,
central Eastern Desert, Egypt. Egyptian J. Geol.,
p. 131-149.
Cox, K.G., Bell, J.D. and Pankhurst, R.J., 1979,
The interpretation of igneous rocks. London,
Allen and Unwin, 450 p.
Cuney, M., Leroy, J., Volivezo, A., Daziano, C.,
Gambda, B., Zarco, A.J., Morello, O., Ninci,
C. and Molina, P., 1989, Metallogenesis of the
uranium mineralized Achala granitic complex,
Argentina: comparison with Hercynian
peraluminous leucogranites of Western Europe.
Proc. Tech. Comm. Meetings, Vienna,
TECDOC-543, I.A.E.A., Vienna, p. 211-232.
Deer, W.A., Howie, R.A. and Zussman, J., 1962,
Rock forming minerals. Non silicates, 5,
Longman, London, 371 p.
El Ghawaby, M.A., 1966, Structural and lithologic
controls of localization of radioactive
44
mineralization in a south Qusier area. M.Sc.
Thesis, Ain Shams Univ., Cairo, 100 p.
Heinrich, E.W., 1956, Microscopic petrography.
McGraw-Hill Company, Inc., 295 p.
Hofmann, A.W., 1988, Chemical differentiation of
the earth: The relationship between mantle,
continental crust and oceanic crust. Earth
Planet. Sci., Let., v. 90, p. 297-314.
Ibrahim, M.E., Osman, A.M., Attawyia M.Y.
and Ibrahim I.H., 2001, Petrogenesis of
granitoid rocks and origin of uranium
mineralizations of Um Safi area, Eastern Desert,
Egypt. Egyptian J. Egypt, (in press).
Kerr, P.F., 1977, Optical mineralogy. 4th
Ed.,
McGraw-Hill Book Inc., 492 p.
Le Maitre, R.W., 1976, The chemical variability
of some common igneous rocks. J. Petrol., v.
17, p. 589-637.
Miyashiro, A.A. and Shido, F., 1975,
Tholeiitic and calc-alkaline series in relation
to the behaviors of titanium, vanadium,
chromium and nickel. Am. J. Soc., v. 275, p.
265-277.
Moorhouse, W.W., 1959, The study of rocks in
thin section. Harper and Brothers, New
York, 514 p.
Rankama, k. and Sahama, T.G., 1955,
Geochemistry. Chicago Univ. Press, Chicago,
37 p.
Sayyah, T.A. and El Shatoury, H.M., 1973, Some
geochemical features of Wadi Natash volcanics,
Eastern Desert. Egypt. J. Geol., v. 17 (1), p. 85-
95.
Schmid, R., 1981, Descriptive, nomenclature and
classification of pyroclastic deposits and
fragments, recommendation of IUGS
subcommision on the systematics of igneous
rocks. Geology, v. 9, p. 41-43.
Serra, A., 1947, Osservazioni Spettroscopiche Su
fluorine Colarate. Ricerca Sci. Ricostr. Roma, v.
17, 670 p.
Shahien, M.G.M., 1996, Petrographical and
geochemical studies of some volcanics of Sinai
and Eastern Desert, Egypt. Ph.D. Thesis, Cairo
Univ., 218 p.
Smellie, J.A.T., 1982, The mineralogy and genesis
of uranium in rhyolitic ignimbrites of
Precambrian age from Duobblon, Sweden. Min.
Mag., v. 46, p. 187-199.
Stemprok, M., 1979, Mineralization granites and
their origin. Episodes, v. 3, p. 20-24.
Swart, P.K. and Moore, F., 1982, The occurrence
of uranium in association with cassiterite,
wolframite and sulphide mineralization in
South-West England. Min. Magazine, v. 46, p.
211-215.
Williams, H. and Mc Birnery, A.R., 1979,
Volcanology: San Francisco, Freeman, Cooper
& Co.
Winkler, H.G.F., Boes, M. and Marcopoulos, T.,
1975, Low temperature granitic melts. N. Jb.
Min. Mn., v. 6, p. 245-268.
45
U Nb
Nb
U
Ca
Si
TaFe
TiSc
(a)
2.00 4.00 6.00 8.00 10.00 12.00 14.00 16.00
Ti
Nb
Nb
Fe
Ta Pb
Si
UCa
(b)
2.00 4.00 6.00 8.00 10.00 12.00 14.00 16.00
Th
Si
Y
Fe Th
Al
Fe
2.00 4.00 6.00 8.00 10.00 12.00 14.00 16.00
(c)
Fig. (10): Semi-quantitative analyses using the EDAX –SEM.
a) Columbite, b) Plumbobetafite and c) Yttrialite.
46
Th
U
Ca
Fe
Si
Y
Fe
Al
(a)
0.70 1.40 2.10 2.80 3.50 4.20 4.90 5.60 6.30
As
S Fe
As
(b)
1.70 2.70 3.70 4.70 5.70 6.70 7.70 8.70 9.70
(c)Mn
Ba
Pb
SiMn
2.00 4.00 6.00 8.00 10.00
Fig. (11): Semi-quantitative analyses using the EDAX –SEM.
a) Uranothorite, b) Arsenopyrite and c) Coronadite.
47
285 236
114
1133
905
167
55 35 95
0
200
400
600
800
1000
1200
Tunnel
(n=12)
Trenches
(n=9)
Greisen
(n=4)
eU(ppm)
eTh(ppm)
Ra(ppm)
35 45 55 65 75
0
3
6
9
12
15
18
Nephelin
P-N
B+T
P-T
Phonolite
Benmorite
Mugearite
Hawaiite
Basalt
B-A Andesite
Dacite
Trachyandesite
Rhyolite
Trachyte
SiO2 (wt)
Na2O+K2O(wt)
Fig. (2): Bar-diagram showing the average
contents of eU, eTh and Ra (ppm) for the
anomalies sites of Um Safi area. (n= number
of samples)
Fig. (3): Na2O+K2O versus SiO2 diagram for
volcanic rocks, Um Safi area, after Cox et
al., (1979).
0 1 2 3 4 5 6
1
10
100
1000
FeOT
/MgO
Cr(ppm)
Abyssal tholeiites
Field volcanic rocks
of island arcs and continental
margins
0 1 2 3 4 5 6 7 8
1
10
100
400
FeOT
/MgO
Ni(ppm)
MORB
Island arcs
Fig. (4): Cr vs. FeOt
/MgO for rhyolite, Um Safi
area, after Miyashiro and Shido (1975).
Fig. (5): Ni vs. FeOt
/MgO for rhyolite, Um Safi
area, after Miyashiro and Shido (1975).
0.003
0.01
0.1
1
10
100
1000
Sr K Rb Ba Nb Zr Y
Rock/MORB
( a )
0.1
1
10
100
Sr K Rb Ba Nb Zr Y
Rock/C.C.
( b )
Fig. (6): Spider diagrams of normalized values of rhyolite, Um Safi area, after Hofmann (1988).
a) related to MORB b) related to bulk continental crust
48
Ab Or
Q
Greisen
Silicic
Sodic Potassic
P H2O= 1kb
0 1 2 3 4 5 6 7
0
1
2
3
4
5
6
7
Na (%)
K(%)
D
esilicification
K- m
etasom
atism
Na - m
etasom
atism
Argillition
Silicification
Fig. (7): Normative Q-Ab-Or ternary diagram,
showing the alteration of volcanic rocks, Um
Safi area, after Stemprok (1979).
Fig. (8): Na% – K% variation diagram, showing
the alteration types for volcanic rocks, Um
Safi area, after Cuney et al. (1989).
1 313
SiO2
TiO2
Al2O3
Fe2O3
FeO
MnO
MgO
CaO
Na2O
k2O
P2O5
EnrichedDepleted
Fresh
Altered
1 10 3011030
Rb
Sr
Ba
Zr
Y
Nb
Zn
Pb
V
Cr
Ni
Co
Ga
U
Th
EnrichedDepleted
Fresh
Altered
Fig. (9): The enrichment and depletion of major oxides (a) and some trace elements (b) of the
altered relative to the fresh rhyolite samples, Um Safi area.
(a) (b)
49
Table (1): Result of chemical analyses and CIPW normative minerals for
fresh volcanic rocks, Um Safi area.
Fresh volcanic rocksMajor
Oxides
1 2 3 4 5 6 7
SiO2 75.07 69.49 71.2 70.51 69.55 70.61 71.16
TiO2 0.13 0.12 0.11 0.12 0.11 0.13 0.11
Al3O3 12.5 14.09 13.85 14.12 14.62 14.29 13.09
Fe2O3 1.76 2.01 1.21 1.61 2.71 2.72 2.45
FeO 0.40 0.36 0.56 0.76 0.86 0.44 0.32
MnO 0.07 0.06 0.09 0.08 0.07 0.08 0.09
MgO 1.01 0.91 0.88 0.96 0.79 1.12 1.11
CaO 1.80 1.36 1.68 1.40 1.12 1.40 1.96
Na2O 3.93 4.63 3.80 3.90 3.75 3.64 4.10
K2O 3.36 4.43 4.55 4.24 4.58 3.79 3.46
P2O5 0.09 0.08 0.10 0.07 0.10 0.08 0.09
L.O.I 0.79 1.99 1.64 1.68 1.14 1.27 1.74
Total 99.91 99.53 99.67 99.54 99.41 99.57 99.68
Trace elements (in ppm)
Rb 298 308 239 259 223 215 54
Sr 12 12 19 11 12 13 13
Ba 494 249 440 466 283 430 350
Zr 876 921 883 1005 1205 1007 1307
Y 282 296 283 321 387 321 420
Nb 32 31 33 30 32 31 30
Zn 23 37 48 31 56 28 41
Pb 78 81 38 36 75 41 595
V 5 5 7 7 5 5 5
Cr 58 97 86 78 120 95 110
Ni 1 3 3 3 5 4 2
Co 4 3 3 3 3 4 4
Ga 52 56 33 38 46 52 39
U* 32 24 25 29 28 17 34
Th* 41 51 44 49 48 32 75
CIPW normative values
Q 34.61 22.49 27.69 27.98 27.38 31.01 29.54
Or 19.85 26.86 27.45 25.65 27.57 22.81 20.9
Ab 33.18 40.12 32.76 33.71 32.25 31.3 35.38
An 6.50 4.65 7.4 6.69 5.06 6.59 7.21
Di 1.47 1.39 0.40 - - - 1.7
Hy 1.84 1.69 2.08 2.47 2.01 2.85 2.05
C - - - 0.72 1.69 1.84 -
Mt 1.14 1.03 1.79 2.39 2.73 1.32 1.03
Hm 0.97 1.35 - - 0.88 1.85 1.79
Il 2.25 0.23 0.21 0.23 0.21 0.25 0.21
Ap 0.20 0.18 0.22 0.16 0.22 0.18 0.20
* = Radiometric analyses
50
Table (2): Result of chemical analyses and CIPW normative minerals for altered volcanic
rocks and greisen, Um Safi area.
Altered volcanic Greisen
Kaolinized Argillite Silicified FerrugenatedMajor
Oxides 8 9 10 11 12 13 14
SiO2 70.57 71.11 72.05 76.7 81.5 80.06 69.07
TiO2 0.10 0.11 0.10 0.12 0.13 0.11 0.13
Al3O3 12.19 13.19 11.57 8.94 9.25 11.10 9.43
Fe2O3 3.03 2.18 4.39 3.39 0.81 2.42 10.2
FeO 0.52 0.20 0.28 0.56 0.36 0.80 1.64
MnO 0.14 0.18 0.08 0.08 0.11 0.04 0.18
MgO 2.00 2.80 1.20 0.80 0.80 0.80 0.60
CaO 2.80 1.68 2.24 1.98 1.68 1.12 1.96
Na2O 4.60 0.67 2.76 2.64 0.34 0.31 0.67
K2O 1.22 2.67 1.22 0.93 0.83 1.00 2.37
P2O5 0.10 0.13 0.10 0.10 0.10 0.12 0.15
L.O.I 2.70 3.56 3.94 3.70 3.55 2.08 2.47
Total 99.97 98.48 99.93 99.94 99.46 99.96 98.87
Trace elements (in ppm)
Rb 114 39 112 84 22 507 646
Sr 10 13 14 12 13 12 12
Ba 232 257 226 233 241 98 100
Zr 1193 862 1148 830 855 1133 529
Y 385 277 370 269 274 363 169
Nb 32 32 31 34 35 30 28
Zn 144 80 788 729 248 316 325
Pb 68 44 38 36 49 266 409
V 5 3 4 4 4 4 5
Cr 69 99 78 87 119 86 87
Ni 1 2 2 1 1 2 2
Co 3 4 4 4 3 3 3
Ga 43 34 53 43 30 55 52
U* 105 74 435 426 522 101 125
Th* 249 304 2007 1736 2006 161 172
CIPW normative values
Q 32.26 52.17 46.89 54.68 74.86 72.68 42.93
Or 7.42 16.64 7.52 5.72 5.12 6.04 14.54
Ab 39.97 5.97 24.3 23.18 3.00 2.68 5.87
An 9.24 7.98 10.97 9.6 8.08 4.96 9.18
Di 3.45 - - - - - -
Hy 3.54 7.37 3.13 2.08 2.09 2.04 1.56
C - 6.75 1.92 0.20 5.16 4.83 2.60
Mt 1.89 0.96 0.91 1.78 1.19 2.44 5.70
Hm 1.81 1.63 3.95 2.29 0.02 3.85 17.02
Il 0.20 0.22 0.20 0.24 0.26 0.21 0.26
Ap 0.22 0.30 0.23 0.23 0.23 0.27 0.34
* = Radiometric analyses
51
Table (3): Average of chemical composition of the studied rhyolite in comparison with
some Egyptian and World related rocks.
RhyoliteMajor
Oxides 1 2 3 4 5 6
SiO2 71.08 73.22 75.31 75.83 69.7 72.8
TiO2 0.12 0.42 0.23 0.24 0.38 0.28
Al2O3 13.79 12.59 12.55 12.3 14.0 13.3
Fe2O3 2.07 1.60 0.77 1.71 2.26 1.50
FeO 0.53 0.10 0.54 0.59 1.50 1.10
MnO 0.08 n.d 0.04 0.03 0.07 0.06
MgO 0.97 0.81 0.14 0.17 0.99 0.39
CaO 1.53 0.97 0.35 0.56 1.60 1.14
Na2O 3.96 5.38 3.86 3.32 4.20 3.60
K2O 4.06 3.58 4.29 4.12 4.10 4.30
P2O5 0.09 n.d 0.03 0.02 0.09 0.07
n.d= not determined
1-Average of fresh rhyolite of the studied area.
2-Average of rhyolite of Wadi Natash, Eastern Desert (Sayyah and El Shatoury, 1973).
3-Average of rhyolite of Wadi Kid, Sinai (Shahien, 1996).
4-Average of rhyolite of Abu Swayel, South Eastern Desert (Shahien, 1996).
5-Average of Egyptian rhyolite (Aly and Moustafa, 1984).
6-Average of World rhyolite (Le Maitre, 1976).
Table (4): eU, eTh and Ra contents in ppm and K (%), eU/Ra, eU/eTh and eTh/eU ratios of rhyolite and
anomalies.
Radiometric measurements
Rock types
eU
(ppm)
eTh
(ppm)
Ra
(ppm)
K(%) eU/Ra eU/eTh eTh/eU
Min. 17 32 12 1.75 1.4 0.4 1.7
Max. 34 75 14 4.29 2.4 0.6 2.2
Rhyolite
(n=6)
Average 26 50 13 2.99 2 0.5 1.9
Min. 53 236 13 0.39 3.7 0.2 2.8
Max. 563 2229 115 3.44 6.9 0.4 4.7
Tunnel
(n=12)
Average 285 1133 55 1.71 5.2 0.3 3.9
Min. 132 157 21 0.19 3.9 0.2 0.5
Max. 335 1188 49 4.4 9.7 2.1 5.8
Trenches
(n=9)
Average 236 905 35 1.6 7.0 0.5 4.1
Min. 101 161 90 2.08 1.09 0.62 1.33
Max. 125 172 97 2.66 1.29 0.75 1.61
Anomalies
Greisen
(n=4)
Average 114 167 95 2.37 1.19 0.68 1.48
52
.
*–*–***
*
**
)(
.–
..
.
.
)().(
.
)––(.
)(
).(

More Related Content

What's hot

MODELS OF REFLECTION OF KIMBERLITE PIPES OF NORTH-EAST OF BOTSWANA IN EOLIAN ...
MODELS OF REFLECTION OF KIMBERLITE PIPES OF NORTH-EAST OF BOTSWANA IN EOLIAN ...MODELS OF REFLECTION OF KIMBERLITE PIPES OF NORTH-EAST OF BOTSWANA IN EOLIAN ...
MODELS OF REFLECTION OF KIMBERLITE PIPES OF NORTH-EAST OF BOTSWANA IN EOLIAN ...James AH Campbell
 
Geochemistry and Genesis of Kammatturu Iron Ores of Devagiri Formation, Sandu...
Geochemistry and Genesis of Kammatturu Iron Ores of Devagiri Formation, Sandu...Geochemistry and Genesis of Kammatturu Iron Ores of Devagiri Formation, Sandu...
Geochemistry and Genesis of Kammatturu Iron Ores of Devagiri Formation, Sandu...IJMER
 
Petrography study
Petrography studyPetrography study
Petrography studyMani Maran
 
International Journal of Engineering Research and Development
International Journal of Engineering Research and DevelopmentInternational Journal of Engineering Research and Development
International Journal of Engineering Research and DevelopmentIJERD Editor
 
Economic geology - Mineral resources
Economic geology - Mineral resourcesEconomic geology - Mineral resources
Economic geology - Mineral resourcesAbdelMonem Soltan
 
PETROGENESIS OF GRANITOID ROCKS AND ORIGIN OF URANIUM MINERALIZATIONS OF UM S...
PETROGENESIS OF GRANITOID ROCKS AND ORIGIN OF URANIUM MINERALIZATIONS OF UM S...PETROGENESIS OF GRANITOID ROCKS AND ORIGIN OF URANIUM MINERALIZATIONS OF UM S...
PETROGENESIS OF GRANITOID ROCKS AND ORIGIN OF URANIUM MINERALIZATIONS OF UM S...Dr. Ibr@him
 
Economic Mineral Deposits in India
Economic Mineral Deposits in IndiaEconomic Mineral Deposits in India
Economic Mineral Deposits in Indiaakhilp2011
 
MODELS OF REFLECTION OF KIMBERLITE PIPES OF NORTH-EAST OF BOTSWANA IN EOLIAN ...
MODELS OF REFLECTION OF KIMBERLITE PIPES OF NORTH-EAST OF BOTSWANA IN EOLIAN ...MODELS OF REFLECTION OF KIMBERLITE PIPES OF NORTH-EAST OF BOTSWANA IN EOLIAN ...
MODELS OF REFLECTION OF KIMBERLITE PIPES OF NORTH-EAST OF BOTSWANA IN EOLIAN ...James AH Campbell
 
Economic geology - Magmatic ore deposits_1
Economic geology - Magmatic ore deposits_1Economic geology - Magmatic ore deposits_1
Economic geology - Magmatic ore deposits_1AbdelMonem Soltan
 
Ultra high temperature metamorphism
Ultra high temperature metamorphismUltra high temperature metamorphism
Ultra high temperature metamorphismOmer M. Ahmed
 
Classification of ore deposits
Classification of ore depositsClassification of ore deposits
Classification of ore depositsAbdul Bari Qanit
 
Uranium Geochemistry in Peraluminous Leucogranites of Wadi El-Shallal Area, S...
Uranium Geochemistry in Peraluminous Leucogranites of Wadi El-Shallal Area, S...Uranium Geochemistry in Peraluminous Leucogranites of Wadi El-Shallal Area, S...
Uranium Geochemistry in Peraluminous Leucogranites of Wadi El-Shallal Area, S...Dr. Ibr@him
 
SKARN DEPOSITS
SKARN DEPOSITSSKARN DEPOSITS
SKARN DEPOSITSVICTOR OBI
 
Sedimentological and Palynological Approach for Determining the Depositional ...
Sedimentological and Palynological Approach for Determining the Depositional ...Sedimentological and Palynological Approach for Determining the Depositional ...
Sedimentological and Palynological Approach for Determining the Depositional ...Md. Yousuf Gazi
 
Impress 1979 - milliken 1979. the silicifield evaporite syndrome...
Impress 1979 - milliken 1979. the silicifield evaporite syndrome...Impress 1979 - milliken 1979. the silicifield evaporite syndrome...
Impress 1979 - milliken 1979. the silicifield evaporite syndrome...Luiz Saturnino
 
Metallogenic Epoch and Province
Metallogenic Epoch and Province Metallogenic Epoch and Province
Metallogenic Epoch and Province Nikhil Sherekar
 
Ore deposit related to clastic sedimentation
Ore deposit related to clastic sedimentationOre deposit related to clastic sedimentation
Ore deposit related to clastic sedimentationPramoda Raj
 

What's hot (20)

MODELS OF REFLECTION OF KIMBERLITE PIPES OF NORTH-EAST OF BOTSWANA IN EOLIAN ...
MODELS OF REFLECTION OF KIMBERLITE PIPES OF NORTH-EAST OF BOTSWANA IN EOLIAN ...MODELS OF REFLECTION OF KIMBERLITE PIPES OF NORTH-EAST OF BOTSWANA IN EOLIAN ...
MODELS OF REFLECTION OF KIMBERLITE PIPES OF NORTH-EAST OF BOTSWANA IN EOLIAN ...
 
Geochemistry and Genesis of Kammatturu Iron Ores of Devagiri Formation, Sandu...
Geochemistry and Genesis of Kammatturu Iron Ores of Devagiri Formation, Sandu...Geochemistry and Genesis of Kammatturu Iron Ores of Devagiri Formation, Sandu...
Geochemistry and Genesis of Kammatturu Iron Ores of Devagiri Formation, Sandu...
 
Petrography study
Petrography studyPetrography study
Petrography study
 
The Wadi Sikait Complex: A Fertile- Post-Collisionl Granite-Pegmatite Suite, ...
The Wadi Sikait Complex: A Fertile- Post-Collisionl Granite-Pegmatite Suite, ...The Wadi Sikait Complex: A Fertile- Post-Collisionl Granite-Pegmatite Suite, ...
The Wadi Sikait Complex: A Fertile- Post-Collisionl Granite-Pegmatite Suite, ...
 
International Journal of Engineering Research and Development
International Journal of Engineering Research and DevelopmentInternational Journal of Engineering Research and Development
International Journal of Engineering Research and Development
 
Economic geology - Mineral resources
Economic geology - Mineral resourcesEconomic geology - Mineral resources
Economic geology - Mineral resources
 
PETROGENESIS OF GRANITOID ROCKS AND ORIGIN OF URANIUM MINERALIZATIONS OF UM S...
PETROGENESIS OF GRANITOID ROCKS AND ORIGIN OF URANIUM MINERALIZATIONS OF UM S...PETROGENESIS OF GRANITOID ROCKS AND ORIGIN OF URANIUM MINERALIZATIONS OF UM S...
PETROGENESIS OF GRANITOID ROCKS AND ORIGIN OF URANIUM MINERALIZATIONS OF UM S...
 
Economic Mineral Deposits in India
Economic Mineral Deposits in IndiaEconomic Mineral Deposits in India
Economic Mineral Deposits in India
 
MODELS OF REFLECTION OF KIMBERLITE PIPES OF NORTH-EAST OF BOTSWANA IN EOLIAN ...
MODELS OF REFLECTION OF KIMBERLITE PIPES OF NORTH-EAST OF BOTSWANA IN EOLIAN ...MODELS OF REFLECTION OF KIMBERLITE PIPES OF NORTH-EAST OF BOTSWANA IN EOLIAN ...
MODELS OF REFLECTION OF KIMBERLITE PIPES OF NORTH-EAST OF BOTSWANA IN EOLIAN ...
 
Economic geology - Magmatic ore deposits_1
Economic geology - Magmatic ore deposits_1Economic geology - Magmatic ore deposits_1
Economic geology - Magmatic ore deposits_1
 
Ultra high temperature metamorphism
Ultra high temperature metamorphismUltra high temperature metamorphism
Ultra high temperature metamorphism
 
Classification of ore deposits
Classification of ore depositsClassification of ore deposits
Classification of ore deposits
 
Uranium Geochemistry in Peraluminous Leucogranites of Wadi El-Shallal Area, S...
Uranium Geochemistry in Peraluminous Leucogranites of Wadi El-Shallal Area, S...Uranium Geochemistry in Peraluminous Leucogranites of Wadi El-Shallal Area, S...
Uranium Geochemistry in Peraluminous Leucogranites of Wadi El-Shallal Area, S...
 
Heavy minerals; IMSF, CU
Heavy minerals; IMSF, CUHeavy minerals; IMSF, CU
Heavy minerals; IMSF, CU
 
SKARN DEPOSITS
SKARN DEPOSITSSKARN DEPOSITS
SKARN DEPOSITS
 
GRAPHIC QUARTZ-FELDSPAR INTERGROWTHS IN PEGMATITES: DIFFUSION AND GROWTH KINE...
GRAPHIC QUARTZ-FELDSPAR INTERGROWTHS IN PEGMATITES: DIFFUSION AND GROWTH KINE...GRAPHIC QUARTZ-FELDSPAR INTERGROWTHS IN PEGMATITES: DIFFUSION AND GROWTH KINE...
GRAPHIC QUARTZ-FELDSPAR INTERGROWTHS IN PEGMATITES: DIFFUSION AND GROWTH KINE...
 
Sedimentological and Palynological Approach for Determining the Depositional ...
Sedimentological and Palynological Approach for Determining the Depositional ...Sedimentological and Palynological Approach for Determining the Depositional ...
Sedimentological and Palynological Approach for Determining the Depositional ...
 
Impress 1979 - milliken 1979. the silicifield evaporite syndrome...
Impress 1979 - milliken 1979. the silicifield evaporite syndrome...Impress 1979 - milliken 1979. the silicifield evaporite syndrome...
Impress 1979 - milliken 1979. the silicifield evaporite syndrome...
 
Metallogenic Epoch and Province
Metallogenic Epoch and Province Metallogenic Epoch and Province
Metallogenic Epoch and Province
 
Ore deposit related to clastic sedimentation
Ore deposit related to clastic sedimentationOre deposit related to clastic sedimentation
Ore deposit related to clastic sedimentation
 

Similar to OCCURRENCE OF URANIUM BEARING MINERALS IN UM SAFI PYROCLASTICS, CENTRAL EASTERN DESERT, EGYPT

Petrography of ajali sandstone in ayogwiri – fugar – orame area of western an...
Petrography of ajali sandstone in ayogwiri – fugar – orame area of western an...Petrography of ajali sandstone in ayogwiri – fugar – orame area of western an...
Petrography of ajali sandstone in ayogwiri – fugar – orame area of western an...Alexander Decker
 
Geological and Geochemical Characterization of the Neoproterozoic Derudieb Me...
Geological and Geochemical Characterization of the Neoproterozoic Derudieb Me...Geological and Geochemical Characterization of the Neoproterozoic Derudieb Me...
Geological and Geochemical Characterization of the Neoproterozoic Derudieb Me...Premier Publishers
 
Comparative Study Between Some Uraniferous Volcanic Rocks, Eastern Desert, Egypt
Comparative Study Between Some Uraniferous Volcanic Rocks, Eastern Desert, EgyptComparative Study Between Some Uraniferous Volcanic Rocks, Eastern Desert, Egypt
Comparative Study Between Some Uraniferous Volcanic Rocks, Eastern Desert, EgyptDr. Ibr@him
 
Geochemistry and petrographic analysis of sandstone facies of eze aku formati...
Geochemistry and petrographic analysis of sandstone facies of eze aku formati...Geochemistry and petrographic analysis of sandstone facies of eze aku formati...
Geochemistry and petrographic analysis of sandstone facies of eze aku formati...Alexander Decker
 
Lithofacies architecture of the gercus formation in jabal haibat sultan, ne i...
Lithofacies architecture of the gercus formation in jabal haibat sultan, ne i...Lithofacies architecture of the gercus formation in jabal haibat sultan, ne i...
Lithofacies architecture of the gercus formation in jabal haibat sultan, ne i...Alexander Decker
 
Keys to paleoenvironmental interpretation of the nkporo formation, afikpo sub...
Keys to paleoenvironmental interpretation of the nkporo formation, afikpo sub...Keys to paleoenvironmental interpretation of the nkporo formation, afikpo sub...
Keys to paleoenvironmental interpretation of the nkporo formation, afikpo sub...Alexander Decker
 
Evidences of metasomatic processes during the emplacement of pan african gran...
Evidences of metasomatic processes during the emplacement of pan african gran...Evidences of metasomatic processes during the emplacement of pan african gran...
Evidences of metasomatic processes during the emplacement of pan african gran...Alexander Decker
 
Geological criteria for ore prospecting.pptx
Geological criteria for ore prospecting.pptxGeological criteria for ore prospecting.pptx
Geological criteria for ore prospecting.pptxMasroor4
 
Field report of malakand field trip
Field report of malakand field trip   Field report of malakand field trip
Field report of malakand field trip S Khan
 
Geochemistry of lamprophyre dykes in the Eastern Desert of Egypt
Geochemistry of lamprophyre dykes in the Eastern Desert of EgyptGeochemistry of lamprophyre dykes in the Eastern Desert of Egypt
Geochemistry of lamprophyre dykes in the Eastern Desert of EgyptDr. Ibr@him
 
The geological , mineralogical and petrological studies of holenarsipura sch...
The geological , mineralogical  and petrological studies of holenarsipura sch...The geological , mineralogical  and petrological studies of holenarsipura sch...
The geological , mineralogical and petrological studies of holenarsipura sch...Pramoda Raj
 
Eolian indicator mineral dispersion haloes from the Orapa kimberlite
Eolian indicator mineral dispersion haloes from the Orapa kimberliteEolian indicator mineral dispersion haloes from the Orapa kimberlite
Eolian indicator mineral dispersion haloes from the Orapa kimberliteJames AH Campbell
 
Minerals and rocks for presentations
Minerals and rocks for presentationsMinerals and rocks for presentations
Minerals and rocks for presentationsBelal El Nagar
 
Heavy minerals full paper
Heavy minerals full paperHeavy minerals full paper
Heavy minerals full paperVadde Ramesh
 
Lime stone and sandstone
Lime stone and sandstone Lime stone and sandstone
Lime stone and sandstone devi prasanth
 

Similar to OCCURRENCE OF URANIUM BEARING MINERALS IN UM SAFI PYROCLASTICS, CENTRAL EASTERN DESERT, EGYPT (20)

Petrography of ajali sandstone in ayogwiri – fugar – orame area of western an...
Petrography of ajali sandstone in ayogwiri – fugar – orame area of western an...Petrography of ajali sandstone in ayogwiri – fugar – orame area of western an...
Petrography of ajali sandstone in ayogwiri – fugar – orame area of western an...
 
Geological and Geochemical Characterization of the Neoproterozoic Derudieb Me...
Geological and Geochemical Characterization of the Neoproterozoic Derudieb Me...Geological and Geochemical Characterization of the Neoproterozoic Derudieb Me...
Geological and Geochemical Characterization of the Neoproterozoic Derudieb Me...
 
Ore deposits
Ore depositsOre deposits
Ore deposits
 
Comparative Study Between Some Uraniferous Volcanic Rocks, Eastern Desert, Egypt
Comparative Study Between Some Uraniferous Volcanic Rocks, Eastern Desert, EgyptComparative Study Between Some Uraniferous Volcanic Rocks, Eastern Desert, Egypt
Comparative Study Between Some Uraniferous Volcanic Rocks, Eastern Desert, Egypt
 
Geochemistry and petrographic analysis of sandstone facies of eze aku formati...
Geochemistry and petrographic analysis of sandstone facies of eze aku formati...Geochemistry and petrographic analysis of sandstone facies of eze aku formati...
Geochemistry and petrographic analysis of sandstone facies of eze aku formati...
 
Lithofacies architecture of the gercus formation in jabal haibat sultan, ne i...
Lithofacies architecture of the gercus formation in jabal haibat sultan, ne i...Lithofacies architecture of the gercus formation in jabal haibat sultan, ne i...
Lithofacies architecture of the gercus formation in jabal haibat sultan, ne i...
 
Keys to paleoenvironmental interpretation of the nkporo formation, afikpo sub...
Keys to paleoenvironmental interpretation of the nkporo formation, afikpo sub...Keys to paleoenvironmental interpretation of the nkporo formation, afikpo sub...
Keys to paleoenvironmental interpretation of the nkporo formation, afikpo sub...
 
Evidences of metasomatic processes during the emplacement of pan african gran...
Evidences of metasomatic processes during the emplacement of pan african gran...Evidences of metasomatic processes during the emplacement of pan african gran...
Evidences of metasomatic processes during the emplacement of pan african gran...
 
Geological criteria for ore prospecting.pptx
Geological criteria for ore prospecting.pptxGeological criteria for ore prospecting.pptx
Geological criteria for ore prospecting.pptx
 
Field report of malakand field trip
Field report of malakand field trip   Field report of malakand field trip
Field report of malakand field trip
 
EJAS-10461 (1).pdf
EJAS-10461 (1).pdfEJAS-10461 (1).pdf
EJAS-10461 (1).pdf
 
ASBESTOS, VERMICULITE, COURUNDUM, MAGNESITE, AND TALC DEPOSITS IN EGYPT
ASBESTOS, VERMICULITE, COURUNDUM, MAGNESITE, AND TALC DEPOSITS IN EGYPTASBESTOS, VERMICULITE, COURUNDUM, MAGNESITE, AND TALC DEPOSITS IN EGYPT
ASBESTOS, VERMICULITE, COURUNDUM, MAGNESITE, AND TALC DEPOSITS IN EGYPT
 
Geochemistry of lamprophyre dykes in the Eastern Desert of Egypt
Geochemistry of lamprophyre dykes in the Eastern Desert of EgyptGeochemistry of lamprophyre dykes in the Eastern Desert of Egypt
Geochemistry of lamprophyre dykes in the Eastern Desert of Egypt
 
The geological , mineralogical and petrological studies of holenarsipura sch...
The geological , mineralogical  and petrological studies of holenarsipura sch...The geological , mineralogical  and petrological studies of holenarsipura sch...
The geological , mineralogical and petrological studies of holenarsipura sch...
 
Eolian indicator mineral dispersion haloes from the Orapa kimberlite
Eolian indicator mineral dispersion haloes from the Orapa kimberliteEolian indicator mineral dispersion haloes from the Orapa kimberlite
Eolian indicator mineral dispersion haloes from the Orapa kimberlite
 
Minerals and rocks for presentations
Minerals and rocks for presentationsMinerals and rocks for presentations
Minerals and rocks for presentations
 
Heavy minerals full paper
Heavy minerals full paperHeavy minerals full paper
Heavy minerals full paper
 
Shefa Yamem Poster 2009
Shefa Yamem Poster 2009Shefa Yamem Poster 2009
Shefa Yamem Poster 2009
 
Lime stone and sandstone
Lime stone and sandstone Lime stone and sandstone
Lime stone and sandstone
 
Fe-deposits
Fe-depositsFe-deposits
Fe-deposits
 

OCCURRENCE OF URANIUM BEARING MINERALS IN UM SAFI PYROCLASTICS, CENTRAL EASTERN DESERT, EGYPT

  • 1. 39 OCCURRENCE OF URANIUM BEARING MINERALS IN UM SAFI PYROCLASTICS, CENTRAL EASTERN DESERT, EGYPT. Ibrahim, M. E.* , Attawiya, M. Y.* , Osman, A. M.** and Ibrahim, I. H.* * Nuclear Materials Authority, Cairo, Egypt. ** Ain Shams University, Cairo, Egypt. ABSTRACT: Um Safi rhyolite (USR) and associated pyroclastic rocks form relatively moderate to high relief (615m) extruded volcanoclastic and volcano-sedimentary association, serpentinites and ortho-amphibolites with Knife sharp contact, forming small oblate body striking NW-SE, covering about 0.3 km2 . These rocks show different degrees of subsoildus autometasomatic processes; argillization, greisenization, silicification, hematitization and fluoritization. USR is originated by a combination of fractional crystallization of lithospheric source and crustal contamination, whereas the magma was extruded at active continental margin environment Um Safi pyroclastics (USP) comprise agglomerates and laminated tuffs. The coarsers (agglomerates) show fragmental structure at the base of rhyolite extrusion whereas the finer laminated tuffs show contorted bands (0.5-1 cm) of differing shades and occur upward direction. The pyroclastics were erupted with explosive violence as a turbulent mixture of hot, expanding gases and gas-emitting lava fragments at relatively low pressures. The pyroclastics could be considered as a good trap for secondary uranium and U-bearing minerals. The base metal minerals (pyrite, arsenopyrite and corondite) are formed in the deeper part of the epithermal zone. In the next zone to the top where ascending solutions rise further towards the surface and mingled with the descending meteoric water, precipitation of secondary uranium mineral (kasolite) and U-bearing minerals (plumbobetafite, columbite and betafite) occur as a function of oxidation and failing temperature. Keywords: Um Safi – uranium bearing minerals - pyroclastics. 1. INTRODUCTION Um Safi volcanic rocks were mapped previously as felsite by several workers (Akaad and El Ramly, 1963; El Ghawaby, 1966; Akaad et al., 1996; Abdalla, 2001). Radioactive mineralization of columbite, uranothorite and zircon were recorded as fracture filling in the sheared parts of the felsite rocks at Um Safi (El Ghawaby, 1966). Abdalla (2001) considered Um Safi as subvolcanic equivalent for the metaluminous alkali rare metal granites and is belonging to the post-collision and orogenically related A2-type granites with only zircon and uranothorite as radioactive minerals. Um Safi granitoids (southern part of the studied area) are composed of a succession of metaluminous calc-alkaline (older granitoids) and metaluminous to peraluminous sub-alkaline sub-leucogranites (younger granites) emplaced during three successive tectonic events (Ibrahim et al., 2001). The shear zone (N-S) in muscovite sub- leucogranites (1.5 km south USR) is considered as a good trap for uranium mineralizations (zippeite and beta-uranophane). This work is a contribution to the understanding of geology, geochemistry and genesis of secondary uranium and uranium-bearing mineralization in USP. 2. GEOLOGIC SETTING AND PETROGRAPHY USR form relatively moderate to high relief (615m) extruded the volcano-sedimentary association (slate, phyllite, Banded Iron Formation and schist), serpentinites and ortho-amphibolites with Knife sharp contact, forming small oblated body striking NW-SE, covering about 0.3 km2 (Fig. 1). The volcanic rocks of Um Safi are successive sheets of lavas and pyroclastics, the former being dominant. The bulk composition of lavas is mainly rhyolitic. The USR are fine-grained, massive and varies in colours from buff, yellow or even grey and pink with dark buff in colour. They show locally porphyritic and fracturing particularly along the marginal parts of the extrusion. These rocks show different degrees of alteration, hematitization, kaolinitization and silicification so that the colour sometimes is reddish brown or dark brown due to the presence of considerable iron oxides and other opaque minerals. Fluorite veinlets (1 –3 cm thick, and up to 2 m long) are common through pyroclastics and made up of violet, green and black fluorite, quartz and calcite. Quartzification is clarified by development of many quartz vein, veinlets and pods in decreasing order. They crosscut the USR body at its northern part. Some Egyptian Journal of Geology, v. 46/1, 2002, pp. 39-54
  • 2. 40 quartz veins contain pyrite and arsenopyrite. Hematitization is manifested by change of USR colour into red to brown especially along fractures due to the presence of impregnation of iron oxide. The USR are invaded by N-S sub-vertically greisenized microgranite, which shows exfoliated and cavernous. The USP consist of detrital materials expelled from rhyolite volcanics, transported aerially and deposited upon land surface in lakes or in marine waters (Heinrich, 1956). They comprise agglomerates and laminated tuffs. The coarse- grained agglomerates show fragmental structure at the base of rhyolite extrusion (0.5-2 m above Wadi level) whereas the finer-grained laminated tuffs exhibit contorted bands of differing shades and occur upward direction (1.5 – 3 m). The pyroclastics and greisen rocks gain importance due to their high intensities of radioactivity (114-280 ppm eU and 167-1133 ppm eTh respectively) (Fig. 2). Visible non-radioactive minerals are observed such as pyrite, arsenopyrite and manganese oxides or dendrites, as well as, violet fluorite and metallic black veinlets (N-S trend). A- Rhyolite is extrusive holocrystalline to hypocrystalline with aphanitic matrix. The rock is hard, massive and light coloured. They are often banded with flow structures, which may appear as coloured bands strips or lines of spherulites and spherulitic textures. Breccias, tuffs and welded tuffs are often associated. They are composed of quartz and alkali potash feldspars (sanidine) embedded in cryptocrystalline groundmass and consist of quartz, sanidine and secondary muscovite. The common accessories are opaques, apatite and zircon. Quartz occurs as phenocrysts (0.7×1.2 mm) and fine-grained groundmass in the matrix. The matrix quartz is either fine-grained, or intergrown with alkali feldspar in a complex pattern. Some quartz forms aggregate of tiny plates and spherulites, which composed of radiating fibres of feldspar and cristobalite (Moorhouse, 1959). Potash feldspar occurs either as subhedral to anhedral phenocrysts (0.5×0.8 mm) or as fine- grained groundmass in matrix. Phenocrysts (sanidine and microperthite) are usually clear and may be untwinned or twinned according to the Carlsbad low, sometimes exhibit corrosion effects due to corrosion by the matrix. Also radial spherulitic texture appears from central elongated microperthite phenocrysts. The common alteration products are kaolinite, sericite and calcite. Muscovite occurs either as anhedral fine-grained crystals in groundmass due to alteration products of potash feldspars, or as veinlets crosscut the other constituents. Opaques occur as anhedral crystals or small veinlets associated with fluorite. Epidote occurs as small aggregates associated with opaques and fluorite. Fluorite varies in colours from colourless to pale violet through deep violet or black. It usually occurs as small veinlets associated with opaque minerals. Apatite, allanite and zircon are present as individual euhedral crystals enclosed within quartz and feldspar. B- Pyroclastics are well banded, reddish grey in colour and composed mainly of crystals and rock fragments in fine-grained groundmass. The coarser agglomerates are not well represented for thin section studies, except forming fine-grained matrix they may possess. According to Schmid (1981) the pyroclastics can be classified into fine crystal tuffs and crystal lithic tuffs. i. Fine crystal tuffs are fine-grained, laminated or banded and composed of more than 50% crystal fragments of quartz, feldspars and epidote set in a fine-grained matrix of quartz and potash feldspars. ii. Crystal lithic tuffs are composed of lithic fragment of rhyolite and quartzite, as well as, sub- angular to subrounded crystal fragments of quartz and perthite embedded in fine-grained groundmass of the same mineral composition. Quartz crystals are strongly fractured, probably owing to compaction and cooling of the glass matrix (Williams and Mc Birnery, 1979). Perthite crystals sometimes show one side with a crystal face and elsewhere show irregular or fractured edges. Other perthite crystals are rounded or irregularly embayed indicating a high temperature of the environment of deposition. Ferromagnesian minerals are altered and commonly bent. 3. GEOCHEMISTRY 3.1. Methodology Seven samples from fresh volcanics and five samples from altered rock, as well as, two samples from greisen were analyzed in the laboratories of the Nuclear Materials Authority for major elements by the wet chemical and atomic absorption (with < 1 % error). Some trace elements are determined using the X-ray fluorescence technique (with 1-5 % error). The data of chemical analyses and CIPW normative values are given in Tables 1 and 2. Two samples from pyroclastic and greisenized rocks were crushed and their heavy minerals were separated using Frantz isodynamic separator and bromoform. XRD and EDAX-SEM techniques were used for mineral separation by hand picking under the binocular microscope. 3.2. Fresh Samples
  • 3. 41 The average chemical composition of the studied fresh volcanic rocks is compared with the average corresponding published Egyptian and World rhyolite rocks (Table 3). Generally the values of major oxide compositions of USR fall between the corresponding values of the Egyptian and World rhyolites. It contains nearly similar values of SiO2, Al2O3, MgO, K2O, CaO and P2O5 with less Fe2O3 and Na2O contents compared with the Egyptian rhyolite that given by Aly and Moustafa (1984). Cox et al., (1979) used the total alkalis versus silica diagram (Fig. 3) for the geochemical classification of the volcanic rocks. The data points of the studied fresh volcanic rocks fall in the rhyolite field. Miyashiro and Shido (1975) proposed the Cr- FeOt /MgO and Ni- FeOt /MgO discrimination diagrams to identify island arc volcanic rocks through the behavior of Cr and Ni with advancing fractional crystallization of basaltic magma. The plots of the examined rhyolite on these diagrams (Figs. 4&5) show that, they fall mostly within the island arc and continental margin tectonic setting. The normalized values of the studied rhyolite rocks relative to MORB (Hofmann, 1988) are given in (Fig. 6a). It shows a strong enrichment in all compatible elements except Sr due to the effects of assimilation of either crustal materials or oceanic matter. In comparison with normalized values related to the bulk continental crust (Hofmann, 1988), the plot in (Fig. 6b) shows that rhyolite is enriched in Rb, Ba, Zr and Y and depleted in Sr and Nb, suggesting a significant role of crustal contamination. 3.3. Altered Samples According to the normative Q-Ab-Or compositions, the altered samples could be classified as sodic, potassic, silicic and greisen as shown in Fig. (7) after Stemprok (1979). Two altered samples lie below the granitic eutectic temperature and exhibit a trend corresponding to crystallization in high PH2O range (the range is from 0.5 to 3 k bar after Winker et al., 1975 and closely parallel to the sodic trend). The other altered samples lie in silicic trend. The greisenized samples fall close to the greisen trend. The Na-K variations diagram after (Cuney et al., 1989) shows five alteration types; Na- metasomatism, K-metasomatism, silicification, desilicification and argillization. On figure (8) argillization and silicification are the main alteration processes affected the investigated samples. Figures (9 a&b) shows that the major oxides of the altered samples suffered enrichment in MgO, MnO, CaO, Fe2O3, P2O5, and SiO2 and depletion in K2O, Na2O, FeO, Al2O3 and, TiO2, than fresh rhyolite samples, while the trace elements of the altered samples display enrichment in Th, U, Nb and Zn and also show depletion in Rb, Ba, Ni, Pb and V than fresh rhyolite samples. 3.4. Distribution of eU and eTh The eU-content in fresh rhyolite ranges from 17 to 34 ppm with an average 26 ppm, and the eTh- content ranges from 32 to 75 ppm with an average 50 ppm, while the eTh/eU ratio is equal 1.9 (Table 4). The eU and eTh values of USR are greater than values of acidic effusive rocks of Adams et al., (1956) while their eTh/eU ratios are lower than those reported, indicate to uranium enrichment rather than thorium. The field radiometric measurements localized three radioactive anomalies, two within pyroclastics (includes one tunnel and eleven trenches were dugged by nuclear materials authority since 1964) and one within greisenized microgranite. a- The first one is represented by only one tunnel (about 1.5 m in width and 6 m in length), which considered as one of the highst radioactive zones. The mineralized joint sets in the tunnel strike ENE- WSW and NE-SW. Kaolinitized, sericitized and argillized products of USP contain the higher radioactive values with violet fluorite. The eU- content ranges from 53 to 563 ppm with an average of 285 ppm, whereas the eTh-content ranges from 236 to 2229 ppm with an average of 1133 ppm. The eTh/eU ratio ranges from 2.8 to 4.71 with an average of 3.9 (Table 4). b- The second anomaly is represented by trenches. It is clear that the common mineralized joints, striking ENE-WSW and NE-SW. The alteration product; ferrugenation, Mn-dendrites and oxidized with oxidized sulphide crystals support the hydrothermal effect. The eU-content (ranges from 132 to 335 ppm with an average of 236 ppm), is less than the eTh-content (ranges from 157 to 1188 ppm with an average of 905 ppm). The eTh/eU ratio ranges from 0.5 to 5.8 with an average of 4.1 (Table 4), which is related to mobilization and redistribution of uranium. c- The third anomaly is close to greisenized microgranite, which trend N-S to N20ºE-S20ºW directions. It is characterized by brownish to reddish colour (due to ferrugenation) ranging from 4 to 5 m thick and rich by vugs due to oxidized cubic sulphide crystals. The eU- content (ranges from 101 to 125 ppm with an average of 114 ppm) is less than eTh-content (ranges from 161 to 172 ppm with an average of 167 ppm). The eTh/eU ratio ranges from 1.33 to 1.61 with an average of 1.48 (Table 4).
  • 4. 42 4. MINERALIZATIONS The mineralizations in Um Safi pyroclastics can be classified into five categories; 1) U-bearing minerals (columbite, plumbobetafite and betafite), 2) secondary U-mineral (kasolite), 3) thorium- bearing minerals (uranothorite and yttrialite), 4) base-metal minerals (pyrite, arsenopyrite, cassiterite and corondite) and 5) accessory minerals (zircon, allanite and fluorite). i) Columbite [(Fe,Mn)(Nb,Ta,U)2O6] is isomorphous with tantalite, black in colour and is an ore of niobium as well as a source of tantalum (Nb/Ta ratio 4.9). The columbite of Um Safi (Fig. 10a) is radioactive due to presence of moderate UO2 and ThO2 contents (16.7% and 13.3% respectively). ii) Plumbobetafite [(Pb,Ca,U)(Nb,Ti)2O6(OH,F)] confirmed by EDAX (Fig. 10b). The mineral is composed mainly of TiO2 (41.3%) and Nb2O5 (20.1%) while UO2 and ThO2 are not common (1.7% and 2.1% respectively). iii) Yttrialite [(Y,Th)2Si2O7] is olive-green mineral. Semi-quantitative analyses (Fig. 10c) indicate that, it has ThO2 (41.1%) more than Y2O3 (14.3%) and SiO2 (26.0%). iv) Uranothorite [(Th,U)O2] is confirmed by EDAX (Fig. 11a) and contains 40.65% ThO2, 14.0% UO2, 12.0% Y2O3 and 16.0 % SiO2. v) Arsenopyrite (FeAsS) occurs as silver-white to steel-grey colour. it is isomorphous with loellingite mineral and constituting the principle ore of arsenite. Semi-quantitative analyses of picked grains were using the EDAX-SEM technique (Fig.11b ) gives 37.3% As, 35.1% Fe and 25.0% S. vi) Coronadite (PbMn6O14) is black mineral associated with iron oxides in ferruginated pyroclastics (trenches). Semi-quantitative analyses of picked grains were obtained using the EDAX- SEM technique (Fig.11c). It contains 67.8% MnO and 21.5% PbO2 with Pb/Mn ratio equal to 3.2. vii) Betafite [(Ca,Na,U)2(Ti,Nb,Ta)2O6.(OH)] occurs as radiated black mineral associated with quartzo-feldspathic groundmass in pyroclastics (Fig. 12a). viii) Kasolite [Pb(UO2)SiO4.H2O] shows dark yellowish brown colour with radiated or fan likes shape under Crossed Nicol and considered as secondary uranium minerals (Fig.12b). ix) Zircon (ZrSiO4) occurs as euhedral six-sided or eight-sided form with clusters of opaque inclusions. It is mainly colourless to pale yellow and associated with iron oxides and fluorite. Average zirconium contents is higher in fresh samples (1030 ppm) than in altered samples (936 ppm). Rankama and Sahama (1955) stated that thorite is isomorphic with zircon and it is evident that a large part of thorium is incorporated in the zircon structure. The ionic size of zirconium and thorium are not too unlike and therefore thorium is able to enter the zircon structure in which it replaces. Two thin section from greisen were tested for their radiometrically using SSNDTD type Kodak CN-85 films. The test reveals that zircon in greisen is radioactivity carrier and show high concentrations of alpha tracks (Figs. 12c&d). x) Fluorite (CaF2) minerals possess vitreous luster and white streak. It is mainly recorded filling cavities and micro-fractures, which reflect their secondary origin as resulting from hydrothermal alteration of rhyolite and/or associated greisen. Fluorite in USR and greisen samples exhibits a wide range of colours. Some of them are colourless, while others are pale rose, pale violet, deep violet and very deep to blackish violet to black. Some fluorite grains have various gradations of colours was separated by hand picking under the microscope to be tested for their radiometically by using the Solid State Nuclear Track Detectores (SSNDTD) type Kodak CN-85 films. This test reveals that violet and black fluorite grains are radioactivity carrier and show high concentrations of alpha tracks (Figs. 12 e&f). Serra (1947) and Allen (1952) stated that fluorite colour is attributed to the action of their rare earth elements during the differentiation of magma or due to the presence of manganese. Derr et al., (1962) indicated that the presence of trace and/or rare earth may cause the different colouration of fluorite. Abdalla (2001) recorded that Um Safi fluorite is characterized by considerable enrichment in REE (av. Σ REE = 4179 ppm). xi) Allanite [(Ce,Ca,La,Y)(Al,Fe)3(SiO4)3.OH] is brown in colour and pleochroic from pale brown to dark brown (Fig.12g ). In most cases the allanite mineral is uranium and thorium carrier but altered and inverted to an amorphous substance product by break down of the space lattice by radioactive emanation (Kerr, 1977). xii) Cassiterite (SnO2) is a brown or black tetragonal mineral. It is the principal ore of tin. They occur in prismatic crystals, massive and form compact concentric structure (Fig. 12h). Swart and Moore (1982) suggested that the presence of coloured zones in the cassiterite crystals is due to variation in U concentration that range from 0-6 ppm in darker bands. xiii) Pyrite (FeS2) occurs as well developed cubic crystals, with pale brass-yellow colour and metallic luster, often with yellowish brown tarnish
  • 5. 43 associated with goethite. Pyrite occurs either disseminated in smoky quartz veins or associated with USP. xiv) Thorite (ThSiO4) is strongly radioactive mineral, brown to black tetragonal mineral like zircon and dimorph with huttonite. It is isostructural with thorogummite [Th (SiO4)1-X (OH)4X] and may contains as much as 10% uranium. 5. SUMMARY AND CONCLUSIONS The average of eTh/eU ratios are increased from 1.5 in the greisenized microgranite through 1.9 in the fresh rhyolite to about 4.0 in the pyroclastic samples (kaolinized and argillite). The lowering of the eTh/eU ratio indicates redistribution and localization of secondary uranium mineral (kasolite). The enrichment of U and Th in pyroclastics (425-520 ppm eU and 1700-2000 ppm eTh) may indicate the stabilization of them in late- to post-magmatic fluids. In the pyroclastics samples, U and Th are largely incorporated in uranium bearing-minerals e.g. columbite, yttrialite, betafite, plumbobetafite and uranothorite. The higher mobility of U could be retained by Fe- and Mn-rich solutions and adsorbed by lately deposited amorphous Fe-oxides and explained its lower Th/U ratio (Table 2). The greisen (pneumatolytically altered granitic rocks) is composed mainly of quartz and mica (muscovite and sericite) as well as fluorite, cassiterite, kasolite, allanite, zircon and arsenopyrite in decreasing order. The lower eTh/eU ratio (1.6) of greisen rather than tunnel (average eTh/eU= 3.9) and trenches (average eTh/eU= 4.1) indicates that the greisen is affected by hydrothermal-bearing uraniferous solution. The normal Th/U in the crust is equal to 3.5. So, the lower ratio may be attributed to the magmatic activity through the N-S shear zone in muscovite subleucogranite where their Th/U ratio around 0.2 (Ibrahim et al., 2001). Kaolinitization, ferrugenation, and argillation represent the hydrothermal alterations associated with the high radioactivity values in rhyolites and greisen. The widespread sericitization through the rhyolite rocks provides additional evidence of large-scale movement of solutions through these rocks. The hexavalent U is ready leached from rhyolites by dilute acid solutions so some U may have been transported as UO2(OH)+ and UO2 - complex The USP appears to have provided less-welded layers and lenses. This is coincidence with the similar observation (Smellie, 1982) described from Duobblon rhyolitic ignimbrites. The leached U from solutions percolating through fractures, fissures and permeable bands were re-deposited and sink. The pyroclastics were erupted with explosive violence as a turbulent mixture of hot, expanding gases and gas-emitting lava fragments at relatively low pressures. The base metal minerals (pyrite, arsenopyrite and corondite) are formed in the deeper part in the epithermal zone. In the next zone to the top where ascending solutions rise further towards the surface and mingled with the descending meteoric water, precipitation of secondary uranium mineral (kasolite) and U- bearing minerals (plumbobetafite, columbite, yttrialite, betafite and uranothorite) occur as a function of oxidation and failing temperature 6. REFERENCES Adams, J.A., Osmand, J.K. and Rogers, J.I.W., 1956, The geochemistry of thorium and uranium. In: Physics and chemistry of the Earth. Pergamon Press, New York, v. 3, p. 298-348. Akaad, M.K. and El Ramly, M.F., 1963, Geology and structure of Um Lassaf - Um Nar iron belt, Eastern Desert of Egypt. Geol. Surv. Egypt, No. 17, 23 p. Akaad, M.K., Noweir, A.M. and Abu El Ela, A.M., 1996, Geology of Pan-African basement rocks of the Gabal Al Hadid – Wadi Mubarak District, E.D., Egypt. Geol. Surv., Egypt. No.73, 78 p. Allen, R.D., 1952, Variations in chemical and physical properties of fluorite. Am. Min., v. 37, p. 901-932. Aly, M.M. and Moustafa, M.M., 1984, Major chemistry statistics characterizing common igneous rocks of Egypt. 9th Inter. Cong. Stat. Comp. Sci. Soc. Res., Ain Shams Univ., Cairo. Abdalla, H.M., 2001, Geochemistry and origin of rare metal mineralization of Um Safi felsite, central Eastern Desert, Egypt. Egyptian J. Geol., p. 131-149. Cox, K.G., Bell, J.D. and Pankhurst, R.J., 1979, The interpretation of igneous rocks. London, Allen and Unwin, 450 p. Cuney, M., Leroy, J., Volivezo, A., Daziano, C., Gambda, B., Zarco, A.J., Morello, O., Ninci, C. and Molina, P., 1989, Metallogenesis of the uranium mineralized Achala granitic complex, Argentina: comparison with Hercynian peraluminous leucogranites of Western Europe. Proc. Tech. Comm. Meetings, Vienna, TECDOC-543, I.A.E.A., Vienna, p. 211-232. Deer, W.A., Howie, R.A. and Zussman, J., 1962, Rock forming minerals. Non silicates, 5, Longman, London, 371 p. El Ghawaby, M.A., 1966, Structural and lithologic controls of localization of radioactive
  • 6. 44 mineralization in a south Qusier area. M.Sc. Thesis, Ain Shams Univ., Cairo, 100 p. Heinrich, E.W., 1956, Microscopic petrography. McGraw-Hill Company, Inc., 295 p. Hofmann, A.W., 1988, Chemical differentiation of the earth: The relationship between mantle, continental crust and oceanic crust. Earth Planet. Sci., Let., v. 90, p. 297-314. Ibrahim, M.E., Osman, A.M., Attawyia M.Y. and Ibrahim I.H., 2001, Petrogenesis of granitoid rocks and origin of uranium mineralizations of Um Safi area, Eastern Desert, Egypt. Egyptian J. Egypt, (in press). Kerr, P.F., 1977, Optical mineralogy. 4th Ed., McGraw-Hill Book Inc., 492 p. Le Maitre, R.W., 1976, The chemical variability of some common igneous rocks. J. Petrol., v. 17, p. 589-637. Miyashiro, A.A. and Shido, F., 1975, Tholeiitic and calc-alkaline series in relation to the behaviors of titanium, vanadium, chromium and nickel. Am. J. Soc., v. 275, p. 265-277. Moorhouse, W.W., 1959, The study of rocks in thin section. Harper and Brothers, New York, 514 p. Rankama, k. and Sahama, T.G., 1955, Geochemistry. Chicago Univ. Press, Chicago, 37 p. Sayyah, T.A. and El Shatoury, H.M., 1973, Some geochemical features of Wadi Natash volcanics, Eastern Desert. Egypt. J. Geol., v. 17 (1), p. 85- 95. Schmid, R., 1981, Descriptive, nomenclature and classification of pyroclastic deposits and fragments, recommendation of IUGS subcommision on the systematics of igneous rocks. Geology, v. 9, p. 41-43. Serra, A., 1947, Osservazioni Spettroscopiche Su fluorine Colarate. Ricerca Sci. Ricostr. Roma, v. 17, 670 p. Shahien, M.G.M., 1996, Petrographical and geochemical studies of some volcanics of Sinai and Eastern Desert, Egypt. Ph.D. Thesis, Cairo Univ., 218 p. Smellie, J.A.T., 1982, The mineralogy and genesis of uranium in rhyolitic ignimbrites of Precambrian age from Duobblon, Sweden. Min. Mag., v. 46, p. 187-199. Stemprok, M., 1979, Mineralization granites and their origin. Episodes, v. 3, p. 20-24. Swart, P.K. and Moore, F., 1982, The occurrence of uranium in association with cassiterite, wolframite and sulphide mineralization in South-West England. Min. Magazine, v. 46, p. 211-215. Williams, H. and Mc Birnery, A.R., 1979, Volcanology: San Francisco, Freeman, Cooper & Co. Winkler, H.G.F., Boes, M. and Marcopoulos, T., 1975, Low temperature granitic melts. N. Jb. Min. Mn., v. 6, p. 245-268.
  • 7. 45 U Nb Nb U Ca Si TaFe TiSc (a) 2.00 4.00 6.00 8.00 10.00 12.00 14.00 16.00 Ti Nb Nb Fe Ta Pb Si UCa (b) 2.00 4.00 6.00 8.00 10.00 12.00 14.00 16.00 Th Si Y Fe Th Al Fe 2.00 4.00 6.00 8.00 10.00 12.00 14.00 16.00 (c) Fig. (10): Semi-quantitative analyses using the EDAX –SEM. a) Columbite, b) Plumbobetafite and c) Yttrialite.
  • 8. 46 Th U Ca Fe Si Y Fe Al (a) 0.70 1.40 2.10 2.80 3.50 4.20 4.90 5.60 6.30 As S Fe As (b) 1.70 2.70 3.70 4.70 5.70 6.70 7.70 8.70 9.70 (c)Mn Ba Pb SiMn 2.00 4.00 6.00 8.00 10.00 Fig. (11): Semi-quantitative analyses using the EDAX –SEM. a) Uranothorite, b) Arsenopyrite and c) Coronadite.
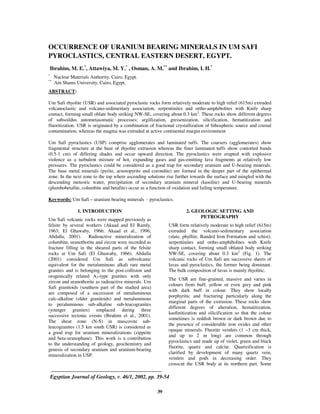
  • 9. 47 285 236 114 1133 905 167 55 35 95 0 200 400 600 800 1000 1200 Tunnel (n=12) Trenches (n=9) Greisen (n=4) eU(ppm) eTh(ppm) Ra(ppm) 35 45 55 65 75 0 3 6 9 12 15 18 Nephelin P-N B+T P-T Phonolite Benmorite Mugearite Hawaiite Basalt B-A Andesite Dacite Trachyandesite Rhyolite Trachyte SiO2 (wt) Na2O+K2O(wt) Fig. (2): Bar-diagram showing the average contents of eU, eTh and Ra (ppm) for the anomalies sites of Um Safi area. (n= number of samples) Fig. (3): Na2O+K2O versus SiO2 diagram for volcanic rocks, Um Safi area, after Cox et al., (1979). 0 1 2 3 4 5 6 1 10 100 1000 FeOT /MgO Cr(ppm) Abyssal tholeiites Field volcanic rocks of island arcs and continental margins 0 1 2 3 4 5 6 7 8 1 10 100 400 FeOT /MgO Ni(ppm) MORB Island arcs Fig. (4): Cr vs. FeOt /MgO for rhyolite, Um Safi area, after Miyashiro and Shido (1975). Fig. (5): Ni vs. FeOt /MgO for rhyolite, Um Safi area, after Miyashiro and Shido (1975). 0.003 0.01 0.1 1 10 100 1000 Sr K Rb Ba Nb Zr Y Rock/MORB ( a ) 0.1 1 10 100 Sr K Rb Ba Nb Zr Y Rock/C.C. ( b ) Fig. (6): Spider diagrams of normalized values of rhyolite, Um Safi area, after Hofmann (1988). a) related to MORB b) related to bulk continental crust
  • 10. 48 Ab Or Q Greisen Silicic Sodic Potassic P H2O= 1kb 0 1 2 3 4 5 6 7 0 1 2 3 4 5 6 7 Na (%) K(%) D esilicification K- m etasom atism Na - m etasom atism Argillition Silicification Fig. (7): Normative Q-Ab-Or ternary diagram, showing the alteration of volcanic rocks, Um Safi area, after Stemprok (1979). Fig. (8): Na% – K% variation diagram, showing the alteration types for volcanic rocks, Um Safi area, after Cuney et al. (1989). 1 313 SiO2 TiO2 Al2O3 Fe2O3 FeO MnO MgO CaO Na2O k2O P2O5 EnrichedDepleted Fresh Altered 1 10 3011030 Rb Sr Ba Zr Y Nb Zn Pb V Cr Ni Co Ga U Th EnrichedDepleted Fresh Altered Fig. (9): The enrichment and depletion of major oxides (a) and some trace elements (b) of the altered relative to the fresh rhyolite samples, Um Safi area. (a) (b)
  • 11. 49 Table (1): Result of chemical analyses and CIPW normative minerals for fresh volcanic rocks, Um Safi area. Fresh volcanic rocksMajor Oxides 1 2 3 4 5 6 7 SiO2 75.07 69.49 71.2 70.51 69.55 70.61 71.16 TiO2 0.13 0.12 0.11 0.12 0.11 0.13 0.11 Al3O3 12.5 14.09 13.85 14.12 14.62 14.29 13.09 Fe2O3 1.76 2.01 1.21 1.61 2.71 2.72 2.45 FeO 0.40 0.36 0.56 0.76 0.86 0.44 0.32 MnO 0.07 0.06 0.09 0.08 0.07 0.08 0.09 MgO 1.01 0.91 0.88 0.96 0.79 1.12 1.11 CaO 1.80 1.36 1.68 1.40 1.12 1.40 1.96 Na2O 3.93 4.63 3.80 3.90 3.75 3.64 4.10 K2O 3.36 4.43 4.55 4.24 4.58 3.79 3.46 P2O5 0.09 0.08 0.10 0.07 0.10 0.08 0.09 L.O.I 0.79 1.99 1.64 1.68 1.14 1.27 1.74 Total 99.91 99.53 99.67 99.54 99.41 99.57 99.68 Trace elements (in ppm) Rb 298 308 239 259 223 215 54 Sr 12 12 19 11 12 13 13 Ba 494 249 440 466 283 430 350 Zr 876 921 883 1005 1205 1007 1307 Y 282 296 283 321 387 321 420 Nb 32 31 33 30 32 31 30 Zn 23 37 48 31 56 28 41 Pb 78 81 38 36 75 41 595 V 5 5 7 7 5 5 5 Cr 58 97 86 78 120 95 110 Ni 1 3 3 3 5 4 2 Co 4 3 3 3 3 4 4 Ga 52 56 33 38 46 52 39 U* 32 24 25 29 28 17 34 Th* 41 51 44 49 48 32 75 CIPW normative values Q 34.61 22.49 27.69 27.98 27.38 31.01 29.54 Or 19.85 26.86 27.45 25.65 27.57 22.81 20.9 Ab 33.18 40.12 32.76 33.71 32.25 31.3 35.38 An 6.50 4.65 7.4 6.69 5.06 6.59 7.21 Di 1.47 1.39 0.40 - - - 1.7 Hy 1.84 1.69 2.08 2.47 2.01 2.85 2.05 C - - - 0.72 1.69 1.84 - Mt 1.14 1.03 1.79 2.39 2.73 1.32 1.03 Hm 0.97 1.35 - - 0.88 1.85 1.79 Il 2.25 0.23 0.21 0.23 0.21 0.25 0.21 Ap 0.20 0.18 0.22 0.16 0.22 0.18 0.20 * = Radiometric analyses
  • 12. 50 Table (2): Result of chemical analyses and CIPW normative minerals for altered volcanic rocks and greisen, Um Safi area. Altered volcanic Greisen Kaolinized Argillite Silicified FerrugenatedMajor Oxides 8 9 10 11 12 13 14 SiO2 70.57 71.11 72.05 76.7 81.5 80.06 69.07 TiO2 0.10 0.11 0.10 0.12 0.13 0.11 0.13 Al3O3 12.19 13.19 11.57 8.94 9.25 11.10 9.43 Fe2O3 3.03 2.18 4.39 3.39 0.81 2.42 10.2 FeO 0.52 0.20 0.28 0.56 0.36 0.80 1.64 MnO 0.14 0.18 0.08 0.08 0.11 0.04 0.18 MgO 2.00 2.80 1.20 0.80 0.80 0.80 0.60 CaO 2.80 1.68 2.24 1.98 1.68 1.12 1.96 Na2O 4.60 0.67 2.76 2.64 0.34 0.31 0.67 K2O 1.22 2.67 1.22 0.93 0.83 1.00 2.37 P2O5 0.10 0.13 0.10 0.10 0.10 0.12 0.15 L.O.I 2.70 3.56 3.94 3.70 3.55 2.08 2.47 Total 99.97 98.48 99.93 99.94 99.46 99.96 98.87 Trace elements (in ppm) Rb 114 39 112 84 22 507 646 Sr 10 13 14 12 13 12 12 Ba 232 257 226 233 241 98 100 Zr 1193 862 1148 830 855 1133 529 Y 385 277 370 269 274 363 169 Nb 32 32 31 34 35 30 28 Zn 144 80 788 729 248 316 325 Pb 68 44 38 36 49 266 409 V 5 3 4 4 4 4 5 Cr 69 99 78 87 119 86 87 Ni 1 2 2 1 1 2 2 Co 3 4 4 4 3 3 3 Ga 43 34 53 43 30 55 52 U* 105 74 435 426 522 101 125 Th* 249 304 2007 1736 2006 161 172 CIPW normative values Q 32.26 52.17 46.89 54.68 74.86 72.68 42.93 Or 7.42 16.64 7.52 5.72 5.12 6.04 14.54 Ab 39.97 5.97 24.3 23.18 3.00 2.68 5.87 An 9.24 7.98 10.97 9.6 8.08 4.96 9.18 Di 3.45 - - - - - - Hy 3.54 7.37 3.13 2.08 2.09 2.04 1.56 C - 6.75 1.92 0.20 5.16 4.83 2.60 Mt 1.89 0.96 0.91 1.78 1.19 2.44 5.70 Hm 1.81 1.63 3.95 2.29 0.02 3.85 17.02 Il 0.20 0.22 0.20 0.24 0.26 0.21 0.26 Ap 0.22 0.30 0.23 0.23 0.23 0.27 0.34 * = Radiometric analyses
  • 13. 51 Table (3): Average of chemical composition of the studied rhyolite in comparison with some Egyptian and World related rocks. RhyoliteMajor Oxides 1 2 3 4 5 6 SiO2 71.08 73.22 75.31 75.83 69.7 72.8 TiO2 0.12 0.42 0.23 0.24 0.38 0.28 Al2O3 13.79 12.59 12.55 12.3 14.0 13.3 Fe2O3 2.07 1.60 0.77 1.71 2.26 1.50 FeO 0.53 0.10 0.54 0.59 1.50 1.10 MnO 0.08 n.d 0.04 0.03 0.07 0.06 MgO 0.97 0.81 0.14 0.17 0.99 0.39 CaO 1.53 0.97 0.35 0.56 1.60 1.14 Na2O 3.96 5.38 3.86 3.32 4.20 3.60 K2O 4.06 3.58 4.29 4.12 4.10 4.30 P2O5 0.09 n.d 0.03 0.02 0.09 0.07 n.d= not determined 1-Average of fresh rhyolite of the studied area. 2-Average of rhyolite of Wadi Natash, Eastern Desert (Sayyah and El Shatoury, 1973). 3-Average of rhyolite of Wadi Kid, Sinai (Shahien, 1996). 4-Average of rhyolite of Abu Swayel, South Eastern Desert (Shahien, 1996). 5-Average of Egyptian rhyolite (Aly and Moustafa, 1984). 6-Average of World rhyolite (Le Maitre, 1976). Table (4): eU, eTh and Ra contents in ppm and K (%), eU/Ra, eU/eTh and eTh/eU ratios of rhyolite and anomalies. Radiometric measurements Rock types eU (ppm) eTh (ppm) Ra (ppm) K(%) eU/Ra eU/eTh eTh/eU Min. 17 32 12 1.75 1.4 0.4 1.7 Max. 34 75 14 4.29 2.4 0.6 2.2 Rhyolite (n=6) Average 26 50 13 2.99 2 0.5 1.9 Min. 53 236 13 0.39 3.7 0.2 2.8 Max. 563 2229 115 3.44 6.9 0.4 4.7 Tunnel (n=12) Average 285 1133 55 1.71 5.2 0.3 3.9 Min. 132 157 21 0.19 3.9 0.2 0.5 Max. 335 1188 49 4.4 9.7 2.1 5.8 Trenches (n=9) Average 236 905 35 1.6 7.0 0.5 4.1 Min. 101 161 90 2.08 1.09 0.62 1.33 Max. 125 172 97 2.66 1.29 0.75 1.61 Anomalies Greisen (n=4) Average 114 167 95 2.37 1.19 0.68 1.48