More Related Content
Similar to LUTI Formula (20)
LUTI Formula
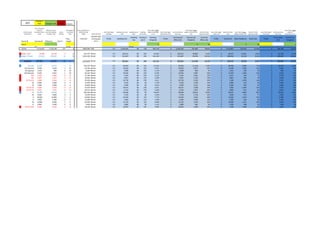
- 1. KEY
Change in
Row Change in Cell Check Answers
Parcel ID Area Sq.M. Efficiency Area H
Max.
Height
Total GLA
Named Type
of Urbanism
Note 2
% Mix Dwelling GLA
Dwelling
Size
Density/t
otal H
Dwelling
Weighted
% Mix
Commercial
Office GLA
Commercial
Weighted
Comm &
Office Jobs
% Mix Retail GLA Retail Weighted Retail Jobs % Mix
Community
GLA
Community
Weighted
Inputs 1 0 0 30 0 50 0
Sum Average Average
TOTAL 2,116,915 1,270,149 127 6 7,864,484 TOD 0.3 2,359,345 96 116 943,738 0 2,359,345 707,804 78,645 0 1,572,897 235,935 31,458 0 786,448 78,645
Stage 1 Gov 70,400 42,240 4 11 453,376 Mixed 0.3 136,013 80 242 54,405 0 136,013 40,804 4,534 0 90,675 13,601 1,814 0 45,338 4,534
Stage 1 Private 174,215 104,529 10 10 1,045,290 Mixed 0.3 313,587 80 225 125,435 0 313,587 94,076 10,453 0 209,058 31,359 4,181 0 104,529 10,453
Southern 287,835 172,701 17 7 1,272,870 Mixed 0.3 381,861 80 166 152,744 0 381,861 114,558 12,729 0 254,574 38,186 5,091 0 127,287 12,729
1A1 (wf) 32,255 19,353 2 10 193,530 Mixed 0.3 58,059 80 225 23,224 0 58,059 17,418 1,935 0 38,706 5,806 774 0 19,353 1,935
1A2 (a/care) 9,390 5,634 1 10 56,340 Mixed 0.3 16,902 80 225 6,761 0 16,902 5,071 563 0 11,268 1,690 225 0 5,634 563
1A3 (group) 1,610 966 0 10 9,660 Mixed 0.3 2,898 80 225 1,159 0 2,898 869 97 0 1,932 290 39 0 966 97
1A4 (houses) 9,420 5,652 1 10 56,520 Mixed 0.3 16,956 80 225 6,782 0 16,956 5,087 565 0 11,304 1,696 226 0 5,652 565
1B1 2,470 1,482 0 12 17,784 Mixed 0.3 5,335 80 270 2,134 0 5,335 1,601 178 0 3,557 534 71 0 1,778 178
1B2 2,695 1,617 0 12 19,404 Mixed 0.3 5,821 80 270 2,328 0 5,821 1,746 194 0 3,881 582 78 0 1,940 194
1C1 & 1C2 4,990 2,994 0 12 35,928 Mixed 0.3 10,778 80 270 4,311 0 10,778 3,234 359 0 7,186 1,078 144 0 3,593 359
1D 6,000 3,600 0 4 14,400 Mixed 0.3 4,320 80 90 1,728 0 4,320 1,296 144 0 2,880 432 58 0 1,440 144
1E 7,000 4,200 0 4 16,800 Mixed 0.3 5,040 80 90 2,016 0 5,040 1,512 168 0 3,360 504 67 0 1,680 168
1F1 & 1F2 4,920 2,952 0 12 35,424 Mixed 0.3 10,627 80 270 4,251 0 10,627 3,188 354 0 7,085 1,063 142 0 3,542 354
1F3 & 1F4 2,835 1,701 0 12 20,412 Mixed 0.3 6,124 80 270 2,449 0 6,124 1,837 204 0 4,082 612 82 0 2,041 204
1G 83,400 50,040 5 4 200,160 Mixed 0.3 60,048 80 90 24,019 0 60,048 18,014 2,002 0 40,032 6,005 801 0 20,016 2,002
1H 8,000 4,800 0 4 19,200 Mixed 0.3 5,760 80 90 2,304 0 5,760 1,728 192 0 3,840 576 77 0 1,920 192
1I 18,000 10,800 1 6 64,800 Mixed 0.3 19,440 80 135 7,776 0 19,440 5,832 648 0 12,960 1,944 259 0 6,480 648
1J 4,000 2,400 0 5 12,000 Mixed 0.3 3,600 80 113 1,440 0 3,600 1,080 120 0 2,400 360 48 0 1,200 120
1K 14,000 8,400 1 6 50,400 Mixed 0.3 15,120 80 135 6,048 0 15,120 4,536 504 0 10,080 1,512 202 0 5,040 504
1L 4,000 2,400 0 4 9,600 Mixed 0.3 2,880 80 90 1,152 0 2,880 864 96 0 1,920 288 38 0 960 96
1M1 & 1M2 6,090 3,654 0 10 36,540 Mixed 0.3 10,962 80 225 4,385 0 10,962 3,289 365 0 7,308 1,096 146 0 3,654 365
Input reflects % of
Community
Amount of total
space per workerMixed Use Type
Community Gross
Floor Area
Input reflects Value
weight of retail in mix
Input reflects % of
retail in mix
Input reflects Value
weight of Commercial in
mix
Amount of total
space per worker
Max Height as
per Hassell
2012
Area in
Hectares
Area is the Sq.M.
inside the
boundary of each
parcel
Efficiency is total
area minus parking
coverage + POS
Input reflects % of
Dwellings
Input reflects Value
weight of Dwellings
in mix
Dwelling Gross Floor
Area
Commercial Gross
Floor Area
Retail Gross Floor
Area
Parcel ID as per
Hassell 2012
Gross Lettable Area is
Efficiency X Max
Height
Dwelling Sizes in
Sq.M.
Dwellings
per Hectare
Input reflects % of
Commercial in mix
Input reflects Value
weight of
Community in mix