SlideShare a Scribd company logo
1 of 10
Download to read offline
International Journal of Engineering and Management Research e-ISSN: 2250-0758 | p-ISSN: 2394-6962
Volume-11, Issue-4 (August 2021)
www.ijemr.net https://doi.org/10.31033/ijemr.11.4.34
263 This Work is under Creative Commons Attribution-NonCommercial-NoDerivatives 4.0 International License.
Contributions of Productivity and Relative Price Changes to Wheat
Profitability Changes in China
Li Xiu-Shuang1
and Yu Kang2
1
College of Economics and Management, Zhejiang A & F University, Hangzhou 31130, CHINA
2
Research Academy for Rural Revitalization of Zhejiang Province, Zhejiang A & F University, Hangzhou 31130, CHINA
1
Corresponding Author: haileydeng@163.com
ABSTRACT
Using the provincial panel data of wheat from 1998
to 2018, based on the total price and quantity framework
proposed by O'Donnell(2010), and using Färe-Primont
productivity index, this artical decomposes the change of
wheat profitability into the change of input-output relative
price (TT) and the change of total factor productivity (TFP),
and further decomposes the change of TFP into technological
progress and efficiency change based on input orientation.
The results showed that the overall profitability of wheat
decreased by 24.9% compared with 1998, which was
attributed to the decrease of TT by 32.6% and the increase of
TFP by 11.4%. Results indicate that profitability change is
mainly driven by TT change, and the impact of TT change on
wheat profitability was alleviated by the compensatory
change of TFP. The main driving factor of wheat TFP growth
is technical progress, Compared with the growth of technical
progress, the technical efficiency grows slowly.
Keywords-- Profitability, Total Factor Productivity,
Relative Price Change, Färe-Primont Index, Data
Envelopment Analysis
I. INTRODUCTION
Since the reform and opening, China has rolled out a
series of major policies and measures to support
agriculture, so as to promote the sustained and stable
development of agriculture, ensure food production and
increase farmers' income. In 2020, the No.1 Document of
the Central Committee clearly pointed out that it is
necessary to further ensure the effective supply of grain
and promote the continuous increase of farmers' income.
Nowadays, although the output value of agricultural
production is increasing year by year, the cost of
agricultural production is also rising. Under the double
pressure of the limited price of agricultural products and
the increasing cost of agricultural production, farmers'
income is lower or even loss, farmers' income and
production enthusiasm cannot be effectively improved
(Wu Fangwei and Kang Jiaojiao, 2020). In addition, the
environmental and natural resource constraints of
agricultural development are becoming increasingly
severe, and the possibility for improving production by
increasing input factors is getting smaller and smaller
(Chen Xiwen, 2013), the future growth of agricultural
output depends fundamentally on the growth of TFP (Chen
Xiwen, 2012). In addition, the situation is complicated and
severe, the market fluctuates frequently, and the risks and
uncertainties increase. These factors make it increasingly
difficult to stabilize grain production and improve farmers'
income. When input prices, output prices and policies
change, farmers should adjust their production decisions,
and the output mix, input mix, production scale or
production technology will change, and these adjustments
will eventually affect farmers' production efficiency, cost,
income and profitability (Li Wenfu et al., 2015). Therefore,
under the new situation, it is of special practical
significance to research the changes of TFP, input-output
relative price and profitability of China's agriculture, and
to explore the main driving factors of profitability changes,
so as to stabilize food supply, improve farmers' production
enthusiasm and increase farmers' income.
Previous empirical studies have focused on study
the dynamics of productivity growth in the agricultural
sector, but few studies have investigated the relationship
between the input-output relative price, the change of
productivity and profitability of agricultura (Yeager and
Langemeier 2011, Mugera and Langemeier 2011). There
are two main types of measurement methods used in the
research of total factor productivity, the first is the
stochastic frontier method based on parameters (Wang Li
and Han Yali, 2016), the second is the nonparametric
method, and the nonparametric method mainly has two
forms, one is Malmquist index method based on data
envelopment analysis (Yu Hailong and Li Binglong, 2012;
Zhou Zhizhuan, 2014), and the other is the total quantity
analysis framework (Zhang Haixia, Han Peijun, 2018;
Zhao Liang, Yu Kang, 2019). Most of the above studies
only focuses on productivity and efficiency, which are
based on production technology and show how input is
transformed into output, but do not involve the profitability
closely related to the feasibility of farmers' management.
This is the problem that farmers are most concerned about.
Their goal may be to maximize profits or improve
profitability, but high profits are not always related to high
International Journal of Engineering and Management Research e-ISSN: 2250-0758 | p-ISSN: 2394-6962
Volume-11, Issue-4 (August 2021)
www.ijemr.net https://doi.org/10.31033/ijemr.11.4.34
264 This Work is under Creative Commons Attribution-NonCommercial-NoDerivatives 4.0 International License.
productivity, and vice versa.
In view of this, this paper intends to select wheat
as the research object, and use the framework first
proposed by O'Donnell(2010) to decompose the
profitability index of wheat production. The decomposition
process is divided into two stages. In the first stage, this
paper decompose the profitability index into two
multiplication parts: the relative price index which
measures the relative price changes of output and input and
the total factor productivity index. In the second stage, the
TFP index is decomposed into four multiplicative
efficiency measures: technological progress, technological
efficiency index, scale efficiency index and mixed
efficiency index. The framework clearly connects the three
variables of relative price, total factor productivity and
profitability, taking into account the production technology
and price, and provides a novel analysis framework for
measuring the main driving force of the change in wheat
profitability.
II. CONCEPTUAL FRAMEWORK
(1) Profitability Index Decomposition
By definition, TFP is the ratio of total output to
total input, input-output relative price is the ratio of total
output price to total input price, and profitability is the
ratio of total revenue to total cost. ( )
1 , ,
it it Mit
x x 
= 
x
, ( )
1 , ,
it it Nit
q q 
= 
q denote the input and output
quantity vectors for farm i in period t,
, denote the
input and output price vectors for farm i in period t.
( )
it it
X X
 x and ( )
it it
Q Q q
 denote the total intput and
total output, ( )
.
Q and ( )
.
X is a non-decreasing linear
homogeneous aggregate function, Total factor productivity
of i province in t year is defined as::
it it it
TFP Q X
= (1)
Then the TFP index of i province in t year and h province in s year is defined as:
, , ,
it hs it hs it hs it hs
TFPI TFPI TFPI QI XI
= = (2)
( ) ( )
,
it hs i hs
t
Q Q Q
 q q is the output quantity
index, ( ) ( )
,
it hs i hs
t
X X X
 q q is the input quantity index,
O’Donnell(2012)called the TFP index defined by this
as the multiplicatively-complete TFP index.
The total input prices index and total output
prices index is defined as: it it it it
W X

= w x and
t
it
it it i
P Q

= p q , Therefore, the profitability of i
province in t year is defined as:
it it it
it
it it it it
it
p q P Q
PROF
w x W X
=

=

(3)
The profitability indexes of i province in t year and h province in s year are as follows:
,
it it it hs hs
it hs
hs hs
h it
s it
PROF P Q P Q
PROFI
W X W X
PROF
= = (4)
, ,
it hs it hs
W
P is the ratio of the total output price
index to the total input price index, That is, relative price
index, which measures the increase of output price relative
to input price. Obviously, the index to measure the change
of profitability can be decomposed into the total factor
productivity index and relative price index. The former
component captures the difference in profitability between
the two province that is due purely to differences in output
and input prices, while the latter captures the difference in
profitability between the two provience that is due purely
to differences in output and input quantities. In other
words, the former component is a pure price effect, while
the latter is a pure quantity effect.
(2) Multiplicatively-Complete TFP Index Decomposition
The production efficiency is defined by the ratio
of practical TFP to the maximum feasible TFP under the
current technology, so the efficiency of i province in t year
is defined as:
( )
1 , ,
t t Mt
w w 
= 
w ( )
1 , ,
t t Mt
p p 
= 
p
International Journal of Engineering and Management Research e-ISSN: 2250-0758 | p-ISSN: 2394-6962
Volume-11, Issue-4 (August 2021)
www.ijemr.net https://doi.org/10.31033/ijemr.11.4.34
265 This Work is under Creative Commons Attribution-NonCommercial-NoDerivatives 4.0 International License.
* * *
it
it
i
it
i
it
t it
t X
TFP
T
F
Q X
Q
FPE
T P
=
= (5)
it
TFP
is the largest TFP that can be realized by
using the technology of t period. We choose the efficiency
index based on input orientation, which is defined as
follows:
input-oriented technical efficiency index (ITE): ITE t
t
t
X
X
=
input-oriented scale efficiency index(ISE):
° °
ISE t
t
t
t
t
Q X
Q X
=
input-oriented mix efficiency index(IME):
µ
IME t
t
t
X
X
=
input-oriented residual scale efficiency(RISE):
µ
IME t
t
t
X
X
=
input-oriented residual mix efficiency(RME):
µ
RISE t t
t
t
t
Q X
Q X
 
=
°
t
Q and °t
X are the total output and total input
when holding the output and input mixes fixed and TFP
reaches the maximum. t
X is the minimum total input when
holding the output and input mixes fixed, µ
t
X is the
minimum total input when the input combination is
variable.
Combined with formula (5), the decomposition of
TFP index is obtained:
( )
, , , , ,
hs it hs it hs it hs it
hs it TFP ITE
T ISE RM
FP E

=    (6)
(10) The first item on the right side of the
equation is the technological progress index, the first item
in brackets is the technological efficiency index, the
second item is the scale efficiency index, and the third item
is the residual mixed efficiency index.
There is another decomposition path of TFP
index, which is decomposed into technical progress index,
technical efficiency index, mixed efficiency index and
residual scale efficiency index, namely.
( )
, , , , ,
hs it hs it hs it hs it
hs it TFP ITE
T IME RIS
FP E

=    (7)
Considering that multiplicatively-complete TFP
index has two decomposition paths, if TFP index is
measured and decomposed according to only one
decomposition path, deviation may occur. Therefore, we
geometrically average the two decompositions paths.
, , , , , ,,
hs it hs it hs it hs it hs it hs it
st TFP ITE ISE
T RISE IME E
FP RM

 
=     
  (8)
(3) Estimate Method In this paper, TFP is estimated by Färe-Primont
TFP index, which is constructed as follows:
International Journal of Engineering and Management Research e-ISSN: 2250-0758 | p-ISSN: 2394-6962
Volume-11, Issue-4 (August 2021)
www.ijemr.net https://doi.org/10.31033/ijemr.11.4.34
266 This Work is under Creative Commons Attribution-NonCommercial-NoDerivatives 4.0 International License.
(9)
0
q and are nonzero vector,
0 0
( ) ( , , )
t t
Q q D x q t
= , 0 0
( ) ( , , )
t t
X x D x q t
= are distance
functions with constant input or output vectors in t period.
III. DATA DESCRIPTION
According to the output and input characteristics
of wheat production in china, One outputs, six inputs, and
their respective price indices are used in the computation
of profitability and productivity measures (see Table 1).
Among them, the sown area index was obtained from《
China Rural Statistical Yearbook》, and the other indexes
was obtained from《Compilation of cost-benefit data of
national agricultural products》. The《Compilation of
cost-benefit data of national agricultural products》
provides the average input per mu, so the total input was
obtained by multiplying the average input per mu by the
total sown area of corn. Since there is no specific data on
the quantity and price of machinery input in the《
Compilation of cost-benefit data of national agricultural
products》, we referring to Chen Shuzhang's(2003)
practice, the machinery input is measured as the
mechanical operation cost, the machinery price is
measured as price index of agricultural machinery. The
input of other factors is measured as the cost of other
factors, the price of other factors is measured as
agricultural production price index.
Tab1e 3.1: Index of variables
Quantity variables Price variables
Output
variables
Wheat production (ton) Wheat price (yuan/ton)
Input variables
Seed input (ton) Average price of seed(yuan/ton)
Chemical fertilizer input (ton) Average price of chemical fertilizer (yuan/ton)
Sown area (thousand hectares) Land rent (yuan/thousand hectares)
Employment days Labor price (yuan/day)
Mechanical operation cost(yuan) Price index of agriculturel machinery
Other factor inputs(yuan) Price index of Agricultural Means of Production
Considering the completeness and availability of
data, we selected the data of 15 provinces in China from
1998 to 2018, including Hebei, Shanxi, Inner Mongolia,
Heilongjiang, Jiangsu, Anhui, Shandong, Henan, Hubei,
Sichuan, Yunnan, Shaanxi, Gansu, Ningxia and Xinjiang.
IV. EMPIRICAL RESULTS
This section reports the estimated changes of
wheat profitability and its components, and all the
estimates were obtained using the professional version of
DPIN 3.0 software.
1. Changes of wheat profitability and its
components.
2. Dynamic analysis of national level
1. Changes of Wheat Profitability and its Components
Table 4.1 and Figure 1 provide the indexes of
wheat profitability, relative price and total factor
productivity compared with the base year in 1998. When
the index is greater than 1, it indicates that the index has
increased compared with 1998; otherwise, it indicates that
the index has decreased compared with 1998.
( )
( )
( )
( )
0 1
0 0 0 0
0 0 0 1 0 0
, , , ,
, , , ,
t
s t
s s
t
st
st
q t
Q
TF
q t
x x
D D
D x q t x t
X D q
P = =
0
x
International Journal of Engineering and Management Research e-ISSN: 2250-0758 | p-ISSN: 2394-6962
Volume-11, Issue-4 (August 2021)
www.ijemr.net https://doi.org/10.31033/ijemr.11.4.34
267 This Work is under Creative Commons Attribution-NonCommercial-NoDerivatives 4.0 International License.
Table 4.1: Index of wheat profitability and its components
Year Profitability Relative price Output price Input price TFP
1998 1.000 1.000 1.000 1.000 1.000
1999 0.981 0.919 1.049 1.142 1.068
2000 0.932 0.958 0.970 1.013 0.973
2001 1.000 0.987 0.963 0.975 1.013
2002 1.065 1.007 1.079 1.071 1.057
2003 1.096 1.080 1.140 1.056 1.015
2004 1.304 1.101 1.294 1.175 1.184
2005 1.061 0.954 1.187 1.245 1.113
2006 1.001 0.845 1.150 1.362 1.186
2007 0.843 0.724 1.101 1.519 1.163
2008 0.841 0.697 1.156 1.660 1.207
2009 0.778 0.658 1.198 1.820 1.181
2010 0.610 0.561 1.099 1.960 1.088
2011 0.592 0.505 1.104 2.185 1.172
2012 0.546 0.472 1.088 2.307 1.157
2013 0.502 0.463 1.131 2.442 1.085
2014 0.539 0.453 1.145 2.527 1.189
2015 0.507 0.433 1.101 2.545 1.172
2016 0.489 0.422 1.088 2.575 1.157
2017 0.511 0.434 1.137 2.622 1.177
2018 0.441 0.407 1.064 2.617 1.085
Average 0.751 0.674 1.104 1.639 1.114
Figure 1: Index of wheat profitability and its components
In the study period, the profitability of wheat was
lower than that in 1998 except in 2001-2006, and the
profitability index fluctuated between 0.441 and 1.304,
which was 24.9% lower than that in 1998 , Average annual
decline of 1.1%(dlnprof = ln (1.249/2018-2018)). This
indicates that the sharp decline of TT is the main driving
0.3
0.5
0.7
0.9
1.1
1.3
PROFI TTI TFPI
International Journal of Engineering and Management Research e-ISSN: 2250-0758 | p-ISSN: 2394-6962
Volume-11, Issue-4 (August 2021)
www.ijemr.net https://doi.org/10.31033/ijemr.11.4.34
268 This Work is under Creative Commons Attribution-NonCommercial-NoDerivatives 4.0 International License.
force for the decline of wheat profitability, and the impact
of TT change on wheat profitability is alleviated by the
compensatory change of TFP. In terms of stages, the
change of wheat profitability can be divided into two
stages: in the first stage (1998-2004), wheat profitability
showed an increasing trend, with an average increase of
4.8% compared with 1998, TT increased by 0.57%, and
TFP increased by 4.3%; In the second stage (2004-2018),
the profitability of wheat showed a downward trend, with
an average decrease of 51.3% compared with that in 2004,
which was attributed to the decrease of TT by 50% and
TFP by 2.8%.
From Table 4.1, it can be found that except for
2002, 2003 and 2004, TT is still significantly lower than
that in 1998. In order to explore the main reasons for the
significant decline in TT, we further decomposes TT
changes into total output price changes and total input
price changes. It was found that the total output price
increased by an average of 10.4% (0.49% per year)
compared with 1998, while the total input price increased
by an average of 63.9% (2.5% per year) compared with
1998, indicating that the slow growth of total output price
and the substantial increase of total input price were the
main reasons for the sharp decline of wheat TT. The
significant increase in the price of total inputs was mainly
due to the significant increase in the wages of employees
and land rentals, which increased by 144.5% and 117.8%
respectively compared with 1998. Compared with 1998,
the prices of seeds and other inputs increased by 14.2%
and 29.6% respectively, while the prices of chemical
fertilizers and machinery decreased.
During the study period, TFP of wheat showed a
fluctuating growth overall. Except in 2000, the TFP of
wheat increased compared with 1998, and the TFP index
fluctuated between 0.973 and 1.207, with an average
increase of 11.4% (average annual increase of 0.54%)
compared with 1998. Its growth is characterized by stages:
in the first stage (1998-2008), wheat TFP showed a sharp
growth trend, with an average annual growth rate of
1.71%; In the second stage (2009-2018), wheat TFP
decreased slightly in a fluctuating manner, with an average
annual decline rate of about 2.1%. Generally speaking,
China's wheat industry is facing the dilemma of relative
price deterioration, Although farmers strive to improve
production efficiency, their profitability is still declining.
2. Dynamic Analysis at Provincial Level
Table 4.2 provides the estimated value of the
profitability and its components of each province. Since
the Färe-Primont productivity index satisfy the transitivity
test, therefore, it can be used for cross-time and cross-
space comparison, not only for comparison within
provinces, but also for comparison among provinces. The
value marked with "a" in the table indicates the highest
among 15 provinces, and the value marked with "b"
indicates the lowest among 15 provinces.
Table 4.2: Index of profitability and its components of each province
Province
Profitability Relative price TFP
1998 2018 ∆ 1998 2018 ∆ 1998 2018 ∆
Hebei 2.256 1.358 0.602 3.324b
2.096 0.631a
0.679 0.648 0.954
Shanxi 1.815b
1.149 0.633 3.606 2.109 0.585 0.503 0.545 1.082
Inner Mongolia 3.329 1.909a
0.573 6.589 2.953 0.448 0.505 0.647 1.280
Heilongjiang 2.664 1.637 0.614 5.671 2.587 0.456 0.470 0.633 1.347
Jiangsu 1.979 1.397 0.706a
4.761 2.126 0.447 0.416b
0.657 1.581a
Anhui 2.913 1.400 0.481 6.567 2.518 0.383 0.444 0.556 1.254
Shandong 2.515 1.229 0.489 3.616 1.713 0.474 0.696a
0.717a
1.031
Henan 2.561 1.418 0.554 4.641 2.335 0.503 0.552 0.607 1.100
Hubei 3.504 0.836 0.239b
7.568 1.619b
0.214b
0.463 0.516 1.115
Sichuan 5.795 1.433 0.247 12.032a
2.790 0.232 0.482 0.514 1.067
Yunnan 5.884a
1.728 0.294 11.870 3.621a
0.305 0.496 0.477 0.962
Shaanxi 2.973 1.140 0.383 6.208 1.803 0.290 0.479 0.632 1.320
Gansu 2.450 0.808b
0.330 3.768 1.798 0.477 0.650 0.450b
0.692b
Ningxia 3.435 1.216 0.354 4.948 2.121 0.429 0.694 0.573 0.826
Xinjiang 2.478 1.211 0.489 3.622 1.803 0.498 0.684 0.672 0.982
Note: a indicates the highest value among 15 provinces, and b indicates the lowest value among 15 provinces.
International Journal of Engineering and Management Research e-ISSN: 2250-0758 | p-ISSN: 2394-6962
Volume-11, Issue-4 (August 2021)
www.ijemr.net https://doi.org/10.31033/ijemr.11.4.34
269 This Work is under Creative Commons Attribution-NonCommercial-NoDerivatives 4.0 International License.
It can be seen from Table 2 that the profitability
of 15 provinces decreased compared with that of 1998,
among which the profitability of Jiangsu Province
decreased the least (reduced by 29.4%), mainly due to its
higher TFP growth (incresed by 58.1%), and its TFP
growth rate was the highest among 15 provinces. Hubei
Province has the highest decline in profitability (reduced
by 76.1%), which is attributed to the sharp decline in TT
(reduced by 78.6%), and the decline in TT is the highest
among 15 provinces. Profitability varies greatly among
provinces, with Inner Mongolia having the highest
profitability (PROF=1.909) and Gansu having the lowest
profitability (PROF=0.808) in 2018. The relative price
levels of different provinces also show great differences. In
1998, the TT level in Sichuan Province was as high as
12.03, while that in Hebei Province was only 3.32.
Compared with 1998, TT in all provinces decreased in
2018, among which Hubei Province showed the largest
decrease, which was 78.6% lower than that in 1998. In
addition, the inter-provincial difference of TT in 2018 is
smaller than that in 1998, with Yunnan province having
the highest TT (TT=3.621) and Hubei province having the
lowest TT (TT=1.619). Compared with the decrease of
profitability and relative price level, TFP in most provinces
showed positive growth, among which Jiangsu Province
had the highest growth rate, which increased by 58.1%
compared with 1998, while TFP in some provinces showed
negative growth, such as Gansu (decreased by 30.8%) and
Ningxia (decreased by 17.4%).
1. TFP and its component changes.
2. Dynamic analysis at provincial level.
1. TFP and its Component Changes
Table 4.3: Changes of TFP and its components
Year TFP technical progress technical efficiency Scale efficiency Mixing efficiency
1998 1.000 1.000 1.000 1.000 1.000
1999 1.068 1.111 1.002 0.975 0.983
2000 0.973 0.976 1.009 0.974 1.015
2001 1.013 1.019 1.034 0.948 1.013
2002 1.057 1.052 1.035 0.940 1.034
2003 1.015 1.022 1.036 0.947 1.012
2004 1.184 1.183 1.038 0.924 1.044
2005 1.113 1.072 1.020 0.945 1.077
2006 1.186 1.094 1.021 0.960 1.106
2007 1.163 1.114 1.010 0.947 1.093
2008 1.207 1.178 1.015 0.939 1.074
2009 1.181 1.132 1.015 0.944 1.088
2010 1.088 1.058 1.010 0.933 1.091
2011 1.172 1.138 1.011 0.940 1.084
2012 1.157 1.069 1.025 0.965 1.095
2013 1.085 1.048 0.999 0.953 1.087
2014 1.189 1.184 0.990 0.954 1.063
2015 1.172 1.163 0.996 0.969 1.044
2016 1.157 1.128 1.009 0.979 1.038
2017 1.177 1.155 0.993 0.966 1.062
2018 1.085 1.031 1.010 0.979 1.065
Average 1.114 1.090 1.013 0.956 1.055
International Journal of Engineering and Management Research e-ISSN: 2250-0758 | p-ISSN: 2394-6962
Volume-11, Issue-4 (August 2021)
www.ijemr.net https://doi.org/10.31033/ijemr.11.4.34
270 This Work is under Creative Commons Attribution-NonCommercial-NoDerivatives 4.0 International License.
Figure 2: TFP and its component changes
Table 4.3 and Figure 2 provide the index of TFP
and its components compared with 1998. It can be seen
from Figure 2 that the main driving factor of wheat TFP
growth is technical progress, which is 9% higher than that
in 1998 (with an average annual growth of 3.2%). This is
also directly manifested in that the changing trends of the
two are consistent, and the direction of the wave, the
location of the wave trough, and the wave crest are highly
consistent. This may be due to the planned introduction of
international advanced agricultural science and technology
projects from abroad in 1994, including the introduction of
new varieties and technologies (Zhu Mande and Huang
Qingqing, 2020), which significantly promoted
technological progress. Compared with the substantial
increase of technological progress, the change of
technological efficiency is relatively gentle, with an
increase of only 1.3% (average annual increase of 0.61%)
compared with that in 1998, indicating that the best use of
existing technologies has not contributed much to the
growth of TFP, which may be due to the fact that farmers
are mainly engaged in small-scale decentralized
operations. Even if the government has been promoting
agricultural technology for a long time, the farmers are
limited by their knowledge level and resource
endowments, and have low acceptance of new
technologies and insufficient adoption motivation, which
results in poor use of new technologies.
The change of wheat mixing efficiency showed
the characteristics of stages: in the first stage (1998-2006),
the wheat mixing efficiency showed a large increase with
an average annual growth rate of 1.3%; In the second stage
(2007-2018), the mixing efficiency of wheat showed a
downward trend, with an average annual decline of 1.3%.
This means that the change of wheat factor input structure
promotes the growth of wheat TFP in the first stage, but
hinders the growth of wheat TFP in the second stage. This
may be due to the fact that China began to implement the
policy of minimum purchase price of wheat in Jiangsu,
Shandong, Hebei, Anhui, Henan and Hubei provinces in
2006, which prompted a large number of cultivated land
and other factors in these areas to flood into wheat
production. At the same time, farmers expected the future
increase of wheat planting income, and tended to increase
fertilizer input, which was not conducive to the
optimization of factor input structure and hindered the
growth of mixing efficiency, thus inhibiting the growth of
wheat TFP to a certain extent.
Scale efficiency showed a downward trend from
1998 to 2004 and slowly increased from 2004 to 2018, but
on the whole, scale efficiency still decreased by an average
of 4.4% as compared with 1998 (with an average annual
decrease of 0.23%), indicating that the change in wheat
scale not only did not promote the growth of wheat TFP,
but even hindered its growth to a certain extent. In recent
years, the government has encouraged moderate scale
operation of agriculture through various forms, such as
land transfer and subsidies from scale operators, which has
promoted the scale operation of wheat. The scale
efficiency of wheat has also shown an increasing trend in
recent years, but the scale efficiency is still low. It is still
an important task to improve wheat TFP in the future to
promote moderate scale operation of wheat and to promote
the improvement of scale efficiency.
2. Dynamic Analysis at Provincial Level
0.90
0.95
1.00
1.05
1.10
1.15
1.20
TFP technical progress technical efficiency
Scale efficiency Mixing efficiency
International Journal of Engineering and Management Research e-ISSN: 2250-0758 | p-ISSN: 2394-6962
Volume-11, Issue-4 (August 2021)
www.ijemr.net https://doi.org/10.31033/ijemr.11.4.34
271 This Work is under Creative Commons Attribution-NonCommercial-NoDerivatives 4.0 International License.
Table 4.5: Changes in TFP and its Components by Province
Provience
TFP Technical efficiency Scale efficiency Mix efficiency
1998 2018 ∆ 1998 2018 ∆ 1998 2018 ∆ 1998 2018 ∆
Hebei 0.679 0.648 0.954 1.000a
0.917 0.917 1.000a 0.997 0.997 0.976 0.988 1.012
Shanxi 0.503 0.545 1.082 0.859 0.823b
0.959 0.954 0.976 1.024a
0.884 0.944 1.069
Inner Mongolia 0.505 0.647 1.280 1.000a
0.985 0.985 1.000a
0.978 0.979 0.727 0.936 1.288
Heilongjiang 0.470 0.633 1.347 1.000a
1.000a
1.000 1.000a
0.939 0.940 0.676b
0.939 1.390a
Jiangsu 0.416b
0.657 1.581a
0.744b
1.000a
1.344a
0.991 0.999 1.008 0.811 0.917 1.131
Anhui 0.444 0.556 1.254 0.918 1.000a
1.089 0.980 0.987 1.007 0.709 0.786 1.109
Shandong 0.696a
0.717a
1.031 1.000a
1.000a
1.000 1.000a
1.000a
1.000 1.000a
1.000a
1.000
Henan 0.552 0.607 1.100 1.000a
1.000a
1.000 1.000a
0.920 0.920 0.793 0.920 1.160
Hubei 0.463 0.516 1.115 0.953 0.944 0.991 0.986 0.947 0.960 0.708 0.805 1.136
Sichuan 0.482 0.514 1.067 1.000a
1.000a
1.000 1.000a
0.988 0.988 0.693 0.725 1.047
Yunnan 0.496 0.477 0.962 1.000a
1.000a
1.000 0.999 0.972 0.972 0.713 0.684b
0.960
Shaanxi 0.479 0.632 1.320 0.902 1.000a
1.109 0.995 0.983 0.988 0.768 0.896 1.168
Gansu 0.650 0.450b
0.692b
1.000a
0.828 0.829b
0.975b
0.984 1.009 0.959 0.769 0.802b
Ningxia 0.694 0.573 0.826 1.000a
1.000a
1.000 0.999 0.902b
0.903b
0.999 0.886 0.887
Xinjiang 0.684 0.672 0.982 1.000a
1.000a
1.000 1.000a
0.996 0.996 0.984 0.940 0.956
Note: a represents the highest of the 15 provinces; b represents the lowest of the 15 provinces
The input-oriented efficiency estimates reported
in Table 4.5 show that, throughout the sample period, most
provinces have relatively high technical efficiency
(exceptions include Jiangsu and Shanxi provinces in 1998,
Shanxi and Gansu provinces in 2018) and relatively high
scale efficiency, but overall mixing efficiency is relatively
low, especially Heilongjiang and Sichuan provinces in
1998 and Yunnan and Gansu provinces in 2018. From the
growth rate of TFP, except for Hebei, Yunnan, Gansu,
Ningxia and Xinjiang, the TFP value of other provinces
increased positively compared with that of 1998, with
Jiangsu province having the highest growth rate. From the
perspective of input-oriented efficiency growth rate,
Jiangsu Province's technological efficiency grew from the
lowest in 1998 to the highest in 2018, becoming the
province with the highest growth rate of technological
efficiency, up 34.3% as compared with 1998, while Gansu
Province's technological efficiency showed a downward
trend, with the highest decline rate among 15 provinces,
down 17.1% as compared with 1998. Except for a few
provinces, the scale efficiency of most provinces decreased
compared with that of 1998, while the mixed efficiency as
a whole showed positive growth (except for Gansu,
Ningxia and Xinjiang).
V. CONCLUSIONS
This paper uses the provincial panel data from
1998 to 2018 to study the profitability and TFP changes of
wheat in China. By decomposing the changes of wheat
profitability into the changes of input-output relative price
and TFP, and further decomposing the changes of TFP into
the changes of technical progress and input-oriented
efficiency, the main driving forces of wheat profitability
and TFP changes were explored. The main conclusions are
as follows:
(1) During the research period, the national wheat
profitability showed a downward trend, with an average
decrease of 24.9% as compared with 1998, due to the
decrease of TT by 32.6% and the increase of TFP by
11.4%. The significant decrease in TT is the main driving
force for the decrease in wheat profitability. The impact of
TT change on wheat profitability is mitigated by the
compensatory change in total factor productivity. By
further decomposing the change of TT, it is found that the
slow growth of total output price and the sharp increase of
total input price are the main reasons for the sharp
decrease of TT in wheat. The significant increase in total
input price was due to the significant increase in the wages
of employees and land rentals.
(2) The growth of wheat TFP presents the
characteristics of stages: in the first stage (1998-2008),
wheat TFP shows a significant growth trend with an
average annual growth rate of 1.71%; In the second stage
(2009-2018), the wheat TFP showed a fluctuating and
small decrease trend, with an average annual decrease rate
of 2.1%. The main driver of wheat TFP growth was
technological progress, which increased by 9% on average
(3.2% on average) as compared with 1998. Compared with
the significant increase in technological progress, the
International Journal of Engineering and Management Research e-ISSN: 2250-0758 | p-ISSN: 2394-6962
Volume-11, Issue-4 (August 2021)
www.ijemr.net https://doi.org/10.31033/ijemr.11.4.34
272 This Work is under Creative Commons Attribution-NonCommercial-NoDerivatives 4.0 International License.
change in technological efficiency is relatively gentle, with
an increase of only 1.3% as compared with 1998 (with an
average annual growth rate of 0.61%), indicating that the
best use of existing technologies has little contribution to
the growth of TFP. The change of wheat mixing efficiency
also presents the characteristics of stages: in the first stage
(1998-2006), the wheat mixing efficiency is in positive
growth with an average annual growth rate of 1.3%; In the
second stage (2007-2018), the wheat mixing efficiency
showed a downward trend, with an average annual
decrease of 1.3%. This means that the change of mixing
efficiency gradually changes from promoting the growth of
wheat TFP to hindering the growth of wheat TFP. On the
whole, the scale efficiency is still lower than that of 1998,
with an average decrease of 4.4% (with an average annual
decrease of 0.23%).
The policy implications of this research
conclusion are as follows:
First, the slow increase in production efficiency and the
sharp drop in the relative prices are the two major factors
that restrict the improvement of wheat profitability. To
improve the profitability of wheat cultivation, the
government needs to shift its perspective from a single
demand-side price incentive to a multi-directional supply-
side support, such as controlling the growth of input prices,
enhancing the level of intensification, and providing more
and better public services. In addition, we should further
promote the function of agricultural cooperatives and
strengthen the standard of farmers' organization. Farmers
are at a disadvantage in the market and only passively
accept the market price. If the standard of farmers'
organization is improved, farmers can improve their
bargaining power in all aspects of production and sales by
virtue of their scale advantages.
Secondly, TFP of wheat grows slowly, which has a limited
effect on profitability. In the future, it is still necessary to
promote the improvement of agricultural TFP . In view of
the fact that technological progress and the growth of
mixing efficiency are the two main driving forces for the
improvement of wheat TFP, the improvement of wheat
TFP should focus on technological progress and the
optimization of factor input structure. On the one hand, we
should strengthen the research and development of new
technologies; on the other hand, we should attracting high-
quality talents into the agricultural field through the
preferential subsidy policy for agricultural innovation, and
improve the overall quality of labor in the agricultural
field. At the same time, we should popularize the training
of agricultural production technologies in rural areas, and
vigorously promote new crop varieties and emerging
technologies. In addition, we should vigorously promote
mechanized operation, integrate land resources.
Meanwhile, we should increase investment in research and
development of agricultural machinery manufacturing
technology to effectively solve the problems in the process
of mechanical operation, which can not only replace labor
input, but also effectively reduce material input, promote
the optimization of factor input structure and improve
production efficiency.
REFERENCES
[1] Chen Xiwen. (2013). Building a new agricultural
management system and speeding up the development of
modern agriculture. Economic Research, 48(02), 4-6.
[2] Chen Xiwen. (2012). Several main problems of
agricultural modernization with Chinese characteristics.
Reform, 10, 5-8.
[3] Li Wenfu, Zhang Minzhong, & Wang Yuanhui. (2015).
Measuring and decomposing the changes of productivity and
profitability of Taiwan Province banking industry. Economic
Research, 51(02).
[4] Mugera, A., M.R. Langemeier., & A.M.Featherstone.
(2012). Labor productivity growth in the kansas farm sector:
A tripartite decomposition using non-parametric approach.
Agriculture and Resource Economics Review, 41, 298–312.
[5] O’DONNELL C J. Measuring and decomposing
agricultural productivity and profitability change. Australian
Journal of Agricultural and Resource Economics, 54(4): 527-
60.
[6] O'DONNELL C J. (2012). Nonparametric estimates of the
components of productivity and profitability change in U.S.
agriculture. American Journal of Agricultural Economics,
94(4).
[7] Wang Li & Han Yali. (2016). An empirical analysis of
China's cotton TFP growth-based on stochastic frontier
analysis. Agricultural Technology and Economy, 11, 95-105.
[8] Wu Fangwei & Kang Jiaojiao. (2020). Agricultural
subsidy, relative price of factors and farmland circulation.
Financial Research, 46(05), 81-93.
[9] Yeager, E.A. & M.R. Langemeier. (2011). Productivity
divergence across kansas farms. Agricultural and Resource
Economics Review, 40, 282–292.
[10] Yu Hailong & Li Binglong. (2012). Analysis of total
factor productivity and its influencing factors in china dairy-
based on DEA-Tobit model. Journal of Xi 'an University of
Finance and Economics, 25(05), 33-38.
[11] Zhang Haixia & Han Peijun. (2018). Measurement and
convergence analysis of agricultural total factor productivity-
based on Hicks-Moorsteen index. Rural Economy, 06, 55-61.
[12] Zhao Liang & Yu Kang. (2019). Factor input structure
and the growth of total factor productivity of grain in major
producing areas — Based on the input-output panel data of
major producing areas from 1978 to 2017. Journal of Hunan
Agricultural University (Social Science Edition), 20(05), 8-
13.
[13] Zhou Zhizhuan. (2014). Study on the spatio-temporal
characteristics of China's agricultural productivity-a
nonparametric measurement framework based on sequential
DEA. Hubei Social Sciences, 02, 78-83.

More Related Content

What's hot

Bhutan: Maize - Market Report. Analysis And Forecast To 2025
Bhutan: Maize - Market Report. Analysis And Forecast To 2025Bhutan: Maize - Market Report. Analysis And Forecast To 2025
Bhutan: Maize - Market Report. Analysis And Forecast To 2025IndexBox Marketing
 
World: Polyethylene Terephthalate (In Primary Forms) - Market Report. Analysi...
World: Polyethylene Terephthalate (In Primary Forms) - Market Report. Analysi...World: Polyethylene Terephthalate (In Primary Forms) - Market Report. Analysi...
World: Polyethylene Terephthalate (In Primary Forms) - Market Report. Analysi...IndexBox Marketing
 
Consumer Price Index and Wholesale Price Index
Consumer Price Index and Wholesale Price IndexConsumer Price Index and Wholesale Price Index
Consumer Price Index and Wholesale Price IndexLekshmiNathB
 
Proceeding aciar beefcattle_ias team_jan_2014
Proceeding aciar beefcattle_ias team_jan_2014Proceeding aciar beefcattle_ias team_jan_2014
Proceeding aciar beefcattle_ias team_jan_2014Ho Cao Viet
 
U.S. Organic Almond Market. Analysis and Forecast To 2025
U.S. Organic Almond Market. Analysis and Forecast To 2025U.S. Organic Almond Market. Analysis and Forecast To 2025
U.S. Organic Almond Market. Analysis and Forecast To 2025IndexBox Marketing
 
World: Polypropylene (In Primary Forms) - Market Report. Analysis and Forecas...
World: Polypropylene (In Primary Forms) - Market Report. Analysis and Forecas...World: Polypropylene (In Primary Forms) - Market Report. Analysis and Forecas...
World: Polypropylene (In Primary Forms) - Market Report. Analysis and Forecas...IndexBox Marketing
 
Competitive Performance of the Olive Oil in Tunisia
Competitive Performance of the Olive Oil in TunisiaCompetitive Performance of the Olive Oil in Tunisia
Competitive Performance of the Olive Oil in TunisiaAgriculture Journal IJOEAR
 
Consumer price index number
Consumer price index numberConsumer price index number
Consumer price index numberHasnain Baber
 
Trends, Growth and Instability of Teff Production in Ethiopia
Trends, Growth and Instability of Teff Production in EthiopiaTrends, Growth and Instability of Teff Production in Ethiopia
Trends, Growth and Instability of Teff Production in Ethiopiapaperpublications3
 
Migration, labor supply, wages and agriculture
Migration, labor supply, wages and agricultureMigration, labor supply, wages and agriculture
Migration, labor supply, wages and agricultureAlexander Decker
 
World: Potato - Market Report. Analysis And Forecast To 2020
World: Potato - Market Report. Analysis And Forecast To 2020World: Potato - Market Report. Analysis And Forecast To 2020
World: Potato - Market Report. Analysis And Forecast To 2020IndexBox Marketing
 
Agricultural Export, Oil Export and Economic Growth in Nigeria: Multivariate ...
Agricultural Export, Oil Export and Economic Growth in Nigeria: Multivariate ...Agricultural Export, Oil Export and Economic Growth in Nigeria: Multivariate ...
Agricultural Export, Oil Export and Economic Growth in Nigeria: Multivariate ...Agriculture Journal IJOEAR
 
World: Sausages And Similar Products Of Meat - Market Report. Analysis And Fo...
World: Sausages And Similar Products Of Meat - Market Report. Analysis And Fo...World: Sausages And Similar Products Of Meat - Market Report. Analysis And Fo...
World: Sausages And Similar Products Of Meat - Market Report. Analysis And Fo...IndexBox Marketing
 

What's hot (20)

Bhutan: Maize - Market Report. Analysis And Forecast To 2025
Bhutan: Maize - Market Report. Analysis And Forecast To 2025Bhutan: Maize - Market Report. Analysis And Forecast To 2025
Bhutan: Maize - Market Report. Analysis And Forecast To 2025
 
Table
TableTable
Table
 
World: Polyethylene Terephthalate (In Primary Forms) - Market Report. Analysi...
World: Polyethylene Terephthalate (In Primary Forms) - Market Report. Analysi...World: Polyethylene Terephthalate (In Primary Forms) - Market Report. Analysi...
World: Polyethylene Terephthalate (In Primary Forms) - Market Report. Analysi...
 
Consumer Price Index and Wholesale Price Index
Consumer Price Index and Wholesale Price IndexConsumer Price Index and Wholesale Price Index
Consumer Price Index and Wholesale Price Index
 
Proceeding aciar beefcattle_ias team_jan_2014
Proceeding aciar beefcattle_ias team_jan_2014Proceeding aciar beefcattle_ias team_jan_2014
Proceeding aciar beefcattle_ias team_jan_2014
 
U.S. Organic Almond Market. Analysis and Forecast To 2025
U.S. Organic Almond Market. Analysis and Forecast To 2025U.S. Organic Almond Market. Analysis and Forecast To 2025
U.S. Organic Almond Market. Analysis and Forecast To 2025
 
Kathirvel
KathirvelKathirvel
Kathirvel
 
Ppt on wpi cpi
Ppt on wpi cpiPpt on wpi cpi
Ppt on wpi cpi
 
World: Polypropylene (In Primary Forms) - Market Report. Analysis and Forecas...
World: Polypropylene (In Primary Forms) - Market Report. Analysis and Forecas...World: Polypropylene (In Primary Forms) - Market Report. Analysis and Forecas...
World: Polypropylene (In Primary Forms) - Market Report. Analysis and Forecas...
 
Competitive Performance of the Olive Oil in Tunisia
Competitive Performance of the Olive Oil in TunisiaCompetitive Performance of the Olive Oil in Tunisia
Competitive Performance of the Olive Oil in Tunisia
 
Consumer price index number
Consumer price index numberConsumer price index number
Consumer price index number
 
Whole Sale Price Index
Whole Sale Price IndexWhole Sale Price Index
Whole Sale Price Index
 
Inflation measuring
Inflation measuringInflation measuring
Inflation measuring
 
Trends, Growth and Instability of Teff Production in Ethiopia
Trends, Growth and Instability of Teff Production in EthiopiaTrends, Growth and Instability of Teff Production in Ethiopia
Trends, Growth and Instability of Teff Production in Ethiopia
 
Cpi & wpi
Cpi & wpiCpi & wpi
Cpi & wpi
 
Migration, labor supply, wages and agriculture
Migration, labor supply, wages and agricultureMigration, labor supply, wages and agriculture
Migration, labor supply, wages and agriculture
 
World: Potato - Market Report. Analysis And Forecast To 2020
World: Potato - Market Report. Analysis And Forecast To 2020World: Potato - Market Report. Analysis And Forecast To 2020
World: Potato - Market Report. Analysis And Forecast To 2020
 
Agricultural Export, Oil Export and Economic Growth in Nigeria: Multivariate ...
Agricultural Export, Oil Export and Economic Growth in Nigeria: Multivariate ...Agricultural Export, Oil Export and Economic Growth in Nigeria: Multivariate ...
Agricultural Export, Oil Export and Economic Growth in Nigeria: Multivariate ...
 
World: Sausages And Similar Products Of Meat - Market Report. Analysis And Fo...
World: Sausages And Similar Products Of Meat - Market Report. Analysis And Fo...World: Sausages And Similar Products Of Meat - Market Report. Analysis And Fo...
World: Sausages And Similar Products Of Meat - Market Report. Analysis And Fo...
 
Wpi
WpiWpi
Wpi
 

Similar to Contributions of Productivity and Relative Price Changes to Wheat Profitability Changes in China

Impact of Rice Export Restrictions Policy on Stakeholders in Egypt
Impact of Rice Export Restrictions Policy on Stakeholders in EgyptImpact of Rice Export Restrictions Policy on Stakeholders in Egypt
Impact of Rice Export Restrictions Policy on Stakeholders in EgyptDr. Mohamed Elzaabalawy
 
overview--productivity management.ppt
overview--productivity management.pptoverview--productivity management.ppt
overview--productivity management.ppt43SumantaDas
 
overview--productivity management - example
overview--productivity management - exampleoverview--productivity management - example
overview--productivity management - exampleThái Trương Đình
 
Productivity management
Productivity managementProductivity management
Productivity managementAyisha Kowsar
 
Technical efficiency in agriculture in ghana analyses of determining factors
Technical efficiency in agriculture in ghana analyses of determining factorsTechnical efficiency in agriculture in ghana analyses of determining factors
Technical efficiency in agriculture in ghana analyses of determining factorsAlexander Decker
 
A Primer on Cointegration: Application to Nigerian Gross Domestic Product and...
A Primer on Cointegration: Application to Nigerian Gross Domestic Product and...A Primer on Cointegration: Application to Nigerian Gross Domestic Product and...
A Primer on Cointegration: Application to Nigerian Gross Domestic Product and...IOSR Journals
 
The Substitution of Cereal Production Factors: DEA-based Approach
The Substitution of Cereal Production Factors:  DEA-based ApproachThe Substitution of Cereal Production Factors:  DEA-based Approach
The Substitution of Cereal Production Factors: DEA-based ApproachAgriculture Journal IJOEAR
 
Chap3 m0-nguyen khac minh-soeg- pp 109
Chap3 m0-nguyen khac minh-soeg- pp 109Chap3 m0-nguyen khac minh-soeg- pp 109
Chap3 m0-nguyen khac minh-soeg- pp 109Dao Hoa
 
International Journal of Business and Management Invention (IJBMI)
International Journal of Business and Management Invention (IJBMI)International Journal of Business and Management Invention (IJBMI)
International Journal of Business and Management Invention (IJBMI)inventionjournals
 
An Overview of Export Performance of Agricultural Products in India
An Overview of Export Performance of Agricultural Products in IndiaAn Overview of Export Performance of Agricultural Products in India
An Overview of Export Performance of Agricultural Products in IndiaIOSRJBM
 
11.technical efficiency in agriculture in ghana analyses of determining factors
11.technical efficiency in agriculture in ghana analyses of determining factors11.technical efficiency in agriculture in ghana analyses of determining factors
11.technical efficiency in agriculture in ghana analyses of determining factorsAlexander Decker
 
11.[1 10]technical efficiency in agriculture in ghana analyses of determining...
11.[1 10]technical efficiency in agriculture in ghana analyses of determining...11.[1 10]technical efficiency in agriculture in ghana analyses of determining...
11.[1 10]technical efficiency in agriculture in ghana analyses of determining...Alexander Decker
 
Technical efficiency in agriculture in ghana analyses of determining factors
Technical efficiency in agriculture in ghana analyses of determining factorsTechnical efficiency in agriculture in ghana analyses of determining factors
Technical efficiency in agriculture in ghana analyses of determining factorsAlexander Decker
 

Similar to Contributions of Productivity and Relative Price Changes to Wheat Profitability Changes in China (20)

Efficiency Analysis of Health Sector Expenditure Allocation in 2020 (Case Stu...
Efficiency Analysis of Health Sector Expenditure Allocation in 2020 (Case Stu...Efficiency Analysis of Health Sector Expenditure Allocation in 2020 (Case Stu...
Efficiency Analysis of Health Sector Expenditure Allocation in 2020 (Case Stu...
 
Labour Productivity Dynamics Regularities Analyses by Manufacturing in Europe...
Labour Productivity Dynamics Regularities Analyses by Manufacturing in Europe...Labour Productivity Dynamics Regularities Analyses by Manufacturing in Europe...
Labour Productivity Dynamics Regularities Analyses by Manufacturing in Europe...
 
Ijciet 10 01_040
Ijciet 10 01_040Ijciet 10 01_040
Ijciet 10 01_040
 
Comparing the Economic Structure and Carbon Dioxide Emission between China an...
Comparing the Economic Structure and Carbon Dioxide Emission between China an...Comparing the Economic Structure and Carbon Dioxide Emission between China an...
Comparing the Economic Structure and Carbon Dioxide Emission between China an...
 
Impact of Rice Export Restrictions Policy on Stakeholders in Egypt
Impact of Rice Export Restrictions Policy on Stakeholders in EgyptImpact of Rice Export Restrictions Policy on Stakeholders in Egypt
Impact of Rice Export Restrictions Policy on Stakeholders in Egypt
 
Measures of the Output Gap in Turkey: An Empirical Assessment of Selected Met...
Measures of the Output Gap in Turkey: An Empirical Assessment of Selected Met...Measures of the Output Gap in Turkey: An Empirical Assessment of Selected Met...
Measures of the Output Gap in Turkey: An Empirical Assessment of Selected Met...
 
overview--productivity management.ppt
overview--productivity management.pptoverview--productivity management.ppt
overview--productivity management.ppt
 
overview--productivity management - example
overview--productivity management - exampleoverview--productivity management - example
overview--productivity management - example
 
Productivity management
Productivity managementProductivity management
Productivity management
 
Technical efficiency in agriculture in ghana analyses of determining factors
Technical efficiency in agriculture in ghana analyses of determining factorsTechnical efficiency in agriculture in ghana analyses of determining factors
Technical efficiency in agriculture in ghana analyses of determining factors
 
A Primer on Cointegration: Application to Nigerian Gross Domestic Product and...
A Primer on Cointegration: Application to Nigerian Gross Domestic Product and...A Primer on Cointegration: Application to Nigerian Gross Domestic Product and...
A Primer on Cointegration: Application to Nigerian Gross Domestic Product and...
 
Economic Surplus Model
Economic Surplus ModelEconomic Surplus Model
Economic Surplus Model
 
Credit Seminar
Credit SeminarCredit Seminar
Credit Seminar
 
The Substitution of Cereal Production Factors: DEA-based Approach
The Substitution of Cereal Production Factors:  DEA-based ApproachThe Substitution of Cereal Production Factors:  DEA-based Approach
The Substitution of Cereal Production Factors: DEA-based Approach
 
Chap3 m0-nguyen khac minh-soeg- pp 109
Chap3 m0-nguyen khac minh-soeg- pp 109Chap3 m0-nguyen khac minh-soeg- pp 109
Chap3 m0-nguyen khac minh-soeg- pp 109
 
International Journal of Business and Management Invention (IJBMI)
International Journal of Business and Management Invention (IJBMI)International Journal of Business and Management Invention (IJBMI)
International Journal of Business and Management Invention (IJBMI)
 
An Overview of Export Performance of Agricultural Products in India
An Overview of Export Performance of Agricultural Products in IndiaAn Overview of Export Performance of Agricultural Products in India
An Overview of Export Performance of Agricultural Products in India
 
11.technical efficiency in agriculture in ghana analyses of determining factors
11.technical efficiency in agriculture in ghana analyses of determining factors11.technical efficiency in agriculture in ghana analyses of determining factors
11.technical efficiency in agriculture in ghana analyses of determining factors
 
11.[1 10]technical efficiency in agriculture in ghana analyses of determining...
11.[1 10]technical efficiency in agriculture in ghana analyses of determining...11.[1 10]technical efficiency in agriculture in ghana analyses of determining...
11.[1 10]technical efficiency in agriculture in ghana analyses of determining...
 
Technical efficiency in agriculture in ghana analyses of determining factors
Technical efficiency in agriculture in ghana analyses of determining factorsTechnical efficiency in agriculture in ghana analyses of determining factors
Technical efficiency in agriculture in ghana analyses of determining factors
 

More from Dr. Amarjeet Singh

Total Ionization Cross Sections due to Electron Impact of Ammonia from Thresh...
Total Ionization Cross Sections due to Electron Impact of Ammonia from Thresh...Total Ionization Cross Sections due to Electron Impact of Ammonia from Thresh...
Total Ionization Cross Sections due to Electron Impact of Ammonia from Thresh...Dr. Amarjeet Singh
 
A Case Study on Small Town Big Player – Enjay IT Solutions Ltd., Bhilad
A Case Study on Small Town Big Player – Enjay IT Solutions Ltd., BhiladA Case Study on Small Town Big Player – Enjay IT Solutions Ltd., Bhilad
A Case Study on Small Town Big Player – Enjay IT Solutions Ltd., BhiladDr. Amarjeet Singh
 
Effect of Biopesticide from the Stems of Gossypium Arboreum on Pink Bollworm ...
Effect of Biopesticide from the Stems of Gossypium Arboreum on Pink Bollworm ...Effect of Biopesticide from the Stems of Gossypium Arboreum on Pink Bollworm ...
Effect of Biopesticide from the Stems of Gossypium Arboreum on Pink Bollworm ...Dr. Amarjeet Singh
 
Artificial Intelligence Techniques in E-Commerce: The Possibility of Exploiti...
Artificial Intelligence Techniques in E-Commerce: The Possibility of Exploiti...Artificial Intelligence Techniques in E-Commerce: The Possibility of Exploiti...
Artificial Intelligence Techniques in E-Commerce: The Possibility of Exploiti...Dr. Amarjeet Singh
 
Factors Influencing Ownership Pattern and its Impact on Corporate Performance...
Factors Influencing Ownership Pattern and its Impact on Corporate Performance...Factors Influencing Ownership Pattern and its Impact on Corporate Performance...
Factors Influencing Ownership Pattern and its Impact on Corporate Performance...Dr. Amarjeet Singh
 
An Analytical Study on Ratios Influencing Profitability of Selected Indian Au...
An Analytical Study on Ratios Influencing Profitability of Selected Indian Au...An Analytical Study on Ratios Influencing Profitability of Selected Indian Au...
An Analytical Study on Ratios Influencing Profitability of Selected Indian Au...Dr. Amarjeet Singh
 
A Study on Factors Influencing the Financial Performance Analysis Selected Pr...
A Study on Factors Influencing the Financial Performance Analysis Selected Pr...A Study on Factors Influencing the Financial Performance Analysis Selected Pr...
A Study on Factors Influencing the Financial Performance Analysis Selected Pr...Dr. Amarjeet Singh
 
An Empirical Analysis of Financial Performance of Selected Oil Exploration an...
An Empirical Analysis of Financial Performance of Selected Oil Exploration an...An Empirical Analysis of Financial Performance of Selected Oil Exploration an...
An Empirical Analysis of Financial Performance of Selected Oil Exploration an...Dr. Amarjeet Singh
 
A Study on Derivative Market in India
A Study on Derivative Market in IndiaA Study on Derivative Market in India
A Study on Derivative Market in IndiaDr. Amarjeet Singh
 
Theoretical Estimation of CO2 Compression and Transport Costs for an hypothet...
Theoretical Estimation of CO2 Compression and Transport Costs for an hypothet...Theoretical Estimation of CO2 Compression and Transport Costs for an hypothet...
Theoretical Estimation of CO2 Compression and Transport Costs for an hypothet...Dr. Amarjeet Singh
 
Analytical Mechanics of Magnetic Particles Suspended in Magnetorheological Fluid
Analytical Mechanics of Magnetic Particles Suspended in Magnetorheological FluidAnalytical Mechanics of Magnetic Particles Suspended in Magnetorheological Fluid
Analytical Mechanics of Magnetic Particles Suspended in Magnetorheological FluidDr. Amarjeet Singh
 
Techno-Economic Aspects of Solid Food Wastes into Bio-Manure
Techno-Economic Aspects of Solid Food Wastes into Bio-ManureTechno-Economic Aspects of Solid Food Wastes into Bio-Manure
Techno-Economic Aspects of Solid Food Wastes into Bio-ManureDr. Amarjeet Singh
 
Crypto-Currencies: Can Investors Rely on them as Investment Avenue?
Crypto-Currencies: Can Investors Rely on them as Investment Avenue?Crypto-Currencies: Can Investors Rely on them as Investment Avenue?
Crypto-Currencies: Can Investors Rely on them as Investment Avenue?Dr. Amarjeet Singh
 
Awareness of Disaster Risk Reduction (DRR) among Student of the Catanduanes S...
Awareness of Disaster Risk Reduction (DRR) among Student of the Catanduanes S...Awareness of Disaster Risk Reduction (DRR) among Student of the Catanduanes S...
Awareness of Disaster Risk Reduction (DRR) among Student of the Catanduanes S...Dr. Amarjeet Singh
 
Role of Indians in the Battle of 1857
Role of Indians in the Battle of 1857Role of Indians in the Battle of 1857
Role of Indians in the Battle of 1857Dr. Amarjeet Singh
 
Haryana's Honour Killings: A Social and Legal Point of View
Haryana's Honour Killings: A Social and Legal Point of ViewHaryana's Honour Killings: A Social and Legal Point of View
Haryana's Honour Killings: A Social and Legal Point of ViewDr. Amarjeet Singh
 
Optimization of Digital-Based MSME E-Commerce: Challenges and Opportunities i...
Optimization of Digital-Based MSME E-Commerce: Challenges and Opportunities i...Optimization of Digital-Based MSME E-Commerce: Challenges and Opportunities i...
Optimization of Digital-Based MSME E-Commerce: Challenges and Opportunities i...Dr. Amarjeet Singh
 
Modal Space Controller for Hydraulically Driven Six Degree of Freedom Paralle...
Modal Space Controller for Hydraulically Driven Six Degree of Freedom Paralle...Modal Space Controller for Hydraulically Driven Six Degree of Freedom Paralle...
Modal Space Controller for Hydraulically Driven Six Degree of Freedom Paralle...Dr. Amarjeet Singh
 
Capacity Expansion Banes in Indian Steel Industry
Capacity Expansion Banes in Indian Steel IndustryCapacity Expansion Banes in Indian Steel Industry
Capacity Expansion Banes in Indian Steel IndustryDr. Amarjeet Singh
 
Metamorphosing Indian Blockchain Ecosystem
Metamorphosing Indian Blockchain EcosystemMetamorphosing Indian Blockchain Ecosystem
Metamorphosing Indian Blockchain EcosystemDr. Amarjeet Singh
 

More from Dr. Amarjeet Singh (20)

Total Ionization Cross Sections due to Electron Impact of Ammonia from Thresh...
Total Ionization Cross Sections due to Electron Impact of Ammonia from Thresh...Total Ionization Cross Sections due to Electron Impact of Ammonia from Thresh...
Total Ionization Cross Sections due to Electron Impact of Ammonia from Thresh...
 
A Case Study on Small Town Big Player – Enjay IT Solutions Ltd., Bhilad
A Case Study on Small Town Big Player – Enjay IT Solutions Ltd., BhiladA Case Study on Small Town Big Player – Enjay IT Solutions Ltd., Bhilad
A Case Study on Small Town Big Player – Enjay IT Solutions Ltd., Bhilad
 
Effect of Biopesticide from the Stems of Gossypium Arboreum on Pink Bollworm ...
Effect of Biopesticide from the Stems of Gossypium Arboreum on Pink Bollworm ...Effect of Biopesticide from the Stems of Gossypium Arboreum on Pink Bollworm ...
Effect of Biopesticide from the Stems of Gossypium Arboreum on Pink Bollworm ...
 
Artificial Intelligence Techniques in E-Commerce: The Possibility of Exploiti...
Artificial Intelligence Techniques in E-Commerce: The Possibility of Exploiti...Artificial Intelligence Techniques in E-Commerce: The Possibility of Exploiti...
Artificial Intelligence Techniques in E-Commerce: The Possibility of Exploiti...
 
Factors Influencing Ownership Pattern and its Impact on Corporate Performance...
Factors Influencing Ownership Pattern and its Impact on Corporate Performance...Factors Influencing Ownership Pattern and its Impact on Corporate Performance...
Factors Influencing Ownership Pattern and its Impact on Corporate Performance...
 
An Analytical Study on Ratios Influencing Profitability of Selected Indian Au...
An Analytical Study on Ratios Influencing Profitability of Selected Indian Au...An Analytical Study on Ratios Influencing Profitability of Selected Indian Au...
An Analytical Study on Ratios Influencing Profitability of Selected Indian Au...
 
A Study on Factors Influencing the Financial Performance Analysis Selected Pr...
A Study on Factors Influencing the Financial Performance Analysis Selected Pr...A Study on Factors Influencing the Financial Performance Analysis Selected Pr...
A Study on Factors Influencing the Financial Performance Analysis Selected Pr...
 
An Empirical Analysis of Financial Performance of Selected Oil Exploration an...
An Empirical Analysis of Financial Performance of Selected Oil Exploration an...An Empirical Analysis of Financial Performance of Selected Oil Exploration an...
An Empirical Analysis of Financial Performance of Selected Oil Exploration an...
 
A Study on Derivative Market in India
A Study on Derivative Market in IndiaA Study on Derivative Market in India
A Study on Derivative Market in India
 
Theoretical Estimation of CO2 Compression and Transport Costs for an hypothet...
Theoretical Estimation of CO2 Compression and Transport Costs for an hypothet...Theoretical Estimation of CO2 Compression and Transport Costs for an hypothet...
Theoretical Estimation of CO2 Compression and Transport Costs for an hypothet...
 
Analytical Mechanics of Magnetic Particles Suspended in Magnetorheological Fluid
Analytical Mechanics of Magnetic Particles Suspended in Magnetorheological FluidAnalytical Mechanics of Magnetic Particles Suspended in Magnetorheological Fluid
Analytical Mechanics of Magnetic Particles Suspended in Magnetorheological Fluid
 
Techno-Economic Aspects of Solid Food Wastes into Bio-Manure
Techno-Economic Aspects of Solid Food Wastes into Bio-ManureTechno-Economic Aspects of Solid Food Wastes into Bio-Manure
Techno-Economic Aspects of Solid Food Wastes into Bio-Manure
 
Crypto-Currencies: Can Investors Rely on them as Investment Avenue?
Crypto-Currencies: Can Investors Rely on them as Investment Avenue?Crypto-Currencies: Can Investors Rely on them as Investment Avenue?
Crypto-Currencies: Can Investors Rely on them as Investment Avenue?
 
Awareness of Disaster Risk Reduction (DRR) among Student of the Catanduanes S...
Awareness of Disaster Risk Reduction (DRR) among Student of the Catanduanes S...Awareness of Disaster Risk Reduction (DRR) among Student of the Catanduanes S...
Awareness of Disaster Risk Reduction (DRR) among Student of the Catanduanes S...
 
Role of Indians in the Battle of 1857
Role of Indians in the Battle of 1857Role of Indians in the Battle of 1857
Role of Indians in the Battle of 1857
 
Haryana's Honour Killings: A Social and Legal Point of View
Haryana's Honour Killings: A Social and Legal Point of ViewHaryana's Honour Killings: A Social and Legal Point of View
Haryana's Honour Killings: A Social and Legal Point of View
 
Optimization of Digital-Based MSME E-Commerce: Challenges and Opportunities i...
Optimization of Digital-Based MSME E-Commerce: Challenges and Opportunities i...Optimization of Digital-Based MSME E-Commerce: Challenges and Opportunities i...
Optimization of Digital-Based MSME E-Commerce: Challenges and Opportunities i...
 
Modal Space Controller for Hydraulically Driven Six Degree of Freedom Paralle...
Modal Space Controller for Hydraulically Driven Six Degree of Freedom Paralle...Modal Space Controller for Hydraulically Driven Six Degree of Freedom Paralle...
Modal Space Controller for Hydraulically Driven Six Degree of Freedom Paralle...
 
Capacity Expansion Banes in Indian Steel Industry
Capacity Expansion Banes in Indian Steel IndustryCapacity Expansion Banes in Indian Steel Industry
Capacity Expansion Banes in Indian Steel Industry
 
Metamorphosing Indian Blockchain Ecosystem
Metamorphosing Indian Blockchain EcosystemMetamorphosing Indian Blockchain Ecosystem
Metamorphosing Indian Blockchain Ecosystem
 

Recently uploaded

Stock Market Brief Deck for "this does not happen often".pdf
Stock Market Brief Deck for "this does not happen often".pdfStock Market Brief Deck for "this does not happen often".pdf
Stock Market Brief Deck for "this does not happen often".pdfMichael Silva
 
magnetic-pensions-a-new-blueprint-for-the-dc-landscape.pdf
magnetic-pensions-a-new-blueprint-for-the-dc-landscape.pdfmagnetic-pensions-a-new-blueprint-for-the-dc-landscape.pdf
magnetic-pensions-a-new-blueprint-for-the-dc-landscape.pdfHenry Tapper
 
AfRESFullPaper22018EmpiricalPerformanceofRealEstateInvestmentTrustsandShareho...
AfRESFullPaper22018EmpiricalPerformanceofRealEstateInvestmentTrustsandShareho...AfRESFullPaper22018EmpiricalPerformanceofRealEstateInvestmentTrustsandShareho...
AfRESFullPaper22018EmpiricalPerformanceofRealEstateInvestmentTrustsandShareho...yordanosyohannes2
 
Independent Lucknow Call Girls 8923113531WhatsApp Lucknow Call Girls make you...
Independent Lucknow Call Girls 8923113531WhatsApp Lucknow Call Girls make you...Independent Lucknow Call Girls 8923113531WhatsApp Lucknow Call Girls make you...
Independent Lucknow Call Girls 8923113531WhatsApp Lucknow Call Girls make you...makika9823
 
原版1:1复刻温哥华岛大学毕业证Vancouver毕业证留信学历认证
原版1:1复刻温哥华岛大学毕业证Vancouver毕业证留信学历认证原版1:1复刻温哥华岛大学毕业证Vancouver毕业证留信学历认证
原版1:1复刻温哥华岛大学毕业证Vancouver毕业证留信学历认证rjrjkk
 
Vip B Aizawl Call Girls #9907093804 Contact Number Escorts Service Aizawl
Vip B Aizawl Call Girls #9907093804 Contact Number Escorts Service AizawlVip B Aizawl Call Girls #9907093804 Contact Number Escorts Service Aizawl
Vip B Aizawl Call Girls #9907093804 Contact Number Escorts Service Aizawlmakika9823
 
Call Girls In Yusuf Sarai Women Seeking Men 9654467111
Call Girls In Yusuf Sarai Women Seeking Men 9654467111Call Girls In Yusuf Sarai Women Seeking Men 9654467111
Call Girls In Yusuf Sarai Women Seeking Men 9654467111Sapana Sha
 
Andheri Call Girls In 9825968104 Mumbai Hot Models
Andheri Call Girls In 9825968104 Mumbai Hot ModelsAndheri Call Girls In 9825968104 Mumbai Hot Models
Andheri Call Girls In 9825968104 Mumbai Hot Modelshematsharma006
 
Financial institutions facilitate financing, economic transactions, issue fun...
Financial institutions facilitate financing, economic transactions, issue fun...Financial institutions facilitate financing, economic transactions, issue fun...
Financial institutions facilitate financing, economic transactions, issue fun...Avanish Goel
 
Lundin Gold April 2024 Corporate Presentation v4.pdf
Lundin Gold April 2024 Corporate Presentation v4.pdfLundin Gold April 2024 Corporate Presentation v4.pdf
Lundin Gold April 2024 Corporate Presentation v4.pdfAdnet Communications
 
BPPG response - Options for Defined Benefit schemes - 19Apr24.pdf
BPPG response - Options for Defined Benefit schemes - 19Apr24.pdfBPPG response - Options for Defined Benefit schemes - 19Apr24.pdf
BPPG response - Options for Defined Benefit schemes - 19Apr24.pdfHenry Tapper
 
How Automation is Driving Efficiency Through the Last Mile of Reporting
How Automation is Driving Efficiency Through the Last Mile of ReportingHow Automation is Driving Efficiency Through the Last Mile of Reporting
How Automation is Driving Efficiency Through the Last Mile of ReportingAggregage
 
Classical Theory of Macroeconomics by Adam Smith
Classical Theory of Macroeconomics by Adam SmithClassical Theory of Macroeconomics by Adam Smith
Classical Theory of Macroeconomics by Adam SmithAdamYassin2
 
20240417-Calibre-April-2024-Investor-Presentation.pdf
20240417-Calibre-April-2024-Investor-Presentation.pdf20240417-Calibre-April-2024-Investor-Presentation.pdf
20240417-Calibre-April-2024-Investor-Presentation.pdfAdnet Communications
 
Russian Call Girls In Gtb Nagar (Delhi) 9711199012 💋✔💕😘 Naughty Call Girls Se...
Russian Call Girls In Gtb Nagar (Delhi) 9711199012 💋✔💕😘 Naughty Call Girls Se...Russian Call Girls In Gtb Nagar (Delhi) 9711199012 💋✔💕😘 Naughty Call Girls Se...
Russian Call Girls In Gtb Nagar (Delhi) 9711199012 💋✔💕😘 Naughty Call Girls Se...shivangimorya083
 
fca-bsps-decision-letter-redacted (1).pdf
fca-bsps-decision-letter-redacted (1).pdffca-bsps-decision-letter-redacted (1).pdf
fca-bsps-decision-letter-redacted (1).pdfHenry Tapper
 
原版1:1复刻堪萨斯大学毕业证KU毕业证留信学历认证
原版1:1复刻堪萨斯大学毕业证KU毕业证留信学历认证原版1:1复刻堪萨斯大学毕业证KU毕业证留信学历认证
原版1:1复刻堪萨斯大学毕业证KU毕业证留信学历认证jdkhjh
 
VIP Kolkata Call Girl Serampore 👉 8250192130 Available With Room
VIP Kolkata Call Girl Serampore 👉 8250192130  Available With RoomVIP Kolkata Call Girl Serampore 👉 8250192130  Available With Room
VIP Kolkata Call Girl Serampore 👉 8250192130 Available With Roomdivyansh0kumar0
 
Interimreport1 January–31 March2024 Elo Mutual Pension Insurance Company
Interimreport1 January–31 March2024 Elo Mutual Pension Insurance CompanyInterimreport1 January–31 March2024 Elo Mutual Pension Insurance Company
Interimreport1 January–31 March2024 Elo Mutual Pension Insurance CompanyTyöeläkeyhtiö Elo
 

Recently uploaded (20)

Stock Market Brief Deck for "this does not happen often".pdf
Stock Market Brief Deck for "this does not happen often".pdfStock Market Brief Deck for "this does not happen often".pdf
Stock Market Brief Deck for "this does not happen often".pdf
 
magnetic-pensions-a-new-blueprint-for-the-dc-landscape.pdf
magnetic-pensions-a-new-blueprint-for-the-dc-landscape.pdfmagnetic-pensions-a-new-blueprint-for-the-dc-landscape.pdf
magnetic-pensions-a-new-blueprint-for-the-dc-landscape.pdf
 
Commercial Bank Economic Capsule - April 2024
Commercial Bank Economic Capsule - April 2024Commercial Bank Economic Capsule - April 2024
Commercial Bank Economic Capsule - April 2024
 
AfRESFullPaper22018EmpiricalPerformanceofRealEstateInvestmentTrustsandShareho...
AfRESFullPaper22018EmpiricalPerformanceofRealEstateInvestmentTrustsandShareho...AfRESFullPaper22018EmpiricalPerformanceofRealEstateInvestmentTrustsandShareho...
AfRESFullPaper22018EmpiricalPerformanceofRealEstateInvestmentTrustsandShareho...
 
Independent Lucknow Call Girls 8923113531WhatsApp Lucknow Call Girls make you...
Independent Lucknow Call Girls 8923113531WhatsApp Lucknow Call Girls make you...Independent Lucknow Call Girls 8923113531WhatsApp Lucknow Call Girls make you...
Independent Lucknow Call Girls 8923113531WhatsApp Lucknow Call Girls make you...
 
原版1:1复刻温哥华岛大学毕业证Vancouver毕业证留信学历认证
原版1:1复刻温哥华岛大学毕业证Vancouver毕业证留信学历认证原版1:1复刻温哥华岛大学毕业证Vancouver毕业证留信学历认证
原版1:1复刻温哥华岛大学毕业证Vancouver毕业证留信学历认证
 
Vip B Aizawl Call Girls #9907093804 Contact Number Escorts Service Aizawl
Vip B Aizawl Call Girls #9907093804 Contact Number Escorts Service AizawlVip B Aizawl Call Girls #9907093804 Contact Number Escorts Service Aizawl
Vip B Aizawl Call Girls #9907093804 Contact Number Escorts Service Aizawl
 
Call Girls In Yusuf Sarai Women Seeking Men 9654467111
Call Girls In Yusuf Sarai Women Seeking Men 9654467111Call Girls In Yusuf Sarai Women Seeking Men 9654467111
Call Girls In Yusuf Sarai Women Seeking Men 9654467111
 
Andheri Call Girls In 9825968104 Mumbai Hot Models
Andheri Call Girls In 9825968104 Mumbai Hot ModelsAndheri Call Girls In 9825968104 Mumbai Hot Models
Andheri Call Girls In 9825968104 Mumbai Hot Models
 
Financial institutions facilitate financing, economic transactions, issue fun...
Financial institutions facilitate financing, economic transactions, issue fun...Financial institutions facilitate financing, economic transactions, issue fun...
Financial institutions facilitate financing, economic transactions, issue fun...
 
Lundin Gold April 2024 Corporate Presentation v4.pdf
Lundin Gold April 2024 Corporate Presentation v4.pdfLundin Gold April 2024 Corporate Presentation v4.pdf
Lundin Gold April 2024 Corporate Presentation v4.pdf
 
BPPG response - Options for Defined Benefit schemes - 19Apr24.pdf
BPPG response - Options for Defined Benefit schemes - 19Apr24.pdfBPPG response - Options for Defined Benefit schemes - 19Apr24.pdf
BPPG response - Options for Defined Benefit schemes - 19Apr24.pdf
 
How Automation is Driving Efficiency Through the Last Mile of Reporting
How Automation is Driving Efficiency Through the Last Mile of ReportingHow Automation is Driving Efficiency Through the Last Mile of Reporting
How Automation is Driving Efficiency Through the Last Mile of Reporting
 
Classical Theory of Macroeconomics by Adam Smith
Classical Theory of Macroeconomics by Adam SmithClassical Theory of Macroeconomics by Adam Smith
Classical Theory of Macroeconomics by Adam Smith
 
20240417-Calibre-April-2024-Investor-Presentation.pdf
20240417-Calibre-April-2024-Investor-Presentation.pdf20240417-Calibre-April-2024-Investor-Presentation.pdf
20240417-Calibre-April-2024-Investor-Presentation.pdf
 
Russian Call Girls In Gtb Nagar (Delhi) 9711199012 💋✔💕😘 Naughty Call Girls Se...
Russian Call Girls In Gtb Nagar (Delhi) 9711199012 💋✔💕😘 Naughty Call Girls Se...Russian Call Girls In Gtb Nagar (Delhi) 9711199012 💋✔💕😘 Naughty Call Girls Se...
Russian Call Girls In Gtb Nagar (Delhi) 9711199012 💋✔💕😘 Naughty Call Girls Se...
 
fca-bsps-decision-letter-redacted (1).pdf
fca-bsps-decision-letter-redacted (1).pdffca-bsps-decision-letter-redacted (1).pdf
fca-bsps-decision-letter-redacted (1).pdf
 
原版1:1复刻堪萨斯大学毕业证KU毕业证留信学历认证
原版1:1复刻堪萨斯大学毕业证KU毕业证留信学历认证原版1:1复刻堪萨斯大学毕业证KU毕业证留信学历认证
原版1:1复刻堪萨斯大学毕业证KU毕业证留信学历认证
 
VIP Kolkata Call Girl Serampore 👉 8250192130 Available With Room
VIP Kolkata Call Girl Serampore 👉 8250192130  Available With RoomVIP Kolkata Call Girl Serampore 👉 8250192130  Available With Room
VIP Kolkata Call Girl Serampore 👉 8250192130 Available With Room
 
Interimreport1 January–31 March2024 Elo Mutual Pension Insurance Company
Interimreport1 January–31 March2024 Elo Mutual Pension Insurance CompanyInterimreport1 January–31 March2024 Elo Mutual Pension Insurance Company
Interimreport1 January–31 March2024 Elo Mutual Pension Insurance Company
 

Contributions of Productivity and Relative Price Changes to Wheat Profitability Changes in China

  • 1. International Journal of Engineering and Management Research e-ISSN: 2250-0758 | p-ISSN: 2394-6962 Volume-11, Issue-4 (August 2021) www.ijemr.net https://doi.org/10.31033/ijemr.11.4.34 263 This Work is under Creative Commons Attribution-NonCommercial-NoDerivatives 4.0 International License. Contributions of Productivity and Relative Price Changes to Wheat Profitability Changes in China Li Xiu-Shuang1 and Yu Kang2 1 College of Economics and Management, Zhejiang A & F University, Hangzhou 31130, CHINA 2 Research Academy for Rural Revitalization of Zhejiang Province, Zhejiang A & F University, Hangzhou 31130, CHINA 1 Corresponding Author: haileydeng@163.com ABSTRACT Using the provincial panel data of wheat from 1998 to 2018, based on the total price and quantity framework proposed by O'Donnell(2010), and using Färe-Primont productivity index, this artical decomposes the change of wheat profitability into the change of input-output relative price (TT) and the change of total factor productivity (TFP), and further decomposes the change of TFP into technological progress and efficiency change based on input orientation. The results showed that the overall profitability of wheat decreased by 24.9% compared with 1998, which was attributed to the decrease of TT by 32.6% and the increase of TFP by 11.4%. Results indicate that profitability change is mainly driven by TT change, and the impact of TT change on wheat profitability was alleviated by the compensatory change of TFP. The main driving factor of wheat TFP growth is technical progress, Compared with the growth of technical progress, the technical efficiency grows slowly. Keywords-- Profitability, Total Factor Productivity, Relative Price Change, Färe-Primont Index, Data Envelopment Analysis I. INTRODUCTION Since the reform and opening, China has rolled out a series of major policies and measures to support agriculture, so as to promote the sustained and stable development of agriculture, ensure food production and increase farmers' income. In 2020, the No.1 Document of the Central Committee clearly pointed out that it is necessary to further ensure the effective supply of grain and promote the continuous increase of farmers' income. Nowadays, although the output value of agricultural production is increasing year by year, the cost of agricultural production is also rising. Under the double pressure of the limited price of agricultural products and the increasing cost of agricultural production, farmers' income is lower or even loss, farmers' income and production enthusiasm cannot be effectively improved (Wu Fangwei and Kang Jiaojiao, 2020). In addition, the environmental and natural resource constraints of agricultural development are becoming increasingly severe, and the possibility for improving production by increasing input factors is getting smaller and smaller (Chen Xiwen, 2013), the future growth of agricultural output depends fundamentally on the growth of TFP (Chen Xiwen, 2012). In addition, the situation is complicated and severe, the market fluctuates frequently, and the risks and uncertainties increase. These factors make it increasingly difficult to stabilize grain production and improve farmers' income. When input prices, output prices and policies change, farmers should adjust their production decisions, and the output mix, input mix, production scale or production technology will change, and these adjustments will eventually affect farmers' production efficiency, cost, income and profitability (Li Wenfu et al., 2015). Therefore, under the new situation, it is of special practical significance to research the changes of TFP, input-output relative price and profitability of China's agriculture, and to explore the main driving factors of profitability changes, so as to stabilize food supply, improve farmers' production enthusiasm and increase farmers' income. Previous empirical studies have focused on study the dynamics of productivity growth in the agricultural sector, but few studies have investigated the relationship between the input-output relative price, the change of productivity and profitability of agricultura (Yeager and Langemeier 2011, Mugera and Langemeier 2011). There are two main types of measurement methods used in the research of total factor productivity, the first is the stochastic frontier method based on parameters (Wang Li and Han Yali, 2016), the second is the nonparametric method, and the nonparametric method mainly has two forms, one is Malmquist index method based on data envelopment analysis (Yu Hailong and Li Binglong, 2012; Zhou Zhizhuan, 2014), and the other is the total quantity analysis framework (Zhang Haixia, Han Peijun, 2018; Zhao Liang, Yu Kang, 2019). Most of the above studies only focuses on productivity and efficiency, which are based on production technology and show how input is transformed into output, but do not involve the profitability closely related to the feasibility of farmers' management. This is the problem that farmers are most concerned about. Their goal may be to maximize profits or improve profitability, but high profits are not always related to high
  • 2. International Journal of Engineering and Management Research e-ISSN: 2250-0758 | p-ISSN: 2394-6962 Volume-11, Issue-4 (August 2021) www.ijemr.net https://doi.org/10.31033/ijemr.11.4.34 264 This Work is under Creative Commons Attribution-NonCommercial-NoDerivatives 4.0 International License. productivity, and vice versa. In view of this, this paper intends to select wheat as the research object, and use the framework first proposed by O'Donnell(2010) to decompose the profitability index of wheat production. The decomposition process is divided into two stages. In the first stage, this paper decompose the profitability index into two multiplication parts: the relative price index which measures the relative price changes of output and input and the total factor productivity index. In the second stage, the TFP index is decomposed into four multiplicative efficiency measures: technological progress, technological efficiency index, scale efficiency index and mixed efficiency index. The framework clearly connects the three variables of relative price, total factor productivity and profitability, taking into account the production technology and price, and provides a novel analysis framework for measuring the main driving force of the change in wheat profitability. II. CONCEPTUAL FRAMEWORK (1) Profitability Index Decomposition By definition, TFP is the ratio of total output to total input, input-output relative price is the ratio of total output price to total input price, and profitability is the ratio of total revenue to total cost. ( ) 1 , , it it Mit x x  =  x , ( ) 1 , , it it Nit q q  =  q denote the input and output quantity vectors for farm i in period t, , denote the input and output price vectors for farm i in period t. ( ) it it X X  x and ( ) it it Q Q q  denote the total intput and total output, ( ) . Q and ( ) . X is a non-decreasing linear homogeneous aggregate function, Total factor productivity of i province in t year is defined as:: it it it TFP Q X = (1) Then the TFP index of i province in t year and h province in s year is defined as: , , , it hs it hs it hs it hs TFPI TFPI TFPI QI XI = = (2) ( ) ( ) , it hs i hs t Q Q Q  q q is the output quantity index, ( ) ( ) , it hs i hs t X X X  q q is the input quantity index, O’Donnell(2012)called the TFP index defined by this as the multiplicatively-complete TFP index. The total input prices index and total output prices index is defined as: it it it it W X  = w x and t it it it i P Q  = p q , Therefore, the profitability of i province in t year is defined as: it it it it it it it it it p q P Q PROF w x W X =  =  (3) The profitability indexes of i province in t year and h province in s year are as follows: , it it it hs hs it hs hs hs h it s it PROF P Q P Q PROFI W X W X PROF = = (4) , , it hs it hs W P is the ratio of the total output price index to the total input price index, That is, relative price index, which measures the increase of output price relative to input price. Obviously, the index to measure the change of profitability can be decomposed into the total factor productivity index and relative price index. The former component captures the difference in profitability between the two province that is due purely to differences in output and input prices, while the latter captures the difference in profitability between the two provience that is due purely to differences in output and input quantities. In other words, the former component is a pure price effect, while the latter is a pure quantity effect. (2) Multiplicatively-Complete TFP Index Decomposition The production efficiency is defined by the ratio of practical TFP to the maximum feasible TFP under the current technology, so the efficiency of i province in t year is defined as: ( ) 1 , , t t Mt w w  =  w ( ) 1 , , t t Mt p p  =  p
  • 3. International Journal of Engineering and Management Research e-ISSN: 2250-0758 | p-ISSN: 2394-6962 Volume-11, Issue-4 (August 2021) www.ijemr.net https://doi.org/10.31033/ijemr.11.4.34 265 This Work is under Creative Commons Attribution-NonCommercial-NoDerivatives 4.0 International License. * * * it it i it i it t it t X TFP T F Q X Q FPE T P = = (5) it TFP is the largest TFP that can be realized by using the technology of t period. We choose the efficiency index based on input orientation, which is defined as follows: input-oriented technical efficiency index (ITE): ITE t t t X X = input-oriented scale efficiency index(ISE): ° ° ISE t t t t t Q X Q X = input-oriented mix efficiency index(IME): µ IME t t t X X = input-oriented residual scale efficiency(RISE): µ IME t t t X X = input-oriented residual mix efficiency(RME): µ RISE t t t t t Q X Q X   = ° t Q and °t X are the total output and total input when holding the output and input mixes fixed and TFP reaches the maximum. t X is the minimum total input when holding the output and input mixes fixed, µ t X is the minimum total input when the input combination is variable. Combined with formula (5), the decomposition of TFP index is obtained: ( ) , , , , , hs it hs it hs it hs it hs it TFP ITE T ISE RM FP E  =    (6) (10) The first item on the right side of the equation is the technological progress index, the first item in brackets is the technological efficiency index, the second item is the scale efficiency index, and the third item is the residual mixed efficiency index. There is another decomposition path of TFP index, which is decomposed into technical progress index, technical efficiency index, mixed efficiency index and residual scale efficiency index, namely. ( ) , , , , , hs it hs it hs it hs it hs it TFP ITE T IME RIS FP E  =    (7) Considering that multiplicatively-complete TFP index has two decomposition paths, if TFP index is measured and decomposed according to only one decomposition path, deviation may occur. Therefore, we geometrically average the two decompositions paths. , , , , , ,, hs it hs it hs it hs it hs it hs it st TFP ITE ISE T RISE IME E FP RM    =        (8) (3) Estimate Method In this paper, TFP is estimated by Färe-Primont TFP index, which is constructed as follows:
  • 4. International Journal of Engineering and Management Research e-ISSN: 2250-0758 | p-ISSN: 2394-6962 Volume-11, Issue-4 (August 2021) www.ijemr.net https://doi.org/10.31033/ijemr.11.4.34 266 This Work is under Creative Commons Attribution-NonCommercial-NoDerivatives 4.0 International License. (9) 0 q and are nonzero vector, 0 0 ( ) ( , , ) t t Q q D x q t = , 0 0 ( ) ( , , ) t t X x D x q t = are distance functions with constant input or output vectors in t period. III. DATA DESCRIPTION According to the output and input characteristics of wheat production in china, One outputs, six inputs, and their respective price indices are used in the computation of profitability and productivity measures (see Table 1). Among them, the sown area index was obtained from《 China Rural Statistical Yearbook》, and the other indexes was obtained from《Compilation of cost-benefit data of national agricultural products》. The《Compilation of cost-benefit data of national agricultural products》 provides the average input per mu, so the total input was obtained by multiplying the average input per mu by the total sown area of corn. Since there is no specific data on the quantity and price of machinery input in the《 Compilation of cost-benefit data of national agricultural products》, we referring to Chen Shuzhang's(2003) practice, the machinery input is measured as the mechanical operation cost, the machinery price is measured as price index of agricultural machinery. The input of other factors is measured as the cost of other factors, the price of other factors is measured as agricultural production price index. Tab1e 3.1: Index of variables Quantity variables Price variables Output variables Wheat production (ton) Wheat price (yuan/ton) Input variables Seed input (ton) Average price of seed(yuan/ton) Chemical fertilizer input (ton) Average price of chemical fertilizer (yuan/ton) Sown area (thousand hectares) Land rent (yuan/thousand hectares) Employment days Labor price (yuan/day) Mechanical operation cost(yuan) Price index of agriculturel machinery Other factor inputs(yuan) Price index of Agricultural Means of Production Considering the completeness and availability of data, we selected the data of 15 provinces in China from 1998 to 2018, including Hebei, Shanxi, Inner Mongolia, Heilongjiang, Jiangsu, Anhui, Shandong, Henan, Hubei, Sichuan, Yunnan, Shaanxi, Gansu, Ningxia and Xinjiang. IV. EMPIRICAL RESULTS This section reports the estimated changes of wheat profitability and its components, and all the estimates were obtained using the professional version of DPIN 3.0 software. 1. Changes of wheat profitability and its components. 2. Dynamic analysis of national level 1. Changes of Wheat Profitability and its Components Table 4.1 and Figure 1 provide the indexes of wheat profitability, relative price and total factor productivity compared with the base year in 1998. When the index is greater than 1, it indicates that the index has increased compared with 1998; otherwise, it indicates that the index has decreased compared with 1998. ( ) ( ) ( ) ( ) 0 1 0 0 0 0 0 0 0 1 0 0 , , , , , , , , t s t s s t st st q t Q TF q t x x D D D x q t x t X D q P = = 0 x
  • 5. International Journal of Engineering and Management Research e-ISSN: 2250-0758 | p-ISSN: 2394-6962 Volume-11, Issue-4 (August 2021) www.ijemr.net https://doi.org/10.31033/ijemr.11.4.34 267 This Work is under Creative Commons Attribution-NonCommercial-NoDerivatives 4.0 International License. Table 4.1: Index of wheat profitability and its components Year Profitability Relative price Output price Input price TFP 1998 1.000 1.000 1.000 1.000 1.000 1999 0.981 0.919 1.049 1.142 1.068 2000 0.932 0.958 0.970 1.013 0.973 2001 1.000 0.987 0.963 0.975 1.013 2002 1.065 1.007 1.079 1.071 1.057 2003 1.096 1.080 1.140 1.056 1.015 2004 1.304 1.101 1.294 1.175 1.184 2005 1.061 0.954 1.187 1.245 1.113 2006 1.001 0.845 1.150 1.362 1.186 2007 0.843 0.724 1.101 1.519 1.163 2008 0.841 0.697 1.156 1.660 1.207 2009 0.778 0.658 1.198 1.820 1.181 2010 0.610 0.561 1.099 1.960 1.088 2011 0.592 0.505 1.104 2.185 1.172 2012 0.546 0.472 1.088 2.307 1.157 2013 0.502 0.463 1.131 2.442 1.085 2014 0.539 0.453 1.145 2.527 1.189 2015 0.507 0.433 1.101 2.545 1.172 2016 0.489 0.422 1.088 2.575 1.157 2017 0.511 0.434 1.137 2.622 1.177 2018 0.441 0.407 1.064 2.617 1.085 Average 0.751 0.674 1.104 1.639 1.114 Figure 1: Index of wheat profitability and its components In the study period, the profitability of wheat was lower than that in 1998 except in 2001-2006, and the profitability index fluctuated between 0.441 and 1.304, which was 24.9% lower than that in 1998 , Average annual decline of 1.1%(dlnprof = ln (1.249/2018-2018)). This indicates that the sharp decline of TT is the main driving 0.3 0.5 0.7 0.9 1.1 1.3 PROFI TTI TFPI
  • 6. International Journal of Engineering and Management Research e-ISSN: 2250-0758 | p-ISSN: 2394-6962 Volume-11, Issue-4 (August 2021) www.ijemr.net https://doi.org/10.31033/ijemr.11.4.34 268 This Work is under Creative Commons Attribution-NonCommercial-NoDerivatives 4.0 International License. force for the decline of wheat profitability, and the impact of TT change on wheat profitability is alleviated by the compensatory change of TFP. In terms of stages, the change of wheat profitability can be divided into two stages: in the first stage (1998-2004), wheat profitability showed an increasing trend, with an average increase of 4.8% compared with 1998, TT increased by 0.57%, and TFP increased by 4.3%; In the second stage (2004-2018), the profitability of wheat showed a downward trend, with an average decrease of 51.3% compared with that in 2004, which was attributed to the decrease of TT by 50% and TFP by 2.8%. From Table 4.1, it can be found that except for 2002, 2003 and 2004, TT is still significantly lower than that in 1998. In order to explore the main reasons for the significant decline in TT, we further decomposes TT changes into total output price changes and total input price changes. It was found that the total output price increased by an average of 10.4% (0.49% per year) compared with 1998, while the total input price increased by an average of 63.9% (2.5% per year) compared with 1998, indicating that the slow growth of total output price and the substantial increase of total input price were the main reasons for the sharp decline of wheat TT. The significant increase in the price of total inputs was mainly due to the significant increase in the wages of employees and land rentals, which increased by 144.5% and 117.8% respectively compared with 1998. Compared with 1998, the prices of seeds and other inputs increased by 14.2% and 29.6% respectively, while the prices of chemical fertilizers and machinery decreased. During the study period, TFP of wheat showed a fluctuating growth overall. Except in 2000, the TFP of wheat increased compared with 1998, and the TFP index fluctuated between 0.973 and 1.207, with an average increase of 11.4% (average annual increase of 0.54%) compared with 1998. Its growth is characterized by stages: in the first stage (1998-2008), wheat TFP showed a sharp growth trend, with an average annual growth rate of 1.71%; In the second stage (2009-2018), wheat TFP decreased slightly in a fluctuating manner, with an average annual decline rate of about 2.1%. Generally speaking, China's wheat industry is facing the dilemma of relative price deterioration, Although farmers strive to improve production efficiency, their profitability is still declining. 2. Dynamic Analysis at Provincial Level Table 4.2 provides the estimated value of the profitability and its components of each province. Since the Färe-Primont productivity index satisfy the transitivity test, therefore, it can be used for cross-time and cross- space comparison, not only for comparison within provinces, but also for comparison among provinces. The value marked with "a" in the table indicates the highest among 15 provinces, and the value marked with "b" indicates the lowest among 15 provinces. Table 4.2: Index of profitability and its components of each province Province Profitability Relative price TFP 1998 2018 ∆ 1998 2018 ∆ 1998 2018 ∆ Hebei 2.256 1.358 0.602 3.324b 2.096 0.631a 0.679 0.648 0.954 Shanxi 1.815b 1.149 0.633 3.606 2.109 0.585 0.503 0.545 1.082 Inner Mongolia 3.329 1.909a 0.573 6.589 2.953 0.448 0.505 0.647 1.280 Heilongjiang 2.664 1.637 0.614 5.671 2.587 0.456 0.470 0.633 1.347 Jiangsu 1.979 1.397 0.706a 4.761 2.126 0.447 0.416b 0.657 1.581a Anhui 2.913 1.400 0.481 6.567 2.518 0.383 0.444 0.556 1.254 Shandong 2.515 1.229 0.489 3.616 1.713 0.474 0.696a 0.717a 1.031 Henan 2.561 1.418 0.554 4.641 2.335 0.503 0.552 0.607 1.100 Hubei 3.504 0.836 0.239b 7.568 1.619b 0.214b 0.463 0.516 1.115 Sichuan 5.795 1.433 0.247 12.032a 2.790 0.232 0.482 0.514 1.067 Yunnan 5.884a 1.728 0.294 11.870 3.621a 0.305 0.496 0.477 0.962 Shaanxi 2.973 1.140 0.383 6.208 1.803 0.290 0.479 0.632 1.320 Gansu 2.450 0.808b 0.330 3.768 1.798 0.477 0.650 0.450b 0.692b Ningxia 3.435 1.216 0.354 4.948 2.121 0.429 0.694 0.573 0.826 Xinjiang 2.478 1.211 0.489 3.622 1.803 0.498 0.684 0.672 0.982 Note: a indicates the highest value among 15 provinces, and b indicates the lowest value among 15 provinces.
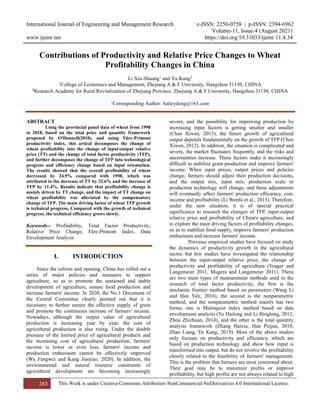
  • 7. International Journal of Engineering and Management Research e-ISSN: 2250-0758 | p-ISSN: 2394-6962 Volume-11, Issue-4 (August 2021) www.ijemr.net https://doi.org/10.31033/ijemr.11.4.34 269 This Work is under Creative Commons Attribution-NonCommercial-NoDerivatives 4.0 International License. It can be seen from Table 2 that the profitability of 15 provinces decreased compared with that of 1998, among which the profitability of Jiangsu Province decreased the least (reduced by 29.4%), mainly due to its higher TFP growth (incresed by 58.1%), and its TFP growth rate was the highest among 15 provinces. Hubei Province has the highest decline in profitability (reduced by 76.1%), which is attributed to the sharp decline in TT (reduced by 78.6%), and the decline in TT is the highest among 15 provinces. Profitability varies greatly among provinces, with Inner Mongolia having the highest profitability (PROF=1.909) and Gansu having the lowest profitability (PROF=0.808) in 2018. The relative price levels of different provinces also show great differences. In 1998, the TT level in Sichuan Province was as high as 12.03, while that in Hebei Province was only 3.32. Compared with 1998, TT in all provinces decreased in 2018, among which Hubei Province showed the largest decrease, which was 78.6% lower than that in 1998. In addition, the inter-provincial difference of TT in 2018 is smaller than that in 1998, with Yunnan province having the highest TT (TT=3.621) and Hubei province having the lowest TT (TT=1.619). Compared with the decrease of profitability and relative price level, TFP in most provinces showed positive growth, among which Jiangsu Province had the highest growth rate, which increased by 58.1% compared with 1998, while TFP in some provinces showed negative growth, such as Gansu (decreased by 30.8%) and Ningxia (decreased by 17.4%). 1. TFP and its component changes. 2. Dynamic analysis at provincial level. 1. TFP and its Component Changes Table 4.3: Changes of TFP and its components Year TFP technical progress technical efficiency Scale efficiency Mixing efficiency 1998 1.000 1.000 1.000 1.000 1.000 1999 1.068 1.111 1.002 0.975 0.983 2000 0.973 0.976 1.009 0.974 1.015 2001 1.013 1.019 1.034 0.948 1.013 2002 1.057 1.052 1.035 0.940 1.034 2003 1.015 1.022 1.036 0.947 1.012 2004 1.184 1.183 1.038 0.924 1.044 2005 1.113 1.072 1.020 0.945 1.077 2006 1.186 1.094 1.021 0.960 1.106 2007 1.163 1.114 1.010 0.947 1.093 2008 1.207 1.178 1.015 0.939 1.074 2009 1.181 1.132 1.015 0.944 1.088 2010 1.088 1.058 1.010 0.933 1.091 2011 1.172 1.138 1.011 0.940 1.084 2012 1.157 1.069 1.025 0.965 1.095 2013 1.085 1.048 0.999 0.953 1.087 2014 1.189 1.184 0.990 0.954 1.063 2015 1.172 1.163 0.996 0.969 1.044 2016 1.157 1.128 1.009 0.979 1.038 2017 1.177 1.155 0.993 0.966 1.062 2018 1.085 1.031 1.010 0.979 1.065 Average 1.114 1.090 1.013 0.956 1.055
  • 8. International Journal of Engineering and Management Research e-ISSN: 2250-0758 | p-ISSN: 2394-6962 Volume-11, Issue-4 (August 2021) www.ijemr.net https://doi.org/10.31033/ijemr.11.4.34 270 This Work is under Creative Commons Attribution-NonCommercial-NoDerivatives 4.0 International License. Figure 2: TFP and its component changes Table 4.3 and Figure 2 provide the index of TFP and its components compared with 1998. It can be seen from Figure 2 that the main driving factor of wheat TFP growth is technical progress, which is 9% higher than that in 1998 (with an average annual growth of 3.2%). This is also directly manifested in that the changing trends of the two are consistent, and the direction of the wave, the location of the wave trough, and the wave crest are highly consistent. This may be due to the planned introduction of international advanced agricultural science and technology projects from abroad in 1994, including the introduction of new varieties and technologies (Zhu Mande and Huang Qingqing, 2020), which significantly promoted technological progress. Compared with the substantial increase of technological progress, the change of technological efficiency is relatively gentle, with an increase of only 1.3% (average annual increase of 0.61%) compared with that in 1998, indicating that the best use of existing technologies has not contributed much to the growth of TFP, which may be due to the fact that farmers are mainly engaged in small-scale decentralized operations. Even if the government has been promoting agricultural technology for a long time, the farmers are limited by their knowledge level and resource endowments, and have low acceptance of new technologies and insufficient adoption motivation, which results in poor use of new technologies. The change of wheat mixing efficiency showed the characteristics of stages: in the first stage (1998-2006), the wheat mixing efficiency showed a large increase with an average annual growth rate of 1.3%; In the second stage (2007-2018), the mixing efficiency of wheat showed a downward trend, with an average annual decline of 1.3%. This means that the change of wheat factor input structure promotes the growth of wheat TFP in the first stage, but hinders the growth of wheat TFP in the second stage. This may be due to the fact that China began to implement the policy of minimum purchase price of wheat in Jiangsu, Shandong, Hebei, Anhui, Henan and Hubei provinces in 2006, which prompted a large number of cultivated land and other factors in these areas to flood into wheat production. At the same time, farmers expected the future increase of wheat planting income, and tended to increase fertilizer input, which was not conducive to the optimization of factor input structure and hindered the growth of mixing efficiency, thus inhibiting the growth of wheat TFP to a certain extent. Scale efficiency showed a downward trend from 1998 to 2004 and slowly increased from 2004 to 2018, but on the whole, scale efficiency still decreased by an average of 4.4% as compared with 1998 (with an average annual decrease of 0.23%), indicating that the change in wheat scale not only did not promote the growth of wheat TFP, but even hindered its growth to a certain extent. In recent years, the government has encouraged moderate scale operation of agriculture through various forms, such as land transfer and subsidies from scale operators, which has promoted the scale operation of wheat. The scale efficiency of wheat has also shown an increasing trend in recent years, but the scale efficiency is still low. It is still an important task to improve wheat TFP in the future to promote moderate scale operation of wheat and to promote the improvement of scale efficiency. 2. Dynamic Analysis at Provincial Level 0.90 0.95 1.00 1.05 1.10 1.15 1.20 TFP technical progress technical efficiency Scale efficiency Mixing efficiency
  • 9. International Journal of Engineering and Management Research e-ISSN: 2250-0758 | p-ISSN: 2394-6962 Volume-11, Issue-4 (August 2021) www.ijemr.net https://doi.org/10.31033/ijemr.11.4.34 271 This Work is under Creative Commons Attribution-NonCommercial-NoDerivatives 4.0 International License. Table 4.5: Changes in TFP and its Components by Province Provience TFP Technical efficiency Scale efficiency Mix efficiency 1998 2018 ∆ 1998 2018 ∆ 1998 2018 ∆ 1998 2018 ∆ Hebei 0.679 0.648 0.954 1.000a 0.917 0.917 1.000a 0.997 0.997 0.976 0.988 1.012 Shanxi 0.503 0.545 1.082 0.859 0.823b 0.959 0.954 0.976 1.024a 0.884 0.944 1.069 Inner Mongolia 0.505 0.647 1.280 1.000a 0.985 0.985 1.000a 0.978 0.979 0.727 0.936 1.288 Heilongjiang 0.470 0.633 1.347 1.000a 1.000a 1.000 1.000a 0.939 0.940 0.676b 0.939 1.390a Jiangsu 0.416b 0.657 1.581a 0.744b 1.000a 1.344a 0.991 0.999 1.008 0.811 0.917 1.131 Anhui 0.444 0.556 1.254 0.918 1.000a 1.089 0.980 0.987 1.007 0.709 0.786 1.109 Shandong 0.696a 0.717a 1.031 1.000a 1.000a 1.000 1.000a 1.000a 1.000 1.000a 1.000a 1.000 Henan 0.552 0.607 1.100 1.000a 1.000a 1.000 1.000a 0.920 0.920 0.793 0.920 1.160 Hubei 0.463 0.516 1.115 0.953 0.944 0.991 0.986 0.947 0.960 0.708 0.805 1.136 Sichuan 0.482 0.514 1.067 1.000a 1.000a 1.000 1.000a 0.988 0.988 0.693 0.725 1.047 Yunnan 0.496 0.477 0.962 1.000a 1.000a 1.000 0.999 0.972 0.972 0.713 0.684b 0.960 Shaanxi 0.479 0.632 1.320 0.902 1.000a 1.109 0.995 0.983 0.988 0.768 0.896 1.168 Gansu 0.650 0.450b 0.692b 1.000a 0.828 0.829b 0.975b 0.984 1.009 0.959 0.769 0.802b Ningxia 0.694 0.573 0.826 1.000a 1.000a 1.000 0.999 0.902b 0.903b 0.999 0.886 0.887 Xinjiang 0.684 0.672 0.982 1.000a 1.000a 1.000 1.000a 0.996 0.996 0.984 0.940 0.956 Note: a represents the highest of the 15 provinces; b represents the lowest of the 15 provinces The input-oriented efficiency estimates reported in Table 4.5 show that, throughout the sample period, most provinces have relatively high technical efficiency (exceptions include Jiangsu and Shanxi provinces in 1998, Shanxi and Gansu provinces in 2018) and relatively high scale efficiency, but overall mixing efficiency is relatively low, especially Heilongjiang and Sichuan provinces in 1998 and Yunnan and Gansu provinces in 2018. From the growth rate of TFP, except for Hebei, Yunnan, Gansu, Ningxia and Xinjiang, the TFP value of other provinces increased positively compared with that of 1998, with Jiangsu province having the highest growth rate. From the perspective of input-oriented efficiency growth rate, Jiangsu Province's technological efficiency grew from the lowest in 1998 to the highest in 2018, becoming the province with the highest growth rate of technological efficiency, up 34.3% as compared with 1998, while Gansu Province's technological efficiency showed a downward trend, with the highest decline rate among 15 provinces, down 17.1% as compared with 1998. Except for a few provinces, the scale efficiency of most provinces decreased compared with that of 1998, while the mixed efficiency as a whole showed positive growth (except for Gansu, Ningxia and Xinjiang). V. CONCLUSIONS This paper uses the provincial panel data from 1998 to 2018 to study the profitability and TFP changes of wheat in China. By decomposing the changes of wheat profitability into the changes of input-output relative price and TFP, and further decomposing the changes of TFP into the changes of technical progress and input-oriented efficiency, the main driving forces of wheat profitability and TFP changes were explored. The main conclusions are as follows: (1) During the research period, the national wheat profitability showed a downward trend, with an average decrease of 24.9% as compared with 1998, due to the decrease of TT by 32.6% and the increase of TFP by 11.4%. The significant decrease in TT is the main driving force for the decrease in wheat profitability. The impact of TT change on wheat profitability is mitigated by the compensatory change in total factor productivity. By further decomposing the change of TT, it is found that the slow growth of total output price and the sharp increase of total input price are the main reasons for the sharp decrease of TT in wheat. The significant increase in total input price was due to the significant increase in the wages of employees and land rentals. (2) The growth of wheat TFP presents the characteristics of stages: in the first stage (1998-2008), wheat TFP shows a significant growth trend with an average annual growth rate of 1.71%; In the second stage (2009-2018), the wheat TFP showed a fluctuating and small decrease trend, with an average annual decrease rate of 2.1%. The main driver of wheat TFP growth was technological progress, which increased by 9% on average (3.2% on average) as compared with 1998. Compared with the significant increase in technological progress, the
  • 10. International Journal of Engineering and Management Research e-ISSN: 2250-0758 | p-ISSN: 2394-6962 Volume-11, Issue-4 (August 2021) www.ijemr.net https://doi.org/10.31033/ijemr.11.4.34 272 This Work is under Creative Commons Attribution-NonCommercial-NoDerivatives 4.0 International License. change in technological efficiency is relatively gentle, with an increase of only 1.3% as compared with 1998 (with an average annual growth rate of 0.61%), indicating that the best use of existing technologies has little contribution to the growth of TFP. The change of wheat mixing efficiency also presents the characteristics of stages: in the first stage (1998-2006), the wheat mixing efficiency is in positive growth with an average annual growth rate of 1.3%; In the second stage (2007-2018), the wheat mixing efficiency showed a downward trend, with an average annual decrease of 1.3%. This means that the change of mixing efficiency gradually changes from promoting the growth of wheat TFP to hindering the growth of wheat TFP. On the whole, the scale efficiency is still lower than that of 1998, with an average decrease of 4.4% (with an average annual decrease of 0.23%). The policy implications of this research conclusion are as follows: First, the slow increase in production efficiency and the sharp drop in the relative prices are the two major factors that restrict the improvement of wheat profitability. To improve the profitability of wheat cultivation, the government needs to shift its perspective from a single demand-side price incentive to a multi-directional supply- side support, such as controlling the growth of input prices, enhancing the level of intensification, and providing more and better public services. In addition, we should further promote the function of agricultural cooperatives and strengthen the standard of farmers' organization. Farmers are at a disadvantage in the market and only passively accept the market price. If the standard of farmers' organization is improved, farmers can improve their bargaining power in all aspects of production and sales by virtue of their scale advantages. Secondly, TFP of wheat grows slowly, which has a limited effect on profitability. In the future, it is still necessary to promote the improvement of agricultural TFP . In view of the fact that technological progress and the growth of mixing efficiency are the two main driving forces for the improvement of wheat TFP, the improvement of wheat TFP should focus on technological progress and the optimization of factor input structure. On the one hand, we should strengthen the research and development of new technologies; on the other hand, we should attracting high- quality talents into the agricultural field through the preferential subsidy policy for agricultural innovation, and improve the overall quality of labor in the agricultural field. At the same time, we should popularize the training of agricultural production technologies in rural areas, and vigorously promote new crop varieties and emerging technologies. In addition, we should vigorously promote mechanized operation, integrate land resources. Meanwhile, we should increase investment in research and development of agricultural machinery manufacturing technology to effectively solve the problems in the process of mechanical operation, which can not only replace labor input, but also effectively reduce material input, promote the optimization of factor input structure and improve production efficiency. REFERENCES [1] Chen Xiwen. (2013). Building a new agricultural management system and speeding up the development of modern agriculture. Economic Research, 48(02), 4-6. [2] Chen Xiwen. (2012). Several main problems of agricultural modernization with Chinese characteristics. Reform, 10, 5-8. [3] Li Wenfu, Zhang Minzhong, & Wang Yuanhui. (2015). Measuring and decomposing the changes of productivity and profitability of Taiwan Province banking industry. Economic Research, 51(02). [4] Mugera, A., M.R. Langemeier., & A.M.Featherstone. (2012). Labor productivity growth in the kansas farm sector: A tripartite decomposition using non-parametric approach. Agriculture and Resource Economics Review, 41, 298–312. [5] O’DONNELL C J. Measuring and decomposing agricultural productivity and profitability change. Australian Journal of Agricultural and Resource Economics, 54(4): 527- 60. [6] O'DONNELL C J. (2012). Nonparametric estimates of the components of productivity and profitability change in U.S. agriculture. American Journal of Agricultural Economics, 94(4). [7] Wang Li & Han Yali. (2016). An empirical analysis of China's cotton TFP growth-based on stochastic frontier analysis. Agricultural Technology and Economy, 11, 95-105. [8] Wu Fangwei & Kang Jiaojiao. (2020). Agricultural subsidy, relative price of factors and farmland circulation. Financial Research, 46(05), 81-93. [9] Yeager, E.A. & M.R. Langemeier. (2011). Productivity divergence across kansas farms. Agricultural and Resource Economics Review, 40, 282–292. [10] Yu Hailong & Li Binglong. (2012). Analysis of total factor productivity and its influencing factors in china dairy- based on DEA-Tobit model. Journal of Xi 'an University of Finance and Economics, 25(05), 33-38. [11] Zhang Haixia & Han Peijun. (2018). Measurement and convergence analysis of agricultural total factor productivity- based on Hicks-Moorsteen index. Rural Economy, 06, 55-61. [12] Zhao Liang & Yu Kang. (2019). Factor input structure and the growth of total factor productivity of grain in major producing areas — Based on the input-output panel data of major producing areas from 1978 to 2017. Journal of Hunan Agricultural University (Social Science Edition), 20(05), 8- 13. [13] Zhou Zhizhuan. (2014). Study on the spatio-temporal characteristics of China's agricultural productivity-a nonparametric measurement framework based on sequential DEA. Hubei Social Sciences, 02, 78-83.