U.S. Business Insights Report: Manufacturing
•
0 likes•449 views

Based on Dun & Bradstreet's proprietary data, this monthly report gives insight into the health of the manufacturing sector.

Recommended
Recommended
More Related Content
What's hot
What's hot (16)
Viewers also liked
Viewers also liked (20)
Similar to U.S. Business Insights Report: Manufacturing
Similar to U.S. Business Insights Report: Manufacturing (20)
More from Dun & Bradstreet
More from Dun & Bradstreet (20)
Recently uploaded
Recently uploaded (20)
U.S. Business Insights Report: Manufacturing
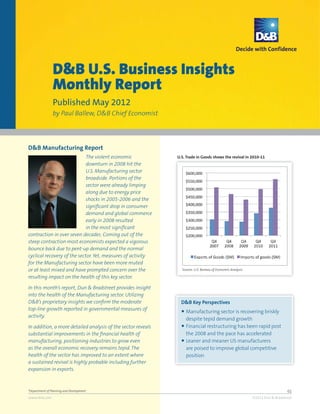
- 1. D&B U.S. Business Insights Monthly Report Published May 2012 by Paul Ballew, D&B Chief Economist D&B Manufacturing Report The violent economic U.S. Trade in Goods shows the revival in 2010-11 downturn in 2008 hit the U.S. Manufacturing sector broadside. Portions of the sector were already limping along due to energy price shocks in 2005-2006 and the significant drop in consumer demand and global commerce early in 2008 resulted in the most significant contraction in over seven decades. Coming out of the steep contraction most economists expected a vigorous bounce back due to pent-up demand and the normal cyclical recovery of the sector. Yet, measures of activity for the Manufacturing sector have been more muted or at least mixed and have prompted concern over the Source: U.S. Bureau of Economic Analysis resulting impact on the health of this key sector. In this month’s report, Dun & Bradstreet provides insight into the health of the Manufacturing sector. Utilizing D&B’s proprietary insights we confirm the moderate D&B Key Perspectives top-line growth reported in governmental measures of ● Manufacturing sector is recovering briskly activity. despite tepid demand growth In addition, a more detailed analysis of the sector reveals ● Financial restructuring has been rapid post substantial improvements in the financial health of the 2008 and the pace has accelerated manufacturing, positioning industries to grow even ● Leaner and meaner US manufacturers as the overall economic recovery remains tepid. The are poised to improve global competitive health of the sector has improved to an extent where position a sustained revival is highly probable including further expansion in exports. *Department of Planning and Development 01 www.dnb.com ©2012 Dun & Bradstreet
- 2. D&B U.S. Business Insights Monthly Report Most macro level measures on manufacturing activity Moderate recovery has been at a consistent rate provide a generally consistent picture. A close look at the Industrial Production Index in 2010 and 2011 shows an increasing trend with slight downturns in mid-2010, early 2011 and again in mid-2011. D&B’s proprietary data on Current Spend in the Manufacturing sector is highly correlated with the Industrial Production Index, and the correlation increases as industrial production is lagged by four months. This relationship establishes D&B’s current spend as a powerful predictor for the Industrial Production Index. The Current Spend in manufacturing shows that other than a slight downturn that occurred in early 2011 (followed by a significant accession) the Source for Industrial Production Index: Board of Governors of the moderate recovery has been on a consistent path. Current Federal Reserve System Spend data confirms an increasing trend throughout D&B Proprietary Spend Data 2010 and continuing through the end of the year. So the modest bounce back in manufacturing has been very consistent albeit at a moderate growth rate and the sector is positioned to continue to bounce along at moderate Financial health has improved dramatically growth rates in 2012. Perhaps more important than confirming the moderate top-line growth rate, D&B has been able to confirm the dramatic improvement in the financial health of the sector. Failures and bankruptcies in the Manufacturing sector confirm the rapid deterioration of the economy starting in 2007. This surge gradually decelerates until 2010 when measures on failures and bankruptcies begin to improve dramatically. This trend in failures and bankruptcies is corroborated by leading indicators in the Manufacturing sector made available by the U.S. Census Bureau. Further analysis shows (Tables in Appendix), not Source for Manufacturing Value of Shipments and New Orders: unexpectedly, higher percentage of both failures and U.S. Census Bureau Economic Indicators, Manufacturing and Trade bankruptcies in both 2010 and 2011 compared to 2006. Inventories and Sales database. Failures and bankruptcies were also higher in 2010 D&B Proprietary Bankruptcy & Failure Data compared to 2008. However, 2011 was clearly a turning point for the sector and provides strong indications that the recovery is on firmer foundation. Significant decreases in both percentage of failures and bankruptcies compared to both 2008 and 2010, with the largest decreases having taken place in the past year. The bottom line is that the sector, despite only moderate top-line growth, has made significant strides in productivity and overall financial wherewithal. At the state level, (Tables in Appendix) the overall trend holds as well. The failure rates of the individual states *Department of Planning and Development 02 www.dnb.com ©2012 Dun & Bradstreet
- 3. D&B U.S. Business Insights Monthly Report peaked in 2009. Alaska, South Dakota, Vermont and Delinquencies have been on a downward trend Wyoming are the states that have consistently low failure levels in the Manufacturing sector while California, Delaware and Nevada have consistently the highest. These variances reflect the mix of manufacturing industries in these individual states. As with failures, business bankruptcies follow the overall trend – peak in 2009 with subsequent improvement resulting in achieving close to pre-recession levels. Turning to a more economically sensitive measure, delinquencies, the monthly percent of delinquent dollars 91 days past due in 2010 and 2011, show a downward trend which further supports measures of improved D&B Proprietary Delinquency Data Percent of Dollars 91 Days Past Due: Manufacturing vs. financial health in the sector. Consistent with measures on Other Industries failures and bankruptcies, payment behavior prompts D&B to have further confidence that the sector has turned the corner through gains in productivity and restraint of costs. A closer look at the states (Tables in Appendix) in terms of Manufacturing sector has turned the corner delinquent dollars shows that Wyoming, in addition to its consistent low failure rates, also exhibits consistently low delinquency rates. Nevada, Arizona and Florida emerge as the worst states by delinquency rates likely reflecting the impact of their local economies that have been the epicenter of the housing melt-down. As far as percent of delinquent dollars and businesses by sub-sectors of Manufacturing is concerned (Charts in Appendix), all major sectors of Manufacturing show a decline in December 2011 compared to December 2010. The sub-sectors that show the largest declines in 2011 are Leather and Leather Products and Chemicals and Allied Source: U.S. Bureau of Labor Statistics, Labor Productivity and Products, by percent of delinquent business and percent of Costs Database delinquent dollars, respectively. The sectors showing the Percent YOY Changes in Labor Productivity (Output per Hour) lowest declines by the two above measures, respectively, Index, 2005=100: Manufacturing vs. Other Sectors are Primary Metal Industries and Tobacco Products. Normally at this stage of economic cycle manufacturing is recovering because of vigorous top-line sales growth due to pent-up demand. The performance of the current economic cycle does not display this traditional pattern of a rapid recovery in demand. Yet, manufacturing is in a revival mode and the gains are being built on a foundation that may prove to be more durable in the long-term. Leaner and meaner manufacturers are emerging from the current cycle and the strides they have made are positioning them to grow despite lackluster macroeconomic growth. *Department of Planning and Development 03 www.dnb.com ©2012 Dun & Bradstreet
- 4. D&B U.S. Business Insights Monthly Report APPENDIX Failures and Bankruptcies in Manufacturing: 2006-2011 2006 2008 2010 2012 Failures Bankruptcies Failures Bankruptcies Failures Bankruptcies Failures Bankruptcies 2121 1195 3239 1760 3868 2178 2818 1625 % YOY Changes 2006 vs. 2011 2008 vs. 2010 2008 vs. 2011 2010 vs. 2011 Failures Bankruptcies Failures Bankruptcies Failures Bankruptcies Failures Bankruptcies 32.86% 35.98% 19% 24% -13.00% -7.67% -27.15% -25.39% Failures and Bankruptcies: Manufacturing vs. Non-Manufacturing Percent YOY Changes in Failures and Bankruptcies: Manufacturing vs. Non-Manufacturing Source: D&B Proprietary Data *Department of Planning and Development 04 www.dnb.com ©2012 Dun & Bradstreet
- 5. D&B U.S. Business Insights Monthly Report States with Lowest Percent of Business Failures: 2006 to 2011 Quarter 4: 2006 Quarter 4: 2007 Quarter 4: 2008 State % Failures State % Failures State % Failures Alaska* 0.00% Wyoming* 0.00% Wyoming* 0.07% Maine* 0.08% Alaska* 0.07% Montana* 0.09% Nebraska* 0.12% Delaware* 0.10% North Dakota* 0.20% Quarter 4: 2009 Quarter 4: 2010 Quarter 4: 2011 State % Failures State % Failures State % Failures Vermont* 0.26% Iowa* 0.21% South Dakota* 0.11% Wyoming* 0.29% Louisiana* 0.33% Alaska* 0.13% South Dakota* 0.34% Vermont* 0.34% Vermont* 0.17% *State has less than 10,000 Manufacturing DUNS States with Lowest Percent of Bankruptcies: 2006 to 2011 Quarter 4: 2006 Quarter 4: 2007 Quarter 4: 2008 State % Bankruptcies State % Bankruptcies State % Bankruptcies Alaska* 0.00% Alaska* 0.00% Wyoming* 0.07% Maine* 0.00% Wyoming* 0.00% Montana* 0.08% Iowa* 0.06% Delaware* 0.00% Kansas* 0.09% Quarter 4: 2009 Quarter 4: 2010 Quarter 4: 2011 State % Bankruptcies State % Bankruptcies State % Bankruptcies Vermont* 0.13% Vermont* 0.13% Vermont* 0.04% Maryland* 0.21% Iowa* 0.13% South Dakota* 0.05% North Dakota* 0.22% Mississippi* 0.13% Alaska* 0.06% *State has less than 10,000 Manufacturing DUNS Source: D&B Proprietary Data *Department of Planning and Development 05 www.dnb.com ©2012 Dun & Bradstreet
- 6. D&B U.S. Business Insights Monthly Report States with Highest Percent of Business Failures: 2006 to 2011 Quarter 4: 2006 Quarter 4: 2007 Quarter 4: 2008 State % Failures State % Failures State % Failures Pennsylvania 0.60% Nevada* 0.60% Mississippi* 0.97% Delaware* 0.58% Alabama* 0.51% Louisiana* 0.74% Ohio 0.47% Georgia 0.50% South Dakota* 0.74% Quarter 4: 2009 Quarter 4: 2010 Quarter 4: 2011 State % Failures State % Failures State % Failures Delaware* 2.53% Delaware* 0.88% Nevada* 0.72% Michigan 1.11% California 0.86% California 0.63% Nevada* 1.05% Nevada* 0.80% Tennessee 0.61% *State has less than 10,000 Manufacturing DUNS States with Highest Percent of Bankruptcies: 2006 to 2011 Quarter 4: 2006 Quarter 4: 2007 Quarter 4: 2008 State % Bankruptcies State % Bankruptcies State % Bankruptcies Pennsylvania 0.51% West Virginia* 0.31% South Dakota* 0.64% Delaware* 0.51% Arizona 0.29% Delaware* 0.39% Michigan 0.32% Indiana 0.29% Tennessee 0.38% Quarter 4: 2009 Quarter 4: 2010 Quarter 4: 2011 State % Bankruptcies State % Bankruptcies State % Bankruptcies Delaware* 2.32% California 0.55% Tennessee 0.45% Michigan 0.72% Delaware* 0.54% Utah* 0.44% Tennessee 0.72% Maine* 0.54% California 0.42% *State has less than 10,000 Manufacturing DUNS Source: D&B Proprietary Data *Department of Planning and Development 06 www.dnb.com ©2012 Dun & Bradstreet
- 7. D&B U.S. Business Insights Monthly Report States with Lowest Delinquent Dollars Largest YOY change December 2010: % of dollars 91 DPD December 2011: % of dollars 91 DPD December 2010 vs. December 2011 Oklahoma* 0.64% Wyoming* 0.29% Idaho* -75.93% Kentucky* 0.73% Idaho* 0.72% Wyoming* -73.09% Wyoming* 1.06% South Dakota* 0.74% Iowa* -65.30% *State has less than 10,000 Manufacturing DUNS States with Highest Delinquent Dollars Largest YOY change December 2010: % of dollars 91 DPD December 2011: % of dollars 91 DPD December 2010 vs. December 2011 Nevada* 13.63% Nevada* 9.16% New Hampshire* 90.22% Arizona* 7.90% Florida* 7.67% Oklahoma* 42.52% Florida* 7.53% Arizona* 7.30% New Mexico* 41.30% *State has less than 10,000 Manufacturing DUNS DB-3302_12_05_01 Source: D&B Proprietary Data *Department of Planning and Development Dun & Bradstreet is the world’s leading source of commercial information and insight on businesses, enabling companies to Decide with Confidence® for more than 170 years. D&B’s global commercial database contains more than 205 million business records, enhanced by our proprietary DUNSRight® Quality Process, providing our customers with quality business information. This quality information is the foundation of our global solutions that customers rely on to make critical business decisions. www.dnb.com ©2012 Dun & Bradstreet