1. for Petroleum Winter 2013/2014
Esri News
Hart Energy (formerly Rextag) recently
placed its extensive energy infrastructure
dataset on Esri’s ArcGIS Online mapping
and analysis platform. Now, Hart Energy
customers access and use high-quality
data on demand from anywhere and
interact with it using GIS tools.
Hart Energy provides a comprehensive
energy GIS dataset for North America. By
moving Hart Energy Mapping and Data
Services to ArcGIS Online, the company
can provide its customers with easy-to-
leverage cloud resources in a low-risk
and affordable manner. Hart Energy’s
extensive energy GIS data content is
now instantly accessible and consumable
by colleagues in the energy sector. As
the first energy GIS data provider to use
Esri’s cloud service platform, Hart Energy
strengthens its lead in the energy industry.
With a paid Hart Energy license,
ArcGIS Online users have password
access to the complete dataset of pipe-
line and attributes such as oil and gas,
natural gas, and crude oil pipelines in
North America. Users select a basemap,
add energy infrastructure data, and con-
tinue to augment their maps with more
data, such as roads, electrical transmis-
sion lines, and railroads, from the collec-
tion of ArcGIS Online Landscape Layers
group. By adding their own company
data, they can see relationships, pat-
terns, and possibilities. Users then save
the map and share it with other selected
users or user groups.
The dataset is continually growing. The
Hart Energy research team constantly
mines private industries and government
agencies for acquisition, purchase, and
investment information to update its
digital GIS energy datasets. The team
aggregates the data to create the most
comprehensive mapping database of
energy infrastructure assets in North
America.
Customers can easily import data into
Esri’s ArcGIS and other GIS software.
However, customers do not need to own
software to use the service. They can use
the data on the ArcGIS Online platform.
Furthermore, they can access maps and
apps using smart devices such as an iPad.
Data is licensed to clients that use it for
internal research and mapping purposes.
“We are very pleased to add a new and
powerful avenue for distributing energy
GIS data to our clients,” Rey Tagle, vice
president of Hart Energy and founder of
Rextag Strategies, said. “ArcGIS Online
provides the same level of accuracy and
completeness, reduces the impact on
data maintenance, and puts our informa-
tion into potentially thousands of mobile
applications in the field. We selected
ArcGIS Online for its power, ease of use,
and current popularity within our customer
base as well as many new client groups.”
For more information, visit
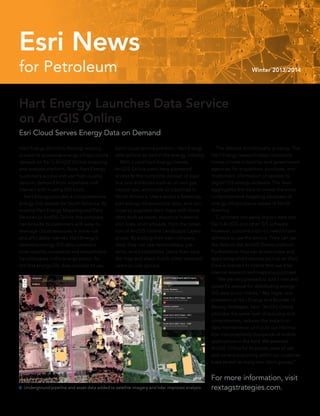
rextagstrategies.com. Underground pipeline and asset data added to satellite imagery and lidar improves analysis.
Hart Energy Launches Data Service
on ArcGIS Online
Esri Cloud Serves Energy Data on Demand
3. Esri and Witt O’Brien’s have built a new GIS
cloud service to increase an organization’s
capabilities to prepare for, respond to,
and recover from ocean oil spill incidents.
Emergency management personnel can
visualize an integrated incident command
system (ICS) through a common operation-
al picture (COP) and systematically com-
mand, control, and coordinate multiagency
emergency response.
CommandPro helps disaster managers
do these important tasks:
•• Develop a complete Incident Action
Plan (IAP)
•• Geographically display response tactics
•• Publish interactive ICS-driven maps
•• Utilize COP software delivered as a
service
•• Access published ICS forms from
ArcGIS Online
•• Leverage easy-to-use tools for making
and sharing maps
•• Capture and update information
directly from a mobile device
The combined technologies in the COP
simplify the complex process of ICS and
increase the agility and capabilities of man-
agers dealing with disasters of various sizes
and scopes. Witt O’Brien’s CommandPro
automates the emergency management
processes. The Esri ArcGIS Online platform
provides user access to fit-for-purpose
maps and workflow-enabled apps (e.g.,
mobile). The integrated solution aligns real-
time data with the systematic approach of
ICS. An added value is that COP users can
access Esri’s emergency management map
templates, which incorporate adopted
standards for spatial data and real-time
incident management.
“The ability to communicate real-time
situational awareness across both the
incident management organization and
those affected stakeholders is key to
Incident Management in the Cloud to
Improve Emergency Operations
a successful response and recovery,”
James Lee Witt, executive chairman of
the board for Witt O’Brien’s, said. “The
integration of our emergency response
management technology solutions,
coupled with Esri’s online GIS platform,
will help our partners in government and
the private sector better manage their
response effort while enhancing collabo-
ration across geographic and organiza-
tional boundaries.”
First responders, government agencies,
and private/commercial industries will have
the combined ability to respond faster,
control resources better, and generate
timely incident reports accurately. The new
COP will improve their vital communica-
tion and coordination capabilities and give
them complete enterprise visibility.
“The integration of real-time informa-
tion provided by Witt O’Brien’s ICS soft-
ware with Esri’s GIS platform, via online
services, will transform the future of inci-
dent management,” Jack Dangermond,
president of Esri, said. “Already, Witt
O’Brien’s and Esri’s advanced cloud
service is proving itself within the oil and
gas contingency planning and response
theater. We expect this success to open
up new possibilities that have positive
implications across many other sectors of
the incident management and response
industry.”
The prototype of CommandPro and
ArcGIS Online COP has been used for
various high-profile projects and incidents.
These include many oil and gas readiness
projects in which it adhered to height-
ened government efforts for deepwater
operations safety.
Get a free trial of ArcGIS
Online at arcgis.com.
A situation map that contains real-time information can be viewed from Esri Operations
Dashboard for ArcGIS and can be the primary display in the operation room. (Data has been
skewed for demonstration purposes.)
3Winter 2013/2014 esri.com/petroleum
Case Study
4. 4 Esri News for Petroleum Winter 2013/2014
A fisherman casts his net into the South
China Sea, as did his father. Here the waves
are calm, the waters shallow, and the fish
abundant. In the past decade, he has seen
more and more cargo ships and oil tankers
cross his span of ocean, but he is unaware
of the risk they bring to his livelihood.
In its current industrial age, China has
huge shipbuilding yards, some of the bus-
iest ports in the world, and a thirst for oil.
The majority of oil is delivered to China
by tankers coming from Saudi Arabia,
Angola, and Iran. Globally, the number
of accidental oil spills has continued to
decline even though there is increased
shipping traffic, but the risk of an incident
occurring due to factors such as increased
traffic, outdated navigation charts, and
the number of oil tankers is a major threat
to the ecology and economy of coastal
cities. To mitigate this governments and
commerce use GIS to understand the risk
of oil spills along shipping routes.
Collisions and groundings for
medium and large incidents account
for 50 percent of tanker spills world-
wide; however, in China, they account
for 78 percent. Knowing this, the
International Tanker Owners Pollution
Federation (ITOPF) is working to build
awareness in China about the country’s
oil spill risk. The London-based, not-
for-profit organization offers technical
advice and information about pollution
GIS Maps Help Oil Tanker Owners and China
Coastal Communities Be Prepared
By Barbara Shields
response and effects of oil spills on mari-
time environments. Its small response
team is in constant readiness to assist at
marine spills anywhere in the world.
ITOPF researchers analyze seaborne
transport data, such as Lloyd’s List, about
tanker types, movement, and incidents.
They use Esri’s GIS technology to map
tanker routes and their proximities to
sensitive environments. Hopefully, the
Figure 1. The schematic map of oil tanker
traffic provides an uncluttered view of
transport tonnage and routes. Maps are
available to members on ITOPF’s web GIS.
Figure 2. Atop a basemap, a researcher
overlays data layers for tanker traffic, oil spill
incident history, and shallow water.
A China coastal community works to clean its beaches after an oil tanker spill.
5. 5Winter 2013/2014 esri.com/petroleum
Case Study
information will persuade local govern-
ments to become involved in preparing
for disasters.
At one time, the organization’s re-
searchers manually processed sea transit
data to create risk maps. Lisa Stevens,
senior technical support coordinator
at ITOPF, and consultants from Makina
Corpus, a web applications design com-
pany, created a geoprocessing routine
that speeds the process of mapping oil
tankers’ journeys.
“Maps tell the story,” Stevens said.
“The analysis is not complicated, but GIS
makes problem areas obvious.”
ITOPF uses GIS to create schematic
maps showing how much oil is trans-
ported along any particular coastline and
shipping route and publishes them on its
website (see figure 1). Map data includes
tanker and vessel types, tonnage, and the
number of journeys. In addition, the user
can see a geographic history of major
tanker oil spills since the 1970s. Adding
data from the United Nations Environment
Programme (UNEP) about the world pro-
tected areas to the map, along with tanker
traffic over or near these areas, makes a
strong visualization (see figure 2).
Stevens added widgets to the web
maps so her colleagues who are not GIS
professionals can easily create maps,
print, and go. They use these maps
during presentations to local govern-
ments and other interested organizations
to show areas of potential risk.
“Some countries don’t know the
amount of oil that is going past their
coastlines and its potential threat,”
Stevens noted. “Seeing this geographi-
cally helps people realize the scale of the
risk and that they need to be prepared
with contingency plans and equipment
stockpiles.”
Whenever and wherever oil spills occur,
ITOPF technical advisers use GIS as a
tool for providing objective technical
advice. Suppose a tanker runs aground
off the coast of our fisherman’s South
China Sea province and oil begins to
seep into the water. At the office in
London, scientists create and publish a
GIS web map that highlights the areas of
sensitivity near the ship.
Once technical advisers arrive at the
scene, depending on the available infra-
structure, they instantly access basic GIS
maps that show sensitive areas and refer-
ence oil spill case histories. Everyone
involved in the incident sees the same
data published on the GIS server. The
map interface links to information so
users can access information about key
organizations involved in similar cleanup
operations, review their efforts, and meet
with them to discuss response activities.
Furthermore, ITOPF puts reconnais-
sance efforts into geographic context by
mapping the routes of surveillance flights
over the spill site (see figure 3).
GIS presents information in a way that
educates thousands of ITOPF members
and helps them prepare for oil spills. They
can see the amount of oil tonnage and
journeys in areas that their own vessels
transit and consider their preparedness
plans should an incident occur in those
waters. Moreover, countries whose shores
are at risk of oil spill disaster can design
response plans specific to local needs.
Read other ocean GIS user
stories at esri.com/oceans.
Figure 3. An oil spill site aerial surveillance map shows a satellite image of the site and the
flight paths of aerial surveillance planes.
6. Project data is accessible via GEMS’ Pangaea GIS portal.
6 Esri News for Petroleum Winter 2013/2014
GIS portal technology is rapidly being
adopted by the oil and gas industry to
manage geospatial content and extend
the value of GIS and data investments.
The appeal is that energy companies
can deploy these portals on their own
infrastructure behind the company fire-
wall, allowing users to access up-to-date
company data from a secure platform.
Staff members will quickly become users
because a GIS portal enables them to
interface with the company’s database
via a map to get to information vital to
their work.
Forum Energy Technologies pro-
vides products and services to energy
companies worldwide. Its business unit
Geoscience Earth and Marine Services
(GEMS) recently deployed the Pangaea
GIS portal using ArcGIS technology.
Secure GIS Portal Opens Access to Project Data
GEMS Improves Data Management with Pangaea Portal
By Tom Bell, Geoscience Earth and Marine Services; Todd Buehlman, LOGIC Solutions Group; and Orlando McDowelle,
LOGIC Solutions Group
Pangaea has made it easier for employ-
ees to get to GEMS’ project data, and it
saves the company money.
GEMS specializes in geological,
geophysical, geotechnical, and archaeo-
logical analyses. It provides its clients
with insight to address critical issues for
oil and gas exploration and develop-
ment, especially for subsea projects
and in complex environments such as
oceans and the Arctic. All its services are
geographic in nature, and it uses
Esri’s ArcGIS.
GEMS offers integrated geoscience
consulting and geotechnical engineer-
ing. It performs shallow water hazard
assessments by using 2D, 3D, and high-
resolution images. Its experts support
energy companies by planning studies
for field layout and pipeline routing. They
also provide Arctic engineering, marine
archaeology, and offshore field services.
Meeting the Massive Data
Challenge
GEMS has accumulated data from
more than 2,000 projects, resulting in a
massive file-based data store containing
more than 50 terabytes of information.
The store holds copious amounts of
documents, images, and supporting
information such as maps, seismic data,
side-scan sonar, cores, imagery, spread-
sheets, PDF files, Word documents, and
GIS data.
Staff members edit, store, and eventu-
ally electronically deliver this informa-
tion to GEMS’ clients worldwide. Prior
to launching its GIS portal, managing
the large file-based system presented
7. The portal search tools include a spatial query and an
attribute query.
High-performance OnBase
easily uploads a project’s
large data files.
7Winter 2013/2014 esri.com/petroleum
multiple challenges. Frequently, it was
difficult to locate data quickly from
previously completed projects. This
caused rework and data duplication. In
addition, the system could not search
the database using geographic attrib-
utes such as latitude and longitude or
an Outer Continental Shelf (OCS) lease
block. Without metadata, there was no
way to perform keyword searches for
documents. Moreover, once a document
was located, staff spent additional time
trying to determine if they had the final
version.
GEMS’ director Daniel Lanier initiated
the search for a state-of-the-art system.
He wanted a solution that would manage
and search for documents and perform
analyses via an intuitive map.
GEMS worked with LOGIC Solutions
Group to create the GIS-driven portal
GEMS Pangaea. Pangaea integrates spa-
tially aware document management and
search capabilities. It provides users with
intuitive, map-driven navigation of GEMS’
database and enables them to search,
view, and download and upload content.
Using Esri’s GIS technology, Hyland
Software’s OnBase content manage-
ment solution, and Microsoft’s Windows
Presentation Foundation (WPF) web
browser application, LOGIC’s develop-
ers designed an effective solution. The
Pangaea GIS portal fully leverages GEMS’
existing, heavily used GIS.
Elevating the User Experience
The user activates the search for docu-
ments via the map by clicking a point,
drawing a line or rectangle, or entering
coordinates. Search functionality rapidly
finds projects located within a selected
OCS lease block. Documents contain
geographic metadata as well as project
name, client name, and description,
which speeds up the search. LOGIC also
developed an application that allows
employees to search GEMS’ legacy file
system by client name, project name, or
file type.
Pangaea users view project boundaries
on a map and click a boundary to get
basic information about the project.
Within the interface, they can also search
and get a quick view of documents as-
sociated with that project.
Users upload documents to the docu-
ment management system and associate
the documents with projects. OnBase
allows users to upload large files to
the system including ArcGIS map files,
images, shapefiles, and other data as-
sociated with the project. They can also
upload documents to the data store from
outside the portal as well as download
data to a specific work environment.
The system prevents data duplication
during upload by flagging documents
that already exist in the system. When
the flag occurs, the user updates the
version of the existing document or adds
the appropriate metadata to associate
the document with additional projects.
By using OnBase with an Active Directory
tool, an administrator can control docu-
ment permissions, viewing, and down-
load throughout the enterprise.
The solution is easily learned. It has ex-
panded GEMS GIS as an enterprise busi-
ness application, which is a powerful tool
for managing projects and analyses. To
accomplish this task, LOGIC worked with
GEMS to provide an Esri and OnBase
solution that includes Esri ArcGIS for
Server and an OnBase enterprise content
management (ECM) solution.
Many Benefits
GEMS’ returns on its investment include
the following:
•• Reduced data search time. Using the
intuitive map search interface, staff
members now perform in a matter of
minutes the previously difficult, and
sometimes impossible, task of finding
projects completed near an OCS lease
block.
•• Increased confidence. Staff members
are assured that the version of the
analysis, data, or document being re-
viewed is up-to-date.
•• Eliminated data duplication.
•• Improved customer service. Staff mem-
bers quickly review historical analyses
in an area for a client.
Learn about GEMS at
f-e-t.com. To find out
more about the Pangaea
solution, contact Tom Bell
of GEMS at Tom.Bell@f-e-t
.com or 713-468-3705.
Case Study
8. 8 Esri News for Petroleum Winter 2013/2014
Full-motion video (FMV) refers to the
capture of airborne video in a data
format that includes metadata about the
aircraft’s altitude, attitude, GPS loca-
tion, and the corresponding orientation
information about the camera sensor.
Given these basic geometric parameters,
GIS properly georeferences and displays
the imagery on a map. Esri recently re-
leased its FMV Toolbar for ArcGIS, which
allows video to be directly incorporated
into GIS. Flight lines and footprints of
the video frames are seen on the map,
including those from multiple airborne
platforms.
FMV is used to create composite mosa-
ics of an area of interest, which is like
using the video to “paint” an area with
an updated basemap. This is particularly
useful for pipeline corridor mapping,
where a strip map can be quickly and
affordably captured. The process is re-
peated to create change detection maps.
Perhaps the most powerful FMV GIS
function is to capture features directly
from the georeferenced FMV player
window. For example, a GIS analyst plays
back a video that was recorded along
a pipeline and pauses the action at any
time to capture features of interest, such
Bringing Airborne Video Into ArcGIS
By Devon Humphrey, Waypoint Mapping
as encroachments. Using heads-up
digitizing, the user captures features
with a mouse and stores them directly
in ArcGIS. This capability improves the
timeliness and capture of features for
high-consequence areas (HCA) and other
types of reports.
Emergency response managers can
also use FMV. Because an FMV camera
does not need to be perfectly perpen-
dicular to the ground, an aircraft can
be flown at a safe distance from an oil
spill and capture FMV at an oblique
angle. The operator can then feed the
scene in real time to GIS viewers inside
the incident command post (ICP) miles
away. This greatly enhances the common
operational picture (COP). Having a
source of real-time visual intelligence for
the COP is a game changer over tradi-
tional methods. The turnaround time for
maps of the spill plume during the 2010
Gulf of Mexico spill was a half day at
best. Obviously, by that time, the oil had
moved. If responders had been able to
Overlay of UAV orthoimage and 3D point cloud data from a road construction site in ArcGIS
Online. UAV data is processed and delivered via online services for rapid turnaround and user
convenience.
In this FMV video clip, features of a pipeline are digitized from the window and put directly
into GIS.
9. 9Winter 2013/2014 esri.com/petroleum
This is the GIS-based ground control and flight operations interface.
As the UAV flies its mission, the flight lines are tracked and adjusted as
needed.
Case Study
use FMV, the disaster information could
have been processed and viewed in near
real time.
The military has used FMV for many
years. Now, the private sector is begin-
ning to realize the advantages that this
technology offers. Just as GPS moved
from its original role as a military naviga-
tion tool to a civilian mapping tool, FMV
has the potential to become a standard
data source for GIS.
The video must be geoenabled to be
used in GIS. Standard video does not in-
clude sufficient locational information on
the aircraft and sensor combination to be
of any use. At best, with nongeoenabled
video, all the user can do is track a moving
dot showing the location where the
video was captured. FMV actually places
the video on the map, where it can be
processed into value-added information.
Traditional Imagery from a
Nontraditional Source
Unmanned aerial vehicles safely fly
at very low altitudes and much lower
speeds than manned aircraft, resulting
in incredibly detailed imagery down to
two-centimeter ground pixel resolution.
Small UAVs can also capture 3D point
clouds at the same time as the imagery.
These point clouds are very similar to
lidar and can be used to create stun-
ning 3D scenes and perform volumetric
calculations in GIS. Because UAVs have
unique flight characteristics, they can
also capture data in difficult spaces, such
as areas underneath overpasses and
bridges; within agricultural fields and
fragile wetlands; or other areas, which
may not be accessible to ground vehicles.
Many parts of the world have no restric-
tions on the use of UAVs for mapping and
data capture. But in the United States,
the current rules only allow for certain
government organizations and universities
to obtain permission to fly. That permis-
sion comes in the form of a Certificate
of Authorization (COA), which is issued
for specific project areas and particular
models of UAVs. So it is cumbersome, if
not impossible, to do commercial map-
ping with UAVs in the United States at
this time. Waypoint Mapping is currently
working on several projects within three
separate COAs in the country.
A recent status report from the Federal
Aviation Administration (FAA) explained
that it will take a few more years to come
up with acceptable safety rules and
procedures before it will authorize wide-
spread use of UAVs in national airspace.
So for now, other countries are leading
the way.
Few organizations outside law enforce-
ment maintain their own airborne fleets,
so many GIS users will be ordering and
receiving data deliveries from service
providers, just as they do now with
traditional imagery. Waypoint Mapping
has launched a new aerial services divi-
sion called Flightline Geographics that
captures, processes, and delivers FMV
data and UAV technologies for a variety
of GIS organizations.
For more information,
contact Devon
Humphrey at devon@
waypointmapping.com.
Download the Full Motion
Video 1.1 template with
the FMV documentation,
tutorial exercises, and data
from ArcGIS.com.
The RQ-84Z AeroHawk UAV, shown in
flight, is used by Flightline Geographics to
capture FMV data at a low cost.
10. 10 Esri News for Petroleum Winter 2013/2014
Sponsors Make Esri Petroleum
Conferences Successful
Esri and the Petroleum User Group thank companies that support our events. We couldn’t do it without
them. Here is a shout-out to those businesses that were Platinum and Gold sponsors.
2013 Esri International User Conference Petroleum Sponsors
2013 Esri Petroleum GIS Conference Sponsors
11. continued on page 12
11Winter 2013/2014 esri.com/petroleum
Eagle Information Mapping
Improves Data Management
Eagle Information Mapping, Inc., has an extensive history in the
oil and gas industry managing exploration, production, and
pipeline data. Eagle provides consulting and software services
to clean, load, analyze, report, model, and maintain data. Eagle
is engaged in the automation of many standard industry work
processes including field data collection, quality control, ap-
proval, management, and distribution. Its business is the life
cycle of data.
Eagle offers separate and unique suites of pipeline data
maintenance applications for both the Pipeline Open Data
Standard (PODS) data model and ArcGIS Pipeline Data Model
(APDM). These applications directly interact with standard
data model forms and can be adapted to work with required
custom extensions. Eagle also offers a suite of pipeline integrity
management and productivity tools that are data model inde-
pendent. Eagle’s automation tools integrate data management
software components to provide a full enterprise solution.
Earth Analytic and Tierra Plan Focus on
Energy Analysis
Since 2009, Earth Analytic, Inc., and Tierra Plan LLC have
teamed to develop state-of-the-art geospatial tools and
applications for energy customers. This strong alliance lev-
erages combined expertise in energy-focused geospatial
analysis and database and software development. Recent
collaborations have yielded two robust web GIS applications:
(1) SmartFootprint for ArcGIS and Geode and (2) the Pulsar
Pipeline Progress Management System (PPMS).
Tierra Plan is a GIS software development and consulting
firm. Tierra Plan creates web-based GIS and spatial database
solutions for analyzing and visualizing data geographically and
integrating spatial data with external nonspatial systems. Tierra
Plan works with clients in Europe and North and South America
that serve the energy, defense, real estate, economic develop-
ment, academic, and environmental sectors. Tierra Plan’s team
is a small and elite group of developers, designers, project
managers, and GIS experts.
Esri Partners
Earth Analytic, Inc.
Earth Analytic, Inc., specializes in the design, implementation,
and management of enterprise GIS solutions for natural and
cultural resources, with a specific focus on the energy industry.
Earth Analytic provides geospatial data, analysis, reporting,
and integration solutions. Pipeline and midstream petroleum
companies use these solutions to identify and select economi-
cally feasible and environmentally sound pipeline routes and
facility locations for infrastructure development.
Geocortex Provides Web-Based Geography
Geocortex software by Latitude Geographics helps users
succeed with web-based geography by enabling them to get
things done in the real world. Petroleum industry customers
use Geocortex oil and gas spatial workflows to rapidly build
web GIS applications and enable end users to make critical
operational decisions in the field.
Major industry processes such as exploration, extraction,
refining, transportation, and distribution are intrinsically spatial,
and accessing spatial data through an intuitive user interface
greatly increases productivity. Viewer technologies (includ-
ing HTML5 and Silverlight) provide visibility from the desktop
to mobile platforms, allowing both online and offline use.
Geocortex Workflow provides a simplified interaction experi-
ence for users, allowing goals to be reached quickly by mod-
eling complex processes into a few steps. Geocortex extends
the value of geospatial information with ArcGIS for Server by
distributing it to a broader range of GIS and non-GIS users.
Geocortex enables companies to do more faster and at less
cost and risk. Geocortex’s approach makes it easy to create
and maintain web-based GIS applications. In 2010, Latitude
Geographics was recognized as an Esri Worldwide Partner of
the Year. Best of all, companies effectively future-proof their
ArcGIS investments by readily accommodating changes in
technology over time.
Visit www.geocortex.com/petroleum/ for more information.
Esri Partners Improve GIS for Petroleum
12. Esri Partners for Petroleum continued from page 11
12 Esri News for Petroleum Winter 2013/2014
geoLOGIC Benefits E&P
Headquartered in Calgary, geoLOGIC has been creating and
supplying data and integrated software solutions to the energy
and production industry for 30 years. The company’s market-
leading decision support tool, geoSCOUT, is a fully integrated,
Windows-based exploration system that supports oil and gas
professionals in their search for hydrocarbons by combining
presentation-quality mapping and cross-section tools with data
handling and analysis software. geoLOGIC also offers a range
of data management solutions, including a robust data center
(the gDC) that houses spatially enabled, value-added govern-
ment well and land data in an open Public Petroleum Data
Model, as well as a proprietary data engine for all data manage-
ment needs. The company’s newest product, gDCweb, features
a web-based interface that allows clients to access industry-
leading well and land data from almost anywhere.
Designed, built, and tested in-house by a team of experts,
users can count on geoLOGIC’s comprehensive suite of deci-
sion support tools and value-added data to help do their job
faster and with unparalleled accuracy. From high-level decision
makers to end users, geoLOGIC’s solutions provide its custom-
ers with the tools needed to find answers, every step of the way.
To learn more about geoLOGIC, visit www.geoLOGIC.com or
twitter.com/geoLOGICsystems.
Petroleum professionals shared helpful tips and best practices at topic sessions at the Esri Petroleum GIS Conferece.
Inner Corridor Technologies:
GIS for Petroleum Training
Based in Houston, TeachMeGIS (the training branch of Inner
Corridor Technologies) has been providing GIS training and
consulting services to the petroleum industry for the past
10 years. The company team offers petroleum-specific GIS
courses monthly at its training center and also travels around
the world to bring these courses locally.
Esri certified trainers have spent the last 10 years mastering
the technique of getting geoscience professionals trained and
excited about GIS. Instructors work hard to make each course
relevant to the participant’s current needs by teaching classes
using wells, leases, pipelines, and other datasets familiar to the
petroleum industry geoscientist. They bring numerous industry
examples into the class and encourage discussion of common
industry challenges. TeachMeGIS instructors have a knack for
making participants feel comfortable asking questions, keeping
the classes open and flexible.
Instructors often customize private courses by using client’s
data and workflows and making them even more relevant to the
needs of students.
13. 13Winter 2013/2014 esri.com/petroleum
Petrosys Data Aggregation Produces Quality Maps
Petrosys is the most dynamic aggregator of data available. It
has the unique ability to simultaneously model data from mul-
tiple input sources and draw on a range of vendor applications
and data stores. Users can reinforce the credibility of their work
by creating working and publication-quality maps and using
the latest available data in the least possible time.
With a clear and logical user interface, strong applications,
data integration, powerful gridding, workflow automation, and
a pragmatic approach to data management, Petrosys supports
businesses. Achieve exploration and production targets at a
lower cost in an improved time frame with Petrosys.
TIBCO Spotfire Advances Analytics
TIBCO Spotfire helps oil and gas companies around the world
bring the power of advanced analytics to their geographic data.
By combining geographic, business, and external data into a
self-service discovery platform, Spotfire enables users to freely
explore data at any level. It radically accelerates critical busi-
ness decisions for production optimization, fracking strategies,
well engineering, and asset integrity.
Spotfire uniquely allows users to leverage the power of
predictive analytics within a data discovery platform. It deliv-
ers new levels of statistical rigor to all business users without
costly delays. Reservoir managers and engineers use Spotfire
to explore complex models, such as the geospatial regression
of production, and improve monitoring and estimated ultimate
Professional networks and friendships grew at the Esri Petroleum GIS Conference.
recovery (EUR) processes. Engineers and geoscientists use it
to visualize, interpret, and catalog data. It is useful for doing
directional drilling surveys and creating post-frac reports to
the corporate reserves database. Spotfire incorporates data
generated internally and by service partners in the field without
having to do lengthy data integration.
The WhiteStar Corporation
The WhiteStar Corporation provides digital cartographic
data products and services, custom mapping, and consulting
services to the oil and gas, pipeline, natural resource, engineer-
ing, and energy industries in the United States. The company
offers WhiteStar data layers, including WhiteStar Grid, a digital
mosaic of data layers developed to equip the energy industry
with cartographic data layers; WhiteStar Culture, a cartographic
data library consisting of basemap information layers; and
WhiteStar Wells, a well database containing the geographic
coordinates and well status symbols for oil and gas wells.
It also offers web services that include WhiteStar Streaming
Imagery, which provides online access to large imagery archives
and other streaming geospatial data; WhiteStar LeaseBuilder, a
web-based application that allows users to calculate land poly-
gons based on the public land survey system; and WhiteStar
WellBuilder, a web application that translates a well’s public
land survey legal description into a precise geographic coor-
dinate in real time. The company was founded in 1990 and is
based in Lakewood, Colorado.
Esri Partners
14. 14 Esri News for Petroleum Winter 2013/2014
The 2013 Esri Petroleum GIS Conference
convened May 7–9, in Houston, Texas,
where attendees represented more than
450 oil and gas, pipeline, and technology
organizations from 25 countries.
During the first day, Esri demonstrated
how petroleum companies could use
the ArcGIS platform to improve decision
making, collaboration, and response to
changing operational conditions. Experts
also showed ways GIS increases business
efficiency in various critical oil and gas
workflows.
Esri Petroleum GIS Conference
Highlights Business Values
Kevin McLay, geomatics manager and
global GIS coordinator at Royal Dutch
Shell, talked about the business value
Shell’s GIS platform provides from well
inventory to urban planning. Esri and
Witt O’Brien’s announced their strategic
partnership in the development of an
integrated common operating platform
for situational response. OSIsoft an-
nounced the integration of its SCADA PI
System with ArcGIS. Ali Ferling, global
managing director of oil and gas at
Microsoft, shared some of the opportuni-
ties created for the petroleum industry by
the global alliance partnership between
Microsoft and Esri.
More than 1,700 oil and gas profession-
als attended the conference that includ-
ed presentations about the application
of GIS to petroleum business challenges.
The GIS Solutions EXPO featured more
than 80 Esri partners who provided
insight and recommended solutions.
Technology workshops showed off the
latest capabilities of the platform.
Read the 2013 Esri Petroleum GIS
Conference papers at esri.com/events/
petroleum-energy.
The EXPO showed off geospatial technologies for oil and gas at the Esri Petroleum GIS Conference.
15. 15Winter 2013/2014 esri.com/petroleum
Esri Petroleum GIS Conference
George R. Brown Convention Center
Houston, Texas
April 23–25, 2014
esri.com/events/petroleum-energy
The Esri Petroleum GIS Conference puts you at the heart of
the petroleum, gas, and pipeline GIS user community. Attend
presentations given by industry GIS professionals to learn how
you too can improve your company’s bottom line. See best-of-
breed hardware, software, and services designed to meet your
company’s needs.
•• Grow your GIS implementations for exploration, production,
pipeline, downstream, and HSE domains.
•• Get your questions answered in person by Esri staff and partners.
•• Discover what is trending in GIS technology.
•• Build your network of GIS professionals in oil and gas.
•• Learn best practices for implementing GIS in petroleum.
Discover the Power of GIS
for Petroleum
Esri’s petroleum team helps petroleum companies worldwide
make better decisions using geospatial technology. Join Esri in
making a difference in the petroleum industry. These positions
are currently open:
•• Industry Solutions Specialist—Petroleum
•• Account Executive—Petroleum Operations
•• Account Executive—Oil Field Services
•• Account Executive—Pipeline
Learn more about these
Esri positions at esri.com/careers.
Mark Your Calendar
Esri International Developer Summit
March 10–13, 2014
Palm Springs, California, USA
esri.com/events/devsummit
Esri Petroleum GIS Conference
April 23–25, 2014
Houston, Texas, USA
esri.com/events/petroleum-energy
Esri International User Conference
July 14–18, 2014
San Diego, California, USA
esri.com/uc
Geological Society of America (GSA) 2014
October 19–22, 2014
Vancouver, British Columbia, Canada
geocociety.org/meetings/2014
GITA Oil & Gas Pipeline Conference
October 28–30, 2014
Houston, Texas, USA
gita.org
On the Road
15Winter 2013/2014 esri.com/petroleum
Make a Difference—
Work for Esri
Participants watch a software demonstration.
Esri News