20180906 DW Debate :Abastecimento de Água, Saneamento e Higiene (WASH)
•Download as PPTX, PDF•
1 like•150 views

Sumuel Godfrey, PhD e Representante dos Escritórios da UNICEF nas Regiões do Oriente e Sul da África. Foi o prelector no Espaço do Debate à Sexta feira da Development Workshop Angola. Ao longo da sua abordagem, entre as várias questões, o prelector cingiu na sua vasta experiência no sector de Água, Saneamento e Higiene nestas regiões.

Recommended
Recommended
More Related Content
What's hot
What's hot (20)
Similar to 20180906 DW Debate :Abastecimento de Água, Saneamento e Higiene (WASH)
Similar to 20180906 DW Debate :Abastecimento de Água, Saneamento e Higiene (WASH) (20)
More from Development Workshop Angola
More from Development Workshop Angola (20)
Recently uploaded
Recently uploaded (20)
20180906 DW Debate :Abastecimento de Água, Saneamento e Higiene (WASH)
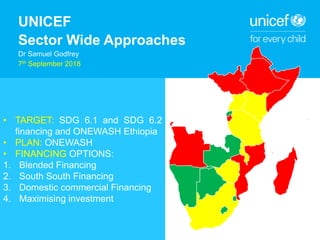
- 1. UNICEF Sector Wide Approaches Dr Samuel Godfrey 7th September 2018 • TARGET: SDG 6.1 and SDG 6.2 financing and ONEWASH Ethiopia • PLAN: ONEWASH • FINANCING OPTIONS: 1. Blended Financing 2. South South Financing 3. Domestic commercial Financing 4. Maximising investment
- 2. 2012 – 2013 Revised MoU OWNP Doc Prepared Harmonised Sector-Wide Approach Evolution of WASH in Ethiopia Project Based Supply Driven 1998 - 2002 Sector Policy, Decentralisation 2004 – 2007 Start of UAP, MoU Signed Establishment of NWCO National Sanitation Strategy 2009 – 2011 GTP I, WIF Signed, WASH Inventory 2014 – 2016 CWA Opened Coordination Office Established OWNP Report Key UNICEF Contributions to OWNP: • UNICEF Consultants wrote OWNP Document. • Fiduciary Risk Assessment for pooled fund • Programme Operational Manual for pooled fund. • Seconded technical assistance to Ethiopian Government • 1st National WASH Inventory Key Sector Achievements: • Achieved MDG Goal for Water Supply (57.2% access in 2015) • Ethiopia had largest reduction in ODF in the world in MDG Period (92% -> 29%). Programme Based Supply Driven
- 3. Results of ONEWASH Phase I (2014-17) ONEWASH – phase 1 results (2014-2017) • Water Supply – 18.7 million people gain access to water supply through the construction of 38,336 different types of water supply schemes • Sanitation – 11 million people became Open Defecation Free and Open Defecation reduced from 44% to 29%. • School WASH - The Consolidated WASH Account (CWA) constructed 1280 school wash facilities • Overall an acceleration towards the SDGs, which is on top of good progress previously. • Results have been better in water than sanitation so far to date.
- 5. Water Sector Working Group WRM Sub-Group Chaired by: State Minister of MoWIE, USAID, IDCA. ETF WASH & WASH Cluster Chaired by: MoWIE & UNICEF Rural WASH TWG Chaired by: MoWIE & DFID/AfDB URBAN WASH TWG Chaired by: MoWIE & UNICEF/WB Hygiene & Environmental Health Task Force Chaired by: MoH & WB/UNICEF WRM and Planning TWG Chaired by: MoWIE & JICA (inactive) Secretariat Focal Person: Nuredin Mohammed Focal Person: Kifle Alemanyehu Research data & info management TWG Chaired by: MoWIE & JICA (inactive) Executive Committee Chaired by Minister of Water Irrigation and Electricity– H.E. Dr. Eng. Sileshi Bekele Co-chairs: UNICEF Gillian Mellsop and JICA Kimiaki Jin WASH Sub-Group Chaired by: State Minister of MoWIE, UNICEF, Finland.
- 7. Regular Sector Events & Coordination MSF JTR Sector Review CWA Mission WASH Implementation Framework Multi Stakeholder Forum on an annual basis. Joint Technical Review Mission every 3-4 months Annual and Mid-Year Reviews conducted. Annual Review Workshop Signed by 4 WASH Ministries, Development Partners, CSOs. Recognises different implementation modalities Aligns with the OECD Paris Declaration Guiding Pillars: Integration, Harmonization, Accountability & Partnership
- 8. Financing SDG 6.1 and 6.2 - Ethiopia Investment % of GDP Comment Water sector (WRM+WASH) USD 763 million 1.1 % Based on projected GDP estimates for 2016 (USD 66.83 billion). In 2010 it was 1.1.% (WB, 2016) WASH USD 475 million 0.71 % Water Resources Management USD 288 million 0.43 % Criteria Amount needed (mUSD/year) Funding gap (mUSD/year) % of gap % of GDP needed OWNP (2,41 billion in 7 years) 344 No funding gap* 0% 0.51% GTP-2 (251 RurWS, 396 UrbWS, 49 UrbSan). Note: only partial estimate. 697 222 32% 1% HDR (Human Development Report) recommends 1% GDP investment/year 668 193 29% 1% WB (AICD, Africa Infrastructure Country Diagnostics) recommends 3.5% of GDP investment/year 2,339 1,764 75% 3.5% WB (achieving SDGs would require 3 times the amount needed for MDG targets) ~2,000 1,525 76% 3% SDG costing tool (preliminary analysis) 3,200 2,725 85% 4.8%
- 9. Financing Streams for SDG 6.1 and 6.2 - Ethiopia UNICEF SDG costing analysis showed that Ethiopia needs a sevenfold increase to achieve SDGs. This requires increasing, and going beyond, conventional funding sources and using money more efficiently. South – South Cooperation Flows of technical expertise and experience from other nations with relevant experience. Domestic Commercial Finance E.g. water utilities receiving commercial loans in local currency from banks looking to diversify risks and provide long- term loans. Blended Financing Mixing loans and grants – for instance in the ‘On Lending Urban Sanitation Facility’ - with loans for infrastructure, and grants for design of works, institutional capacity building, hygiene and sanitation package. Guarantees International private companies invest in Ethiopia through revenue guarantee schemes linked to usage of water supply or sewerage infrastructure. Public Private Partnerships For instance private sector investment in the construction and operation of water utilities through a concession contract. 3Ts – Taxes, Tariffs, Transfers Increase domestic financing through 3Ts. Cross- subsidization from urban to rural, wealthier to poor. 1 2 3 4 5 6 $3.2bn/year additional resource needed Improve Efficiency Strengthen development and humanitarian nexus. Climate Resilient WASH. BCBT Model.
- 10. South South Partnership Urban Sanitation – Brasil- Ethiopia (2015 -2018) Urban Sanitation • Government of Ethiopia investing significantly in condominium development. • But struggling to develop an appropriate sewerage model. • Model based on Brazilian experience, and designed by Brazilian engineers, trialled in Wukro Town, Tigray Region
- 11. South South Partnership Urban Sanitation – Brasil- Ethiopia (2015 -2018)
- 12. Financing Streams for SDG 6.1 and 6.2 - Ethiopia UNICEF SDG costing analysis showed that Ethiopia needs a sevenfold increase to achieve SDGs. This requires increasing, and going beyond, conventional funding sources and using money more efficiently. South – South Cooperation Flows of technical expertise and experience from other nations with relevant experience. Domestic Commercial Finance E.g. water utilities receiving commercial loans in local currency from banks looking to diversify risks and provide long- term loans. Blended Financing Mixing loans and grants – for instance in the ‘On Lending Urban Sanitation Facility’ - with loans for infrastructure, and grants for design of works, institutional capacity building, hygiene and sanitation package. Guarantees International private companies invest in Ethiopia through revenue guarantee schemes linked to usage of water supply or sewerage infrastructure. Public Private Partnerships For instance private sector investment in the construction and operation of water utilities through a concession contract. 3Ts – Taxes, Tariffs, Transfers Increase domestic financing through 3Ts. Cross- subsidization from urban to rural, wealthier to poor. 1 2 3 4 5 6 $3.2bn/year additional resource needed Improve Efficiency Strengthen development and humanitarian nexus. Climate Resilient WASH. BCBT Model.
- 13. UNICEF Negative BHs & Cost effectiveness in drilling 10,000 12,000 14,000 16,000 18,000 20,000 22,000 0% 10% 20% 25% 30% Price escalation due to drilling success rate and post construction failure rate (SWs) 60% 70% 80% 90% 100% Post Construction failure rate Unitcost/SW Drilling Success rate
- 14. 14
- 15. Methodology Data Sources Processing Building Blocks Combining Conceptual Model Interpretation Final Results ASTER SRTM MODIS TRMM ARC2 LANDSAT AMSR-E SMOS RADARSAT-2 Google Maps Data Phase 1 DTM Analysis SM Processing Down- scaling Shallow & deep groundwater conceptual mode: • Infiltration zones • Aquifer extend • GW flow indication • Recharge indication Groundwater Potential Maps Elevation, slope, flow accumulation, TWI Catchment Precipitation NDVI Evaporation Pot Evaporation Geology, Lineaments Land Use Existing Wells
- 17. Multi Village Water Schemes UNICEF financed 91 schemes (2015-2017) Source: Bloomberg Business Week 2017, based on Atlas for Urban Expansion. Schemes Health Facilities Schools People Afar 7 9 9 75,500 Amhara 28 30 48 221,935 Oromia 12 3 3 82,500 SNNP 32 14 31 101,219 Somali 4 8 6 26,750 Tigray 8 5 5 32,500 Total 91 69 102 540,404
- 18. Financing Streams for SDG 6.1 and 6.2 - Ethiopia UNICEF SDG costing analysis showed that Ethiopia needs a sevenfold increase to achieve SDGs. This requires increasing, and going beyond, conventional funding sources and using money more efficiently. South – South Cooperation Flows of technical expertise and experience from other nations with relevant experience. Domestic Commercial Finance E.g. water utilities receiving commercial loans in local currency from banks looking to diversify risks and provide long- term loans. Blended Financing Mixing loans and grants – for instance in the ‘On Lending Urban Sanitation Facility’ - with loans for infrastructure, and grants for design of works, institutional capacity building, hygiene and sanitation package. Guarantees International private companies invest in Ethiopia through revenue guarantee schemes linked to usage of water supply or sewerage infrastructure. Public Private Partnerships For instance private sector investment in the construction and operation of water utilities through a concession contract. 3Ts – Taxes, Tariffs, Transfers Increase domestic financing through 3Ts. Cross- subsidization from urban to rural, wealthier to poor. 1 2 3 4 5 6 $3.2bn/year additional resource needed Improve Efficiency Strengthen development and humanitarian nexus. Climate Resilient WASH. BCBT Model.
- 19. Water Tariff and Regulation Brasil- Ethiopia (2015 -2018)
- 20. VOLUNTARY BASED SEMI PROFESSIONALIZED FULLY PROFESSIONALIZED RURAL GROWTH CENTRE Benchmark: >25liter/capita/day RURAL (Multi VILLAGE Scheme) Benchmark: < 25litre/capita/day >100 HH (>1 Kebele) = contextualized per region or complex motorized scheme) and Annual Turnover (to be identified) RURAL HIGHLY DISPERSED (Village): Benchmark: <25 litre/capita/day, 1km distance Community based Management Service Delivery Models & Professionalization (revised)PopulationDensityandServiceLevels Self Supply Delegated Management Contracts to private Operators Public or Private Sector WASHCO (Community Management) Water Utility Multi – CRITERIA decision support: populations density, GTP2: water consumption, #HH served, geographic scope, complexity of scheme, turnover WASHCO (Community Partizipation)
Editor's Notes
- Sources for Gap estimation: OWNP project document, GTP-2 for Water sector (annexes); UNDP, Human Development Report, More Money and Better Service Delivery: A Winning Combination for Achieving Drinking Water and Sanitation Targets ( http://www.worldbank.org/en/news/press-release/2016/02/12/more-money-and-better-service-delivery-a-winning-combination-for-achieving-drinking-water-and-sanitation-targets )
- Of the global urban population more than half lives in Asia, but growth is fastest in Africa Compared to the other regions, Asia next to Africa the regions with the lowest urbanization. In 2015 just less than half of the population (49%) in Asia lived in urban centers, an 41% in Africa (41%), much less than in Northern America, LAC, and Europe with % urban above 70% (NA:82%, LAC: 80% and Europe: 74%). In almost all regions urbanization will continue (except for Oceania where the level of urbanization will remain at high level) Asia has the highest growth rate in urbanization but slowing down and will be overtaken by Africa around 2020. Already now, the urban population in Africa is growing faster than in any other region. By 2018: Asia will become a predominantly urban region with more people living in urban than in rural areas and Africa by 2037.
- Of the global urban population more than half lives in Asia, but growth is fastest in Africa Compared to the other regions, Asia next to Africa the regions with the lowest urbanization. In 2015 just less than half of the population (49%) in Asia lived in urban centers, an 41% in Africa (41%), much less than in Northern America, LAC, and Europe with % urban above 70% (NA:82%, LAC: 80% and Europe: 74%). In almost all regions urbanization will continue (except for Oceania where the level of urbanization will remain at high level) Asia has the highest growth rate in urbanization but slowing down and will be overtaken by Africa around 2020. Already now, the urban population in Africa is growing faster than in any other region. By 2018: Asia will become a predominantly urban region with more people living in urban than in rural areas and Africa by 2037.