
Recommended
More Related Content
What's hot
What's hot (20)
Viewers also liked
Similar to Techno buy beml
Similar to Techno buy beml (16)
Recently uploaded
Recently uploaded (20)
Techno buy beml
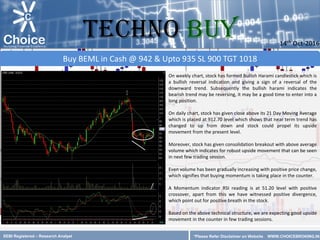
- 1. SEBI Registered – Research Analyst *Please Refer Disclaimer on Website On weekly chart, stock has formed Bullish Harami candlestick which is a bullish reversal indication and giving a sign of a reversal of the downward trend. Subsequently the bullish harami indicates the bearish trend may be reversing, it may be a good time to enter into a long position. On daily chart, stock has given close above its 21 Day Moving Average which is placed at 912.70 level which shows that near term trend has changed to up from down and stock could propel its upside movement from the present level. Moreover, stock has given consolidation breakout with above average volume which indicates for robust upside movement that can be seen in next few trading session. Even volume has been gradually increasing with positive price change, which signifies that buying momentum is taking place in the counter. A Momentum indicator RSI reading is at 51.20 level with positive crossover, apart from this we have witnessed positive divergence, which point out for positive breath in the stock. Based on the above technical structure, we are expecting good upside movement in the counter in few trading sessions. Buy BEML in Cash @ 942 & Upto 935 SL 900 TGT 1018 14th Oct-2016 TECHNO BUY *Please Refer Disclaimer on Website WWW.CHOICEBROKING.IN
- 2. WWW.CHOICEBROKING.IN Contact Us Disclaimer This is solely for information of clients of Choice Broking and does not construe to be an investment advice. It is also not intended as an offer or solicitation for the purchase and sale of any financial instruments. Any action taken by you on the basis of the information contained herein is your responsibility alone and Choice Broking its subsidiaries or its employees or associates will not be liable in any manner for the consequences of such action taken by you. We have exercised due diligence in checking the correctness and authenticity of the information contained in this recommendation, but Choice Broking or any of its subsidiaries or associates or employees shall not be in any way responsible for any loss or damage that may arise to any person from any inadvertent error in the information contained in this recommendation or any action taken on basis of this information. Technical analysis studies market psychology, price patterns and volume levels. It is used to forecast future price and market movements. Technical analysis is complementary to fundamental analysis and news sources. The recommendations issued herewith might be contrary to recommendations issued by Choice Broking in the company research undertaken as the recommendations stated in this report is derived purely from technical analysis. Choice Broking has based this document on information obtained from sources it believes to be reliable but which it has not independently verified; Choice Broking makes no guarantee, representation or warranty and accepts no responsibility or liability as to its accuracy or completeness. The opinions contained within the report are based upon publicly available information at the time of publication and are subject to change without notice. The information and any disclosures provided herein are in summary form and have been prepared for informational purposes. The recommendations and suggested price levels are intended purely for trading purposes. The recommendations are valid for the day of the report however trading trends and volumes might vary substantially on an intraday basis and the recommendations may be subject to change. The information and any disclosures provided herein may be considered confidential. Any use, distribution, modification, copying, forwarding or disclosure by any person is strictly prohibited. The information and any disclosures provided herein do not constitute a solicitation or offer to purchase or sell any security or other financial product or instrument. The current performance may be unaudited. Past performance does not guarantee future returns. There can be no assurance that investments will achieve any targeted rates of return, and there is no guarantee against the loss of your entire investment. POTENTIAL CONFLICT OF INTEREST DISCLOSURE (as on date of report) Disclosure of interest statement – • Analyst interest of the stock /Instrument(s): - No. • Firm interest of the stock / Instrument (s): - No. www.choiceindia.comcustomercare@choiceindia.com Research Team Mr. Sumeet Bagadia Associate Director Kkunal Parar Sr. Research Associate Amit Pathania Research Associate Kapil Shah Research Associate Vikas Chaudhari Research Associate Rohan Patil Research Associate Trirashmi Ghoderao Research Advisor Neeraj Yadav Research Advisor 14th Oct-2016 TECHNO BUY Kkunal Parar Digitally signed by Kkunal Parar DN: cn=Kkunal Parar, o=Choice Equity Broking Pvt Ltd., ou=Research Dept., email=kkunal.parar@choiceindia.com, c=IN Date: 2016.10.14 15:05:26 +05'30'