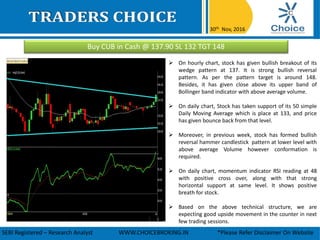
The document provides a technical analysis of CUB stock with the following key points:
1) On hourly and daily charts, CUB stock has shown bullish breakouts and reversals from support levels, indicating upward momentum.
2) Technical indicators like Bollinger bands and moving averages also show support for an upward trend in the stock.
3) The analysis recommends buying CUB stock at 137.90 with a stop loss of 132 and target price of 148 based on the positive technical patterns and structure.
1. Buy CUB in Cash @ 137.90 SL 132 TGT 148
30th Nov, 2016
SEBI Registered – Research Analyst WWW.CHOICEBROKING.IN *Please Refer Disclaimer On Website
On hourly chart, stock has given bullish breakout of its
wedge pattern at 137. It is strong bullish reversal
pattern. As per the pattern target is around 148.
Besides, it has given close above its upper band of
Bollinger band indicator with above average volume.
On daily chart, Stock has taken support of its 50 simple
Daily Moving Average which is place at 133, and price
has given bounce back from that level.
Moreover, in previous week, stock has formed bullish
reversal hammer candlestick pattern at lower level with
above average Volume however conformation is
required.
On daily chart, momentum indicator RSI reading at 48
with positive cross over, along with that strong
horizontal support at same level. It shows positive
breath for stock.
Based on the above technical structure, we are
expecting good upside movement in the counter in next
few trading sessions.
2. www.choiceindia.comcustomercare@choiceindia.com
Research Team
Mr. Sumeet Bagadia Associate Director
Kkunal Parar Sr. Research Associate
Amit Pathania Research Associate
Vikas Chaudhari Research Associate
Kapil Shah Research Associate
Rajnath Yadav Research Associate
Satish Kumar Research Associate
Disclaimer
This is solely for information of clients of Choice Broking and does not construe to be an investment advice. It is also not intended as an offer or solicitation for the purchase and sale of any
financial instruments. Any action taken by you on the basis of the information contained herein is your responsibility alone and Choice Broking its subsidiaries or its employees or associates will
not be liable in any manner for the consequences of such action taken by you. We have exercised due diligence in checking the correctness and authenticity of the information contained in this
recommendation, but Choice Broking or any of its subsidiaries or associates or employees shall not be in any way responsible for any loss or damage that may arise to any person from any
inadvertent error in the information contained in this recommendation or any action taken on basis of this information. Technical analysis studies market psychology, price patterns and volume
levels. It is used to forecast future price and market movements. Technical analysis is complementary to fundamental analysis and news sources. The recommendations issued herewith might
be contrary to recommendations issued by Choice Broking in the company research undertaken as the recommendations stated in this report is derived purely from technical analysis. Choice
Broking has based this document on information obtained from sources it believes to be reliable but which it has not independently verified; Choice Broking makes no guarantee, representation
or warranty and accepts no responsibility or liability as to its accuracy or completeness. The opinions contained within the report are based upon publicly available information at the time of
publication and are subject to change without notice. The information and any disclosures provided herein are in summary form and have been prepared for informational purposes. The
recommendations and suggested price levels are intended purely for trading purposes. The recommendations are valid for the day of the report however trading trends and volumes might vary
substantially on an intraday basis and the recommendations may be subject to change. The information and any disclosures provided herein may be considered confidential. Any use,
distribution, modification, copying, forwarding or disclosure by any person is strictly prohibited. The information and any disclosures provided herein do not constitute a solicitation or offer to
purchase or sell any security or other financial product or instrument. The current performance may be unaudited. Past performance does not guarantee future returns. There can be no
assurance that investments will achieve any targeted rates of return, and there is no guarantee against the loss of your entire investment.
POTENTIAL CONFLICT OF INTEREST DISCLOSURE (as on date of report) Disclosure of interest statement – • Analyst interest of the stock /Instrument(s): - No. • Firm interest of the stock /
Instrument (s): - No.
Vikas
Chaudhari
Digitally signed by Vikas Chaudhari
DN: cn=Vikas Chaudhari, o=Choice Equity
Broking Pvt Ltd, ou=Research Department,
email=vikas.chaudhari@choiceindia.com, c=IN
Date: 2016.11.30 15:33:50 +05'30'