
Recommended
More Related Content
What's hot
What's hot (20)
Similar to Choice spark fedderloyd
Similar to Choice spark fedderloyd (16)
Recently uploaded
Recently uploaded (20)
Choice spark fedderloyd
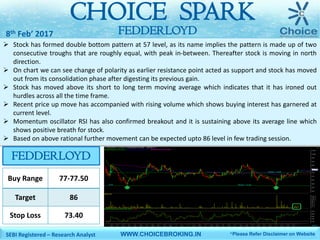
- 1. Stock has formed double bottom pattern at 57 level, as its name implies the pattern is made up of two consecutive troughs that are roughly equal, with peak in-between. Thereafter stock is moving in north direction. On chart we can see change of polarity as earlier resistance point acted as support and stock has moved out from its consolidation phase after digesting its previous gain. Stock has moved above its short to long term moving average which indicates that it has ironed out hurdles across all the time frame. Recent price up move has accompanied with rising volume which shows buying interest has garnered at current level. Momentum oscillator RSI has also confirmed breakout and it is sustaining above its average line which shows positive breath for stock. Based on above rational further movement can be expected upto 86 level in few trading session. SPARKCHOICE FEDDERLOYD8th Feb’ 2017 SEBI Registered – Research Analyst WWW.CHOICEBROKING.IN FEDDERLOYD Buy Range 77-77.50 Target 86 Stop Loss 73.40 *Please Refer Disclaimer on Website
- 2. SPARKCHOICE WWW.CHOICEBROKING.IN Contact Us Disclaimer www.choicebroking.incustomercare@choiceindia.com Research Team Mr. Sumeet Bagadia Associate Director Kkunal Parar Sr. Research Associate Amit Pathania Research Associate Kapil Shah Research Associate Vikas Chaudhari Research Associate Trirashmi Ghoderao Research Advisor Neeraj Yadav Research Advisor This is solely for information of clients of Choice Broking and does not construe to be an investment advice. It is also not intended as an offer or solicitation for the purchase and sale of any financial instruments. Any action taken by you on the basis of the information contained herein is your responsibility alone and Choice Broking its subsidiaries or its employees or associates will not be liable in any manner for the consequences of such action taken by you. We have exercised due diligence in checking the correctness and authenticity of the information contained in this recommendation, but Choice Broking or any of its subsidiaries or associates or employees shall not be in any way responsible for any loss or damage that may arise to any person from any inadvertent error in the information contained in this recommendation or any action taken on basis of this information. Technical analysis studies market psychology, price patterns and volume levels. It is used to forecast future price and market movements. Technical analysis is complementary to fundamental analysis and news sources. The recommendations issued herewith might be contrary to recommendations issued by Choice Broking in the company research undertaken as the recommendations stated in this report is derived purely from technical analysis. Choice Broking has based this document on information obtained from sources it believes to be reliable but which it has not independently verified; Choice Broking makes no guarantee, representation or warranty and accepts no responsibility or liability as to its accuracy or completeness. The opinions contained within the report are based upon publicly available information at the time of publication and are subject to change without notice. The information and any disclosures provided herein are in summary form and have been prepared for informational purposes. The recommendations and suggested price levels are intended purely for trading purposes. The recommendations are valid for the day of the report however trading trends and volumes might vary substantially on an intraday basis and the recommendations may be subject to change. The information and any disclosures provided herein may be considered confidential. Any use, distribution, modification, copying, forwarding or disclosure by any person is strictly prohibited. The information and any disclosures provided herein do not constitute a solicitation or offer to purchase or sell any security or other financial product or instrument. The current performance may be unaudited. Past performance does not guarantee future returns. There can be no assurance that investments will achieve any targeted rates of return, and there is no guarantee against the loss of your entire investment. POTENTIAL CONFLICT OF INTEREST DISCLOSURE (as on date of report) Disclosure of interest statement – • Analyst interest of the stock /Instrument(s): - No. • Firm interest of the stock / Instrument (s): - No. Kapil Shah Digitally signed by Kapil Shah DN: cn=Kapil Shah, o=Choice Equity Pvt Ltd, ou=Research Team, email=kapil.shah@choiceindia.com, c=US Date: 2017.02.08 12:03:50 +05'30'