
Recommended
More Related Content
What's hot
What's hot (20)
Similar to Equity bazaar 20.06.2016
Similar to Equity bazaar 20.06.2016 (14)
Recently uploaded
Recently uploaded (20)
Equity bazaar 20.06.2016
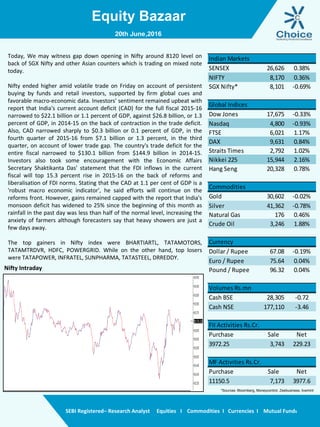
- 1. Equity Bazaar SEBI Registered– Research Analyst Equities I Commodities I Currencies I Mutual Funds Nifty Intraday Today, We may witness gap down opening in Nifty around 8120 level on back of SGX Nifty and other Asian counters which is trading on mixed note today. Nifty ended higher amid volatile trade on Friday on account of persistent buying by funds and retail investors, supported by firm global cues and favorable macro-economic data. Investors' sentiment remained upbeat with report that India's current account deficit (CAD) for the full fiscal 2015-16 narrowed to $22.1 billion or 1.1 percent of GDP, against $26.8 billion, or 1.3 percent of GDP, in 2014-15 on the back of contraction in the trade deficit. Also, CAD narrowed sharply to $0.3 billion or 0.1 percent of GDP, in the fourth quarter of 2015-16 from $7.1 billion or 1.3 percent, in the third quarter, on account of lower trade gap. The country's trade deficit for the entire fiscal narrowed to $130.1 billion from $144.9 billion in 2014-15. Investors also took some encouragement with the Economic Affairs Secretary Shaktikanta Das' statement that the FDI inflows in the current fiscal will top 15.3 percent rise in 2015-16 on the back of reforms and liberalisation of FDI norms. Stating that the CAD at 1.1 per cent of GDP is a 'robust macro economic indicator', he said efforts will continue on the reforms front. However, gains remained capped with the report that India's monsoon deficit has widened to 25% since the beginning of this month as rainfall in the past day was less than half of the normal level, increasing the anxiety of farmers although forecasters say that heavy showers are just a few days away. The top gainers in Nifty index were BHARTIARTL, TATAMOTORS, TATAMTRDVR, HDFC, POWERGRID. While on the other hand, top losers were TATAPOWER, INFRATEL, SUNPHARMA, TATASTEEL, DRREDDY. 20th June,2016 SENSEX 26,626 0.38% NIFTY 8,170 0.36% SGX Nifty* 8,101 -0.69% Global Indices Dow Jones 17,675 -0.33% Nasdaq 4,800 -0.93% FTSE 6,021 1.17% DAX 9,631 0.84% Straits Times 2,792 1.02% Nikkei 225 15,944 2.16% Hang Seng 20,328 0.78% Commodities Gold 30,602 -0.02% Silver 41,362 -0.78% Natural Gas 176 0.46% Crude Oil 3,246 1.88% Currency Dollar / Rupee 67.08 -0.19% Euro / Rupee 75.64 0.04% Pound / Rupee 96.32 0.04% Volumes Rs.mn Cash BSE 28,305 -0.72 Cash NSE 177,110 -3.46 FII Activities Rs.Cr. Purchase Sale Net 3972.25 3,743 229.23 MF Activities Rs.Cr. Purchase Sale Net 11150.5 7,173 3977.6 Indian Markets *Sources- Bloomberg, Moneycontrol, Zeebusiness, livemint
- 2. Equity Bazaar SEBI Registered– Research Analyst Equities I Commodities I Currencies I Mutual Funds Nifty Outlook Bank Nifty Outlook Bank Nifty closed at 17696 with gain of 0.30%. Bank Nifty opened on mild positive note but not able to sustain at higher level. Bank Nifty has formed inside or harami pattern which is negative sign on initial stage but further confirmation required. Among Bank Nifty index 8 banking stock ended on negative note, mild profit taking has been observed in leading private sector bank and PSB’s. Going forward, sustainability above 18000 level can lead to further positive momentum as it is acting major hurdle as of now. On downside support will be in range of 17400 to 17350 level. 20th June,2016 Nifty opened on mild positive note but was not able to sustain at higher level, it kept on sliding from morning high with mild negative bias. Nifty closed at 8170 level with gain of 65 points or 0.36%. From candlestick perspective Nifty has formed inside candle, Nifty has witnessed a volatile session. Nifty continued to take support at 21 day short term moving average which valued around 8080 level, it was 3rd consecutive event where bulls came into picture. Going forward, Broader range for Nifty seems to be in the range of 8100 to 8300 range. Nifty has downside support at 8060 to 8080 level and on higher side resistance will be around 8220 to 8240 level. L1 L2 L3 R 8198 8226 8257 S 8139 8108 8080 21 DEMA 8105 50 DEMA 7935 100 DEMA 7666 Moving Averages L1 L2 L3 R 17137 17960 18077 S 17578 17460 17329 21 DEMA 17470 50 DEMA 16880 100 DEMA 15965 Moving Averages
- 3. Equity Bazaar SEBI Registered– Research Analyst Equities I Commodities I Currencies I Mutual Funds Derivative Front: The VIX decreased by 1.96% and reached 17.35. The Nifty was up by 29.45 points or 0.36% to settle at 8,170.20. Nifty June 2016 futures closed at 8174.40 on Friday at a premium of 4.20 points. Nifty June futures saw addition of 0.002 million (mn) units, taking the total outstanding open interest (OI) to 17.06 million (mn) units. Among Nifty calls, 8200 SP from the June month expiry was the most active call with an addition of 0.01 million open interests. Among Nifty puts, 8100 SP from the June month expiry was the most active put with an addition of 0.23 million open interests. The maximum OI outstanding for Calls was at 8300 SP 6.51 mn and that for Puts was at 8000 SP 7.89 mn. From the most active contracts, SBI June 2016 futures traded at a premium of 0.95 points at 213.85 ICICI Bank June 2016 futures traded at a premium of 0.20 points at 239.00 . DLF June 2016 futures traded at a premium of 0.50 points at 134.70 . HDIL June 2016 futures traded at a premium of 0.50 points at 103.00 . Axis Bank June 2016 futures traded at a premium of 2.30 points at 528.65 . The Nifty PCR finally stood at 1.22 for June month contract. The top five scrips with highest PCR on OI were Indo Count Industries (1.55), Apollo Hospital (1.49), Hindalco (1.31), Indusind Bank (1.20) and CONCOR(1.20). 20th June,2016 Long Built Up Symbol Close Price Chng % OI Chng % Buy Above IOB 27.45 3.58 10.39 28.02 HDIL 103.00 6.96 9.33 105.48 PIDILITIND 704.90 0.51 8.47 711.03 POWERGRID 157.2 1.45 7.37 158.88 Short Covering Symbol Close Price Chng % OI Chng % Buy Above DIVISLAB 1114.50 0.17 -16.16 1123.19 UBL 753.05 0.93 -7.65 761.19 PETRONET 286.20 0.76 -7.20 287.96 ORIENTBANK 100 4.22 -6.59 102.08 Short Built Up Symbol Close Price Chng % OI Chng % Sell Below INFRATEL 339.40 -2.99 13.82 345.59 BATAINDIA 529.55 -1.56 10.71 535.07 VOLTAS 321.25 -1.14 5.85 324.92 TATAPOWER 73.9 -3.34 5.76 75.31 Long Liquidation Symbol Close Price Chng % OI Chng % Sell Below BEL 1260.20 -0.68 -9.96 1268.97 CEATLTD 832.20 -3.03 -9.34 846.70 MINDTREE 632.35 -0.09 -6.86 635.27 COLPAL 858.9 -1.13 -4.89 864.80 SHORT COLLAR Ini. Date- 2nd June, 2016 View – Bearish Max. Profit of Rs. 57155, Max. Loss of Rs. 12845 Expiry Date - 30th JUN 2016 Future BUY / SELL QTY SERIES TYPE Market Price SELL 700 JUNE Fut 1059 Option BUY / SELL QTY STRIKE PRICE SERIES OPTION TYPE Premium BUY 700 1040 JUNE CE 41.95 SELL 700 940 JUNE PE 4.60 -40.00 -20.00 0.00 20.00 40.00 60.00 80.00 100.00 810.00 960.00 1110.00 1260.00 YESBANK
- 4. Equity Bazaar SEBI Registered– Research Analyst Equities I Commodities I Currencies I Mutual Funds 20th June,2016 Symbols CLOSE R3 R2 R1 P S1 S2 S3 Trend Action ACC 1556 1583 1568 1562 1553 1547 1538 1524 Up Buy ADANIPORTS 207 214 211 209 208 206 204 201 Down Sell AMBUJACEM 235 242 239 237 235 234 232 229 Down Sell ASIANPAINT 1000 1045 1024 1012 1003 991 982 961 Down Sell AUROPHARMA 725 766 748 736 730 719 713 695 Down Sell AXISBANK 526 547 538 532 528 523 519 510 Down Sell BAJAJ-AUTO 2572 2639 2606 2589 2572 2555 2539 2505 Down Sell BANKBARODA 150 160 155 153 151 148 146 142 Down Sell BHARTIARTL 358 383 368 363 354 349 339 325 Up Buy BHEL 122 127 125 123 122 121 120 117 Down Sell BOSCHLTD 21970 22679 22330 22150 21980 21801 21631 21282 Down Sell BPCL 1003 1045 1027 1015 1008 996 989 970 Down Sell CIPLA 484 498 492 488 486 482 480 474 Down Sell COALINDIA 312 325 318 315 312 309 305 299 Up Buy DRREDDY 3000 3222 3127 3063 3032 2968 2936 2841 Down Sell EICHERMOT 18725 19202 18983 18854 18765 18636 18546 18327 Down Sell GAIL 387 395 391 389 386 384 382 377 Up Buy GRASIM 4310 4417 4369 4339 4321 4291 4273 4225 Down Sell HCLTECH 752 766 759 755 752 748 745 737 Up Buy HDFC 1223 1274 1249 1236 1223 1210 1198 1172 Down Sell HDFCBANK 1171 1196 1184 1178 1172 1165 1159 1147 Down Sell HEROMOTOCO 3023 3109 3070 3046 3031 3008 2993 2954 Down Sell HINDALCO 119 124 121 120 119 118 117 114 Down Sell HINDUNILVR 877 903 890 884 878 872 866 854 Down Sell ICICIBANK 239 253 246 242 239 235 232 225 Up Buy IDEA 101 104 103 102 101 100 99 97 Up Buy INDUSINDBK 1102 1143 1121 1111 1098 1089 1076 1054 Up Buy INFRATEL 338 374 357 347 341 331 324 308 Down Sell INFY 1179 1218 1200 1190 1182 1172 1165 1147 Down Sell ITC 359 369 364 361 358 356 353 348 Up Buy KOTAKBANK 749 777 765 757 753 745 741 729 Down Sell LT 1475 1543 1514 1494 1484 1464 1454 1424 Down Sell LUPIN 1461 1507 1486 1473 1465 1452 1444 1423 Down Sell M&M 1344 1389 1368 1356 1348 1336 1327 1306 Down Sell MARUTI 4093 4244 4180 4136 4115 4072 4050 3986 Down Sell NTPC 153 156 154 154 152 152 150 148 Up Buy ONGC 211 216 214 212 211 210 209 206 Down Sell POWERGRID 157 166 161 159 156 154 151 146 Up Buy RELIANCE 973 991 982 978 974 969 965 957 Down Sell SBIN 213 226 220 216 214 211 208 202 Down Sell SUNPHARMA 741 783 764 753 746 735 728 710 Down Sell TATAMOTORS 464 479 471 467 462 459 454 445 Up Buy TATAMTRDVR 312 321 316 314 312 309 307 302 Down Sell TATAPOWER 74 82 78 76 74 72 70 66 Down Sell TATASTEEL 325 347 337 331 328 322 318 308 Down Sell TCS 2600 2692 2641 2620 2590 2569 2539 2488 Up Buy TECHM 534 556 546 540 536 530 526 517 Down Sell ULTRACEMCO 3287 3390 3343 3315 3296 3268 3249 3202 Down Sell WIPRO 550 561 556 553 551 548 546 541 Down Sell YESBANK 1067 1097 1082 1075 1067 1060 1052 1037 Down Sell ZEEL 450 470 461 456 453 447 444 435 Down Sell
- 5. Equity Bazaar SEBI Registered– Research Analyst Equities I Commodities I Currencies I Mutual Funds Contact Us www.choiceindia.com Kunal Parmar Research Associate kunal.parmar@choiceindia.com Vikas Chaudhari Research Associate vikas.chaudhari@choiceindia.com www.choiceindia.comcustomercare@choiceindia.com Disclaimer This is solely for information of clients of Choice Broking and does not construe to be an investment advice. It is also not intended as an offer or solicitation for the purchase and sale of any financial instruments. Any action taken by you on the basis of the information contained herein is your responsibility alone and Choice Broking its subsidiaries or its employees or associates will not be liable in any manner for the consequences of such action taken by you. We have exercised due diligence in checking the correctness and authenticity of the information contained in this recommendation, but Choice Broking or any of its subsidiaries or associates or employees shall not be in any way responsible for any loss or damage that may arise to any person from any inadvertent error in the information contained in this recommendation or any action taken on basis of this information. Technical analysis studies market psychology, price patterns and volume levels. It is used to forecast future price and market movements. Technical analysis is complementary to fundamental analysis and news sources. The recommendations issued herewith might be contrary to recommendations issued by Choice Broking in the company research undertaken as the recommendations stated in this report is derived purely from technical analysis. Choice Broking has based this document on information obtained from sources it believes to be reliable but which it has not independently verified; Choice Broking makes no guarantee, representation or warranty and accepts no responsibility or liability as to its accuracy or completeness. The opinions contained within the report are based upon publicly available information at the time of publication and are subject to change without notice. The information and any disclosures provided herein are in summary form and have been prepared for informational purposes. The recommendations and suggested price levels are intended purely for trading purposes. The recommendations are valid for the day of the report however trading trends and volumes might vary substantially on an intraday basis and the recommendations may be subject to change. The information and any disclosures provided herein may be considered confidential. Any use, distribution, modification, copying, forwarding or disclosure by any person is strictly prohibited. The information and any disclosures provided herein do not constitute a solicitation or offer to purchase or sell any security or other financial product or instrument. The current performance may be unaudited. Past performance does not guarantee future returns. There can be no assurance that investments will achieve any targeted rates of return, and there is no guarantee against the loss of your entire investment. POTENTIAL CONFLICT OF INTEREST DISCLOSURE (as on date of report) Disclosure of interest statement – • Analyst interest of the stock /Instrument(s): - No. • Firm interest of the stock / Instrument (s): - No. Amit Pathania Research Associate amit.pathania@choiceindia.com 20th June,2016 Kapil Shah Research Associate kapil.shah@choiceindia.com Kapil Shah Digitally signed by Kapil Shah DN: cn=Kapil Shah, o=Choice Equity Pvt Ltd, ou=Research Team, email=kapil.shah@choiceindia.com, c=US Date: 2016.06.20 09:00:11 +05'30'