SlideShare a Scribd company logo
1 of 39
Download to read offline
Photo: Flicker/Creative Commons
2018	
Sanchita Talukdar	
30th April 2018
Global	perspective	on	water	scarcity
Global perspective on water scarcity
Section - Page | 1
Acknowledgement
This report was funded by David Lipschitz.
Contact: david@mypowerstation.biz
(c) David Lipschitz and Sanchita Talukdar, 2018.
Table of Content
Part I.	 Water a Vital Resource ............................................................... I-3	
Section 1.01	 Water Stress and Water Access: Health Implications..... I-7	
(a)	 Water Stress ............................................................................... I-8	
(b)	 Water Access............................................................................ I-10	
Part II.	 Water Scarcity and Crimes ...................................................... II-14	
Part III.	 Water Governance in South Africa ......................................... III-18	
Section 3.01	 Undiversified water supply .......................................... III-19	
Section 3.02	 Unsustainable water demand and management......... III-22	
Section 3.03	 Water security: Best Practice...................................... III-24	
Part IV.	 The Way Forward................................................................IV-27	
Part V.	 Reference ................................................................................V-30
Global perspective on water scarcity
Section - Page | I-3
Part I. Water a Vital Resource
Water resources provide vital ecosystem services - provisioning, regulating,
cultural and support (Millennium Development goals report, 2011) functions
that are essential drivers for sustainable economic development (WWAP,
2016) impacting critical health, hygiene and life sustaining parameters that
derive human wellbeing. It is “critical to the resilience of landscapes and
communities” (Rockstrom J., et al 2014) which “depend on freshwater, both
in terms of ‘green’ evapotranspiration water for plant growth and ‘blue’
environmental water flows to sustain ecological habitats” (Rockstrom, J. et
al. 2014).
Figure 1: Human well being as a driver and receptor of ecosystem services. Source: Rockstrom
et al 2014
Figure 1 illustrates the “interconnectedness between social drivers and
processes in the landscape, where water – “blue” as well as “green” –
interacts with ecosystems in producing goods and services to secure human
wellbeing. Sustaining this social-ecological system demands a set of social
Key Milestone agreements
on water:
2010: In 2010, the United
Nations General Assembly
acknowledged under its
resolution (A/RES/64/292) “the
importance of equitable access
to safe and clean drinking
water and sanitation as an
integral component of the
realization of all human
rights”(United Nations 2010)
2015: The 2030 Agenda for
Sustainable Development
adopted by the member states
of the United Nations, on
September 2015, aligns a time
bound meeting of Goal 6 –
“Ensure availability and
sustainable management of
water and sanitation for all”, in
order to achieve affordable
universal drinking water,
sanitation and hygiene targets.
The sub goals under Goal 6,
address significant issues
emanating in the freshwater
cycle.
March 22, 2018: The UN
General Assembly proclaims
the period from 2018 to 2028
the International Decade for
Action, “Water for Sustainable
Development” (the “Decade”),
to further improve cooperation,
partnership and capacity
development in response to the
ambitious 2030 Agenda. The
Decade builds on the
achievements of the previous
“Water for Life” Decade,
2005-2015.
Global perspective on water scarcity
Section - Page | I-4
transformations: water governance, global cooperation and water
management” (Rockstrom J., et al. 2014).
The salience of accessible and sufficient water resources for nations and
communities under any stage of development, lies in its ability to enable the
freedoms to choose from “possible livings” (Sen, A.K. 2002), which is a
vector of capabilities to achieve opportunities and a way of life that conform
to the economic, social, aesthetic, cultural and ecological ambitions of a
community or a country. Access to safe and sufficient drinking water at an
affordable cost in order to meet basic needs, which includes sanitation and
hygiene (cf. United Nations General Assembly, 2010), and the safeguarding
of health and well-being (UNU, 2013) remains the central pillar for all
discourses on water security as “the overarching goal of water
management” (GWP, 2000; Hoekstra, A et al. 2018).
For the marginal, mostly rural, communities in South Asia, Sub Saharan
Africa, Latin America and parts of South East Asia, “who primarily rely on
rain-fed agricultural practices, access to safe and reliable water resource
such as ponds, streams, rivers and lakes, and sustainably managed water
resources directly translates into providing food security, livelihood
protection, expanding local economies, thus improving living standards and
influencing greater social inclusion” (WWAP, 2016).
Water is linked to food security as it sustains agricultural food production
and stabilizes food prices for domestic consumption as well as in
international food markets for key agricultural produce (DeSouza A. and
Warren H., 2018) such as rice, wheat, maize/corn, coffee and fruits. The
State of Food Security and Nutrition Report 2017, provides crucial insights
into the impact of climate related disasters on food security. The report
observes that prolonged droughts and floods in rural economies of Asia,
Africa and south-eastern Asia has led to a hike in food prices, loss of
agricultural production, “drop in food availability causing food insecurity thus
setting in motion a vicious circle of violent conflict and civil insecurity” (FAO
et al, 2017 ; The Global Risk Report 2017, 2018)).
Sustainable urban water services in identified water scarce nations in South
Asia, MENA, the Sahel, Southern Africa, Central Asia and parts of Latin
America (Water Scarce Cities Initiative, The World Bank) therefore,
“contribute to inclusive growth and political stability in fragile contexts. Water
Global perspective on water scarcity
Section - Page | I-5
services in these regions are part of a social contract, failing which could
destabilize large urban centers (World Bank, 2018) inciting collapse of
social order and political regimes.
Water is a prime ingredient to heat, cool and is used as a basic element for
all industrial activities (PwC, 2011). Under unregulated environmental policy
scenarios, water acts as a direct medium for absorbing all kinds of industrial
and municipal wastes. An estimated 80 per cent of waste is released
worldwide without any treatment (WWAP, 2017) triggering water scarcity
(Tortajada et al , 2018) in even water-abundant regions of the world. Waste
water pollution is recognized as a critical driver of water scarcity in almost all
regions of the world (WWAP,2017). This has initiated industrial and
technological innovations catalyzing circular economy scenarios (Fischedick
M. et. al. 2014, Global Risks 2014) where industrial waste water of one
industry enters into the production cycles of another industry as a resource,
thus ensuring optimum water efficiency.
In the last three consecutive annual reports of the World Economic Forum
(WEF) water crisis has been ranked as one of the top three risks, as an
outcome of “failure of climate change and mitigation strategies”. (The Global
Risk Report,2017). This has led to forced internal migrations of populations
due to land desertification in Sub Saharan Africa, droughts in East and
Southern Africa, frequent flooding in India, Pakistan, China and Bangladesh
in South Asia, Thailand, Philippines in South East Asia. Within countries, an
estimated 143 million people in 2017, were internally displaced due to
climate related disasters (Kumari R. et al, 2018) with the largest internal
migration in Sub Saharan Africa (86 million), followed by South Asia (40
million) and Latin America (7 million).
Mekonen and Hoekstra (2016) estimate four billion people in the planet live
under conditions of severe water scarcity on a monthly basis (including India
(1.0 billion) and China (0.9 billion)) and another half a billion, face water
scarcity for all the year round (Hoekstra & Mekonen, 2016) and this
population could increase to some 4.8–5.7 billion by 2050 (WWDR, 2018).
Water crises engulf countries, broadly, 10 to 40 degrees north from Mexico
to China, western South America and Southern Africa in the Southern
Hemisphere (Veldkamp, et al. 2017, WWAP, 2018). Water scarcity is a
function of mismanaged water resources leading to overconsumption and
Global perspective on water scarcity
Section - Page | I-6
wastage, lack of preparedness to climate related weather uncertainty in
agrarian and urban contexts and relying on undiversified water supply
sources. Examples include, the case of Cape Town in South Africa, reeling
under extreme drought for the last three years relies on rain-fed reservoirs
as the only means of urban water supply which has shrunk drastically
inviting “Day Zero” and acute water rationing. A similar trend in shrinking
reservoirs impacting surface water availability and electricity production,
could be observed for the Al-Massira Dam in Morocco, Indira Sagar Dam in
India, Mosul Dam in Iraq and Spain’s Buendia Dam (Iceland C. et al., 2018).
Global demand for agricultural and energy production (mainly food and
electricity), both of which are water-intensive, is expected to increase by
roughly 60% and 80% respectively by 2025 (Alexandratos and Bruinsma,
2012; OECD, 2012; WWAP, 2018), however, industrial and domestic
demand for water will likely to grow much faster than agricultural demand.
This is mainly due to rising population and rapid urbanization with a push
towards greater industrialization and municipal water needs.
The urgency to mitigate water related risks causing freshwater scarcity has
been “at the heart of international milestone agreements such as the 2030
Agenda for Sustainable Development, the Sendai Framework for Disaster
Risk Reduction 2015-2030, and the 2015 Paris Agreement.”(UN, 2018). In
the recently summoned launch of International decade for water -2018-
2020, on March 22, World Water Day, the international community
recognized the global dimensions of the severity of water crisis with an
immediate call for concerted action and governance.
While countries and regions vary based on their agrarian status and income
levels, population size and economic activity, there is a common concern
around the globe for water related issues driven by uncertainties in weather
related precipitation levels affecting rainfall, declining reservoir capacity,
diminishing rivers and disasters such as floods and droughts.
This report delineates the pressures of water scarcity on countries during
the onset of prolonged drought /frequent floods with the objective of
highlighting best practices, scalable interventions that integrate uncertainties
and risk into the water governance architecture.
Global perspective on water scarcity
Section - Page | I-7
	
Table 1 : Extremely high water stressed
countries in the world
Rank Name
1 Antigua and Barbuda
1 Bahrain
1 Barbados
1 Comoros
1 Cyprus
1 Dominica
1 Jamaica
1 Malta
1 Qatar
1 Saint Lucia
1 Saint Vincent and the Grenadines
1 San Marino
1 Singapore
1 Trinidad and Tobago
1 United Arab Emirates
1 Western Sahara
17 Saudi Arabia
18 Kuwait
19 Oman
20 Libya
It is divided into three parts. The first part begins with understanding the
concept of water scarcity in the context of water stress and water access.
The impact of water scarcity and drought conditions on human health,
including WaSH (Water and Sanitation) mortality occurrence due to poor
water availability and unmet Sustainable Development Goals is then
assessed. The second part documents water related crimes defined by
conflicts arising out of inadequate water availability. The vicious cycle of
corruption-water theft- water scarcity has been illustrated. The third part is a
review of best practices on urban water governance relevant to water
scarcity issue around the globe.
Section 1.01 Water Stress and Water Access: Health
Implications
Freshwater scarcity is commonly described as a function of available water
resources and human population (Matlock, et al, 2011, Brown et al. 2011).
It may mean physical scarcity of water due to uneven distribution across
geographical realms and as a direct
outcome of climate change disasters
such as floods and droughts. For
example, out of an estimated 43,750
cubic kilometers of fresh water
resources per year at the continent
level, America constitutes the largest
share (45%), followed by Asia with
28%, Europe with 16% and Africa with
9%. (Mancosu et al, 2015).
Concepts and
Definitions:
Baseline water stress
measures total annual
water withdrawals
(municipal, industrial, and
agricultural) expressed as a
percentage of the total
annual available blue
water. Higher values
indicate more competition
among users.( Gassert, F.,
P. Reig, T. Luo, and A.
Maddocks. 2013)
Fresh water scarcity can
mean scarcity in availability
due to physical shortage, or
scarcity in access due to
the failure of institutions to
ensure a regular supply or
due to a lack of adequate
infrastructure. (UNU, 2018).
Access to safe water “is
measured by the proportion
of population with access to
an adequate amount of
safe drinking water located
within a minimum distance
located within a convenient
distance from the user’s
dwelling”(http://www.un.org
/esa/population/pubsarchiv
e/chart/12.pdf )
Global perspective on water scarcity
Section - Page | I-8
(a) Water Stress
The World Resources Institute’s Aqueduct project in 2013 found 36
countries face “extremely high” levels of baseline water stress- with more
than 80 per cent of its available water used for agricultural, domestic and
municipal needs (WRI, 2014). Table 1 lists the 20 most water stressed
countries from that list.
Figure 3: WRI-Aqueduct
The ranking, then excluded South Africa among the 36 most water stressed
countries. Nevertheless, as could be clearly noted from Figure 3 below, the
Aqueduct project indicated South Africa’s high overall water risk situation,
meaning, it is susceptible to acute water stress leading to scarcity if water
demand and supply is not managed effectively.
Figure 4: WRI-Aqueduct
Global perspective on water scarcity
Section - Page | I-9
A high baseline water stress was also recorded for City of Cape Town
(CCT) situated in the Western Cape Region of South Africa. “When drought
strikes where baseline water stress is high, it exacerbates the regions’ water
woes” (Maddocks A., 2014).
The negative impacts of the drought in the City of Cape Town in South
Africa are magnified due to its heavy reliance on a single water source-
surface water from dams and reservoirs for consumption. Water supply was
affected by a record low precipitation and high evaporation rate. Figure 4
highlights the extremely high levels of baseline water stress in CCT due to
the ongoing drought.
However, it should be noted that water stress does not always mean
countries actually facing water scarcity if best practices in water governance
accounts for water stress early on.
Singapore, for example, has the highest water stress ranking (5.0) (WRI,
2014). Despite a near absence of freshwater lakes or aquifers and demand
for water exceeding the supply; the country has emerged as a global leader
in water governance. A mix of heavy investments in innovation , research
and design of water technologies for monitoring of water quality , water
usage, reuse of reclaimed water and desalination projects as well as state
of the art drainage infrastructure to channelize storm water and rainfall
captured in one-third of its catchment area, to its man-made reservoirs.
Singapore focused on water demand management strategies to deal with
rising water demand by , utilizing insights such as reporting households’
comparative water usage in the water bill to modify high water consumption
behavior, devising of progressive water tax for profligate water users and
providing targeted subsidies for the poor households.
The country is a classic case of good water governance which has enabled
resilience thinking and innovative technologies as key to managing water
security for its nation.
Global perspective on water scarcity
Section - Page | I-10
(b) Water Access
There are 844 million people globally who lack basic drinking water services
(Water Aid, 2018, WHO-UNICEF, 2017). “Diseases due to poor drinking-
water access, unimproved sanitation, and poor hygiene practices cause
4.0% of all deaths and 5.7% of all disability or ill health in the world.” (WHO
2018). Contaminated drinking water is estimated to cause more than 500
000 diarrheal deaths each year (WHO, 2018).
Access to water in the proximity of households is critical for practicing
hygiene (Howard and Bartram, 2003), tackling malnutrition and infectious
disease
1
(Cairncross et al, 1987) and meeting hygiene-related health
outcomes. Pickering A. J. and Davis J (2012) in a cross-sectional study of
children in Subsaharan Africa, observed that a five-minute decrease in the
time to a water source was associated with a 14% fall in diarrhea risk and a
higher bodyweight score in children under five. “A fifteen-minute decrease in
collection time was associated with a 41% decrease in diarrhea risk for the
same age group. The authors noted that this level of reduction in diarrheal
disease morbidity is on par with reductions associated with sanitation, hand
washing, and water disinfection interventions” [Pickering and Davis, 2012,
cited by Graham J. et al. 2016].
In a study on water collection labor among women and children for 24
Subsaharan African (SSA) countries, it was found that adult females (68%)
among households spending over 30 minutes to collect water in all 24 SSA
countries, were the primary collectors while among households in countries
(Ethiopia, Burundi, Nigeria, Niger, Cameroon) with children collecting water,
female children were preferred over their male counterparts (Graham J.P.,
et al, 2016). This has serious health implications due to unmet sanitation
and hygiene standards. A higher water collection time is increasingly
associated with increased risk of moderate to severe diarrhea among
children (Nygren BL et. al, 2016).
1
“Cairncross et al. (1987) highlighted that villagers in a study community without a close water
supply stated that they often “cooked little, and only once a day, because of the lack of water”.
In the same study, the researchers found that the community with better water access had a
prevalence of trachoma of 19% versus 38% in the community without ready access to water.”
[Cairncross et al, 1987 cited by Graham J. P. et al., 2016)
Global perspective on water scarcity
Section - Page | I-11
Mortality rates due to unsafe water, sanitation and hygiene services in
countries in Africa in 2012 is triple to that of the global average.
(http://www.who.int/gho/phe/water_sanitation/burden/en/index3.html).
Health costs associated with waterborne diseases such as malaria,
diarrhea, and worm infections represent more than one third of the income
of poor households in sub-Saharan Africa (WHO, 2018).
Unmet health and hygiene goals are one of the many outcomes on account
of poor water access. The Water Gap – The State of the World’s Water
2018 report, recognizes the critical role that water plays in reducing socio-
economic and gender inequalities within communities. Inadequate water
comprises with the safety and security (fear of snake bites, wild animals,
injuries of women and children collecting water from far off distances,
violates dignity of women, inequality in education opportunities increasing
inequalities and exploitation of women (e.g. child marriages for girls).
Table 4 has been compiled from the Global Burden of Disease Study
(GBD), 2016, which monitored progress on the health-related Sustainable
Development Goals (SDGs) in 188 countries from 1990 to 2016. Countries
with poor water access are chosen from the State of the Water Report 2018
by Water Aid and South Africa has been added in the table as our country of
interest. Columns 2, 3 and 4 are progress scores measured on a scale of 0-
100, attained by the countries between 1990-2016 for indicators – WaSH
(mortality attributable to unsafe water and sanitation), population with
access to safe and improved water sources and population with access to
safe and improved sanitation, respectively. A lower score ranging between
0-50 indicates poor progress on meeting SDG targets for WaSH, Water and
Sanitation indicators.
Global perspective on water scarcity
Section - Page | I-12
Table 4: Progress in health-related SDG for countries with poor water
access
Notes: Individual indicators: WaSH mortality; Water; Sanitation are reported on a scale of 0 to
100, with 0 representing the worst levels from 1990-2030 and 100 reflecting the best during
that time. [GBD 2016, SDG collaborators, Lancet 2018, page 1434-1437); Projections until
2030 are calculated based on SDG [Sustainable Development Goals] and MDG (Millennium
Development Goals) progress for each country from 1990-2016;
Definitions: WaSh mortality: mortality attributable to unsafe water, sanitation, and hygiene;
Water: risk-weighted prevalence of populations using unsafe or unimproved water sources, as
measured by the SEV for unsafe water, %; Sanitation: Risk-weighted prevalence of populations
using unsafe or unimproved sanitation, as measured by the SEV for unsafe sanitation, %
Source: Adapted from Global Health Metrics: Figure 1: Performance on the health-related
SDG index, MDG index and non-MDG index, and 37 Individual health-related indicators, by
country, 2016 (GBD 2016 SDG Collaborators, Lancet 2017, page 1434-1437);
Column 5 is the Global health ranking based on these progress scores as
well as 37 other individual health-related indicators of the tabulated
countries as compared to the 188 countries (GBD 2016, SDG collaborators,
Lancet 2018), as included in the GBD study. Countries with poor scores
indicated by columns 2,3,4 end up at the bottom of the list of 188 countries.
Global perspective on water scarcity
Section - Page | I-13
From table 4, Somalia, Uganda, Chad, DRC (Democratic Republic of
Congo) are at the bottom end of the rankings.
South Africa ranks 122nd (out of 188 countries) in the Global Health Index,
and on a scale of 0-100, scores 25 points for WaSH , 58 for Water and 60
for Sanitation. The country has shown medium progress between 1990-
2016 in meeting overall health related SDG targets, however, the current
uncertainty due to droughts, if not managed effectively, could seriously
undermine its potential to meet its water-related SDG goals with deleterious
health consequences.
Water crises—from chronic water scarcity to lack of access to adequate
water supply and sanitation to hydrological extremes—can aggravate
challenges related to fragility and conflict (Sadoff et al, 2014, Tortajada et.
al. 2015, 2017). Water security goes beyond water scarcity to take account
not only of a country’s water resource endowment, but also of the
productive and protective actions the country has taken to secure its water
(Beyond Scarcity, World Bank 2018).
Global perspective on water scarcity
Section - Page | II-14
Part II. Water Scarcity and Crimes
Water crimes, could be defined, as any punishable contravention or
violation of the limits on human behavior, as imposed by national criminal
legislation, against surface water and groundwater, or against water
services. (EU, Water crimes project). A first of it kind project to document
water crimes inventory in the European Union, included 86 water-related
crimes (EU, Water Crimes Inventory, Oct 2017), suggesting
countermeasures and mitigation policies for countries such as Hungary,
Italy, Slovenia, Spain, and other EU countries.
According to the EU- Water Crimes Inventory report, water pollution and
water theft constituted 86 per cent of all water related crime cases in
Europe. Crimes related to surface water were reported for 36 per cent of
the cases, whereas 33 per cent were related to water services and 12
percent cases were pertaining to groundwater in Europe. Further, in “47
percent of the cases, the water was intended for human consumption; in 7
per cent it was intended for industrial use and in 6 per cent of cases, water
was intended for agricultural purposes.” [ EU, Water Crimes Inventory, Oct
2017].
In Europe, water corruption posed the highest risk in these countries making
it vulnerable to organized crime groups who often monopolize and control
water supply [Interpol, 2016] and pollute water ways. This is mainly due to
unclear legislation, water scarcity, poverty and waste production. With
climate uncertainty, waste and water scarcity issues are on the rise and so
are the chances of water corruption expected to rise in the next five years,
according to the report.
Gleick (1989) identifies critical concerns due to climatic related risks
influencing water tensions with changes in: (1) water availability from altered
precipitation patterns or evaporative losses due to higher temperatures, (2)
the seasonality of precipitation and runoff, (3) flooding or drought
frequencies, and (4) the demand for and the supply of irrigation water for
agriculture. Fragility and climate change the water stressed areas of North
Global perspective on water scarcity
Section - Page | II-15
Africa and Middle East (World Bank, 2018) sets in a vicious cycle of further
violence and scarcity [Sadoff, et al, 2017]. Climatic concerns of water
scarcity and impact of prolonged famines resulting in desertification disrupts
livelihoods of rural communities such as fisheries and agriculture causing
food riots, violent conflicts and massive internal migration. Examples include
Central African Republic, Bangalala midlands (in Tanzania) Chad, Niger,
Mozambique, Uganda, Morocco, Sudan and Eriteria [UNCCD, 2014].
Droughts have led to migration, conflict or cessation in the past, in countries
such as India, Bangladesh, Mauritania, Senegal, Morocco and Eritrea
[UNCCD 2014].
Shared water resources or transboundary water resources are often a fertile
ground for water-related tensions (IPCC 2001, 950). The situation gets out
of government control in conflict-ridden and arid regions, resulting in social
disruptions, migration and losses of life and livelihoods [Sadoff et al 2017).
Thirty-four of the 37 countries affected by desertification and land
degradation triggered due to prolonged droughts are presumed to be at risk
of war due to absence of trans-boundary water resources cooperation
[UNCCD, 2014]. Although regional cooperation exists, such as agreements
between Egypt, Ethiopia and Sudan regarding the equitable exploitation of
Nile water, the rising issue of water theft has been left to national
governments to form individual responses ( http://globalinitiative.net/water-
smuggling/ ).
In 2016, river use disputes between the Indian states of Karnataka and
Tamil Nadu resulted in rioting in rioting in Karnataka’s capital city of
Bangalore (Reuters, 2016, quoted in Sadoff et al. 2017). In 2013, “a study
by the Water Research Commission estimated losses incurred every month
due to water theft and under maintenance of water infrastructure such as
leaky pipes in water scarce countries like South Africa, to the tune of 1.58
billion kiloliters a year, equivalent of 4.3 million swimming pools or to fill
about a third of the capacity of the Gariep Dam, the largest in South Africa”
(Savides, M, 2013).
El-Nino droughts in Syria and famines in Ethiopia fuels deadly food and
water riots causing large scale devastation of water and sanitation
infrastructure eroding the “social compact” [Sadoff et al, 2017] between
governments and citizens destabilizing peace and security in the nations.
Global perspective on water scarcity
Section - Page | II-16
Children are the most affected with high WaSh (Water and Sanitation)
mortality rates impacted by outbreaks of water borne diseases in water
scarce areas, e.g. “cholera outbreak in Yemen in 2016” (Global Burden of
Disease 2016), diarrheal deaths in Nigeria, Somalia and South Sudan in
Africa (https://phys.org/news/2017-03-children-shortages-unicef.html). In
Ethiopia, recurring droughts result in famine, food shortages, and water-
related diseases, as people are forced to rely heavily on contaminated and
stagnant water( https://water.org/our-impact/ethiopia/ ).
A significant rise in water crimes in the last decade is due to the enlarged
water footprints of the urban consumer, lax environmental legislation
perpetuating water pollution causing scarcity of freshwater resources in
water abundant areas, inadequate monitoring and audit to check non-
revenue water in water utilities causing water theft and rampant corruption
at all levels of water service providers. Examples of “water smuggling (such
as, development of illegal pipelines, illegal truck deliveries as well as the
cooptation of water regulators complicit in licensing fraud and broader
government acquiescence to illegal water delivery] and water theft could be
found in California, southern Europe, Nigeria, Kenya, the Middle East, and
South Asia (Vanda Felbab-Brown, 2015).
Water crimes are difficult to estimate. As Jay Bhagwan, executive manager
of water use and waste management at the Water Research Commission in
South Africa points out regarding water theft, “We don’t have an exact
figure… but we estimate that 15% of the losses are due to theft. You get rid
of illegal taps and then, overnight, they’re back again. It’s difficult to police”
(Savides, M., 2013).
Water scarcity due to drought impacts business and economic acitivity and
the City of Cape Town (CCT) is an important example of the case where
“eighteen of the city’s major tourism businesses have suffered a year-on-
year loss of R90 million due to the drought, while visitor-numbers from the
UK, France and the Netherlands have dropped by more than 10% due to
crime” (https://www.iol.co.za/capeargus/news/drought-and-crime-reduce-
tourism-in-city-14392617). Crime rate has worsened during the ongoing
drought with mandatory water restrictions put in place since February 2018.
This has led to the deployment of “ world’s first water police” force
(https://www.globalcitizen.org/en/content/cape-town-worlds-first-water-
Global perspective on water scarcity
Section - Page | II-17
police/) to tackle illegal water thefts, misuse and wastage of municipal water
supplies.
Global perspective on water scarcity
Section - Page | III-18
Part III. Water Governance in South Africa
Water resources in South Africa is made up of its “ecological infrastructure”
– consisting of surface water, that is, its rivers and lakes and all subsurface
and underground water stored in its aquifers, in soil, rock pores and
crevices [WWF2016].. The average rainfall of about 450mm/year compared
Figure 5: Drought-affected areas map. Source: National Integrated Drought Monitoring,
Department of Water and Sanitation, Republic of South Africa.
to the world average of 860 mm/year (WWF-2016, World Bank,2017).makes
South Africa one of the 30 driest countries in the world (Wegelin WA et al,
2017). Some of the current challenges hindering water security has been
highlighted below. The context of Cape Town city is deliberate in order to
address the current drought situation. The section ends with the Singapore
city-state’s best practices in water management, focusing on strategies
around effective water demand management and water supply governance.
!
!
!
!
!
!
!
!!
!
!
!
!
!
Durban
Bhisho
Pretoria
Upington
Nelspruit
Cape Town
Kimberley
Polokwane
Ekurhuleni
East London
Bloemfontein
Port Elizabeth
Pietermaritzburg
Johannesburg
Legend
! Major Towns
Province
Local Municipalities
Moderate Drought
Severe Drought
Extreme Drought
12 Month - SPI Drought - December 2017
Moderate Severe Extreme Total Settlements
EC 1491 139 210 1840 9076
FS 8 0 0 8 321
GT 0 0 0 0 2579
KZN 133 0 0 133 3620
LP 70 0 0 70 2692
MP 0 0 0 0 773
NW 0 0 0 0 1299
NC 5 21 23 49 545
WC 76 206 1048 1330 1597
TOTAL 1783 366 1281 3430 22502
3430 of 22502 Settlements affected by drought
Global perspective on water scarcity
Section - Page | III-19
Section 3.01 Undiversified water supply
15 billion cubic meters (98%) of the surface water is currently allocated
[WWF - SA, 2016] to meet irrigation needs for agriculture [60%], industrial
activities [5%], power generation [2.5%], and for municipal demand from
urban centers. This is met from “ an integrated system of large dams and
inter-basin transfers” [World Bank, 2017]. By 2030, water demand is
estimated to be 17.7 billion cubic meters [m3] [WWF-SA, 2016; Madden
2015] due to rising population levels [WWF-SA, 2016; Madden 2015] and
surge in economic activity.
South Africa shares four of its river basins with other states in the South
African Development Community (SADC). The variation in the annual and
seasonal flows of these rivers is determined entirely by climatic conditions
[Heyns, P. 2003, WWF-SA 2016] making water allocation between the
riparian states during droughts a major challenge.
River basins in South Africa Shared with other Basin States
Incomati & Maputo Mozambique, Swaziland
Limpopo Mozambique, Botswana and Zimbabwe
Orange Botswana, Lesotho and Namibia
Source: Adapted from Heyns P. (2003), Chapter 1: Water-resources management in Southern
Africa
The reliance on surface water alone, has proved costly for South Africa,
particularly for the southern and western regions (Drought - affected areas
map: Figure 5), including Cape Town, where a national drought disaster is
waiting to inflict impending doom on 4 million of the population of the port
city [Reuters, 2018]. Dam storage in South Africa is completely reliant on
rainfall and a decreasing trend (Figure 6) in monthly winter rainfall (between
600-800 mm in 2016) has negatively impacted water storage levels. The
potential of groundwater development has been largely limited and its usage
is unregulated and hence not measured. The non-potable groundwater in
Cape Town, for example, is used mainly for garden irrigation (Jacobs et al.,
Global perspective on water scarcity
Section - Page | III-20
2011] by private home-owners who bear the initial expense to install,
operate and maintain a garden borehole or well point [Wright T. et al, 2016].
Water storage in its six major dams
2
stood at record lows (See Table 5), as
Cape Town, prepares to face stringent water rationing under mandatory
Figure 6: Monthly Rainfall and Dam Storage.
Source: National Integrated Drought Monitoring, Department of Water and Sanitation ,
Republic of South Africa
water restrictions imposed by the Department of Water and Sanitation
(DWS) on various municipalities throughout the region to lower its water
demand .
2
“The capacity of the 6 dams is approximately 900 million m3 (Mm3). The
unconstrained system allocation is ~570 Mm3 which provides an unconstrained daily
demand of nearly 1,350 MLD to the supply system which includes CCT (City of
Cape Town), agriculture and other urban areas. With current restrictions, this has
been limited to an annual daily combined average of 680 MLD” (Department of
Water & Sanitation, April 2018, page 1)
Global perspective on water scarcity
Section - Page | III-21
Table 5: Cape Town River System State of Dams on 2018-04-23
Dams
Full
Storage
Capacity in
million
cubic
meters
This
Week
(%)
Last
Week
(%)
Last
Year
(%)
Berg River Dam 127.1 36.2 40.5 31.9
Steenbras Dam-Lower 33.9 36.7 38.3 30.2
Steenbras Dam-Upper 31.9 62.9 68.4 51.7
Theewaterskloof Dam 479.3 10.1 10.1 17.7
Voelvlei Dam 158.6 13.7 13.8 19.9
Wemmershoek Dam 58.8 44.9 44.3 36.2
Total 889.3 19.7 20.5 23
Source: Department: Water and Sanitation, Republic of South Africa: Retrieved online
http://www.dwa.gov.za/Hydrology/Weekly/RiverSystems.aspx?river=CT
The current restriction level is 6B, requiring savings of 45%. For
nonresidential customers monthly consumption needs to be reduced by
45% of unconstrained demand while individuals are restricted to 50 litres
per capita per day (lcd) and households to 6 kilolitres (kl) per month”
(Department of Water & Sanitation,CCT,April 2018). On April 13, 2018, the
DWS (Department of Water & Sanitation) , “based on consumption
scenarios, the Day Zero dam level was projected at 13.5% beyond July
2018, which would provide 3 months’ worth of water at a reduced volume
“supplied of 350MLD” (Department of Water & Sanitation, April 2018, page
1)
Global perspective on water scarcity
Section - Page | III-22
Section 3.02 Unsustainable water demand and management
Figure 6: Per capita water consumption in SA in 2015-16
Source: Department of Water and Sanitation, as quoted in
https://africacheck.org/reports/south-africans-guzzle-235-litres-water-per-day/
Note: The per capita numbers quoted in Figure 6 are for 2015/2016.
Table 6: Water Demand in Cape Town
(Source: DWS: Annexure A: New Water Programme, The Water Outlook, 2018,
page1)
At an average water use efficiency, defined as per capita water
consumption per day, of 237 ℓ/c/d and 234 ℓ/c/d for the Provinces and the
WSA (Water Services Authority) [Wegelin WA et al, July 2017], water
demand in the region is quite high. The provinces - Guateng, Kwazulu-Natal
and Western Cape constitute 66 per cent of the total water demand day
[Wegelin WA et al, July 2017]. Cape town reduced its average water
demand by 700 million liters on average per day between 2015 to Feb 2018.
	
Water Demand in Cape Town
Average water demand
Month &Year Million litres per day
Feb-15 1200
Feb-16/17 900
Feb-18 500
Global perspective on water scarcity
Section - Page | III-23
The Department of Water and Sanitation in South Africa recommends a
reduction of its per capita water consumption below 200 liters/person/day
and align with international benchmarks of 180 liters per capita per day
[Wegelin WA et al, July 2017]. Note that liters per capita per day, refers to
usage for residential, industrial and commercial purposes, and ignores
agriculture. Controlling residential water demand is an important outcome
of any successful water conservation strategy. For example, water stressed
Singapore has, over the years, used demand management strategies to
make the city –state drought resilient in the long run, influencing a reduction
in residential water use per capita from 163 liters per capita per day to the
current 140 liters per capita per day.
Non-revenue water: Water stress is accentuated due to a debilitating
physical water infrastructure causing water leaks and water losses from the
system. “Water losses for all municipalities, indicate water losses of 1414.49
million m3 /a (35.9%) and NRW (Non-revenue water) of 1632.93 million m3
/a (41.0%) from the 2015/16 water balance” [Wegelin WA et al. July 2017].
Free basic water (6 kilo liters per household per month) and electricity
service (50 kwh of electricity per household per month) is provided to
identified poor consumers, known as indigent households, billed at zero
rates. In 2016, 58% (9 million out of 15 million households) of indigent
households received free water service. As per estimates by the NFCM
(Non-Financial Census of Municipalities], indigent consumer units
3
receiving
free basic water service of rose by 4.2% in 2016 (NFCM,2017) compared to
2015 requiring an urgent need to plug non-revenue water and water losses
from the water supply system.
While South Africa reels under the current drought learnings from the
Millennium Drought in Australia offers some priceless insights into water
demand strategies and supply planning during drought (See Web links on
Managing Drought: Learning from Australia”- Turner et al 2016). After all, a
drought can be “both a crisis and an opportunity to innovate- to roll out new
water savings initiatives and incentives to scale, and to leverage community
and political will to make needed policy and regulatory changes”.[Turner et
al, 2016].
3
Consumer units not equal to households (NFCM, 2017)
Global perspective on water scarcity
Section - Page | III-24
Political will is a key driver of significant investments made during drought
crisis in the short run and effective water resource management for
maintaining water security in the long run. Water resource management in
Singapore is a classic case in point.
Section 3.03 Water security: Best Practice
Case of Urban Water Governance in Singapore
With a population of 5 million and no natural water resources to call its own,
the water stressed state of Singapore is an exemplar model of water
security. The PUB (Public Utilities Board) is the central planning and
implementation organization of the entire gamut of institutional, allocation,
monitoring and management mechanisms pertaining to water and drainage
system of the city-state.
Source: PUB (Public Utilities Board), https://www.pub.gov.sg/PublishingImages/Waterloop.png
Global perspective on water scarcity
Section - Page | III-25
Successful strategies deployed by Singapore include,
a) Diversification of the water supply portfolio:
The four national taps are: 1. Imported water from Malaysia 2. Rainwater 3.
Recycled water 4. Desalinated water
1. Rainwater: Collect every drop (PUB, 2018): Expansion of catchment
areas to one-third of all land area to replenish its water reservoirs.
(Tortajada, C. and Buurman J, 2017). Rainfall accounts 10 per cent
of water supply to the city-state (Lee T.K. and Tortajada C., 2018)
Introduce storm water management strategies to include Low
Impact Design (LID) design principles such as green roofs, rain
gardens in buildings to treat storm water for water quality
improvement at source (Lim H. S. and Lu X. X., 2016).
2. Recycled water: Reuse water endlessly (PUB, 2018): “NEWater is a
local term for high quality recycled treated waste water. It is
supplied both for direct non-potable use (DNPU) to commercial and
manufacturing processes that require water and for cooling, and for
indirect potable use (IPU) by introducing water into reservoirs for
subsequent retreatment at the several water works for drinking
purposes” (Tortajada C and Joshi Y., 2013). “Presently, Singapore's
five NEWater plants can meet up to 40% of the nation’s current
water needs. By 2060, NEWater is expected to meet up to 55% of
Singapore’s future water demand”
(https://www.pub.gov.sg/watersupply/singaporewaterstory )
3. Desalinated water (PUB 2018): “Singapore currently uses reverse
osmosis for its desalination, which uses about 3.5kWh/m3. There
are currently two desalination plants supplying 25% of current water
demand in Singapore source. Three more desalination plants are
expected to meet up to 30 per cent of Singapore’s water needs by
2060.”
https://www.pub.gov.sg/watersupply/fournationaltaps/desalinatedwa
ter )
4. Imported water (PUB, 2018): Under the 1962 water agreement
between Singapore and Malaysia, Singapore can draw up to
Global perspective on water scarcity
Section - Page | III-26
1.1billion litres (250 gallons) of water from the Johor river in
Malaysia until 2061.
b) Water demand management:
Increase in residential water prices in a phased manner (a 30% hike phased
over 2 years; the second phase of the price rise is on July 2018) for
infrastructure repair and update, water conservation tax to discourage water
wastage
Stepping up of water conservation efforts in industry- Water Efficiency Index
to identify sectors and operations that use the most water (Tortajada, C. et
al 2013, Lee T.K. and Tortajada C., 2018) , public outreach and education
programmes, provision of water saving kits etc.
c) Non-Revenue water management
Non-revenue water or water loss at 4.6% is the lowest in the world.
Monitoring got smart with the usage of water sensors – data sondes –
developed by US-based water tech firm Xylem that report pressure
irregularities and other key factors into analytics software to be sent to a
central command center by text message and apps (Balch, O 2015)
Outcome “Singapore's per capita household water consumption was
reduced from 165 liters per day in 2003 to 143 liters in 2017. The target is to
lower it to 140 liters by 2030” (PUB 2018).
The path ahead: High capital investments in desalination and NEWater
sources to meet water demand diversifies water supply sources and adds
resilience during dry spells and droughts (PUB, Financial Report
2013/2014). Desalination and used water treatment are energy-intensive
and in order to reduce its carbon footprint, PUB has leveraged on massive
investments in research and development for energy efficient technologies.
Global perspective on water scarcity
Section - Page | IV-27
Part IV. The Way Forward
The ongoing drought in CCT has changed its residents’ relationship with
water. While the city scrambles to augment its water supply from its
groundwater aquifers, shutting down irrigation supplies, increase in water
tarrifs, mandatory rationing of water consumption and policing of water
wastage for all its residents, the government officials realize the need for a
paradigm shift in water management. “The security of water resources
necessitates a departure from the status quo, to an innovative system that is
able to understand and appreciate how different natural, policy, and political
variables interact and affect each other” (Tortajada and Fernandez,2018).
Distilling some of the best practices in drought management and water
governance practices from Singapore, Australia, California and European
cases, the report through a global perspective on water scarcity hints at the
urgency to address drought monitoring and preparedness into all short run
and long run water management policies to restore water security in the City
of Cape Town. “One of the cornerstones of proactive drought management
is the establishment of a drought policy and a drought management plan
which should address the whole drought management cycle (monitoring–
impact assessment–response–recovery–preparedness) and help to improve
decision-making processes in drought management” (Bokal S. et. al. 2018)
In the short run while water conservation and nudging citizens to consume
less water remains a proven successful water demand management
strategy in countries like Singapore, Australia and California; the current
drought in CCT has brought into light the perils of relying on a single “tap”
(surface water from reservoirs) for water supply - which is entirely
dependent on rainfall. The time is ripe to incorporate a diverse water
portfolio to augment water supply by reusing wastewater, desalination and
groundwater effectively for meeting municipal water demand. Best practices
illustrate that this could be effectively implemented, by implementing
innovations in desalination and waste water technologies that minimize
energy usage and effluent discharges, integrating leak detection technology
in the water supply network and regular, timely maintenance of water
infrastructure and involving stakeholder participation at all levels –
agriculture, industry, rural as well as urban consumer in water conservation.
Global perspective on water scarcity
Section - Page | IV-28
Appendix 4.1: Web-sources and Links to Drought Management
practices:
Publication/Source
name and link
Summary and Link
Integrated Drought
Management in
Central and Eastern
Europe:
Compendium of
Good Practices.
Link:
https://reliefweb.int/sites/reliefweb.int/files/reso
urces/idmp-cee_compendium_en.pdf
Summary:
This Compendium is the final publication of the
first phase of the GWP/WMO Integrated
Drought Management Programme in Central
and Eastern Europe (hereafter IDMP CEE). It
provides an overview of the programme’
outputs and accomplishments achieved in the
period from 2013 to 2015.The Programme’s
main goal is to increase the capacity of the
CEE region to adapt to climatic variability by
enhancing resilience to drought.
Cambareri, Grace,
“Robust Drought
Planning in
Megacities: A Case
Study in Sao Paulo,
Brazil”.
Link
https://scholarworks.umass.edu/cgi/viewco
ntent.cgi?article=1083&context=cee_ewre
Abstract: The megacity of São Paulo, Brazil
recently faced a severe three-year drought
(2013- 2015) that highlighted the challenges of
growing water demands, unpredictability of
future supply, and proper communication with
the public during crisis. Given the poor
outcomes of the recent drought, the question
remains as to how the drought can be used to
inform and improve future drought
preparedness. This study develops a seven-
step framework using simulation and a
Global perspective on water scarcity
Section - Page | IV-29
computational search to identify promising
drought plans based on the historic record.
These promising plans are then tested under
alternative states of the world to explore their
robustness and identify regions of vulnerability.
While the resulting drought plans are
dependent on many assumptions regarding
system operations, performance preferences,
and future conditions, the process can be used
by managers with knowledge of the system in
collaboration with stakeholders to identify
drought plans that will result in better
outcomes.
Andrea Turner,
Stuart White, Joanne
Chong, Mary Ann
Dickinson,
Heather Cooley, and
Kristina Donnelly,
“Managing Drought:
Learning from
Australia.”
http://pacinst.org/wp-
content/uploads/2016/07/Managing-
Drought-Report-2016-02-23-FINAL-US-
Letter.pdf
“The impact of the Australian Millennium
Drought on urban water supplies varied widely
across the country due to differing climates,
water supply systems and policy responses.
Different stakeholders also experienced the
drought in different ways. This summary, and
the background material on which it is based,
represent one interpretation of the drought and
responses to it. It is an interpretation that is
informed by significant engagement with
utilities and governments throughout that
period, and a close working knowledge of the
relevant water systems and policy
environments.”
Global perspective on water scarcity
Section - Page | V-30
Part V. Reference
1. “Theft and leaks are draining SA’s water”, by Matthew Savides,
23 June 2013, The Sunday Times. Retrieved online
http://www.pressreader.com/south-africa/sunday-
times/20130623/281788511631838/TextView
2. Alexandratos, N. and Bruinsma, J. 2012. World Agriculture
Towards 2030/2050: The 2012 Revision. ESA Working paper
No. 12-03. Rome, Food and Agriculture Organization of the
United Nations (FAO).
www.fao.org/docrep/016/ap106e/ap106e.pdf
3. Arjen Y Hoekstra and Joost Buurman . 2018. Urban water
security: A review. Environmental Research Letters. In press
https://doi.org/10.1088/1748-9326/aaba52
4. Arjen Y. Hoekstra. 2018. How to reduce our water footprint to a
Sustainable level? Vol LV , No. 1, 2018. March 2018. Retrieved
online April 18, 2018 https://unchronicle.un.org/article/how-
reduce-our-water-footprint-sustainable-level
5. Balch Oliver. 2015. “Singapore gets smart about water”,, 18
March, 2015, The Guardian, Retrieved online
https://www.theguardian.com/sustainable-
business/2015/mar/18/smart-water-solutions-singapore-
newater-vertical-farming
6. Biswas A. and Tortajada Cecilia on Policy Forum. Feb 22, 2018,
“Tightening the Taps Cape Towns Water Crisis”
https://www.policyforum.net/tightening-the-taps-cape-towns-
water-crisis/
7. Biswas A. and Tortajada Cecilia on Policy Forum. Feb 22,2018,
https://www.policyforum.net/tightening-the-taps-cape-towns-
water-crisis/
8. Bokal S. and Richar Muller (2018). Integrated Drought
Management in Central and Eastern Europe. WMO (World
Metereological Organization) Bulletin, Special Issue on Water,
Volume (67) 1- 2018, page 60-64.
Global perspective on water scarcity
Section - Page | V-31
9. Cairncross S, Cliff JL (1987) Water use and health in Mueda,
Mozambique. Trans R Soc Trop Med Hyg 81: 51–54. PMID:
3445322.
10. De Souza, Agnieszka and Hayley Warren.2018. “ Climate
Change is messing with your Dinner.” April 13, 2018. Retrieved
online https://www.bloomberg.com/graphics/2018-climate-crops
11. FAO, IFAD, UNICEF, WFP and WHO. 2017. The State of Food
Security and Nutrition in the World 2017. Building resilience for
peace and food security.
Rome, FAO.
12. Fischedick M., J. Roy, A. Abdel-Aziz, A. Acquaye, J. M.
Allwood, J.-P. Ceron, Y. Geng, H. Kheshgi, A. Lanza, D.
Perczyk, L. Price, E. Santalla, C. Sheinbaum, and K. Tanaka,
2014: Industry. In: Climate Change 2014: Mitigation of Climate
Change. Contri- bution of Working Group III to the Fifth
Assessment Report of the Intergovernmental Panel on Climate
Change [Edenhofer, O., R. Pichs-Madruga, Y. Sokona, E.
Farahani, S. Kadner, K. Seyboth, A. Adler, I. Baum, S. Brunner,
P. Eickemeier, B. Kriemann, J. Savolainen, S. Schlömer, C. von
Stechow, T. Zwickel and J.C. Minx (eds.)]. Cambridge
University Press, Cambridge, United Kingdom and New York,
NY, USA.
13. Gassert, F., P. Reig, T. Luo, and A. Maddocks. 2013.
“Aqueduct country and river basin rankings: a weighted
aggregation of spatially distinct hydrological indicators.”
Working paper. Washington, DC: World Resources Institute,
November 2013. Available online
at http://wri.org/publication/aqueduct-country-river-basin-
rankings.
14. GBD 2016, SDG collaborators.2017. Measuring progress and
projecting attainment on the basis of past trends of the health-
related Sustainable Development Goals in 188 countries: an
analysis from the Global Burden of Disease Study 2016. Lancet
2017, September 16page 1434-1437. doi: 10.1016/S0140-
6736(17)32336-X. Epub 2017 Sep 12.
15. Gleick Peter H. 1989. The implications of Global Climatic
Changes for International Security. Climatic Change 15: 309-
325. 1989

Global perspective on water scarcity
Section - Page | V-32
16. Global Risks. 2014. Ninth Edition. Published by the World
Economic Forum. Accessed Online
http://www3.weforum.org/docs/WEF_GlobalRisks_Report_2014
.pdf
17. Gopolang Makou, Does South Africa guzzle 235 litres of water
per person daily?, 11 April, 2018. Retrieved online
https://africacheck.org/reports/south-africans-guzzle-235-litres-
water-per-day/
18. Graham J.P., Mitsuaki Hirai and Seung-Sup Kim. 2016. An
Analysis of Water Collection Labor among Women and Children
in 24 Sub-Saharan African Countries. PLoS ONE , June 1,
2016; DOI:10.1371/journal.pone.0155981.
19. GWP (2000) Towards water security: A framework for action,
Global Water Partnership, Sweden, Stockholm.
20. Heyns P. (2003) Book : International Waters in Southern Africa
edited by Mikiyasu Nakayama.Piet Heyn. 2003. Chapter 1:
Water-resources management in Southern Africa. United
Nations University Press.Retrieved online
http://archive.unu.edu/unupress/sample-
chapters/InternationalWaters.pdf
21. Howard G, Bartram J (2003) Domestic water quantity, service
levels and health. Geneva: WHO.
22. http://www.inceconnect.co.za/article/helen-zille-from-the-inside-
day-zero-memes-and-myths-abound-ndash-let-rsquo-s-get-
back-to-essentials
23. http://www.un.org/millenniumgoals/pdf/(2011_E)%20MDG%20R
eport%202011_Book%20LR.pdf
24. INTERPOL. (2016). Strategic report. Environment, peace and
security. A convergence of threats. Retrieved from
https://europa.eu/capacity4dev/unep/document/stra tegic-
report-environment-peace-and-security-conver- gence-threats/
25. Jacobs HE. Wright T, Loubser C, Du Plessis JA and Kock J.
2011. Strategic assessment of household on-site water as
supplementary resource to potable municipal supply - current
trends and future needs. WRC Report No. 1819/1/10. Water
Research Commission, Pretoria
Global perspective on water scarcity
Section - Page | V-33
26. Kumari Rigaud, Kanta, Alex de Sherbinin, Bryan Jones, Jonas
Bergmann, Viviane Clement, Kayly Ober, Jacob Schewe,
Susana Adamo, Brent McCusker, Silke Heuser, and Amelia
Midgley.(2018). Groundswell: Preparing for Internal Climate
Migration. Washington, DC: The World Bank. Retrieved Online.
27. Lee Tommy Kevin and Cecilia Tortajada. 2017. “Can Singapore
build a better environment?” 6 December , 2017. Retrieved
Online https://www.policyforum.net/singapore-environment/
28. Lim H.S. and X. X. Lu. 2016. Sustainable urban stormwater
management in the tropics: An evaluation of Singapore’s ABC
Waters Program. Journal of Hydrology 538 (2016) 842-862.
29. Luker E. & Lucy Rodina. 2017. The Future of Drought
Management for Cape Town: Summary for Policy Makers.
Policy Brief. June 15, 2017. Institute for Resources,
Environment and Sustainability, University of British Columbia,
Vancouver, Canada. Retrieved online
http://edges.sites.olt.ubc.ca/files/2017/06/The-Future-of-
Drought-Management-for-Cape-Town-Summary-for-Policy-
Makers.pdf
30. Luo, T., R. Young, and P. Reig. 2015. "Aqueduct projected
water stress rankings." Technical note. Washington, DC: World
Resources Institute, August 215. Available online at
http://www.wri.org/publication/aqueduct-projected-water-stress-
country-rankings.
31. Madden K. (2015). Perspectives on Green Growth
Partnerships: Strategic Water Partners Network South Africa.
2030 Water Resources Group,
32. Maddocks A. 2014. “Water Stress Magnifies Drought’s Negative
Impacts throughout the United States.” April 14, 2014. World
Resources Institute Blog. Available at
http://www.wri.org/blog/2014/04/water-stress-magnifies-
drought%E2%80%99s-negative-impacts-throughout-united-
states
33. Mancosu N., Richard L. Snyder, Gavriil Kyriakakis and
Donatello Spano . 2015. Water Scarcity and Future Challenges
for Food Production. Water 2015, 7(3), 975-
992; https://doi.org/10.3390/w7030975
Global perspective on water scarcity
Section - Page | V-34
34. Maxmen, Amy. 2018. “As Cape Town water crisis deepens,
scientists prepare for ‘Day Zero” by Amy Maxmen, 24 jan 2018,
Nature 554, 13-14 (2018) doi: 10.1038/d41586-018-01134-x
https://www.nature.com/articles/d41586-018-01134-x
35. Nygren BL, O'Reilly CE, Rajasingham A, Omore R, Ombok M,
Awuor AO, et al. (2016) The Relationship Between Distance to
Water Source and Moderate-to-Severe Diarrhea in the Global
Enterics MultiCenter Study in Kenya, 2008–2011. The
American Journal of Tropical Medicine and Hygiene: 15– 0393.
36. OECD (Organisation for Economic Co-operation and
Development). 2012. OECD Environmental Outlook to 2050:
The Consequences of Inaction. Paris, OECD Publishing;
https://doi.org/10.1787/9789264122246-en
37. On the record: “Water Crimes: A Global crisis on the rise.” By
Vanda Felbab-Brown, Feb 20, 2015.
https://www.brookings.edu/on-the-record/water-crimes-a-global-
crisis-on-the-rise/
38. Pickering AJ, Davis J (2012) Freshwater availability and water
fetching distance affect child health in sub-Saharan Africa.
Environmental Science and Technology 46: 2391–2397. doi:
10.1021/es203177v PMID: 22242546.
39. PUB (Public Utilities Board). 2013/2014. A Fine Balance. PUB
Financial Report 2013/2014. Retrieved online
https://www.pub.gov.sg/annualreports/financialreport2014.pdf
40. PUB (Public Utilities Board). 2018. Accessed Online
(https://www.pub.gov.sg/watersupply/singaporewaterstory )
41. Reuters. 2018. South Africa declares drought a national
disaster, by Reuters Staff, February 13, 2018. Retrieved online
https://www.reuters.com/article/us-safrica-drought-
dayzero/south-africa-declares-drought-a-national-disaster-
idUSKBN1FX1BI
42. Rockstrom, J., M. Falkenmark, T. Allan, C. Folke, L. Gordon, A.
Jagerskog, M. Kummu, M. Lannerstad, M. Meybeck, D. Moldne,
S. Postel, H. H. G. Savenijie, U. Svedin, A. Turton and O. Varis.
[2014]. The unfolding water drama in the Anthropocene :
towards a resilience-based perspective on water for global
Global perspective on water scarcity
Section - Page | V-35
sustainability. EcoHydrology, 7, 1249-1261(2014). DOI:
10.1002/eco.1562
43. Sadoff , Claudia W., Edoardo Borgomeo, and Dominick de
Waal. 2017. Turbulent Waters: Pursuing Water Security in
Fragile Contexts. Washington, DC, World Bank.
44. Sen, A.K. Rationality and Freedom: Oxford University Press,
New Delhi, 2002.
45. Suter, M. 2017. Running out of Water: Conflict and Water
scarcity in Yemen and Syria”, Sept 12, 2017,
http://www.atlanticcouncil.org/blogs/menasource/running-out-of-
water-conflict-and-water-scarcity-in-yemen-and-syria
46. The European Report on Water Crimes. 2017. The Regional
Environmental Centre for Central and Eastern Europe.
www.watercrimes.eu
47. The Global Risks Report 2017, 12th Edition, published by the
World Economic Forum within the framework of the The Global
Competitiveness and Risks Team. Accessed
http://www3.weforum.org/docs/GRR17_Report_web.pdf
48. The Global Risks Report 2018, 13th Edition, published by the
World Economic Forum. Accessed
http://www3.weforum.org/docs/WEF_GRR18_Report.pdf
49. The Millennium Development Goals Report 2011, United
Nations. Retrieved online
50. Tortajada C. and Asit Biswas . 2015. “The top global risk –
water”. January 31, 2015, The Straits Times. Singapore.
https://www.straitstimes.com/opinion/the-top-global-risk-water
51. Tortajada C. and Joost Buurman. July 2017. Water Policy in
Singapore. Global-Is-Asian magazine. Retrieved online
http://global-is-asian.nus.edu.sg/wp-
content/uploads/2017/07/Water-Policy-in-Singapore-graphics-
3.pdf
52. Tortajada C. and Victor Fernandez. 2018. Chapter in Book:
“Towards Global Water Security: A Departure from the Status
Quo?”, February 2018. DOI: 10.1007/978-981-10-7913-9_1.
Publisher: Springer Nature, Editors: World Water Council, pp.1-
19.
Global perspective on water scarcity
Section - Page | V-36
53. Tortajada, C. , Joshi Y., Biswas, A. K. [2013) .The Singapore
water story: Sustainable development in an urban city-state,
Routledge, Oxford, UK.
54. Turner, A., White, S., Chong, J., Dickinson, M.A., Cooley, H.
and Donnelly, K. 2016. Managing drought: Learning from
Australia, prepared by the Alliance for Water Efficiency, the
Institute for Sustainable Futures, University of Technology
Sydney and the Pacific Institute for the Metropolitan Water
District of Southern California, the San Francisco Public Utilities
Commission and the Water Research Foundation.
55. UNCCD. 2014. Desertification. The Invisible Frontline.
Retrieved online
http://www.droughtmanagement.info/literature/UNCCD_desertifi
cation_the_invisible_frontline_2014.pdf
56. UNU (United Nations University). 2013. Water Security & the
Global Water Agenda. A UN – Water Analytical Brief. UNU-
INWEH.
57. Veldkamp, T. I. E., Wada, Y., Aerts, J. C. J. H., Döll, P.,
Gosling, S. N., Liu, J., Masaki, Y., Oki, T., Ostberg, S., Pokhrel,
Y., Satoh, Y. and Ward, P. J. 2017. Water scarcity hotspots
travel downstream due to human interventions in the 20th and
21st century. Nature Communications, No. 15697.
https://doi.org/10.1038/ncomms15697
58. Water Aid. 2018. The Water Gap- The State of the World’s
Water 2018. Retrieved online
https://washmatters.wateraid.org/sites/g/files/jkxoof256/files/The
%20Water%20Gap%20State%20of%20Water%20report%20lr
%20pages.pdf
59. Water efficiency policy: A technological high water mark? By
Tommy Kevin Lee, Cecilia Tortajada by 12 February, 2018.
Retrieved online https://www.policyforum.net/water-efficiency-
policy-technological-high-water-mark/
60. Water Outlook 2018 Report. 2018. Revision 24- Updated 17
April 2018, Produced by Department of Water and Sanitation.
City of Cape Town.
http://resource.capetown.gov.za/documentcentre/Documents/Ci
Global perspective on water scarcity
Section - Page | V-37
ty%20research%20reports%20and%20review/Water%20Outloo
k%202018%20-%20Summary.pdf
61. Wegelin, WA, T Godzwana, S Barnard. 2017. Benchmarking of
Water Loss, Water Use Efficiency and Non-Revenue Water in
South African Municipalities (2004/05 to 2015/16). July 2017.
Prepared by Business Intelligence Support Team, Department
of Water and Sanitation. Directorate: Water Services Macro
Planning. Republic of South Africa.
62. WHO - JMP and UNICEF. 2017. Progress on drinking water,
sanitation and hygiene: 2017 update and SDG baselines.
Geneva: World Health Organization (WHO) and the United
Nations Children’s Fund (UNICEF), 2017. Licence: CC BY-NC-
SA 3.0 IGO.
63. World Bank .2017. “Modeling the Water-Energy Nexus: How Do
Water Constraints Affect Energy Planning in South Africa?“
World Bank, Washington, DC.
64. World Bank. 2017. Beyond Scarcity: Water Security in the
Middle East and North Africa. MENA Development Series.
World Bank, Washington, DC. License: Creative Commons
Attribution CC BY 3.0 IGO
65. World Bank. 2018. “Water Scarce Cities: Thriving in a Finite
World.” World Bank, Washington, DC.
66. Wright T. and HE Jacobs. 2016. Potable Water Use of
residential consumers in the Cape Town metropolitan area with
access to groundwater as a supplementary household water
source. Water SA vol. 42, n.1, Pretoria, January 2016.
http://dx.doi.org/10.4314/wsa.v42i1.14 . Retrieved online
http://www.scielo.org.za/scielo.php?script=sci_arttext&pid=S181
6-79502016000100014
67. WWAP (United Nations World Water Assessment Programme) /
UN – Water. 2018. The United Nations World Water
Development Report 2018 : Nature-Based Solutions for Water.
Paris, UNESCO.
68. WWAP (United Nations World Water Assessment Programme).
2016. The United Nations World Water Development Report
2016: Water and Jobs. Paris, UNESCO.
Global perspective on water scarcity
Section - Page | V-38
69. WWAP (United Nations World Water Assessment Programme).
2017. The United Nations World Water Development Report
2017: Wastewater, The Untapped Resource. Paris, UNESCO."
70. WWF – SA (World Wildlife Fund – South Africa) 2016.. “Water:
Facts and Futures. Rethinking South Africa’s Water Future”.
Published by WWF-SA, Cape Town, South Africa
71. WWF-SA (World Wild Life Fund- South Africa). 2016. Water:
Facts & Futures. Published May 2016 by WWF-SA, Cape
Town, South Africa.

More Related Content

What's hot

The adverse impact of ecosystem degradation and poor governance on marginaliz...
The adverse impact of ecosystem degradation and poor governance on marginaliz...The adverse impact of ecosystem degradation and poor governance on marginaliz...
The adverse impact of ecosystem degradation and poor governance on marginaliz...NAAR Journal
 
Population and environment issues
Population and environment issuesPopulation and environment issues
Population and environment issuesUniversity of Dhaka
 
Climate change adaptation opportunities and challenges from two communities i...
Climate change adaptation opportunities and challenges from two communities i...Climate change adaptation opportunities and challenges from two communities i...
Climate change adaptation opportunities and challenges from two communities i...Alexander Decker
 
Global Strategic Outlook by Dr. Mohamed Ait Kadi
Global Strategic Outlook by Dr. Mohamed Ait KadiGlobal Strategic Outlook by Dr. Mohamed Ait Kadi
Global Strategic Outlook by Dr. Mohamed Ait KadiGlobal Water Partnership
 
A shortage of water as a cause of internal and international conflicts in the...
A shortage of water as a cause of internal and international conflicts in the...A shortage of water as a cause of internal and international conflicts in the...
A shortage of water as a cause of internal and international conflicts in the...Fernando Alcoforado
 
Janez Potočnik World Circular Economy Forum 2017 Helsinki Finland
Janez Potočnik World Circular Economy Forum 2017 Helsinki FinlandJanez Potočnik World Circular Economy Forum 2017 Helsinki Finland
Janez Potočnik World Circular Economy Forum 2017 Helsinki FinlandWorld Circular Economy Forum
 
Kitty van der Heijden World Circular Economy Forum 2017 Helsinki Finland
Kitty van der Heijden World Circular Economy Forum 2017 Helsinki FinlandKitty van der Heijden World Circular Economy Forum 2017 Helsinki Finland
Kitty van der Heijden World Circular Economy Forum 2017 Helsinki FinlandWorld Circular Economy Forum
 
Global warming in print July 31 15
Global warming in print July 31 15Global warming in print July 31 15
Global warming in print July 31 15M .B. Goli
 
A Small Island Perspective to Natural Capital:
A Small Island Perspective to Natural Capital:  A Small Island Perspective to Natural Capital:
A Small Island Perspective to Natural Capital: Douglas Deacon
 
The ecological footprint of mediterranean diets
The ecological footprint of mediterranean dietsThe ecological footprint of mediterranean diets
The ecological footprint of mediterranean dietswalled ashwah
 
Ahead of the Curve
Ahead of the CurveAhead of the Curve
Ahead of the CurveAndrew Falk
 
Ecological Footprint as a Sustainability Indicator
Ecological Footprint as a Sustainability IndicatorEcological Footprint as a Sustainability Indicator
Ecological Footprint as a Sustainability IndicatorShahadat Hossain Shakil
 
DEVELOPMENT VS ENVIRONMENT IN GEOGRAPHICAL FRAMEWORK
DEVELOPMENT VS ENVIRONMENT IN GEOGRAPHICAL FRAMEWORKDEVELOPMENT VS ENVIRONMENT IN GEOGRAPHICAL FRAMEWORK
DEVELOPMENT VS ENVIRONMENT IN GEOGRAPHICAL FRAMEWORKProf Ashis Sarkar
 
SECURING WATER SUSTAINING GROWTH.PDF
SECURING WATER SUSTAINING GROWTH.PDFSECURING WATER SUSTAINING GROWTH.PDF
SECURING WATER SUSTAINING GROWTH.PDFFraser MacLeod
 
Ocha opb water 11 nov10 fnl
Ocha opb water  11 nov10 fnlOcha opb water  11 nov10 fnl
Ocha opb water 11 nov10 fnlDr Lendy Spires
 
Popolazione, Sviluppo e Migrazione Project 2013 2014
Popolazione, Sviluppo e Migrazione Project 2013 2014Popolazione, Sviluppo e Migrazione Project 2013 2014
Popolazione, Sviluppo e Migrazione Project 2013 2014Ariana Alva Ferrari
 

What's hot (19)

The adverse impact of ecosystem degradation and poor governance on marginaliz...
The adverse impact of ecosystem degradation and poor governance on marginaliz...The adverse impact of ecosystem degradation and poor governance on marginaliz...
The adverse impact of ecosystem degradation and poor governance on marginaliz...
 
Population and environment issues
Population and environment issuesPopulation and environment issues
Population and environment issues
 
Climate change adaptation opportunities and challenges from two communities i...
Climate change adaptation opportunities and challenges from two communities i...Climate change adaptation opportunities and challenges from two communities i...
Climate change adaptation opportunities and challenges from two communities i...
 
Global Strategic Outlook by Dr. Mohamed Ait Kadi
Global Strategic Outlook by Dr. Mohamed Ait KadiGlobal Strategic Outlook by Dr. Mohamed Ait Kadi
Global Strategic Outlook by Dr. Mohamed Ait Kadi
 
A shortage of water as a cause of internal and international conflicts in the...
A shortage of water as a cause of internal and international conflicts in the...A shortage of water as a cause of internal and international conflicts in the...
A shortage of water as a cause of internal and international conflicts in the...
 
Janez Potočnik World Circular Economy Forum 2017 Helsinki Finland
Janez Potočnik World Circular Economy Forum 2017 Helsinki FinlandJanez Potočnik World Circular Economy Forum 2017 Helsinki Finland
Janez Potočnik World Circular Economy Forum 2017 Helsinki Finland
 
Kitty van der Heijden World Circular Economy Forum 2017 Helsinki Finland
Kitty van der Heijden World Circular Economy Forum 2017 Helsinki FinlandKitty van der Heijden World Circular Economy Forum 2017 Helsinki Finland
Kitty van der Heijden World Circular Economy Forum 2017 Helsinki Finland
 
Global warming in print July 31 15
Global warming in print July 31 15Global warming in print July 31 15
Global warming in print July 31 15
 
A Small Island Perspective to Natural Capital:
A Small Island Perspective to Natural Capital:  A Small Island Perspective to Natural Capital:
A Small Island Perspective to Natural Capital:
 
The ecological footprint of mediterranean diets
The ecological footprint of mediterranean dietsThe ecological footprint of mediterranean diets
The ecological footprint of mediterranean diets
 
Ahead of the Curve
Ahead of the CurveAhead of the Curve
Ahead of the Curve
 
Ecological Footprint as a Sustainability Indicator
Ecological Footprint as a Sustainability IndicatorEcological Footprint as a Sustainability Indicator
Ecological Footprint as a Sustainability Indicator
 
Mason d'croz (dec 2015) igf - agriculture and climate change, potential chall...
Mason d'croz (dec 2015) igf - agriculture and climate change, potential chall...Mason d'croz (dec 2015) igf - agriculture and climate change, potential chall...
Mason d'croz (dec 2015) igf - agriculture and climate change, potential chall...
 
Grogan_Div III (Final)
Grogan_Div III (Final)Grogan_Div III (Final)
Grogan_Div III (Final)
 
DEVELOPMENT VS ENVIRONMENT IN GEOGRAPHICAL FRAMEWORK
DEVELOPMENT VS ENVIRONMENT IN GEOGRAPHICAL FRAMEWORKDEVELOPMENT VS ENVIRONMENT IN GEOGRAPHICAL FRAMEWORK
DEVELOPMENT VS ENVIRONMENT IN GEOGRAPHICAL FRAMEWORK
 
SECURING WATER SUSTAINING GROWTH.PDF
SECURING WATER SUSTAINING GROWTH.PDFSECURING WATER SUSTAINING GROWTH.PDF
SECURING WATER SUSTAINING GROWTH.PDF
 
Ocha opb water 11 nov10 fnl
Ocha opb water  11 nov10 fnlOcha opb water  11 nov10 fnl
Ocha opb water 11 nov10 fnl
 
Unit 8 towards_sustainable_future
Unit 8 towards_sustainable_futureUnit 8 towards_sustainable_future
Unit 8 towards_sustainable_future
 
Popolazione, Sviluppo e Migrazione Project 2013 2014
Popolazione, Sviluppo e Migrazione Project 2013 2014Popolazione, Sviluppo e Migrazione Project 2013 2014
Popolazione, Sviluppo e Migrazione Project 2013 2014
 

Similar to Global Water Scarcity Affects Billions

water and sustainable development
water and sustainable developmentwater and sustainable development
water and sustainable developmentNEERAJ RANI
 
The value of water
The value of waterThe value of water
The value of waterEIP Water
 
Integrated water resourse management
Integrated water resourse managementIntegrated water resourse management
Integrated water resourse managementFatonah Munsai
 
The United Nations World Water Development Report 2015
The United Nations World Water Development Report 2015 The United Nations World Water Development Report 2015
The United Nations World Water Development Report 2015 Sustainable Brands
 
World Water Development Report-2015
 World Water Development Report-2015 World Water Development Report-2015
World Water Development Report-2015WaterCap
 
WORLD WATER DEVELOPMENT REPORT
WORLD WATER DEVELOPMENT REPORTWORLD WATER DEVELOPMENT REPORT
WORLD WATER DEVELOPMENT REPORTWaterCap
 
A Meta Analysis on Review of Studies on Water Management
A Meta Analysis on Review of Studies on Water ManagementA Meta Analysis on Review of Studies on Water Management
A Meta Analysis on Review of Studies on Water Managementijtsrd
 
Increasing Access to Safe Drinking Water - by Summer
Increasing Access to Safe Drinking Water - by SummerIncreasing Access to Safe Drinking Water - by Summer
Increasing Access to Safe Drinking Water - by SummerAmalia Giebitz
 
Rotary day UNESCO 2018 Garantir l’accès de tous à l’eau
Rotary day UNESCO 2018 Garantir l’accès de tous à l’eauRotary day UNESCO 2018 Garantir l’accès de tous à l’eau
Rotary day UNESCO 2018 Garantir l’accès de tous à l’eauRotary ICC Executive Council
 
Sustainable Water (Safe Water and Improved Sanitation): Engaging the Youths
Sustainable Water (Safe Water and Improved Sanitation): Engaging the YouthsSustainable Water (Safe Water and Improved Sanitation): Engaging the Youths
Sustainable Water (Safe Water and Improved Sanitation): Engaging the YouthsCharles Anukwonke
 
Global Stressors on Water Quality and Qu.docx
   Global Stressors     on Water Quality            and Qu.docx   Global Stressors     on Water Quality            and Qu.docx
Global Stressors on Water Quality and Qu.docxjoyjonna282
 
Tamimi - socioeconomic dimension of water policy
Tamimi - socioeconomic dimension of water policyTamimi - socioeconomic dimension of water policy
Tamimi - socioeconomic dimension of water policyWANA forum
 

Similar to Global Water Scarcity Affects Billions (20)

water and sustainable development
water and sustainable developmentwater and sustainable development
water and sustainable development
 
Threats to water security
Threats to water securityThreats to water security
Threats to water security
 
The value of water
The value of waterThe value of water
The value of water
 
Integrated water resourse management
Integrated water resourse managementIntegrated water resourse management
Integrated water resourse management
 
WATER : THE BIGGEST BUSINESS RISK FOR INDIA, INC.
WATER : THE BIGGEST BUSINESS RISK FOR INDIA, INC.WATER : THE BIGGEST BUSINESS RISK FOR INDIA, INC.
WATER : THE BIGGEST BUSINESS RISK FOR INDIA, INC.
 
The United Nations World Water Development Report 2015
The United Nations World Water Development Report 2015 The United Nations World Water Development Report 2015
The United Nations World Water Development Report 2015
 
World Water Development Report-2015
 World Water Development Report-2015 World Water Development Report-2015
World Water Development Report-2015
 
WORLD WATER DEVELOPMENT REPORT
WORLD WATER DEVELOPMENT REPORTWORLD WATER DEVELOPMENT REPORT
WORLD WATER DEVELOPMENT REPORT
 
A Meta Analysis on Review of Studies on Water Management
A Meta Analysis on Review of Studies on Water ManagementA Meta Analysis on Review of Studies on Water Management
A Meta Analysis on Review of Studies on Water Management
 
IJAEBv12n3b.pdf
IJAEBv12n3b.pdfIJAEBv12n3b.pdf
IJAEBv12n3b.pdf
 
Increasing Access to Safe Drinking Water - by Summer
Increasing Access to Safe Drinking Water - by SummerIncreasing Access to Safe Drinking Water - by Summer
Increasing Access to Safe Drinking Water - by Summer
 
Rotary day UNESCO 2018 Garantir l’accès de tous à l’eau
Rotary day UNESCO 2018 Garantir l’accès de tous à l’eauRotary day UNESCO 2018 Garantir l’accès de tous à l’eau
Rotary day UNESCO 2018 Garantir l’accès de tous à l’eau
 
Water Security: Bonus material
Water Security: Bonus materialWater Security: Bonus material
Water Security: Bonus material
 
Amazonia: The Security Agenda (ASA)
Amazonia: The Security Agenda (ASA)Amazonia: The Security Agenda (ASA)
Amazonia: The Security Agenda (ASA)
 
Sustainable Water (Safe Water and Improved Sanitation): Engaging the Youths
Sustainable Water (Safe Water and Improved Sanitation): Engaging the YouthsSustainable Water (Safe Water and Improved Sanitation): Engaging the Youths
Sustainable Water (Safe Water and Improved Sanitation): Engaging the Youths
 
Water security
Water securityWater security
Water security
 
Global Stressors on Water Quality and Qu.docx
   Global Stressors     on Water Quality            and Qu.docx   Global Stressors     on Water Quality            and Qu.docx
Global Stressors on Water Quality and Qu.docx
 
Tamimi - socioeconomic dimension of water policy
Tamimi - socioeconomic dimension of water policyTamimi - socioeconomic dimension of water policy
Tamimi - socioeconomic dimension of water policy
 
2020 01 22 Six basic sectors for Progress
2020 01 22   Six basic sectors for Progress2020 01 22   Six basic sectors for Progress
2020 01 22 Six basic sectors for Progress
 
NutritionCamp. Water management and climate change - Luca Ruini
NutritionCamp. Water management and climate change - Luca RuiniNutritionCamp. Water management and climate change - Luca Ruini
NutritionCamp. Water management and climate change - Luca Ruini
 

More from David Lipschitz

Eskom Retail Tariff Application For 2023 onwards Mind map by David Lipschitz
Eskom Retail Tariff Application For 2023 onwards Mind map by David LipschitzEskom Retail Tariff Application For 2023 onwards Mind map by David Lipschitz
Eskom Retail Tariff Application For 2023 onwards Mind map by David LipschitzDavid Lipschitz
 
Energy Crisis Notes by David Lipschitz 25 July 2022
Energy Crisis Notes by David Lipschitz 25 July 2022Energy Crisis Notes by David Lipschitz 25 July 2022
Energy Crisis Notes by David Lipschitz 25 July 2022David Lipschitz
 
Our really big problems (CRISES) Mind Map By David Lipschitz
Our really big problems (CRISES) Mind Map By David LipschitzOur really big problems (CRISES) Mind Map By David Lipschitz
Our really big problems (CRISES) Mind Map By David LipschitzDavid Lipschitz
 
GIIG Global Startup Awards Africa Mind map by David Lipschitz
GIIG Global Startup Awards Africa Mind map by David LipschitzGIIG Global Startup Awards Africa Mind map by David Lipschitz
GIIG Global Startup Awards Africa Mind map by David LipschitzDavid Lipschitz
 
Textiles Industry Market Entry Strategy Mindmap
Textiles Industry Market Entry Strategy MindmapTextiles Industry Market Entry Strategy Mindmap
Textiles Industry Market Entry Strategy MindmapDavid Lipschitz
 
“CashToCash App” App
“CashToCash App” App“CashToCash App” App
“CashToCash App” AppDavid Lipschitz
 
Our really big problems mind map
Our really big problems mind mapOur really big problems mind map
Our really big problems mind mapDavid Lipschitz
 
ACDP Presentation by David Lipschitz - parliament in Cape Town
ACDP Presentation by David Lipschitz - parliament in Cape TownACDP Presentation by David Lipschitz - parliament in Cape Town
ACDP Presentation by David Lipschitz - parliament in Cape TownDavid Lipschitz
 
Comparative Religious Study By David Lipschitz (c) 2020
Comparative Religious Study By David Lipschitz (c) 2020Comparative Religious Study By David Lipschitz (c) 2020
Comparative Religious Study By David Lipschitz (c) 2020David Lipschitz
 
Centre of Green Learning for Cape Town
Centre of Green Learning for Cape TownCentre of Green Learning for Cape Town
Centre of Green Learning for Cape TownDavid Lipschitz
 
Preparation for a meeting at Eskom Megawatt Park
Preparation for a meeting at Eskom Megawatt ParkPreparation for a meeting at Eskom Megawatt Park
Preparation for a meeting at Eskom Megawatt ParkDavid Lipschitz
 
South Africa SONA 2 2019
South Africa SONA 2 2019South Africa SONA 2 2019
South Africa SONA 2 2019David Lipschitz
 
South Africa SONA 2019 speech 1
South Africa SONA 2019 speech 1South Africa SONA 2019 speech 1
South Africa SONA 2019 speech 1David Lipschitz
 
Let's Build a Power Station
Let's Build a Power StationLet's Build a Power Station
Let's Build a Power StationDavid Lipschitz
 
Trevor Manuel at Christel House School
Trevor Manuel at Christel House SchoolTrevor Manuel at Christel House School
Trevor Manuel at Christel House SchoolDavid Lipschitz
 

More from David Lipschitz (20)

Eskom Retail Tariff Application For 2023 onwards Mind map by David Lipschitz
Eskom Retail Tariff Application For 2023 onwards Mind map by David LipschitzEskom Retail Tariff Application For 2023 onwards Mind map by David Lipschitz
Eskom Retail Tariff Application For 2023 onwards Mind map by David Lipschitz
 
Energy Crisis Notes by David Lipschitz 25 July 2022
Energy Crisis Notes by David Lipschitz 25 July 2022Energy Crisis Notes by David Lipschitz 25 July 2022
Energy Crisis Notes by David Lipschitz 25 July 2022
 
The Eskom War Room 2015
The Eskom War Room 2015The Eskom War Room 2015
The Eskom War Room 2015
 
Our really big problems (CRISES) Mind Map By David Lipschitz
Our really big problems (CRISES) Mind Map By David LipschitzOur really big problems (CRISES) Mind Map By David Lipschitz
Our really big problems (CRISES) Mind Map By David Lipschitz
 
GIIG Global Startup Awards Africa Mind map by David Lipschitz
GIIG Global Startup Awards Africa Mind map by David LipschitzGIIG Global Startup Awards Africa Mind map by David Lipschitz
GIIG Global Startup Awards Africa Mind map by David Lipschitz
 
Textiles Industry Market Entry Strategy Mindmap
Textiles Industry Market Entry Strategy MindmapTextiles Industry Market Entry Strategy Mindmap
Textiles Industry Market Entry Strategy Mindmap
 
“CashToCash App” App
“CashToCash App” App“CashToCash App” App
“CashToCash App” App
 
Our really big problems mind map
Our really big problems mind mapOur really big problems mind map
Our really big problems mind map
 
ACDP Presentation by David Lipschitz - parliament in Cape Town
ACDP Presentation by David Lipschitz - parliament in Cape TownACDP Presentation by David Lipschitz - parliament in Cape Town
ACDP Presentation by David Lipschitz - parliament in Cape Town
 
Textiles ERP System
Textiles ERP SystemTextiles ERP System
Textiles ERP System
 
Re-eh and fracking
Re-eh and frackingRe-eh and fracking
Re-eh and fracking
 
Comparative Religious Study By David Lipschitz (c) 2020
Comparative Religious Study By David Lipschitz (c) 2020Comparative Religious Study By David Lipschitz (c) 2020
Comparative Religious Study By David Lipschitz (c) 2020
 
Centre of Green Learning for Cape Town
Centre of Green Learning for Cape TownCentre of Green Learning for Cape Town
Centre of Green Learning for Cape Town
 
Preparation for a meeting at Eskom Megawatt Park
Preparation for a meeting at Eskom Megawatt ParkPreparation for a meeting at Eskom Megawatt Park
Preparation for a meeting at Eskom Megawatt Park
 
South Africa SONA 2 2019
South Africa SONA 2 2019South Africa SONA 2 2019
South Africa SONA 2 2019
 
South Africa SONA 2019 speech 1
South Africa SONA 2019 speech 1South Africa SONA 2019 speech 1
South Africa SONA 2019 speech 1
 
Citizen Power Station
Citizen Power StationCitizen Power Station
Citizen Power Station
 
Let's Build a Power Station
Let's Build a Power StationLet's Build a Power Station
Let's Build a Power Station
 
Trevor Manuel at Christel House School
Trevor Manuel at Christel House SchoolTrevor Manuel at Christel House School
Trevor Manuel at Christel House School
 
Rise for the Climate
Rise for the ClimateRise for the Climate
Rise for the Climate
 

Recently uploaded

NO1 Famous Kala Jadu specialist Expert in Pakistan kala ilam specialist Exper...
NO1 Famous Kala Jadu specialist Expert in Pakistan kala ilam specialist Exper...NO1 Famous Kala Jadu specialist Expert in Pakistan kala ilam specialist Exper...
NO1 Famous Kala Jadu specialist Expert in Pakistan kala ilam specialist Exper...Amil baba
 
(ZARA) Call Girls Talegaon Dabhade ( 7001035870 ) HI-Fi Pune Escorts Service
(ZARA) Call Girls Talegaon Dabhade ( 7001035870 ) HI-Fi Pune Escorts Service(ZARA) Call Girls Talegaon Dabhade ( 7001035870 ) HI-Fi Pune Escorts Service
(ZARA) Call Girls Talegaon Dabhade ( 7001035870 ) HI-Fi Pune Escorts Serviceranjana rawat
 
Call Girls Service Nagpur Aditi Call 7001035870 Meet With Nagpur Escorts
Call Girls Service Nagpur Aditi Call 7001035870 Meet With Nagpur EscortsCall Girls Service Nagpur Aditi Call 7001035870 Meet With Nagpur Escorts
Call Girls Service Nagpur Aditi Call 7001035870 Meet With Nagpur EscortsCall Girls in Nagpur High Profile
 
Low Rate Call Girls Bikaner Anika 8250192130 Independent Escort Service Bikaner
Low Rate Call Girls Bikaner Anika 8250192130 Independent Escort Service BikanerLow Rate Call Girls Bikaner Anika 8250192130 Independent Escort Service Bikaner
Low Rate Call Girls Bikaner Anika 8250192130 Independent Escort Service BikanerSuhani Kapoor
 
VIP Call Girls Ramanthapur ( Hyderabad ) Phone 8250192130 | ₹5k To 25k With R...
VIP Call Girls Ramanthapur ( Hyderabad ) Phone 8250192130 | ₹5k To 25k With R...VIP Call Girls Ramanthapur ( Hyderabad ) Phone 8250192130 | ₹5k To 25k With R...
VIP Call Girls Ramanthapur ( Hyderabad ) Phone 8250192130 | ₹5k To 25k With R...Suhani Kapoor
 
Call Girl Nagpur Roshni Call 7001035870 Meet With Nagpur Escorts
Call Girl Nagpur Roshni Call 7001035870 Meet With Nagpur EscortsCall Girl Nagpur Roshni Call 7001035870 Meet With Nagpur Escorts
Call Girl Nagpur Roshni Call 7001035870 Meet With Nagpur EscortsCall Girls in Nagpur High Profile
 
Call Girls South Delhi Delhi reach out to us at ☎ 9711199012
Call Girls South Delhi Delhi reach out to us at ☎ 9711199012Call Girls South Delhi Delhi reach out to us at ☎ 9711199012
Call Girls South Delhi Delhi reach out to us at ☎ 9711199012sapnasaifi408
 
Russian Call Girls Nashik Anjali 7001305949 Independent Escort Service Nashik
Russian Call Girls Nashik Anjali 7001305949 Independent Escort Service NashikRussian Call Girls Nashik Anjali 7001305949 Independent Escort Service Nashik
Russian Call Girls Nashik Anjali 7001305949 Independent Escort Service Nashikranjana rawat
 
VIP Call Girls Service Tolichowki Hyderabad Call +91-8250192130
VIP Call Girls Service Tolichowki Hyderabad Call +91-8250192130VIP Call Girls Service Tolichowki Hyderabad Call +91-8250192130
VIP Call Girls Service Tolichowki Hyderabad Call +91-8250192130Suhani Kapoor
 
(AISHA) Wagholi Call Girls Just Call 7001035870 [ Cash on Delivery ] Pune Esc...
(AISHA) Wagholi Call Girls Just Call 7001035870 [ Cash on Delivery ] Pune Esc...(AISHA) Wagholi Call Girls Just Call 7001035870 [ Cash on Delivery ] Pune Esc...
(AISHA) Wagholi Call Girls Just Call 7001035870 [ Cash on Delivery ] Pune Esc...ranjana rawat
 
VIP Call Girls Service Chaitanyapuri Hyderabad Call +91-8250192130
VIP Call Girls Service Chaitanyapuri Hyderabad Call +91-8250192130VIP Call Girls Service Chaitanyapuri Hyderabad Call +91-8250192130
VIP Call Girls Service Chaitanyapuri Hyderabad Call +91-8250192130Suhani Kapoor
 
Mumbai Call Girls, 💞 Prity 9892124323, Navi Mumbai Call girls
Mumbai Call Girls, 💞  Prity 9892124323, Navi Mumbai Call girlsMumbai Call Girls, 💞  Prity 9892124323, Navi Mumbai Call girls
Mumbai Call Girls, 💞 Prity 9892124323, Navi Mumbai Call girlsPooja Nehwal
 
(PARI) Viman Nagar Call Girls Just Call 7001035870 [ Cash on Delivery ] Pune ...
(PARI) Viman Nagar Call Girls Just Call 7001035870 [ Cash on Delivery ] Pune ...(PARI) Viman Nagar Call Girls Just Call 7001035870 [ Cash on Delivery ] Pune ...
(PARI) Viman Nagar Call Girls Just Call 7001035870 [ Cash on Delivery ] Pune ...ranjana rawat
 
VIP Call Girls Service Bandlaguda Hyderabad Call +91-8250192130
VIP Call Girls Service Bandlaguda Hyderabad Call +91-8250192130VIP Call Girls Service Bandlaguda Hyderabad Call +91-8250192130
VIP Call Girls Service Bandlaguda Hyderabad Call +91-8250192130Suhani Kapoor
 

Recently uploaded (20)

Call Girls In Dhaula Kuan꧁❤ 🔝 9953056974🔝❤꧂ Escort ServiCe
Call Girls In Dhaula Kuan꧁❤ 🔝 9953056974🔝❤꧂ Escort ServiCeCall Girls In Dhaula Kuan꧁❤ 🔝 9953056974🔝❤꧂ Escort ServiCe
Call Girls In Dhaula Kuan꧁❤ 🔝 9953056974🔝❤꧂ Escort ServiCe
 
NO1 Famous Kala Jadu specialist Expert in Pakistan kala ilam specialist Exper...
NO1 Famous Kala Jadu specialist Expert in Pakistan kala ilam specialist Exper...NO1 Famous Kala Jadu specialist Expert in Pakistan kala ilam specialist Exper...
NO1 Famous Kala Jadu specialist Expert in Pakistan kala ilam specialist Exper...
 
Model Call Girl in Rajiv Chowk Delhi reach out to us at 🔝9953056974🔝
Model Call Girl in Rajiv Chowk Delhi reach out to us at 🔝9953056974🔝Model Call Girl in Rajiv Chowk Delhi reach out to us at 🔝9953056974🔝
Model Call Girl in Rajiv Chowk Delhi reach out to us at 🔝9953056974🔝
 
(ZARA) Call Girls Talegaon Dabhade ( 7001035870 ) HI-Fi Pune Escorts Service
(ZARA) Call Girls Talegaon Dabhade ( 7001035870 ) HI-Fi Pune Escorts Service(ZARA) Call Girls Talegaon Dabhade ( 7001035870 ) HI-Fi Pune Escorts Service
(ZARA) Call Girls Talegaon Dabhade ( 7001035870 ) HI-Fi Pune Escorts Service
 
Call Girls Service Nagpur Aditi Call 7001035870 Meet With Nagpur Escorts
Call Girls Service Nagpur Aditi Call 7001035870 Meet With Nagpur EscortsCall Girls Service Nagpur Aditi Call 7001035870 Meet With Nagpur Escorts
Call Girls Service Nagpur Aditi Call 7001035870 Meet With Nagpur Escorts
 
Low Rate Call Girls Bikaner Anika 8250192130 Independent Escort Service Bikaner
Low Rate Call Girls Bikaner Anika 8250192130 Independent Escort Service BikanerLow Rate Call Girls Bikaner Anika 8250192130 Independent Escort Service Bikaner
Low Rate Call Girls Bikaner Anika 8250192130 Independent Escort Service Bikaner
 
VIP Call Girls Ramanthapur ( Hyderabad ) Phone 8250192130 | ₹5k To 25k With R...
VIP Call Girls Ramanthapur ( Hyderabad ) Phone 8250192130 | ₹5k To 25k With R...VIP Call Girls Ramanthapur ( Hyderabad ) Phone 8250192130 | ₹5k To 25k With R...
VIP Call Girls Ramanthapur ( Hyderabad ) Phone 8250192130 | ₹5k To 25k With R...
 
Call Girl Nagpur Roshni Call 7001035870 Meet With Nagpur Escorts
Call Girl Nagpur Roshni Call 7001035870 Meet With Nagpur EscortsCall Girl Nagpur Roshni Call 7001035870 Meet With Nagpur Escorts
Call Girl Nagpur Roshni Call 7001035870 Meet With Nagpur Escorts
 
Call Girls South Delhi Delhi reach out to us at ☎ 9711199012
Call Girls South Delhi Delhi reach out to us at ☎ 9711199012Call Girls South Delhi Delhi reach out to us at ☎ 9711199012
Call Girls South Delhi Delhi reach out to us at ☎ 9711199012
 
Russian Call Girls Nashik Anjali 7001305949 Independent Escort Service Nashik
Russian Call Girls Nashik Anjali 7001305949 Independent Escort Service NashikRussian Call Girls Nashik Anjali 7001305949 Independent Escort Service Nashik
Russian Call Girls Nashik Anjali 7001305949 Independent Escort Service Nashik
 
VIP Call Girls Service Tolichowki Hyderabad Call +91-8250192130
VIP Call Girls Service Tolichowki Hyderabad Call +91-8250192130VIP Call Girls Service Tolichowki Hyderabad Call +91-8250192130
VIP Call Girls Service Tolichowki Hyderabad Call +91-8250192130
 
Green Banking
Green Banking Green Banking
Green Banking
 
(AISHA) Wagholi Call Girls Just Call 7001035870 [ Cash on Delivery ] Pune Esc...
(AISHA) Wagholi Call Girls Just Call 7001035870 [ Cash on Delivery ] Pune Esc...(AISHA) Wagholi Call Girls Just Call 7001035870 [ Cash on Delivery ] Pune Esc...
(AISHA) Wagholi Call Girls Just Call 7001035870 [ Cash on Delivery ] Pune Esc...
 
VIP Call Girls Service Chaitanyapuri Hyderabad Call +91-8250192130
VIP Call Girls Service Chaitanyapuri Hyderabad Call +91-8250192130VIP Call Girls Service Chaitanyapuri Hyderabad Call +91-8250192130
VIP Call Girls Service Chaitanyapuri Hyderabad Call +91-8250192130
 
9953056974 ,Low Rate Call Girls In Adarsh Nagar Delhi 24hrs Available
9953056974 ,Low Rate Call Girls In Adarsh Nagar  Delhi 24hrs Available9953056974 ,Low Rate Call Girls In Adarsh Nagar  Delhi 24hrs Available
9953056974 ,Low Rate Call Girls In Adarsh Nagar Delhi 24hrs Available
 
Mumbai Call Girls, 💞 Prity 9892124323, Navi Mumbai Call girls
Mumbai Call Girls, 💞  Prity 9892124323, Navi Mumbai Call girlsMumbai Call Girls, 💞  Prity 9892124323, Navi Mumbai Call girls
Mumbai Call Girls, 💞 Prity 9892124323, Navi Mumbai Call girls
 
FULL ENJOY Call Girls In kashmiri gate (Delhi) Call Us 9953056974
FULL ENJOY Call Girls In  kashmiri gate (Delhi) Call Us 9953056974FULL ENJOY Call Girls In  kashmiri gate (Delhi) Call Us 9953056974
FULL ENJOY Call Girls In kashmiri gate (Delhi) Call Us 9953056974
 
(PARI) Viman Nagar Call Girls Just Call 7001035870 [ Cash on Delivery ] Pune ...
(PARI) Viman Nagar Call Girls Just Call 7001035870 [ Cash on Delivery ] Pune ...(PARI) Viman Nagar Call Girls Just Call 7001035870 [ Cash on Delivery ] Pune ...
(PARI) Viman Nagar Call Girls Just Call 7001035870 [ Cash on Delivery ] Pune ...
 
VIP Call Girls Service Bandlaguda Hyderabad Call +91-8250192130
VIP Call Girls Service Bandlaguda Hyderabad Call +91-8250192130VIP Call Girls Service Bandlaguda Hyderabad Call +91-8250192130
VIP Call Girls Service Bandlaguda Hyderabad Call +91-8250192130
 
young Whatsapp Call Girls in Delhi Cantt🔝 9953056974 🔝 escort service
young Whatsapp Call Girls in Delhi Cantt🔝 9953056974 🔝 escort serviceyoung Whatsapp Call Girls in Delhi Cantt🔝 9953056974 🔝 escort service
young Whatsapp Call Girls in Delhi Cantt🔝 9953056974 🔝 escort service
 

Global Water Scarcity Affects Billions

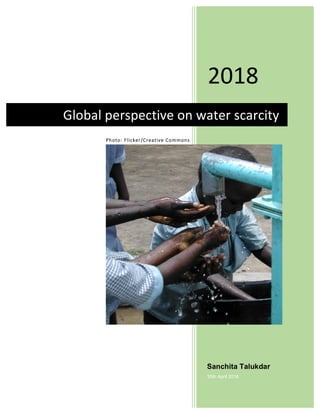
  • 1. Photo: Flicker/Creative Commons 2018 Sanchita Talukdar 30th April 2018 Global perspective on water scarcity
  • 2. Global perspective on water scarcity Section - Page | 1 Acknowledgement This report was funded by David Lipschitz. Contact: david@mypowerstation.biz (c) David Lipschitz and Sanchita Talukdar, 2018.
  • 3. Table of Content Part I. Water a Vital Resource ............................................................... I-3 Section 1.01 Water Stress and Water Access: Health Implications..... I-7 (a) Water Stress ............................................................................... I-8 (b) Water Access............................................................................ I-10 Part II. Water Scarcity and Crimes ...................................................... II-14 Part III. Water Governance in South Africa ......................................... III-18 Section 3.01 Undiversified water supply .......................................... III-19 Section 3.02 Unsustainable water demand and management......... III-22 Section 3.03 Water security: Best Practice...................................... III-24 Part IV. The Way Forward................................................................IV-27 Part V. Reference ................................................................................V-30
  • 4. Global perspective on water scarcity Section - Page | I-3 Part I. Water a Vital Resource Water resources provide vital ecosystem services - provisioning, regulating, cultural and support (Millennium Development goals report, 2011) functions that are essential drivers for sustainable economic development (WWAP, 2016) impacting critical health, hygiene and life sustaining parameters that derive human wellbeing. It is “critical to the resilience of landscapes and communities” (Rockstrom J., et al 2014) which “depend on freshwater, both in terms of ‘green’ evapotranspiration water for plant growth and ‘blue’ environmental water flows to sustain ecological habitats” (Rockstrom, J. et al. 2014). Figure 1: Human well being as a driver and receptor of ecosystem services. Source: Rockstrom et al 2014 Figure 1 illustrates the “interconnectedness between social drivers and processes in the landscape, where water – “blue” as well as “green” – interacts with ecosystems in producing goods and services to secure human wellbeing. Sustaining this social-ecological system demands a set of social Key Milestone agreements on water: 2010: In 2010, the United Nations General Assembly acknowledged under its resolution (A/RES/64/292) “the importance of equitable access to safe and clean drinking water and sanitation as an integral component of the realization of all human rights”(United Nations 2010) 2015: The 2030 Agenda for Sustainable Development adopted by the member states of the United Nations, on September 2015, aligns a time bound meeting of Goal 6 – “Ensure availability and sustainable management of water and sanitation for all”, in order to achieve affordable universal drinking water, sanitation and hygiene targets. The sub goals under Goal 6, address significant issues emanating in the freshwater cycle. March 22, 2018: The UN General Assembly proclaims the period from 2018 to 2028 the International Decade for Action, “Water for Sustainable Development” (the “Decade”), to further improve cooperation, partnership and capacity development in response to the ambitious 2030 Agenda. The Decade builds on the achievements of the previous “Water for Life” Decade, 2005-2015.
  • 5. Global perspective on water scarcity Section - Page | I-4 transformations: water governance, global cooperation and water management” (Rockstrom J., et al. 2014). The salience of accessible and sufficient water resources for nations and communities under any stage of development, lies in its ability to enable the freedoms to choose from “possible livings” (Sen, A.K. 2002), which is a vector of capabilities to achieve opportunities and a way of life that conform to the economic, social, aesthetic, cultural and ecological ambitions of a community or a country. Access to safe and sufficient drinking water at an affordable cost in order to meet basic needs, which includes sanitation and hygiene (cf. United Nations General Assembly, 2010), and the safeguarding of health and well-being (UNU, 2013) remains the central pillar for all discourses on water security as “the overarching goal of water management” (GWP, 2000; Hoekstra, A et al. 2018). For the marginal, mostly rural, communities in South Asia, Sub Saharan Africa, Latin America and parts of South East Asia, “who primarily rely on rain-fed agricultural practices, access to safe and reliable water resource such as ponds, streams, rivers and lakes, and sustainably managed water resources directly translates into providing food security, livelihood protection, expanding local economies, thus improving living standards and influencing greater social inclusion” (WWAP, 2016). Water is linked to food security as it sustains agricultural food production and stabilizes food prices for domestic consumption as well as in international food markets for key agricultural produce (DeSouza A. and Warren H., 2018) such as rice, wheat, maize/corn, coffee and fruits. The State of Food Security and Nutrition Report 2017, provides crucial insights into the impact of climate related disasters on food security. The report observes that prolonged droughts and floods in rural economies of Asia, Africa and south-eastern Asia has led to a hike in food prices, loss of agricultural production, “drop in food availability causing food insecurity thus setting in motion a vicious circle of violent conflict and civil insecurity” (FAO et al, 2017 ; The Global Risk Report 2017, 2018)). Sustainable urban water services in identified water scarce nations in South Asia, MENA, the Sahel, Southern Africa, Central Asia and parts of Latin America (Water Scarce Cities Initiative, The World Bank) therefore, “contribute to inclusive growth and political stability in fragile contexts. Water
  • 6. Global perspective on water scarcity Section - Page | I-5 services in these regions are part of a social contract, failing which could destabilize large urban centers (World Bank, 2018) inciting collapse of social order and political regimes. Water is a prime ingredient to heat, cool and is used as a basic element for all industrial activities (PwC, 2011). Under unregulated environmental policy scenarios, water acts as a direct medium for absorbing all kinds of industrial and municipal wastes. An estimated 80 per cent of waste is released worldwide without any treatment (WWAP, 2017) triggering water scarcity (Tortajada et al , 2018) in even water-abundant regions of the world. Waste water pollution is recognized as a critical driver of water scarcity in almost all regions of the world (WWAP,2017). This has initiated industrial and technological innovations catalyzing circular economy scenarios (Fischedick M. et. al. 2014, Global Risks 2014) where industrial waste water of one industry enters into the production cycles of another industry as a resource, thus ensuring optimum water efficiency. In the last three consecutive annual reports of the World Economic Forum (WEF) water crisis has been ranked as one of the top three risks, as an outcome of “failure of climate change and mitigation strategies”. (The Global Risk Report,2017). This has led to forced internal migrations of populations due to land desertification in Sub Saharan Africa, droughts in East and Southern Africa, frequent flooding in India, Pakistan, China and Bangladesh in South Asia, Thailand, Philippines in South East Asia. Within countries, an estimated 143 million people in 2017, were internally displaced due to climate related disasters (Kumari R. et al, 2018) with the largest internal migration in Sub Saharan Africa (86 million), followed by South Asia (40 million) and Latin America (7 million). Mekonen and Hoekstra (2016) estimate four billion people in the planet live under conditions of severe water scarcity on a monthly basis (including India (1.0 billion) and China (0.9 billion)) and another half a billion, face water scarcity for all the year round (Hoekstra & Mekonen, 2016) and this population could increase to some 4.8–5.7 billion by 2050 (WWDR, 2018). Water crises engulf countries, broadly, 10 to 40 degrees north from Mexico to China, western South America and Southern Africa in the Southern Hemisphere (Veldkamp, et al. 2017, WWAP, 2018). Water scarcity is a function of mismanaged water resources leading to overconsumption and
  • 7. Global perspective on water scarcity Section - Page | I-6 wastage, lack of preparedness to climate related weather uncertainty in agrarian and urban contexts and relying on undiversified water supply sources. Examples include, the case of Cape Town in South Africa, reeling under extreme drought for the last three years relies on rain-fed reservoirs as the only means of urban water supply which has shrunk drastically inviting “Day Zero” and acute water rationing. A similar trend in shrinking reservoirs impacting surface water availability and electricity production, could be observed for the Al-Massira Dam in Morocco, Indira Sagar Dam in India, Mosul Dam in Iraq and Spain’s Buendia Dam (Iceland C. et al., 2018). Global demand for agricultural and energy production (mainly food and electricity), both of which are water-intensive, is expected to increase by roughly 60% and 80% respectively by 2025 (Alexandratos and Bruinsma, 2012; OECD, 2012; WWAP, 2018), however, industrial and domestic demand for water will likely to grow much faster than agricultural demand. This is mainly due to rising population and rapid urbanization with a push towards greater industrialization and municipal water needs. The urgency to mitigate water related risks causing freshwater scarcity has been “at the heart of international milestone agreements such as the 2030 Agenda for Sustainable Development, the Sendai Framework for Disaster Risk Reduction 2015-2030, and the 2015 Paris Agreement.”(UN, 2018). In the recently summoned launch of International decade for water -2018- 2020, on March 22, World Water Day, the international community recognized the global dimensions of the severity of water crisis with an immediate call for concerted action and governance. While countries and regions vary based on their agrarian status and income levels, population size and economic activity, there is a common concern around the globe for water related issues driven by uncertainties in weather related precipitation levels affecting rainfall, declining reservoir capacity, diminishing rivers and disasters such as floods and droughts. This report delineates the pressures of water scarcity on countries during the onset of prolonged drought /frequent floods with the objective of highlighting best practices, scalable interventions that integrate uncertainties and risk into the water governance architecture.
  • 8. Global perspective on water scarcity Section - Page | I-7 Table 1 : Extremely high water stressed countries in the world Rank Name 1 Antigua and Barbuda 1 Bahrain 1 Barbados 1 Comoros 1 Cyprus 1 Dominica 1 Jamaica 1 Malta 1 Qatar 1 Saint Lucia 1 Saint Vincent and the Grenadines 1 San Marino 1 Singapore 1 Trinidad and Tobago 1 United Arab Emirates 1 Western Sahara 17 Saudi Arabia 18 Kuwait 19 Oman 20 Libya It is divided into three parts. The first part begins with understanding the concept of water scarcity in the context of water stress and water access. The impact of water scarcity and drought conditions on human health, including WaSH (Water and Sanitation) mortality occurrence due to poor water availability and unmet Sustainable Development Goals is then assessed. The second part documents water related crimes defined by conflicts arising out of inadequate water availability. The vicious cycle of corruption-water theft- water scarcity has been illustrated. The third part is a review of best practices on urban water governance relevant to water scarcity issue around the globe. Section 1.01 Water Stress and Water Access: Health Implications Freshwater scarcity is commonly described as a function of available water resources and human population (Matlock, et al, 2011, Brown et al. 2011). It may mean physical scarcity of water due to uneven distribution across geographical realms and as a direct outcome of climate change disasters such as floods and droughts. For example, out of an estimated 43,750 cubic kilometers of fresh water resources per year at the continent level, America constitutes the largest share (45%), followed by Asia with 28%, Europe with 16% and Africa with 9%. (Mancosu et al, 2015). Concepts and Definitions: Baseline water stress measures total annual water withdrawals (municipal, industrial, and agricultural) expressed as a percentage of the total annual available blue water. Higher values indicate more competition among users.( Gassert, F., P. Reig, T. Luo, and A. Maddocks. 2013) Fresh water scarcity can mean scarcity in availability due to physical shortage, or scarcity in access due to the failure of institutions to ensure a regular supply or due to a lack of adequate infrastructure. (UNU, 2018). Access to safe water “is measured by the proportion of population with access to an adequate amount of safe drinking water located within a minimum distance located within a convenient distance from the user’s dwelling”(http://www.un.org /esa/population/pubsarchiv e/chart/12.pdf )
  • 9. Global perspective on water scarcity Section - Page | I-8 (a) Water Stress The World Resources Institute’s Aqueduct project in 2013 found 36 countries face “extremely high” levels of baseline water stress- with more than 80 per cent of its available water used for agricultural, domestic and municipal needs (WRI, 2014). Table 1 lists the 20 most water stressed countries from that list. Figure 3: WRI-Aqueduct The ranking, then excluded South Africa among the 36 most water stressed countries. Nevertheless, as could be clearly noted from Figure 3 below, the Aqueduct project indicated South Africa’s high overall water risk situation, meaning, it is susceptible to acute water stress leading to scarcity if water demand and supply is not managed effectively. Figure 4: WRI-Aqueduct
  • 10. Global perspective on water scarcity Section - Page | I-9 A high baseline water stress was also recorded for City of Cape Town (CCT) situated in the Western Cape Region of South Africa. “When drought strikes where baseline water stress is high, it exacerbates the regions’ water woes” (Maddocks A., 2014). The negative impacts of the drought in the City of Cape Town in South Africa are magnified due to its heavy reliance on a single water source- surface water from dams and reservoirs for consumption. Water supply was affected by a record low precipitation and high evaporation rate. Figure 4 highlights the extremely high levels of baseline water stress in CCT due to the ongoing drought. However, it should be noted that water stress does not always mean countries actually facing water scarcity if best practices in water governance accounts for water stress early on. Singapore, for example, has the highest water stress ranking (5.0) (WRI, 2014). Despite a near absence of freshwater lakes or aquifers and demand for water exceeding the supply; the country has emerged as a global leader in water governance. A mix of heavy investments in innovation , research and design of water technologies for monitoring of water quality , water usage, reuse of reclaimed water and desalination projects as well as state of the art drainage infrastructure to channelize storm water and rainfall captured in one-third of its catchment area, to its man-made reservoirs. Singapore focused on water demand management strategies to deal with rising water demand by , utilizing insights such as reporting households’ comparative water usage in the water bill to modify high water consumption behavior, devising of progressive water tax for profligate water users and providing targeted subsidies for the poor households. The country is a classic case of good water governance which has enabled resilience thinking and innovative technologies as key to managing water security for its nation.
  • 11. Global perspective on water scarcity Section - Page | I-10 (b) Water Access There are 844 million people globally who lack basic drinking water services (Water Aid, 2018, WHO-UNICEF, 2017). “Diseases due to poor drinking- water access, unimproved sanitation, and poor hygiene practices cause 4.0% of all deaths and 5.7% of all disability or ill health in the world.” (WHO 2018). Contaminated drinking water is estimated to cause more than 500 000 diarrheal deaths each year (WHO, 2018). Access to water in the proximity of households is critical for practicing hygiene (Howard and Bartram, 2003), tackling malnutrition and infectious disease 1 (Cairncross et al, 1987) and meeting hygiene-related health outcomes. Pickering A. J. and Davis J (2012) in a cross-sectional study of children in Subsaharan Africa, observed that a five-minute decrease in the time to a water source was associated with a 14% fall in diarrhea risk and a higher bodyweight score in children under five. “A fifteen-minute decrease in collection time was associated with a 41% decrease in diarrhea risk for the same age group. The authors noted that this level of reduction in diarrheal disease morbidity is on par with reductions associated with sanitation, hand washing, and water disinfection interventions” [Pickering and Davis, 2012, cited by Graham J. et al. 2016]. In a study on water collection labor among women and children for 24 Subsaharan African (SSA) countries, it was found that adult females (68%) among households spending over 30 minutes to collect water in all 24 SSA countries, were the primary collectors while among households in countries (Ethiopia, Burundi, Nigeria, Niger, Cameroon) with children collecting water, female children were preferred over their male counterparts (Graham J.P., et al, 2016). This has serious health implications due to unmet sanitation and hygiene standards. A higher water collection time is increasingly associated with increased risk of moderate to severe diarrhea among children (Nygren BL et. al, 2016). 1 “Cairncross et al. (1987) highlighted that villagers in a study community without a close water supply stated that they often “cooked little, and only once a day, because of the lack of water”. In the same study, the researchers found that the community with better water access had a prevalence of trachoma of 19% versus 38% in the community without ready access to water.” [Cairncross et al, 1987 cited by Graham J. P. et al., 2016)
  • 12. Global perspective on water scarcity Section - Page | I-11 Mortality rates due to unsafe water, sanitation and hygiene services in countries in Africa in 2012 is triple to that of the global average. (http://www.who.int/gho/phe/water_sanitation/burden/en/index3.html). Health costs associated with waterborne diseases such as malaria, diarrhea, and worm infections represent more than one third of the income of poor households in sub-Saharan Africa (WHO, 2018). Unmet health and hygiene goals are one of the many outcomes on account of poor water access. The Water Gap – The State of the World’s Water 2018 report, recognizes the critical role that water plays in reducing socio- economic and gender inequalities within communities. Inadequate water comprises with the safety and security (fear of snake bites, wild animals, injuries of women and children collecting water from far off distances, violates dignity of women, inequality in education opportunities increasing inequalities and exploitation of women (e.g. child marriages for girls). Table 4 has been compiled from the Global Burden of Disease Study (GBD), 2016, which monitored progress on the health-related Sustainable Development Goals (SDGs) in 188 countries from 1990 to 2016. Countries with poor water access are chosen from the State of the Water Report 2018 by Water Aid and South Africa has been added in the table as our country of interest. Columns 2, 3 and 4 are progress scores measured on a scale of 0- 100, attained by the countries between 1990-2016 for indicators – WaSH (mortality attributable to unsafe water and sanitation), population with access to safe and improved water sources and population with access to safe and improved sanitation, respectively. A lower score ranging between 0-50 indicates poor progress on meeting SDG targets for WaSH, Water and Sanitation indicators.
  • 13. Global perspective on water scarcity Section - Page | I-12 Table 4: Progress in health-related SDG for countries with poor water access Notes: Individual indicators: WaSH mortality; Water; Sanitation are reported on a scale of 0 to 100, with 0 representing the worst levels from 1990-2030 and 100 reflecting the best during that time. [GBD 2016, SDG collaborators, Lancet 2018, page 1434-1437); Projections until 2030 are calculated based on SDG [Sustainable Development Goals] and MDG (Millennium Development Goals) progress for each country from 1990-2016; Definitions: WaSh mortality: mortality attributable to unsafe water, sanitation, and hygiene; Water: risk-weighted prevalence of populations using unsafe or unimproved water sources, as measured by the SEV for unsafe water, %; Sanitation: Risk-weighted prevalence of populations using unsafe or unimproved sanitation, as measured by the SEV for unsafe sanitation, % Source: Adapted from Global Health Metrics: Figure 1: Performance on the health-related SDG index, MDG index and non-MDG index, and 37 Individual health-related indicators, by country, 2016 (GBD 2016 SDG Collaborators, Lancet 2017, page 1434-1437); Column 5 is the Global health ranking based on these progress scores as well as 37 other individual health-related indicators of the tabulated countries as compared to the 188 countries (GBD 2016, SDG collaborators, Lancet 2018), as included in the GBD study. Countries with poor scores indicated by columns 2,3,4 end up at the bottom of the list of 188 countries.
  • 14. Global perspective on water scarcity Section - Page | I-13 From table 4, Somalia, Uganda, Chad, DRC (Democratic Republic of Congo) are at the bottom end of the rankings. South Africa ranks 122nd (out of 188 countries) in the Global Health Index, and on a scale of 0-100, scores 25 points for WaSH , 58 for Water and 60 for Sanitation. The country has shown medium progress between 1990- 2016 in meeting overall health related SDG targets, however, the current uncertainty due to droughts, if not managed effectively, could seriously undermine its potential to meet its water-related SDG goals with deleterious health consequences. Water crises—from chronic water scarcity to lack of access to adequate water supply and sanitation to hydrological extremes—can aggravate challenges related to fragility and conflict (Sadoff et al, 2014, Tortajada et. al. 2015, 2017). Water security goes beyond water scarcity to take account not only of a country’s water resource endowment, but also of the productive and protective actions the country has taken to secure its water (Beyond Scarcity, World Bank 2018).
  • 15. Global perspective on water scarcity Section - Page | II-14 Part II. Water Scarcity and Crimes Water crimes, could be defined, as any punishable contravention or violation of the limits on human behavior, as imposed by national criminal legislation, against surface water and groundwater, or against water services. (EU, Water crimes project). A first of it kind project to document water crimes inventory in the European Union, included 86 water-related crimes (EU, Water Crimes Inventory, Oct 2017), suggesting countermeasures and mitigation policies for countries such as Hungary, Italy, Slovenia, Spain, and other EU countries. According to the EU- Water Crimes Inventory report, water pollution and water theft constituted 86 per cent of all water related crime cases in Europe. Crimes related to surface water were reported for 36 per cent of the cases, whereas 33 per cent were related to water services and 12 percent cases were pertaining to groundwater in Europe. Further, in “47 percent of the cases, the water was intended for human consumption; in 7 per cent it was intended for industrial use and in 6 per cent of cases, water was intended for agricultural purposes.” [ EU, Water Crimes Inventory, Oct 2017]. In Europe, water corruption posed the highest risk in these countries making it vulnerable to organized crime groups who often monopolize and control water supply [Interpol, 2016] and pollute water ways. This is mainly due to unclear legislation, water scarcity, poverty and waste production. With climate uncertainty, waste and water scarcity issues are on the rise and so are the chances of water corruption expected to rise in the next five years, according to the report. Gleick (1989) identifies critical concerns due to climatic related risks influencing water tensions with changes in: (1) water availability from altered precipitation patterns or evaporative losses due to higher temperatures, (2) the seasonality of precipitation and runoff, (3) flooding or drought frequencies, and (4) the demand for and the supply of irrigation water for agriculture. Fragility and climate change the water stressed areas of North
  • 16. Global perspective on water scarcity Section - Page | II-15 Africa and Middle East (World Bank, 2018) sets in a vicious cycle of further violence and scarcity [Sadoff, et al, 2017]. Climatic concerns of water scarcity and impact of prolonged famines resulting in desertification disrupts livelihoods of rural communities such as fisheries and agriculture causing food riots, violent conflicts and massive internal migration. Examples include Central African Republic, Bangalala midlands (in Tanzania) Chad, Niger, Mozambique, Uganda, Morocco, Sudan and Eriteria [UNCCD, 2014]. Droughts have led to migration, conflict or cessation in the past, in countries such as India, Bangladesh, Mauritania, Senegal, Morocco and Eritrea [UNCCD 2014]. Shared water resources or transboundary water resources are often a fertile ground for water-related tensions (IPCC 2001, 950). The situation gets out of government control in conflict-ridden and arid regions, resulting in social disruptions, migration and losses of life and livelihoods [Sadoff et al 2017). Thirty-four of the 37 countries affected by desertification and land degradation triggered due to prolonged droughts are presumed to be at risk of war due to absence of trans-boundary water resources cooperation [UNCCD, 2014]. Although regional cooperation exists, such as agreements between Egypt, Ethiopia and Sudan regarding the equitable exploitation of Nile water, the rising issue of water theft has been left to national governments to form individual responses ( http://globalinitiative.net/water- smuggling/ ). In 2016, river use disputes between the Indian states of Karnataka and Tamil Nadu resulted in rioting in rioting in Karnataka’s capital city of Bangalore (Reuters, 2016, quoted in Sadoff et al. 2017). In 2013, “a study by the Water Research Commission estimated losses incurred every month due to water theft and under maintenance of water infrastructure such as leaky pipes in water scarce countries like South Africa, to the tune of 1.58 billion kiloliters a year, equivalent of 4.3 million swimming pools or to fill about a third of the capacity of the Gariep Dam, the largest in South Africa” (Savides, M, 2013). El-Nino droughts in Syria and famines in Ethiopia fuels deadly food and water riots causing large scale devastation of water and sanitation infrastructure eroding the “social compact” [Sadoff et al, 2017] between governments and citizens destabilizing peace and security in the nations.
  • 17. Global perspective on water scarcity Section - Page | II-16 Children are the most affected with high WaSh (Water and Sanitation) mortality rates impacted by outbreaks of water borne diseases in water scarce areas, e.g. “cholera outbreak in Yemen in 2016” (Global Burden of Disease 2016), diarrheal deaths in Nigeria, Somalia and South Sudan in Africa (https://phys.org/news/2017-03-children-shortages-unicef.html). In Ethiopia, recurring droughts result in famine, food shortages, and water- related diseases, as people are forced to rely heavily on contaminated and stagnant water( https://water.org/our-impact/ethiopia/ ). A significant rise in water crimes in the last decade is due to the enlarged water footprints of the urban consumer, lax environmental legislation perpetuating water pollution causing scarcity of freshwater resources in water abundant areas, inadequate monitoring and audit to check non- revenue water in water utilities causing water theft and rampant corruption at all levels of water service providers. Examples of “water smuggling (such as, development of illegal pipelines, illegal truck deliveries as well as the cooptation of water regulators complicit in licensing fraud and broader government acquiescence to illegal water delivery] and water theft could be found in California, southern Europe, Nigeria, Kenya, the Middle East, and South Asia (Vanda Felbab-Brown, 2015). Water crimes are difficult to estimate. As Jay Bhagwan, executive manager of water use and waste management at the Water Research Commission in South Africa points out regarding water theft, “We don’t have an exact figure… but we estimate that 15% of the losses are due to theft. You get rid of illegal taps and then, overnight, they’re back again. It’s difficult to police” (Savides, M., 2013). Water scarcity due to drought impacts business and economic acitivity and the City of Cape Town (CCT) is an important example of the case where “eighteen of the city’s major tourism businesses have suffered a year-on- year loss of R90 million due to the drought, while visitor-numbers from the UK, France and the Netherlands have dropped by more than 10% due to crime” (https://www.iol.co.za/capeargus/news/drought-and-crime-reduce- tourism-in-city-14392617). Crime rate has worsened during the ongoing drought with mandatory water restrictions put in place since February 2018. This has led to the deployment of “ world’s first water police” force (https://www.globalcitizen.org/en/content/cape-town-worlds-first-water-
  • 18. Global perspective on water scarcity Section - Page | II-17 police/) to tackle illegal water thefts, misuse and wastage of municipal water supplies.
  • 19. Global perspective on water scarcity Section - Page | III-18 Part III. Water Governance in South Africa Water resources in South Africa is made up of its “ecological infrastructure” – consisting of surface water, that is, its rivers and lakes and all subsurface and underground water stored in its aquifers, in soil, rock pores and crevices [WWF2016].. The average rainfall of about 450mm/year compared Figure 5: Drought-affected areas map. Source: National Integrated Drought Monitoring, Department of Water and Sanitation, Republic of South Africa. to the world average of 860 mm/year (WWF-2016, World Bank,2017).makes South Africa one of the 30 driest countries in the world (Wegelin WA et al, 2017). Some of the current challenges hindering water security has been highlighted below. The context of Cape Town city is deliberate in order to address the current drought situation. The section ends with the Singapore city-state’s best practices in water management, focusing on strategies around effective water demand management and water supply governance. ! ! ! ! ! ! ! !! ! ! ! ! ! Durban Bhisho Pretoria Upington Nelspruit Cape Town Kimberley Polokwane Ekurhuleni East London Bloemfontein Port Elizabeth Pietermaritzburg Johannesburg Legend ! Major Towns Province Local Municipalities Moderate Drought Severe Drought Extreme Drought 12 Month - SPI Drought - December 2017 Moderate Severe Extreme Total Settlements EC 1491 139 210 1840 9076 FS 8 0 0 8 321 GT 0 0 0 0 2579 KZN 133 0 0 133 3620 LP 70 0 0 70 2692 MP 0 0 0 0 773 NW 0 0 0 0 1299 NC 5 21 23 49 545 WC 76 206 1048 1330 1597 TOTAL 1783 366 1281 3430 22502 3430 of 22502 Settlements affected by drought
  • 20. Global perspective on water scarcity Section - Page | III-19 Section 3.01 Undiversified water supply 15 billion cubic meters (98%) of the surface water is currently allocated [WWF - SA, 2016] to meet irrigation needs for agriculture [60%], industrial activities [5%], power generation [2.5%], and for municipal demand from urban centers. This is met from “ an integrated system of large dams and inter-basin transfers” [World Bank, 2017]. By 2030, water demand is estimated to be 17.7 billion cubic meters [m3] [WWF-SA, 2016; Madden 2015] due to rising population levels [WWF-SA, 2016; Madden 2015] and surge in economic activity. South Africa shares four of its river basins with other states in the South African Development Community (SADC). The variation in the annual and seasonal flows of these rivers is determined entirely by climatic conditions [Heyns, P. 2003, WWF-SA 2016] making water allocation between the riparian states during droughts a major challenge. River basins in South Africa Shared with other Basin States Incomati & Maputo Mozambique, Swaziland Limpopo Mozambique, Botswana and Zimbabwe Orange Botswana, Lesotho and Namibia Source: Adapted from Heyns P. (2003), Chapter 1: Water-resources management in Southern Africa The reliance on surface water alone, has proved costly for South Africa, particularly for the southern and western regions (Drought - affected areas map: Figure 5), including Cape Town, where a national drought disaster is waiting to inflict impending doom on 4 million of the population of the port city [Reuters, 2018]. Dam storage in South Africa is completely reliant on rainfall and a decreasing trend (Figure 6) in monthly winter rainfall (between 600-800 mm in 2016) has negatively impacted water storage levels. The potential of groundwater development has been largely limited and its usage is unregulated and hence not measured. The non-potable groundwater in Cape Town, for example, is used mainly for garden irrigation (Jacobs et al.,
  • 21. Global perspective on water scarcity Section - Page | III-20 2011] by private home-owners who bear the initial expense to install, operate and maintain a garden borehole or well point [Wright T. et al, 2016]. Water storage in its six major dams 2 stood at record lows (See Table 5), as Cape Town, prepares to face stringent water rationing under mandatory Figure 6: Monthly Rainfall and Dam Storage. Source: National Integrated Drought Monitoring, Department of Water and Sanitation , Republic of South Africa water restrictions imposed by the Department of Water and Sanitation (DWS) on various municipalities throughout the region to lower its water demand . 2 “The capacity of the 6 dams is approximately 900 million m3 (Mm3). The unconstrained system allocation is ~570 Mm3 which provides an unconstrained daily demand of nearly 1,350 MLD to the supply system which includes CCT (City of Cape Town), agriculture and other urban areas. With current restrictions, this has been limited to an annual daily combined average of 680 MLD” (Department of Water & Sanitation, April 2018, page 1)
  • 22. Global perspective on water scarcity Section - Page | III-21 Table 5: Cape Town River System State of Dams on 2018-04-23 Dams Full Storage Capacity in million cubic meters This Week (%) Last Week (%) Last Year (%) Berg River Dam 127.1 36.2 40.5 31.9 Steenbras Dam-Lower 33.9 36.7 38.3 30.2 Steenbras Dam-Upper 31.9 62.9 68.4 51.7 Theewaterskloof Dam 479.3 10.1 10.1 17.7 Voelvlei Dam 158.6 13.7 13.8 19.9 Wemmershoek Dam 58.8 44.9 44.3 36.2 Total 889.3 19.7 20.5 23 Source: Department: Water and Sanitation, Republic of South Africa: Retrieved online http://www.dwa.gov.za/Hydrology/Weekly/RiverSystems.aspx?river=CT The current restriction level is 6B, requiring savings of 45%. For nonresidential customers monthly consumption needs to be reduced by 45% of unconstrained demand while individuals are restricted to 50 litres per capita per day (lcd) and households to 6 kilolitres (kl) per month” (Department of Water & Sanitation,CCT,April 2018). On April 13, 2018, the DWS (Department of Water & Sanitation) , “based on consumption scenarios, the Day Zero dam level was projected at 13.5% beyond July 2018, which would provide 3 months’ worth of water at a reduced volume “supplied of 350MLD” (Department of Water & Sanitation, April 2018, page 1)
  • 23. Global perspective on water scarcity Section - Page | III-22 Section 3.02 Unsustainable water demand and management Figure 6: Per capita water consumption in SA in 2015-16 Source: Department of Water and Sanitation, as quoted in https://africacheck.org/reports/south-africans-guzzle-235-litres-water-per-day/ Note: The per capita numbers quoted in Figure 6 are for 2015/2016. Table 6: Water Demand in Cape Town (Source: DWS: Annexure A: New Water Programme, The Water Outlook, 2018, page1) At an average water use efficiency, defined as per capita water consumption per day, of 237 ℓ/c/d and 234 ℓ/c/d for the Provinces and the WSA (Water Services Authority) [Wegelin WA et al, July 2017], water demand in the region is quite high. The provinces - Guateng, Kwazulu-Natal and Western Cape constitute 66 per cent of the total water demand day [Wegelin WA et al, July 2017]. Cape town reduced its average water demand by 700 million liters on average per day between 2015 to Feb 2018. Water Demand in Cape Town Average water demand Month &Year Million litres per day Feb-15 1200 Feb-16/17 900 Feb-18 500
  • 24. Global perspective on water scarcity Section - Page | III-23 The Department of Water and Sanitation in South Africa recommends a reduction of its per capita water consumption below 200 liters/person/day and align with international benchmarks of 180 liters per capita per day [Wegelin WA et al, July 2017]. Note that liters per capita per day, refers to usage for residential, industrial and commercial purposes, and ignores agriculture. Controlling residential water demand is an important outcome of any successful water conservation strategy. For example, water stressed Singapore has, over the years, used demand management strategies to make the city –state drought resilient in the long run, influencing a reduction in residential water use per capita from 163 liters per capita per day to the current 140 liters per capita per day. Non-revenue water: Water stress is accentuated due to a debilitating physical water infrastructure causing water leaks and water losses from the system. “Water losses for all municipalities, indicate water losses of 1414.49 million m3 /a (35.9%) and NRW (Non-revenue water) of 1632.93 million m3 /a (41.0%) from the 2015/16 water balance” [Wegelin WA et al. July 2017]. Free basic water (6 kilo liters per household per month) and electricity service (50 kwh of electricity per household per month) is provided to identified poor consumers, known as indigent households, billed at zero rates. In 2016, 58% (9 million out of 15 million households) of indigent households received free water service. As per estimates by the NFCM (Non-Financial Census of Municipalities], indigent consumer units 3 receiving free basic water service of rose by 4.2% in 2016 (NFCM,2017) compared to 2015 requiring an urgent need to plug non-revenue water and water losses from the water supply system. While South Africa reels under the current drought learnings from the Millennium Drought in Australia offers some priceless insights into water demand strategies and supply planning during drought (See Web links on Managing Drought: Learning from Australia”- Turner et al 2016). After all, a drought can be “both a crisis and an opportunity to innovate- to roll out new water savings initiatives and incentives to scale, and to leverage community and political will to make needed policy and regulatory changes”.[Turner et al, 2016]. 3 Consumer units not equal to households (NFCM, 2017)
  • 25. Global perspective on water scarcity Section - Page | III-24 Political will is a key driver of significant investments made during drought crisis in the short run and effective water resource management for maintaining water security in the long run. Water resource management in Singapore is a classic case in point. Section 3.03 Water security: Best Practice Case of Urban Water Governance in Singapore With a population of 5 million and no natural water resources to call its own, the water stressed state of Singapore is an exemplar model of water security. The PUB (Public Utilities Board) is the central planning and implementation organization of the entire gamut of institutional, allocation, monitoring and management mechanisms pertaining to water and drainage system of the city-state. Source: PUB (Public Utilities Board), https://www.pub.gov.sg/PublishingImages/Waterloop.png
  • 26. Global perspective on water scarcity Section - Page | III-25 Successful strategies deployed by Singapore include, a) Diversification of the water supply portfolio: The four national taps are: 1. Imported water from Malaysia 2. Rainwater 3. Recycled water 4. Desalinated water 1. Rainwater: Collect every drop (PUB, 2018): Expansion of catchment areas to one-third of all land area to replenish its water reservoirs. (Tortajada, C. and Buurman J, 2017). Rainfall accounts 10 per cent of water supply to the city-state (Lee T.K. and Tortajada C., 2018) Introduce storm water management strategies to include Low Impact Design (LID) design principles such as green roofs, rain gardens in buildings to treat storm water for water quality improvement at source (Lim H. S. and Lu X. X., 2016). 2. Recycled water: Reuse water endlessly (PUB, 2018): “NEWater is a local term for high quality recycled treated waste water. It is supplied both for direct non-potable use (DNPU) to commercial and manufacturing processes that require water and for cooling, and for indirect potable use (IPU) by introducing water into reservoirs for subsequent retreatment at the several water works for drinking purposes” (Tortajada C and Joshi Y., 2013). “Presently, Singapore's five NEWater plants can meet up to 40% of the nation’s current water needs. By 2060, NEWater is expected to meet up to 55% of Singapore’s future water demand” (https://www.pub.gov.sg/watersupply/singaporewaterstory ) 3. Desalinated water (PUB 2018): “Singapore currently uses reverse osmosis for its desalination, which uses about 3.5kWh/m3. There are currently two desalination plants supplying 25% of current water demand in Singapore source. Three more desalination plants are expected to meet up to 30 per cent of Singapore’s water needs by 2060.” https://www.pub.gov.sg/watersupply/fournationaltaps/desalinatedwa ter ) 4. Imported water (PUB, 2018): Under the 1962 water agreement between Singapore and Malaysia, Singapore can draw up to
  • 27. Global perspective on water scarcity Section - Page | III-26 1.1billion litres (250 gallons) of water from the Johor river in Malaysia until 2061. b) Water demand management: Increase in residential water prices in a phased manner (a 30% hike phased over 2 years; the second phase of the price rise is on July 2018) for infrastructure repair and update, water conservation tax to discourage water wastage Stepping up of water conservation efforts in industry- Water Efficiency Index to identify sectors and operations that use the most water (Tortajada, C. et al 2013, Lee T.K. and Tortajada C., 2018) , public outreach and education programmes, provision of water saving kits etc. c) Non-Revenue water management Non-revenue water or water loss at 4.6% is the lowest in the world. Monitoring got smart with the usage of water sensors – data sondes – developed by US-based water tech firm Xylem that report pressure irregularities and other key factors into analytics software to be sent to a central command center by text message and apps (Balch, O 2015) Outcome “Singapore's per capita household water consumption was reduced from 165 liters per day in 2003 to 143 liters in 2017. The target is to lower it to 140 liters by 2030” (PUB 2018). The path ahead: High capital investments in desalination and NEWater sources to meet water demand diversifies water supply sources and adds resilience during dry spells and droughts (PUB, Financial Report 2013/2014). Desalination and used water treatment are energy-intensive and in order to reduce its carbon footprint, PUB has leveraged on massive investments in research and development for energy efficient technologies.
  • 28. Global perspective on water scarcity Section - Page | IV-27 Part IV. The Way Forward The ongoing drought in CCT has changed its residents’ relationship with water. While the city scrambles to augment its water supply from its groundwater aquifers, shutting down irrigation supplies, increase in water tarrifs, mandatory rationing of water consumption and policing of water wastage for all its residents, the government officials realize the need for a paradigm shift in water management. “The security of water resources necessitates a departure from the status quo, to an innovative system that is able to understand and appreciate how different natural, policy, and political variables interact and affect each other” (Tortajada and Fernandez,2018). Distilling some of the best practices in drought management and water governance practices from Singapore, Australia, California and European cases, the report through a global perspective on water scarcity hints at the urgency to address drought monitoring and preparedness into all short run and long run water management policies to restore water security in the City of Cape Town. “One of the cornerstones of proactive drought management is the establishment of a drought policy and a drought management plan which should address the whole drought management cycle (monitoring– impact assessment–response–recovery–preparedness) and help to improve decision-making processes in drought management” (Bokal S. et. al. 2018) In the short run while water conservation and nudging citizens to consume less water remains a proven successful water demand management strategy in countries like Singapore, Australia and California; the current drought in CCT has brought into light the perils of relying on a single “tap” (surface water from reservoirs) for water supply - which is entirely dependent on rainfall. The time is ripe to incorporate a diverse water portfolio to augment water supply by reusing wastewater, desalination and groundwater effectively for meeting municipal water demand. Best practices illustrate that this could be effectively implemented, by implementing innovations in desalination and waste water technologies that minimize energy usage and effluent discharges, integrating leak detection technology in the water supply network and regular, timely maintenance of water infrastructure and involving stakeholder participation at all levels – agriculture, industry, rural as well as urban consumer in water conservation.
  • 29. Global perspective on water scarcity Section - Page | IV-28 Appendix 4.1: Web-sources and Links to Drought Management practices: Publication/Source name and link Summary and Link Integrated Drought Management in Central and Eastern Europe: Compendium of Good Practices. Link: https://reliefweb.int/sites/reliefweb.int/files/reso urces/idmp-cee_compendium_en.pdf Summary: This Compendium is the final publication of the first phase of the GWP/WMO Integrated Drought Management Programme in Central and Eastern Europe (hereafter IDMP CEE). It provides an overview of the programme’ outputs and accomplishments achieved in the period from 2013 to 2015.The Programme’s main goal is to increase the capacity of the CEE region to adapt to climatic variability by enhancing resilience to drought. Cambareri, Grace, “Robust Drought Planning in Megacities: A Case Study in Sao Paulo, Brazil”. Link https://scholarworks.umass.edu/cgi/viewco ntent.cgi?article=1083&context=cee_ewre Abstract: The megacity of São Paulo, Brazil recently faced a severe three-year drought (2013- 2015) that highlighted the challenges of growing water demands, unpredictability of future supply, and proper communication with the public during crisis. Given the poor outcomes of the recent drought, the question remains as to how the drought can be used to inform and improve future drought preparedness. This study develops a seven- step framework using simulation and a
  • 30. Global perspective on water scarcity Section - Page | IV-29 computational search to identify promising drought plans based on the historic record. These promising plans are then tested under alternative states of the world to explore their robustness and identify regions of vulnerability. While the resulting drought plans are dependent on many assumptions regarding system operations, performance preferences, and future conditions, the process can be used by managers with knowledge of the system in collaboration with stakeholders to identify drought plans that will result in better outcomes. Andrea Turner, Stuart White, Joanne Chong, Mary Ann Dickinson, Heather Cooley, and Kristina Donnelly, “Managing Drought: Learning from Australia.” http://pacinst.org/wp- content/uploads/2016/07/Managing- Drought-Report-2016-02-23-FINAL-US- Letter.pdf “The impact of the Australian Millennium Drought on urban water supplies varied widely across the country due to differing climates, water supply systems and policy responses. Different stakeholders also experienced the drought in different ways. This summary, and the background material on which it is based, represent one interpretation of the drought and responses to it. It is an interpretation that is informed by significant engagement with utilities and governments throughout that period, and a close working knowledge of the relevant water systems and policy environments.”
  • 31. Global perspective on water scarcity Section - Page | V-30 Part V. Reference 1. “Theft and leaks are draining SA’s water”, by Matthew Savides, 23 June 2013, The Sunday Times. Retrieved online http://www.pressreader.com/south-africa/sunday- times/20130623/281788511631838/TextView 2. Alexandratos, N. and Bruinsma, J. 2012. World Agriculture Towards 2030/2050: The 2012 Revision. ESA Working paper No. 12-03. Rome, Food and Agriculture Organization of the United Nations (FAO). www.fao.org/docrep/016/ap106e/ap106e.pdf 3. Arjen Y Hoekstra and Joost Buurman . 2018. Urban water security: A review. Environmental Research Letters. In press https://doi.org/10.1088/1748-9326/aaba52 4. Arjen Y. Hoekstra. 2018. How to reduce our water footprint to a Sustainable level? Vol LV , No. 1, 2018. March 2018. Retrieved online April 18, 2018 https://unchronicle.un.org/article/how- reduce-our-water-footprint-sustainable-level 5. Balch Oliver. 2015. “Singapore gets smart about water”,, 18 March, 2015, The Guardian, Retrieved online https://www.theguardian.com/sustainable- business/2015/mar/18/smart-water-solutions-singapore- newater-vertical-farming 6. Biswas A. and Tortajada Cecilia on Policy Forum. Feb 22, 2018, “Tightening the Taps Cape Towns Water Crisis” https://www.policyforum.net/tightening-the-taps-cape-towns- water-crisis/ 7. Biswas A. and Tortajada Cecilia on Policy Forum. Feb 22,2018, https://www.policyforum.net/tightening-the-taps-cape-towns- water-crisis/ 8. Bokal S. and Richar Muller (2018). Integrated Drought Management in Central and Eastern Europe. WMO (World Metereological Organization) Bulletin, Special Issue on Water, Volume (67) 1- 2018, page 60-64.
  • 32. Global perspective on water scarcity Section - Page | V-31 9. Cairncross S, Cliff JL (1987) Water use and health in Mueda, Mozambique. Trans R Soc Trop Med Hyg 81: 51–54. PMID: 3445322. 10. De Souza, Agnieszka and Hayley Warren.2018. “ Climate Change is messing with your Dinner.” April 13, 2018. Retrieved online https://www.bloomberg.com/graphics/2018-climate-crops 11. FAO, IFAD, UNICEF, WFP and WHO. 2017. The State of Food Security and Nutrition in the World 2017. Building resilience for peace and food security.
Rome, FAO. 12. Fischedick M., J. Roy, A. Abdel-Aziz, A. Acquaye, J. M. Allwood, J.-P. Ceron, Y. Geng, H. Kheshgi, A. Lanza, D. Perczyk, L. Price, E. Santalla, C. Sheinbaum, and K. Tanaka, 2014: Industry. In: Climate Change 2014: Mitigation of Climate Change. Contri- bution of Working Group III to the Fifth Assessment Report of the Intergovernmental Panel on Climate Change [Edenhofer, O., R. Pichs-Madruga, Y. Sokona, E. Farahani, S. Kadner, K. Seyboth, A. Adler, I. Baum, S. Brunner, P. Eickemeier, B. Kriemann, J. Savolainen, S. Schlömer, C. von Stechow, T. Zwickel and J.C. Minx (eds.)]. Cambridge University Press, Cambridge, United Kingdom and New York, NY, USA. 13. Gassert, F., P. Reig, T. Luo, and A. Maddocks. 2013. “Aqueduct country and river basin rankings: a weighted aggregation of spatially distinct hydrological indicators.” Working paper. Washington, DC: World Resources Institute, November 2013. Available online at http://wri.org/publication/aqueduct-country-river-basin- rankings. 14. GBD 2016, SDG collaborators.2017. Measuring progress and projecting attainment on the basis of past trends of the health- related Sustainable Development Goals in 188 countries: an analysis from the Global Burden of Disease Study 2016. Lancet 2017, September 16page 1434-1437. doi: 10.1016/S0140- 6736(17)32336-X. Epub 2017 Sep 12. 15. Gleick Peter H. 1989. The implications of Global Climatic Changes for International Security. Climatic Change 15: 309- 325. 1989

  • 33. Global perspective on water scarcity Section - Page | V-32 16. Global Risks. 2014. Ninth Edition. Published by the World Economic Forum. Accessed Online http://www3.weforum.org/docs/WEF_GlobalRisks_Report_2014 .pdf 17. Gopolang Makou, Does South Africa guzzle 235 litres of water per person daily?, 11 April, 2018. Retrieved online https://africacheck.org/reports/south-africans-guzzle-235-litres- water-per-day/ 18. Graham J.P., Mitsuaki Hirai and Seung-Sup Kim. 2016. An Analysis of Water Collection Labor among Women and Children in 24 Sub-Saharan African Countries. PLoS ONE , June 1, 2016; DOI:10.1371/journal.pone.0155981. 19. GWP (2000) Towards water security: A framework for action, Global Water Partnership, Sweden, Stockholm. 20. Heyns P. (2003) Book : International Waters in Southern Africa edited by Mikiyasu Nakayama.Piet Heyn. 2003. Chapter 1: Water-resources management in Southern Africa. United Nations University Press.Retrieved online http://archive.unu.edu/unupress/sample- chapters/InternationalWaters.pdf 21. Howard G, Bartram J (2003) Domestic water quantity, service levels and health. Geneva: WHO. 22. http://www.inceconnect.co.za/article/helen-zille-from-the-inside- day-zero-memes-and-myths-abound-ndash-let-rsquo-s-get- back-to-essentials 23. http://www.un.org/millenniumgoals/pdf/(2011_E)%20MDG%20R eport%202011_Book%20LR.pdf 24. INTERPOL. (2016). Strategic report. Environment, peace and security. A convergence of threats. Retrieved from https://europa.eu/capacity4dev/unep/document/stra tegic- report-environment-peace-and-security-conver- gence-threats/ 25. Jacobs HE. Wright T, Loubser C, Du Plessis JA and Kock J. 2011. Strategic assessment of household on-site water as supplementary resource to potable municipal supply - current trends and future needs. WRC Report No. 1819/1/10. Water Research Commission, Pretoria
  • 34. Global perspective on water scarcity Section - Page | V-33 26. Kumari Rigaud, Kanta, Alex de Sherbinin, Bryan Jones, Jonas Bergmann, Viviane Clement, Kayly Ober, Jacob Schewe, Susana Adamo, Brent McCusker, Silke Heuser, and Amelia Midgley.(2018). Groundswell: Preparing for Internal Climate Migration. Washington, DC: The World Bank. Retrieved Online. 27. Lee Tommy Kevin and Cecilia Tortajada. 2017. “Can Singapore build a better environment?” 6 December , 2017. Retrieved Online https://www.policyforum.net/singapore-environment/ 28. Lim H.S. and X. X. Lu. 2016. Sustainable urban stormwater management in the tropics: An evaluation of Singapore’s ABC Waters Program. Journal of Hydrology 538 (2016) 842-862. 29. Luker E. & Lucy Rodina. 2017. The Future of Drought Management for Cape Town: Summary for Policy Makers. Policy Brief. June 15, 2017. Institute for Resources, Environment and Sustainability, University of British Columbia, Vancouver, Canada. Retrieved online http://edges.sites.olt.ubc.ca/files/2017/06/The-Future-of- Drought-Management-for-Cape-Town-Summary-for-Policy- Makers.pdf 30. Luo, T., R. Young, and P. Reig. 2015. "Aqueduct projected water stress rankings." Technical note. Washington, DC: World Resources Institute, August 215. Available online at http://www.wri.org/publication/aqueduct-projected-water-stress- country-rankings. 31. Madden K. (2015). Perspectives on Green Growth Partnerships: Strategic Water Partners Network South Africa. 2030 Water Resources Group, 32. Maddocks A. 2014. “Water Stress Magnifies Drought’s Negative Impacts throughout the United States.” April 14, 2014. World Resources Institute Blog. Available at http://www.wri.org/blog/2014/04/water-stress-magnifies- drought%E2%80%99s-negative-impacts-throughout-united- states 33. Mancosu N., Richard L. Snyder, Gavriil Kyriakakis and Donatello Spano . 2015. Water Scarcity and Future Challenges for Food Production. Water 2015, 7(3), 975- 992; https://doi.org/10.3390/w7030975
  • 35. Global perspective on water scarcity Section - Page | V-34 34. Maxmen, Amy. 2018. “As Cape Town water crisis deepens, scientists prepare for ‘Day Zero” by Amy Maxmen, 24 jan 2018, Nature 554, 13-14 (2018) doi: 10.1038/d41586-018-01134-x https://www.nature.com/articles/d41586-018-01134-x 35. Nygren BL, O'Reilly CE, Rajasingham A, Omore R, Ombok M, Awuor AO, et al. (2016) The Relationship Between Distance to Water Source and Moderate-to-Severe Diarrhea in the Global Enterics MultiCenter Study in Kenya, 2008–2011. The American Journal of Tropical Medicine and Hygiene: 15– 0393. 36. OECD (Organisation for Economic Co-operation and Development). 2012. OECD Environmental Outlook to 2050: The Consequences of Inaction. Paris, OECD Publishing; https://doi.org/10.1787/9789264122246-en 37. On the record: “Water Crimes: A Global crisis on the rise.” By Vanda Felbab-Brown, Feb 20, 2015. https://www.brookings.edu/on-the-record/water-crimes-a-global- crisis-on-the-rise/ 38. Pickering AJ, Davis J (2012) Freshwater availability and water fetching distance affect child health in sub-Saharan Africa. Environmental Science and Technology 46: 2391–2397. doi: 10.1021/es203177v PMID: 22242546. 39. PUB (Public Utilities Board). 2013/2014. A Fine Balance. PUB Financial Report 2013/2014. Retrieved online https://www.pub.gov.sg/annualreports/financialreport2014.pdf 40. PUB (Public Utilities Board). 2018. Accessed Online (https://www.pub.gov.sg/watersupply/singaporewaterstory ) 41. Reuters. 2018. South Africa declares drought a national disaster, by Reuters Staff, February 13, 2018. Retrieved online https://www.reuters.com/article/us-safrica-drought- dayzero/south-africa-declares-drought-a-national-disaster- idUSKBN1FX1BI 42. Rockstrom, J., M. Falkenmark, T. Allan, C. Folke, L. Gordon, A. Jagerskog, M. Kummu, M. Lannerstad, M. Meybeck, D. Moldne, S. Postel, H. H. G. Savenijie, U. Svedin, A. Turton and O. Varis. [2014]. The unfolding water drama in the Anthropocene : towards a resilience-based perspective on water for global
  • 36. Global perspective on water scarcity Section - Page | V-35 sustainability. EcoHydrology, 7, 1249-1261(2014). DOI: 10.1002/eco.1562 43. Sadoff , Claudia W., Edoardo Borgomeo, and Dominick de Waal. 2017. Turbulent Waters: Pursuing Water Security in Fragile Contexts. Washington, DC, World Bank. 44. Sen, A.K. Rationality and Freedom: Oxford University Press, New Delhi, 2002. 45. Suter, M. 2017. Running out of Water: Conflict and Water scarcity in Yemen and Syria”, Sept 12, 2017, http://www.atlanticcouncil.org/blogs/menasource/running-out-of- water-conflict-and-water-scarcity-in-yemen-and-syria 46. The European Report on Water Crimes. 2017. The Regional Environmental Centre for Central and Eastern Europe. www.watercrimes.eu 47. The Global Risks Report 2017, 12th Edition, published by the World Economic Forum within the framework of the The Global Competitiveness and Risks Team. Accessed http://www3.weforum.org/docs/GRR17_Report_web.pdf 48. The Global Risks Report 2018, 13th Edition, published by the World Economic Forum. Accessed http://www3.weforum.org/docs/WEF_GRR18_Report.pdf 49. The Millennium Development Goals Report 2011, United Nations. Retrieved online 50. Tortajada C. and Asit Biswas . 2015. “The top global risk – water”. January 31, 2015, The Straits Times. Singapore. https://www.straitstimes.com/opinion/the-top-global-risk-water 51. Tortajada C. and Joost Buurman. July 2017. Water Policy in Singapore. Global-Is-Asian magazine. Retrieved online http://global-is-asian.nus.edu.sg/wp- content/uploads/2017/07/Water-Policy-in-Singapore-graphics- 3.pdf 52. Tortajada C. and Victor Fernandez. 2018. Chapter in Book: “Towards Global Water Security: A Departure from the Status Quo?”, February 2018. DOI: 10.1007/978-981-10-7913-9_1. Publisher: Springer Nature, Editors: World Water Council, pp.1- 19.
  • 37. Global perspective on water scarcity Section - Page | V-36 53. Tortajada, C. , Joshi Y., Biswas, A. K. [2013) .The Singapore water story: Sustainable development in an urban city-state, Routledge, Oxford, UK. 54. Turner, A., White, S., Chong, J., Dickinson, M.A., Cooley, H. and Donnelly, K. 2016. Managing drought: Learning from Australia, prepared by the Alliance for Water Efficiency, the Institute for Sustainable Futures, University of Technology Sydney and the Pacific Institute for the Metropolitan Water District of Southern California, the San Francisco Public Utilities Commission and the Water Research Foundation. 55. UNCCD. 2014. Desertification. The Invisible Frontline. Retrieved online http://www.droughtmanagement.info/literature/UNCCD_desertifi cation_the_invisible_frontline_2014.pdf 56. UNU (United Nations University). 2013. Water Security & the Global Water Agenda. A UN – Water Analytical Brief. UNU- INWEH. 57. Veldkamp, T. I. E., Wada, Y., Aerts, J. C. J. H., Döll, P., Gosling, S. N., Liu, J., Masaki, Y., Oki, T., Ostberg, S., Pokhrel, Y., Satoh, Y. and Ward, P. J. 2017. Water scarcity hotspots travel downstream due to human interventions in the 20th and 21st century. Nature Communications, No. 15697. https://doi.org/10.1038/ncomms15697 58. Water Aid. 2018. The Water Gap- The State of the World’s Water 2018. Retrieved online https://washmatters.wateraid.org/sites/g/files/jkxoof256/files/The %20Water%20Gap%20State%20of%20Water%20report%20lr %20pages.pdf 59. Water efficiency policy: A technological high water mark? By Tommy Kevin Lee, Cecilia Tortajada by 12 February, 2018. Retrieved online https://www.policyforum.net/water-efficiency- policy-technological-high-water-mark/ 60. Water Outlook 2018 Report. 2018. Revision 24- Updated 17 April 2018, Produced by Department of Water and Sanitation. City of Cape Town. http://resource.capetown.gov.za/documentcentre/Documents/Ci
  • 38. Global perspective on water scarcity Section - Page | V-37 ty%20research%20reports%20and%20review/Water%20Outloo k%202018%20-%20Summary.pdf 61. Wegelin, WA, T Godzwana, S Barnard. 2017. Benchmarking of Water Loss, Water Use Efficiency and Non-Revenue Water in South African Municipalities (2004/05 to 2015/16). July 2017. Prepared by Business Intelligence Support Team, Department of Water and Sanitation. Directorate: Water Services Macro Planning. Republic of South Africa. 62. WHO - JMP and UNICEF. 2017. Progress on drinking water, sanitation and hygiene: 2017 update and SDG baselines. Geneva: World Health Organization (WHO) and the United Nations Children’s Fund (UNICEF), 2017. Licence: CC BY-NC- SA 3.0 IGO. 63. World Bank .2017. “Modeling the Water-Energy Nexus: How Do Water Constraints Affect Energy Planning in South Africa?“ World Bank, Washington, DC. 64. World Bank. 2017. Beyond Scarcity: Water Security in the Middle East and North Africa. MENA Development Series. World Bank, Washington, DC. License: Creative Commons Attribution CC BY 3.0 IGO 65. World Bank. 2018. “Water Scarce Cities: Thriving in a Finite World.” World Bank, Washington, DC. 66. Wright T. and HE Jacobs. 2016. Potable Water Use of residential consumers in the Cape Town metropolitan area with access to groundwater as a supplementary household water source. Water SA vol. 42, n.1, Pretoria, January 2016. http://dx.doi.org/10.4314/wsa.v42i1.14 . Retrieved online http://www.scielo.org.za/scielo.php?script=sci_arttext&pid=S181 6-79502016000100014 67. WWAP (United Nations World Water Assessment Programme) / UN – Water. 2018. The United Nations World Water Development Report 2018 : Nature-Based Solutions for Water. Paris, UNESCO. 68. WWAP (United Nations World Water Assessment Programme). 2016. The United Nations World Water Development Report 2016: Water and Jobs. Paris, UNESCO.
  • 39. Global perspective on water scarcity Section - Page | V-38 69. WWAP (United Nations World Water Assessment Programme). 2017. The United Nations World Water Development Report 2017: Wastewater, The Untapped Resource. Paris, UNESCO." 70. WWF – SA (World Wildlife Fund – South Africa) 2016.. “Water: Facts and Futures. Rethinking South Africa’s Water Future”. Published by WWF-SA, Cape Town, South Africa 71. WWF-SA (World Wild Life Fund- South Africa). 2016. Water: Facts & Futures. Published May 2016 by WWF-SA, Cape Town, South Africa.